
Effect of Surface Copper Species on NO + CO Reaction over xCuO-Ce0.9Zr0.1O2 Catalysts: In Situ DRIFTS Studies


Abstract
:
1. Introduction
2. Results and Discussion
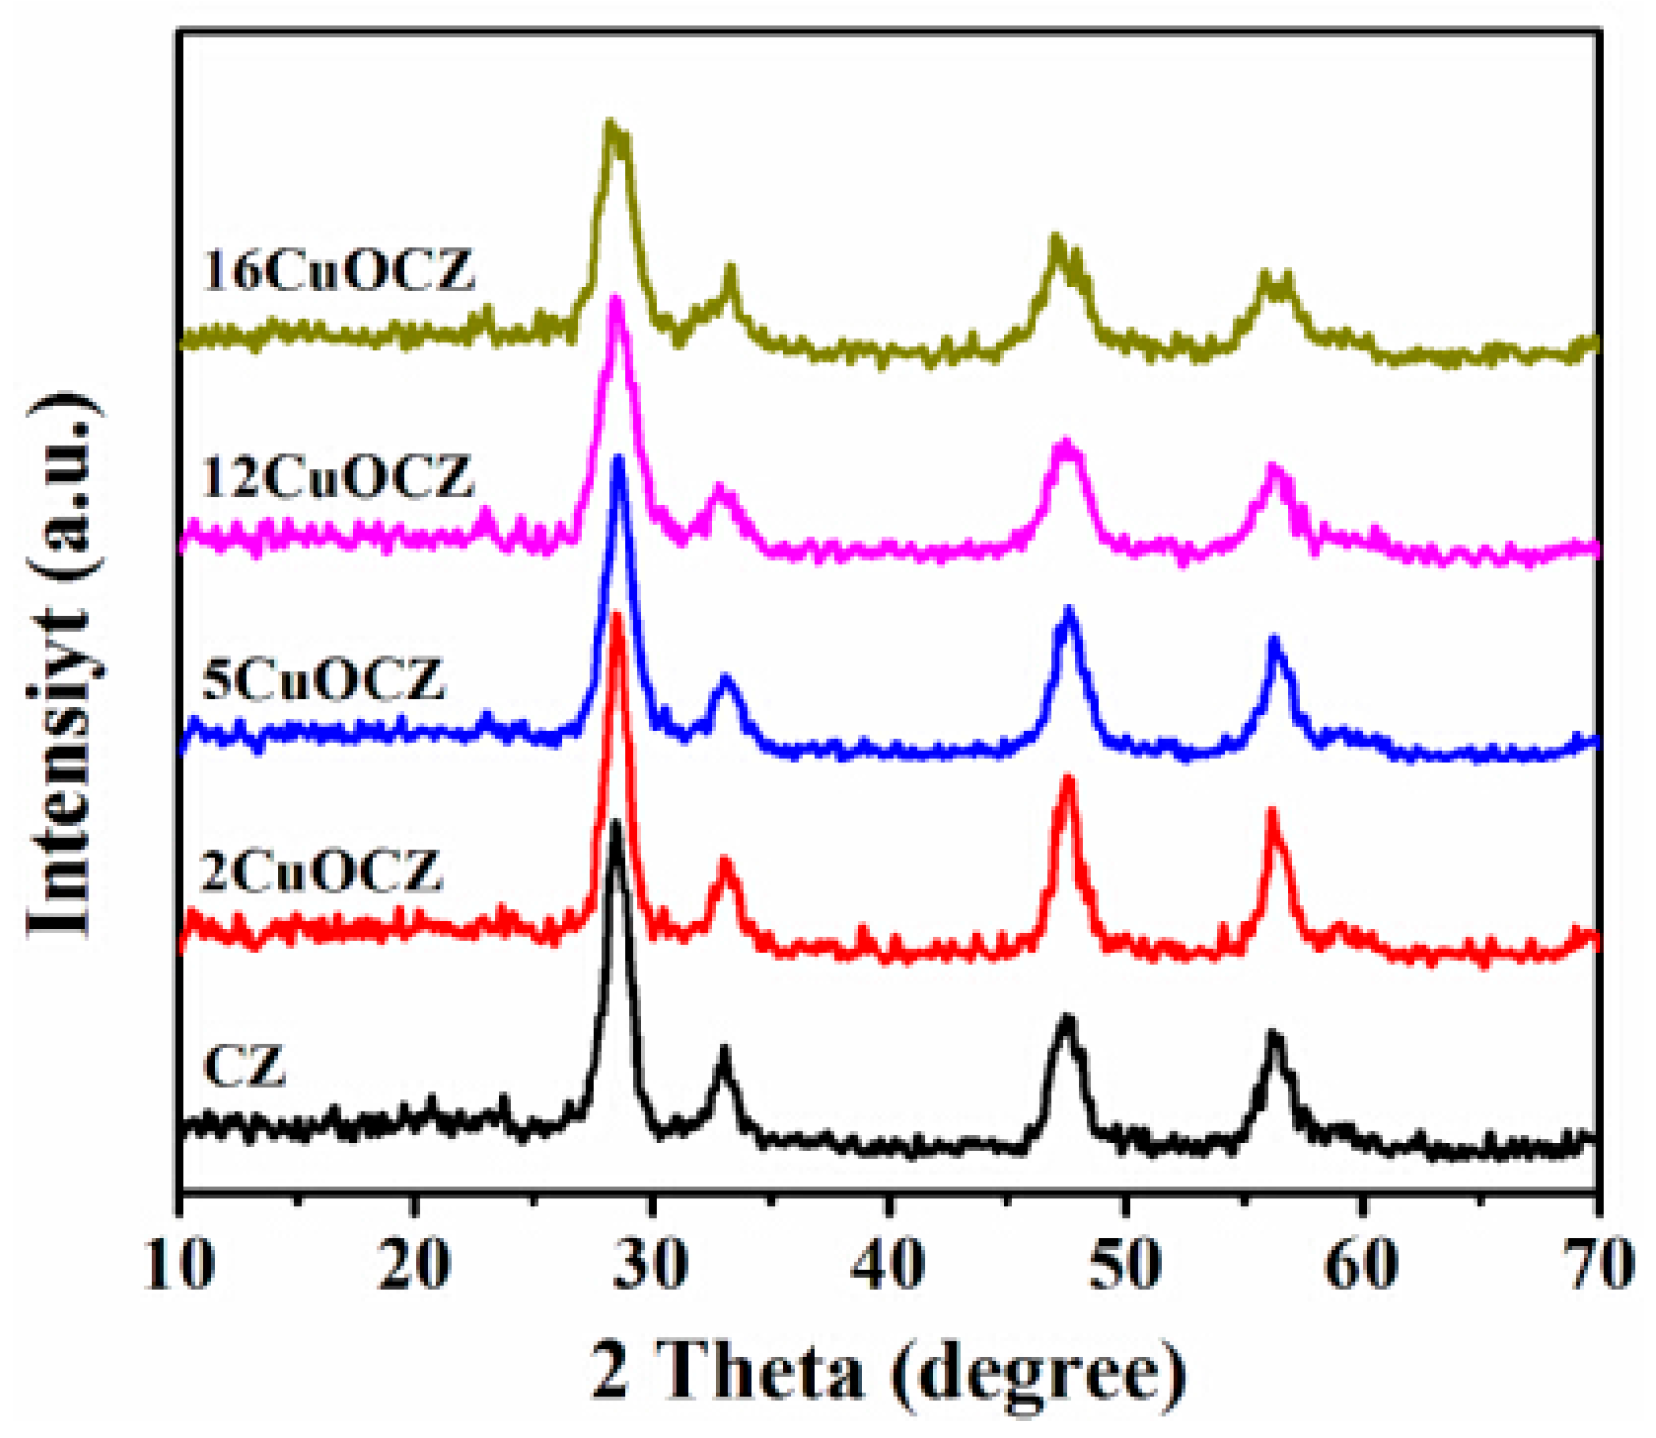
2.1. XRD Studies
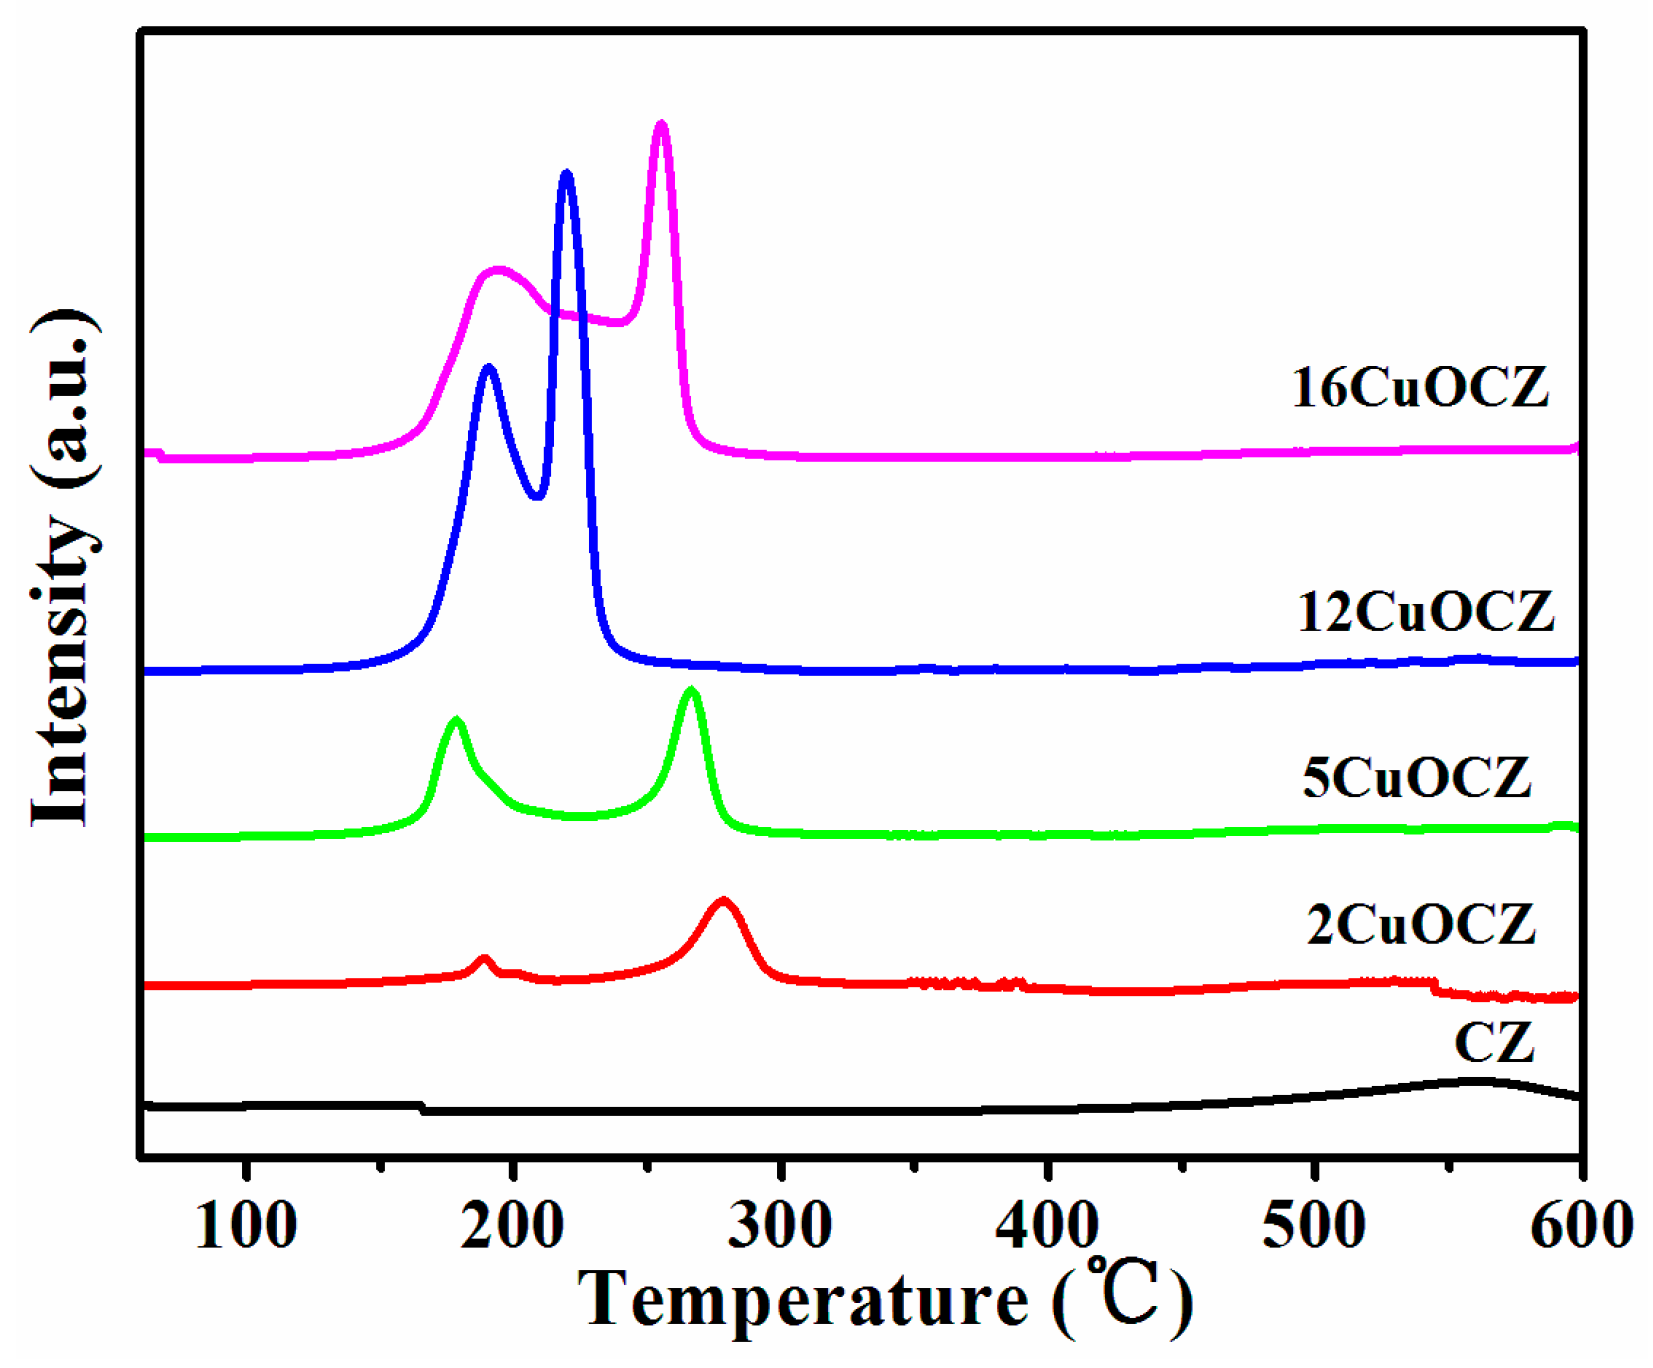
2.2. H2-TPR Studies
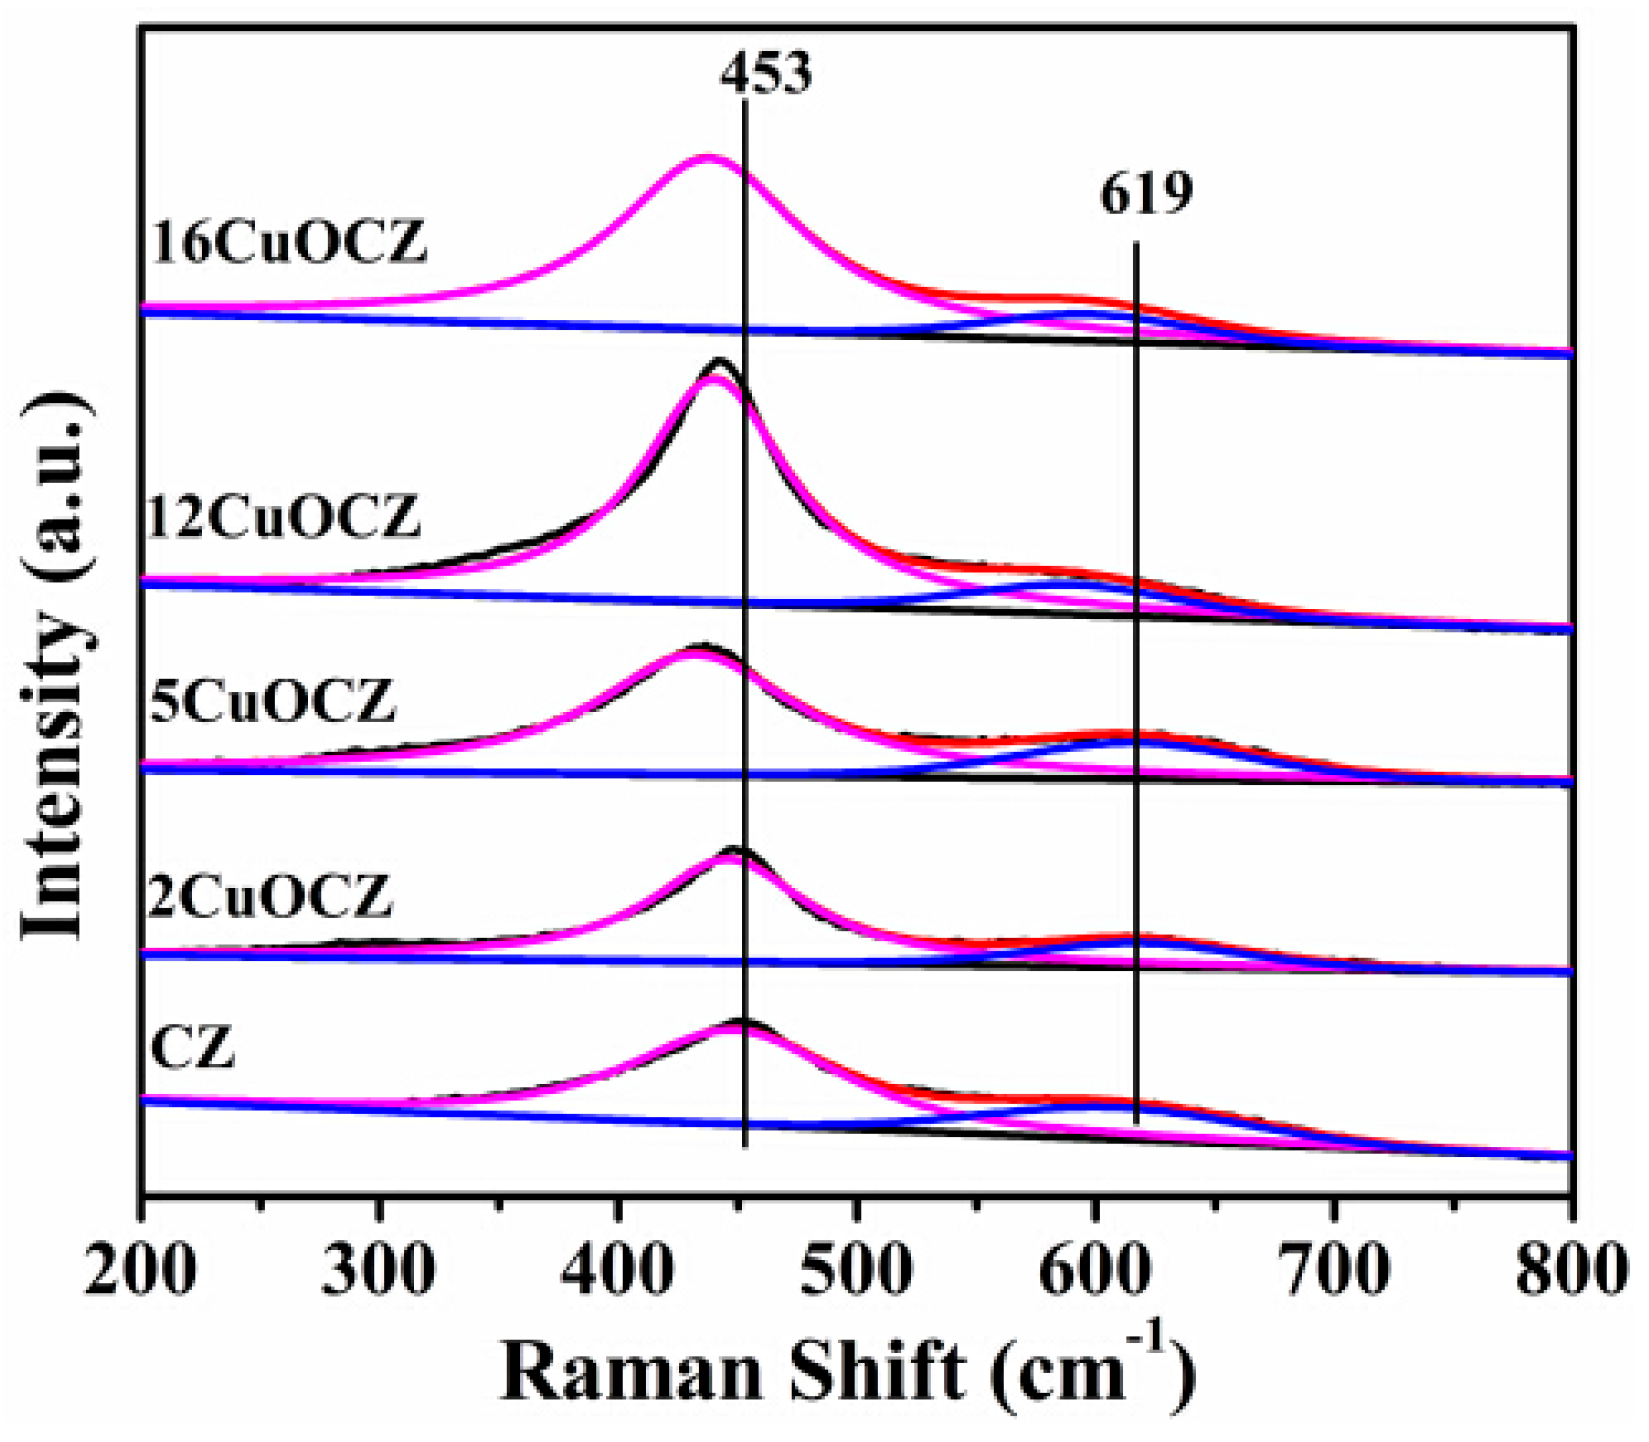
2.3. Raman Spectra Studies
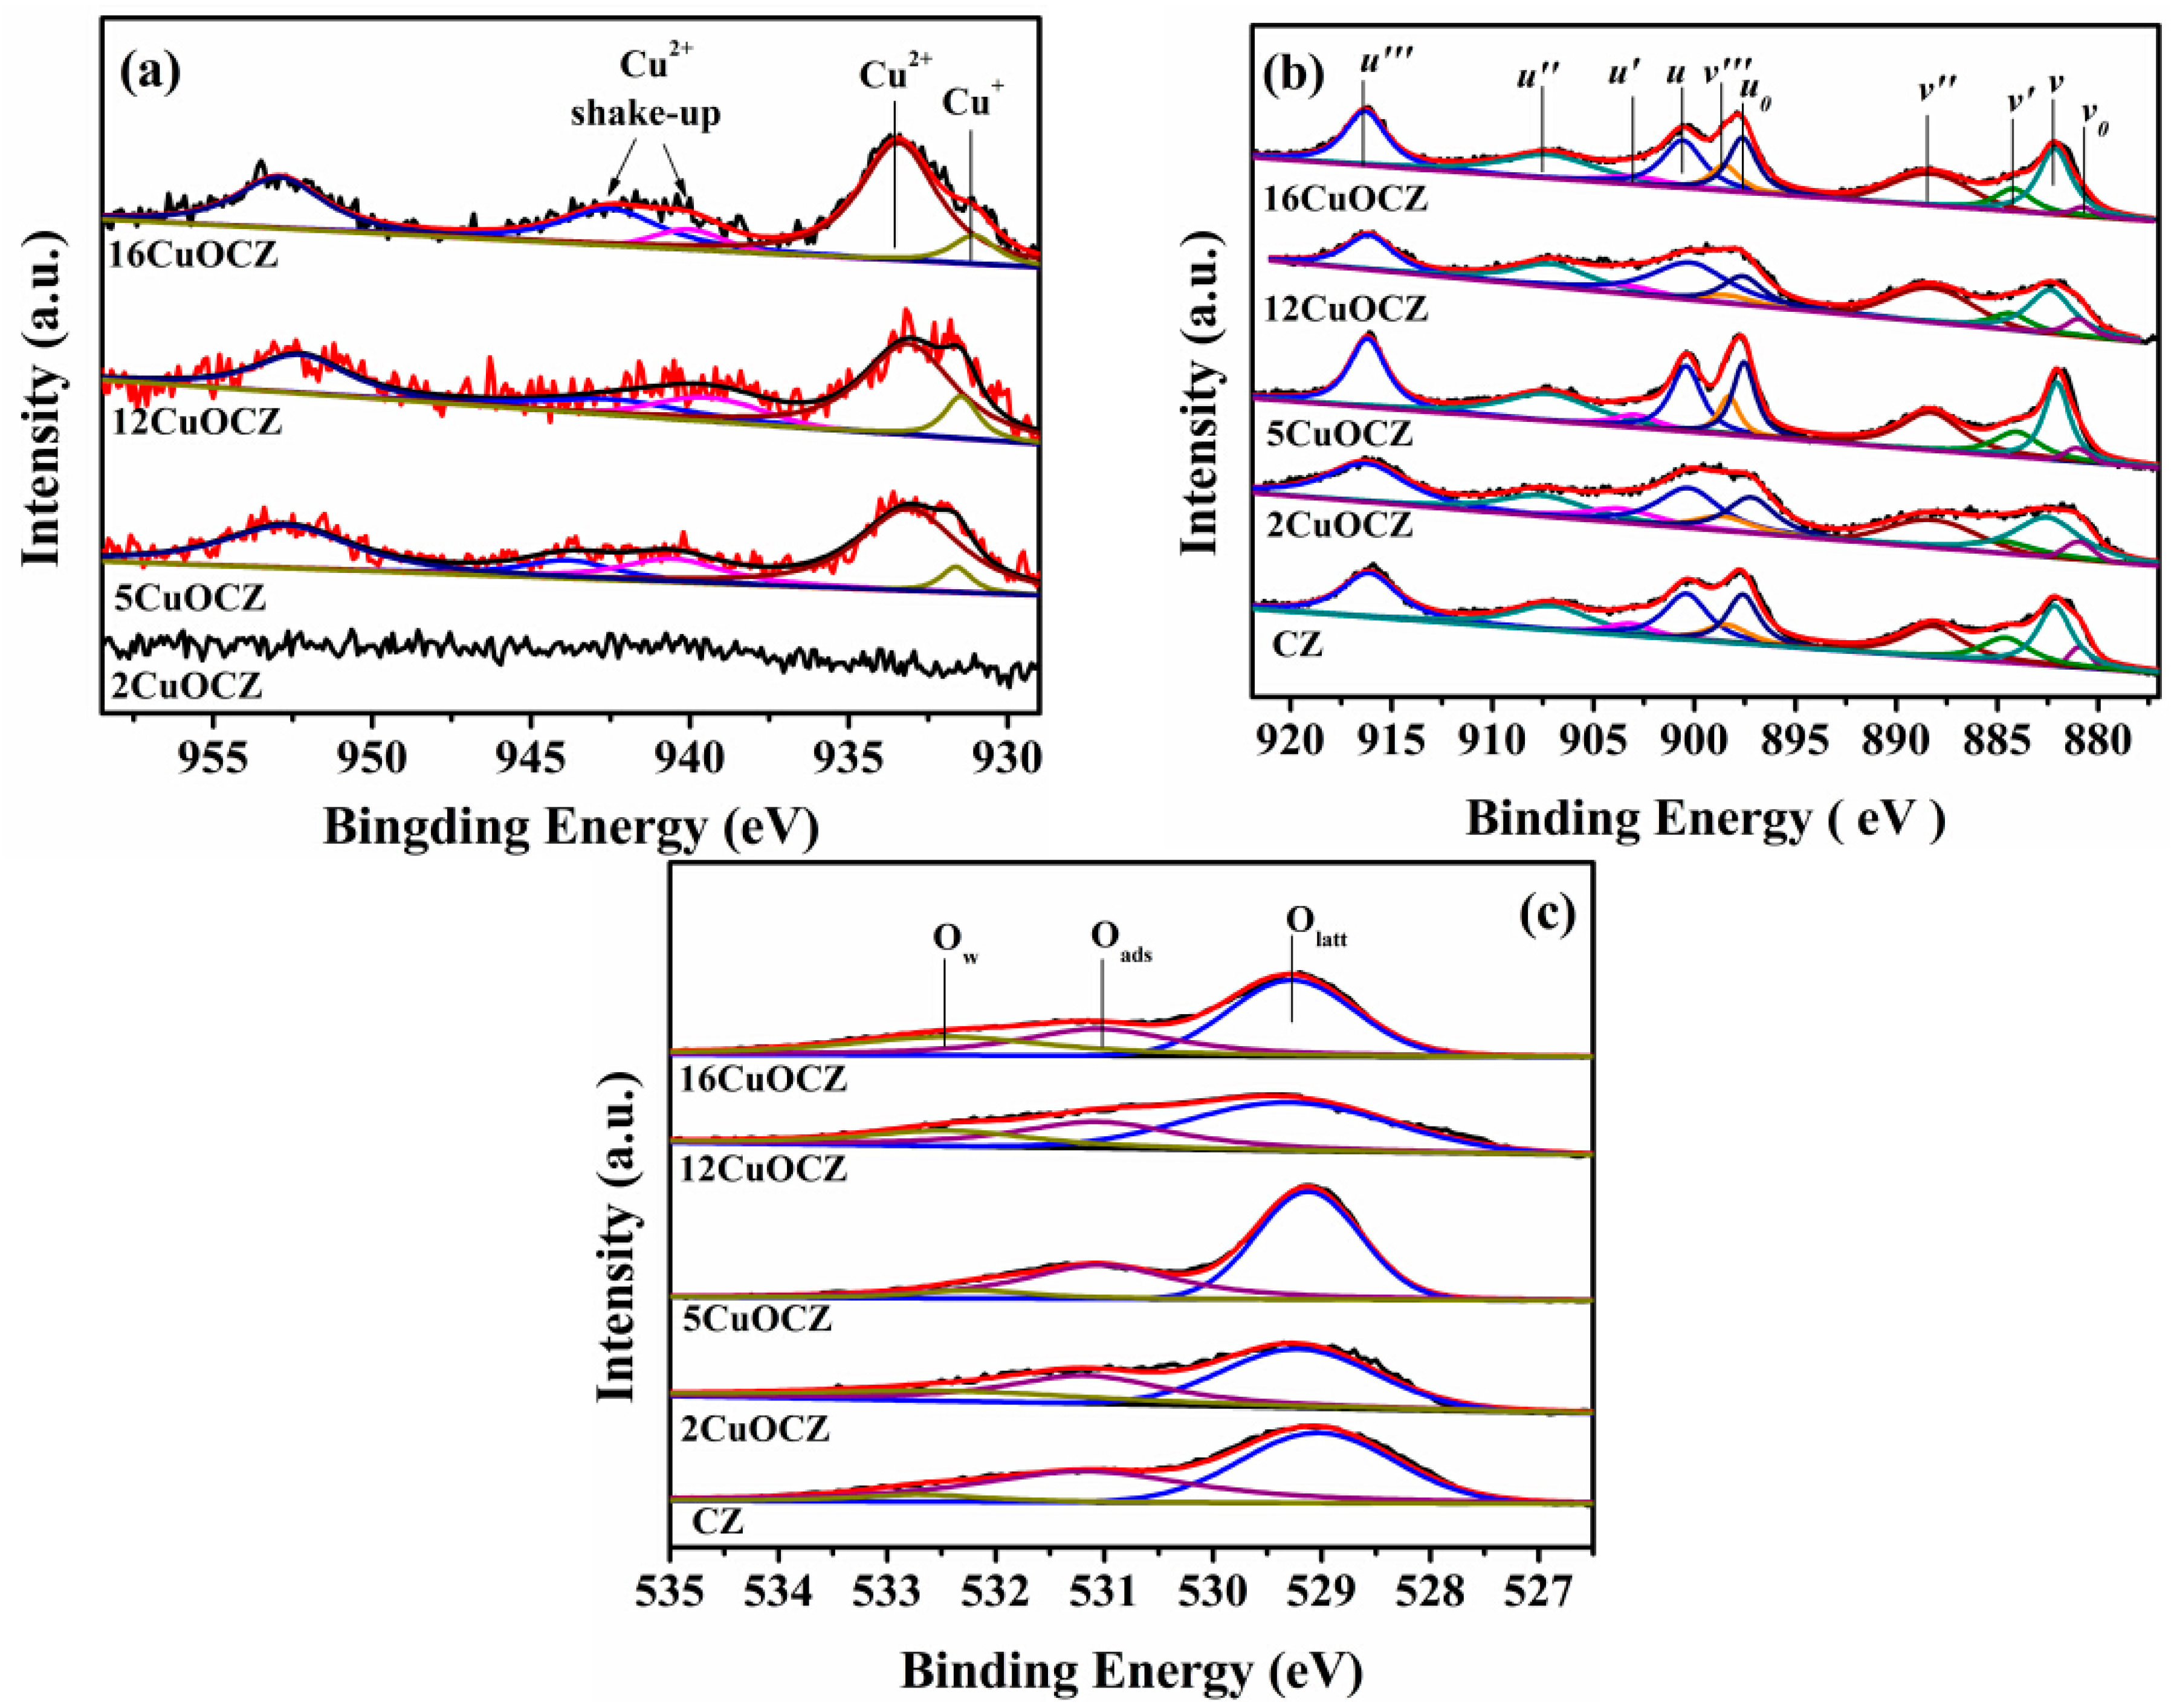
2.4. XPS Studies
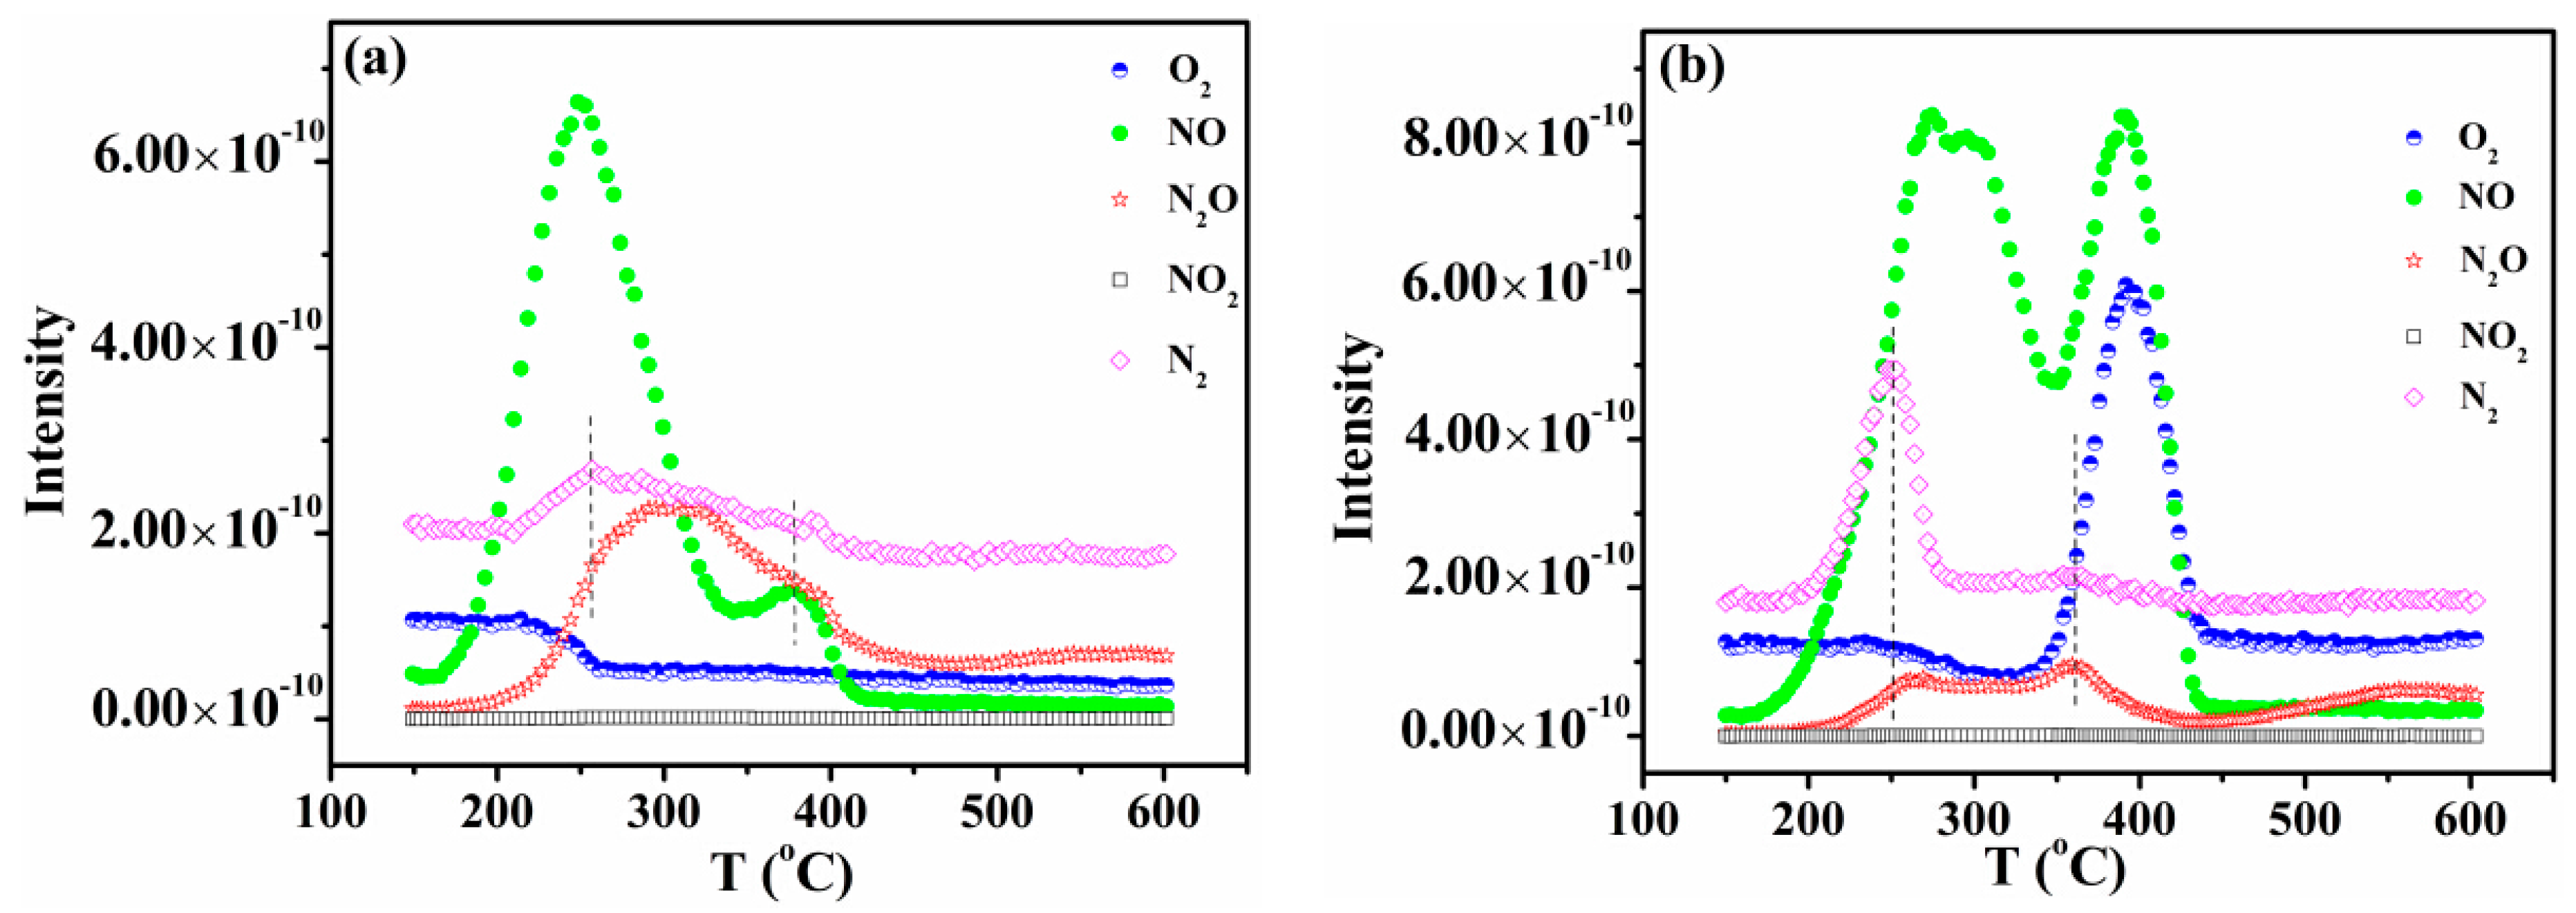
2.5. NO-TPD Studies
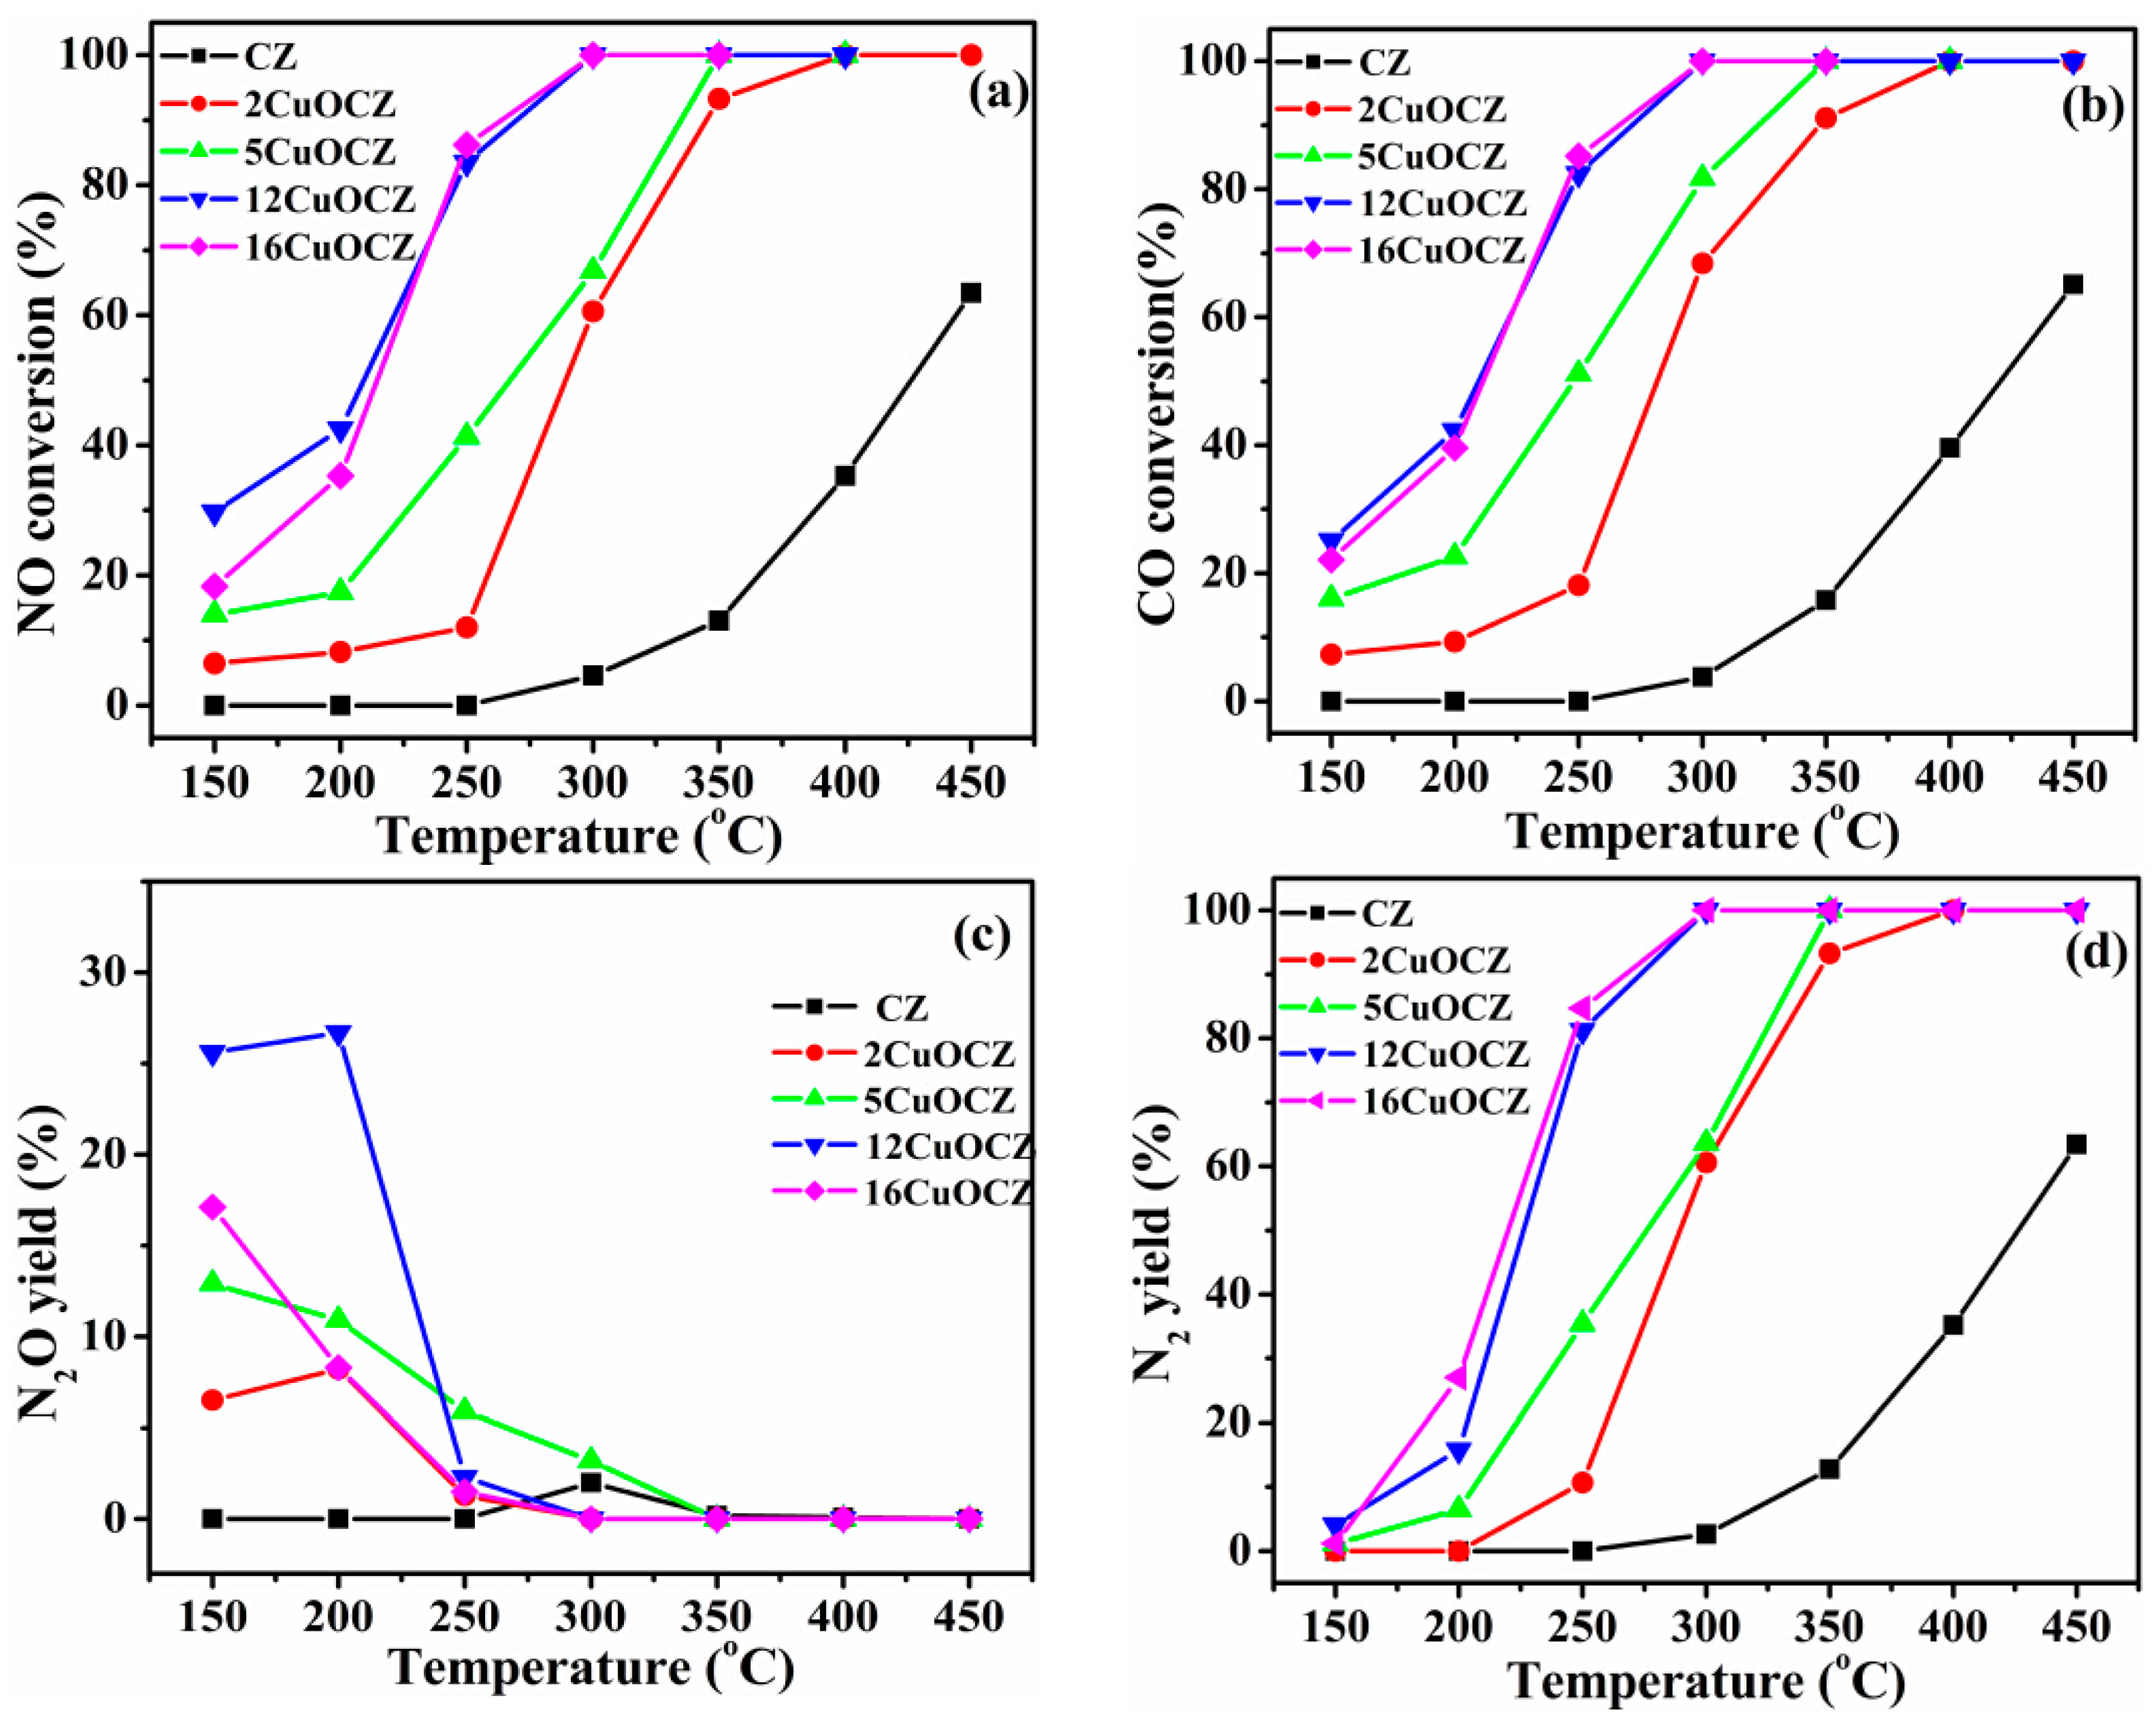
2.6. Catalytic Activity of NO + CO
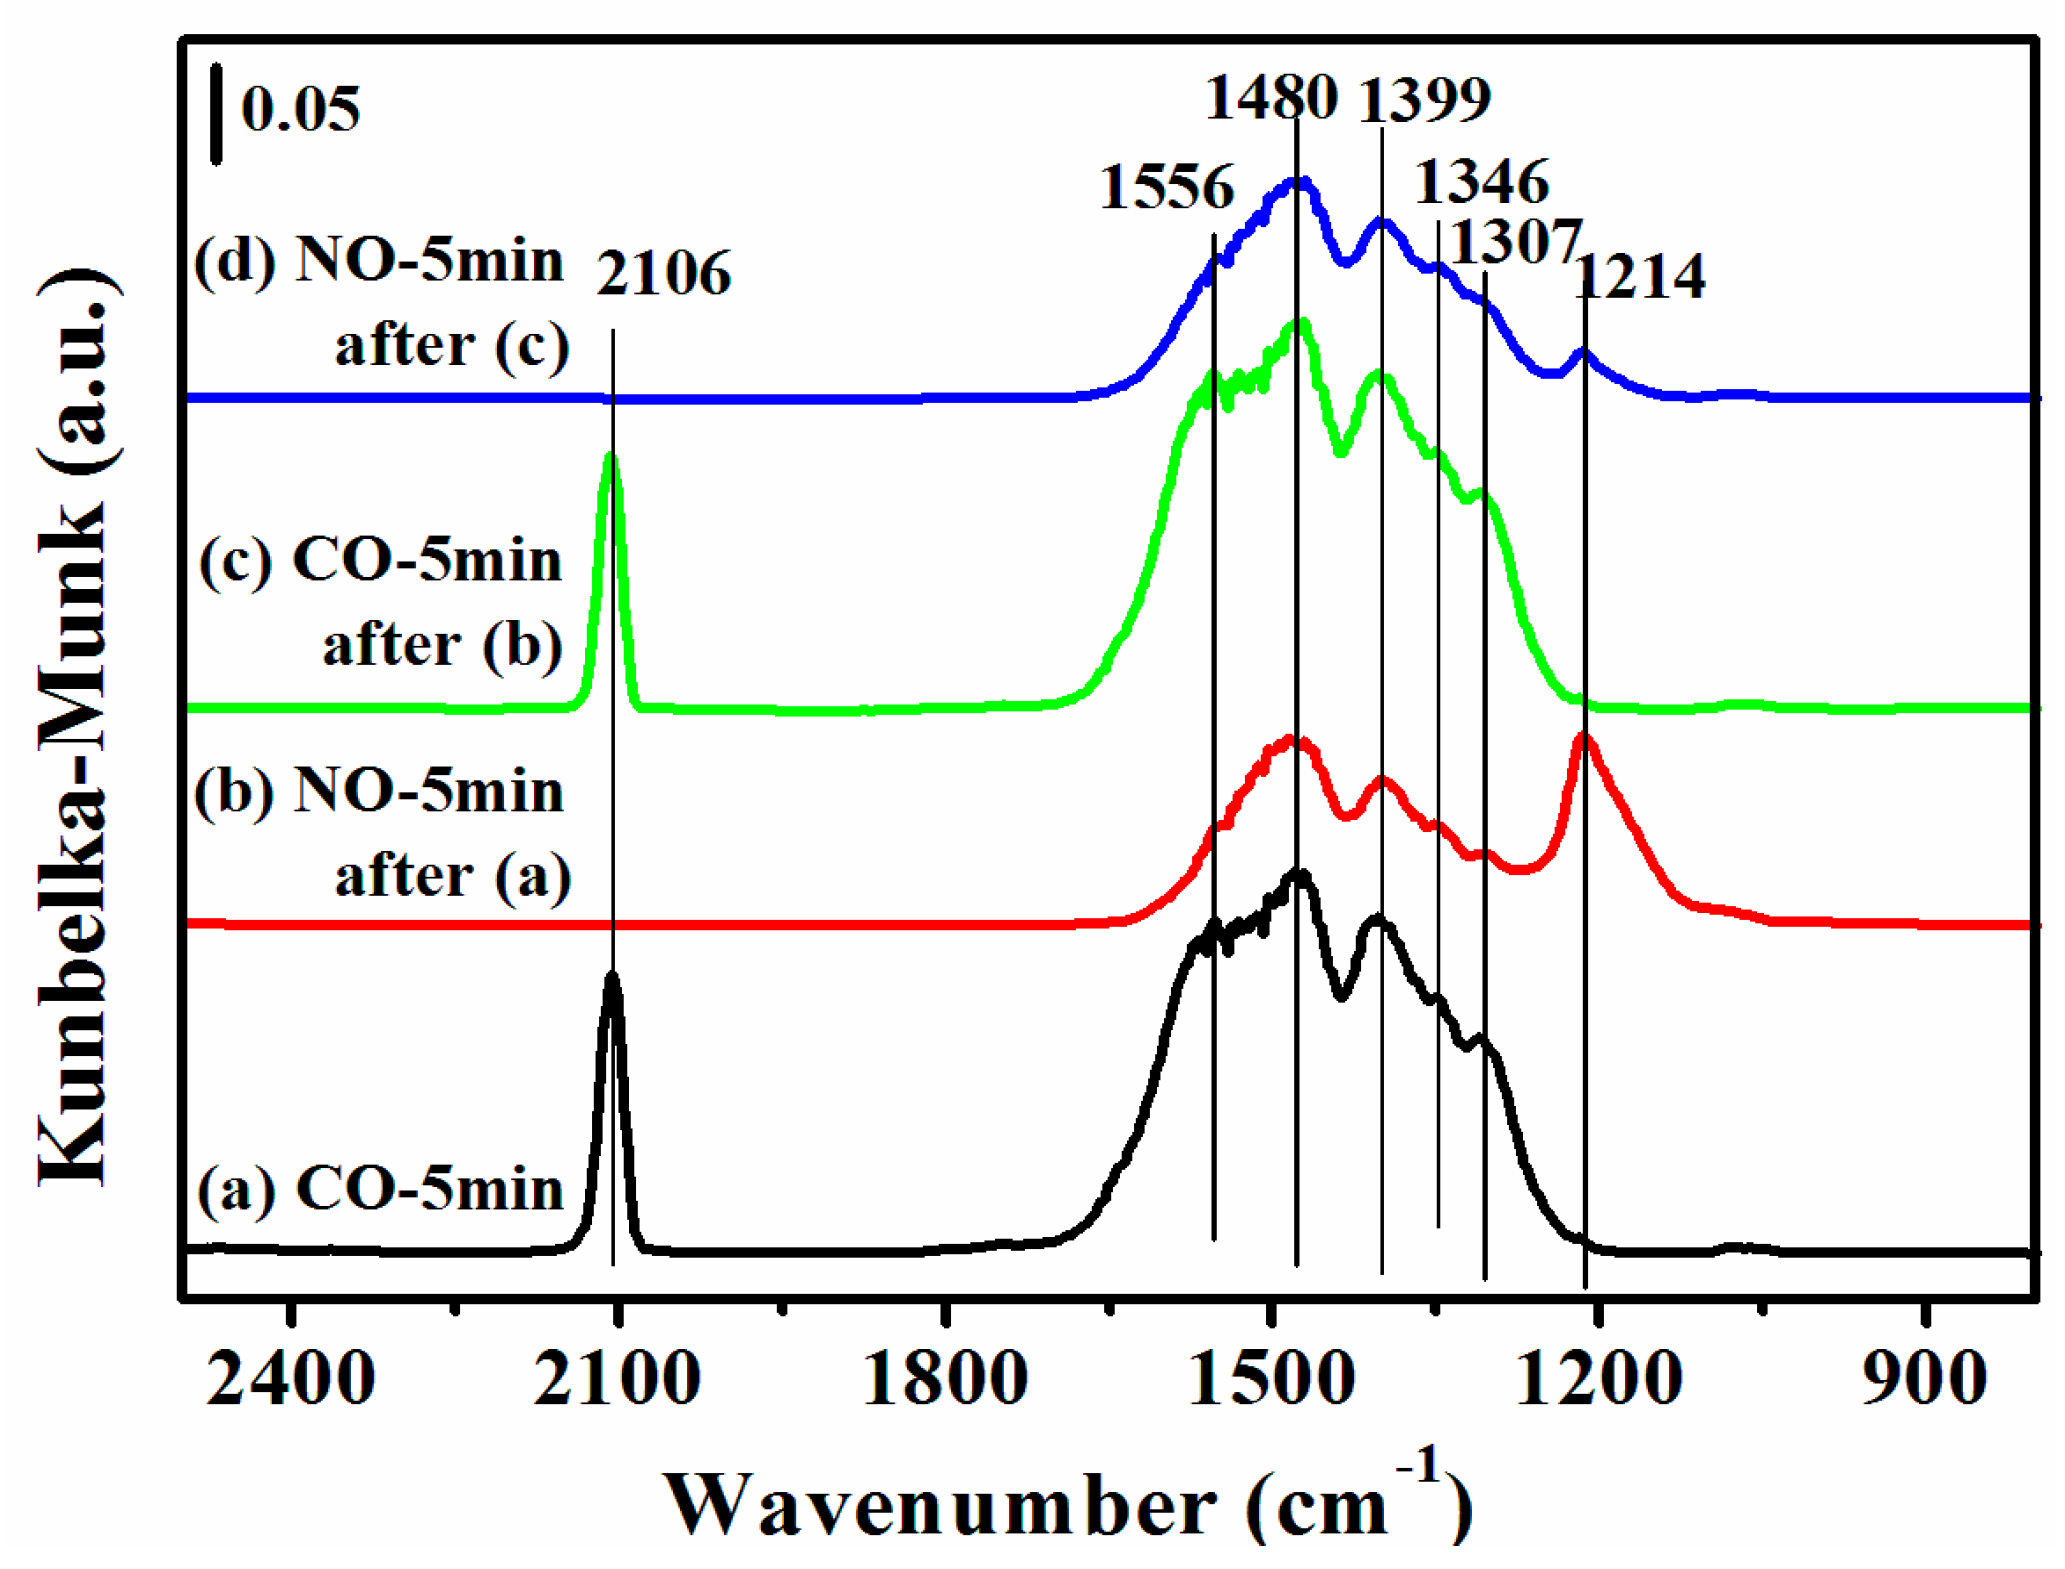
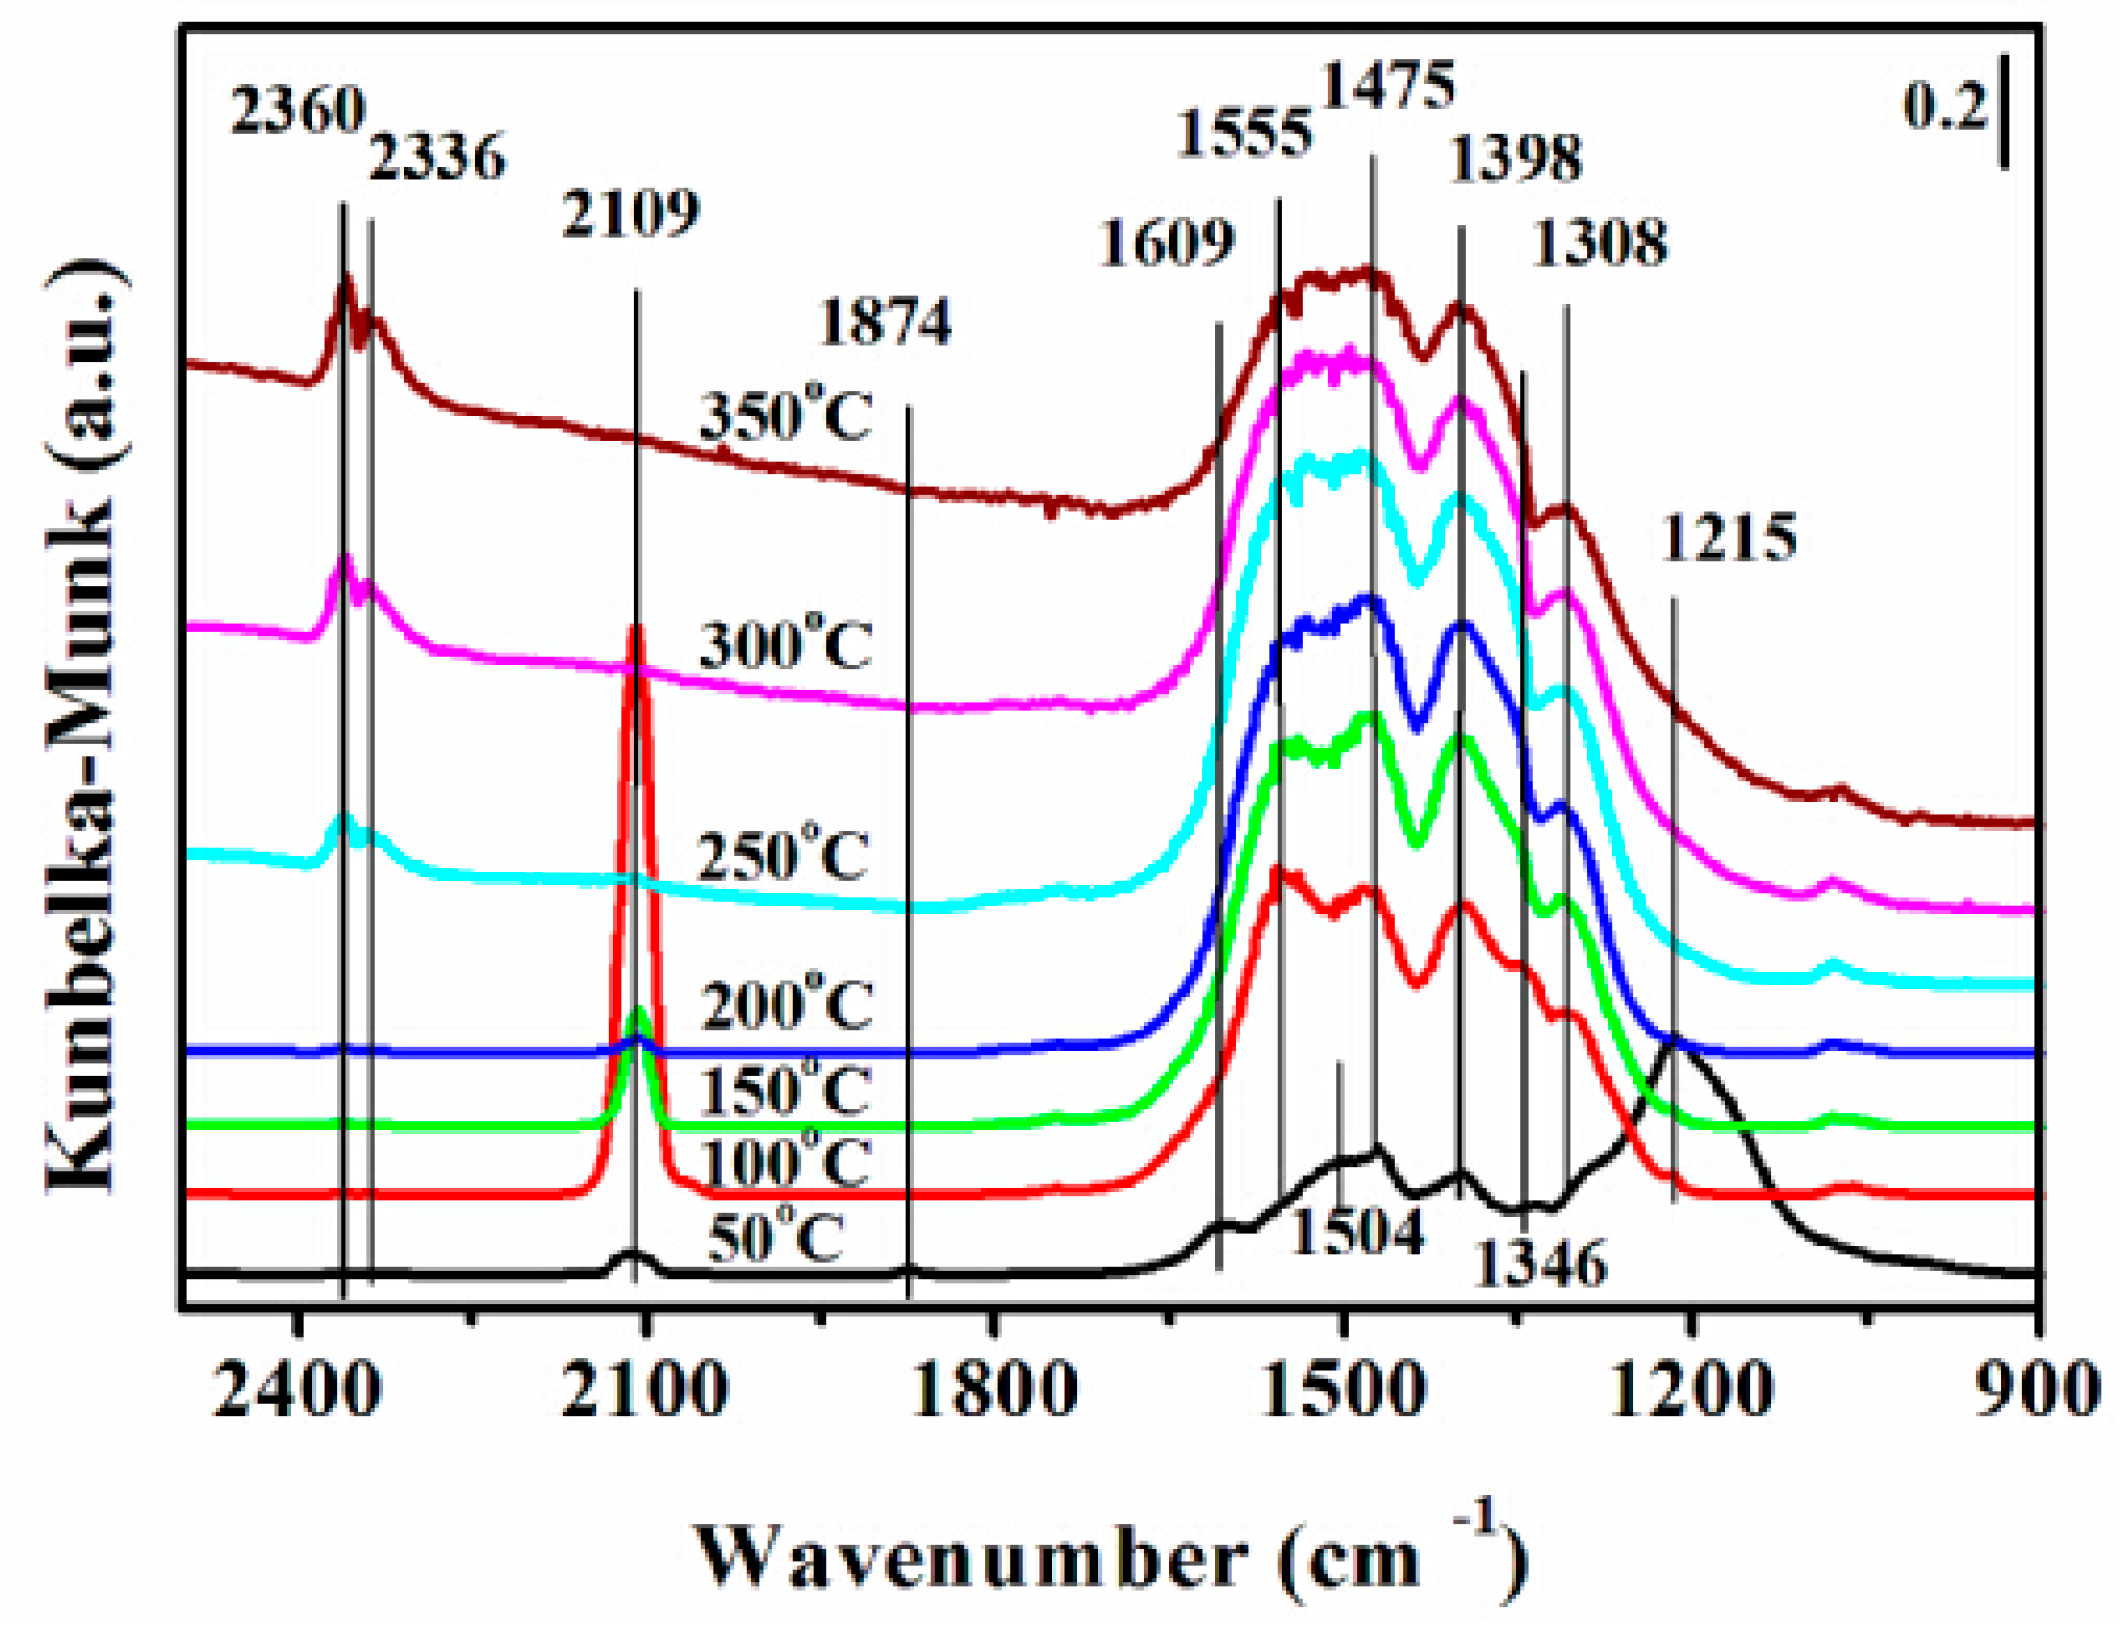
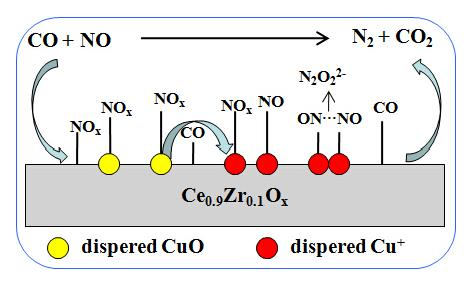
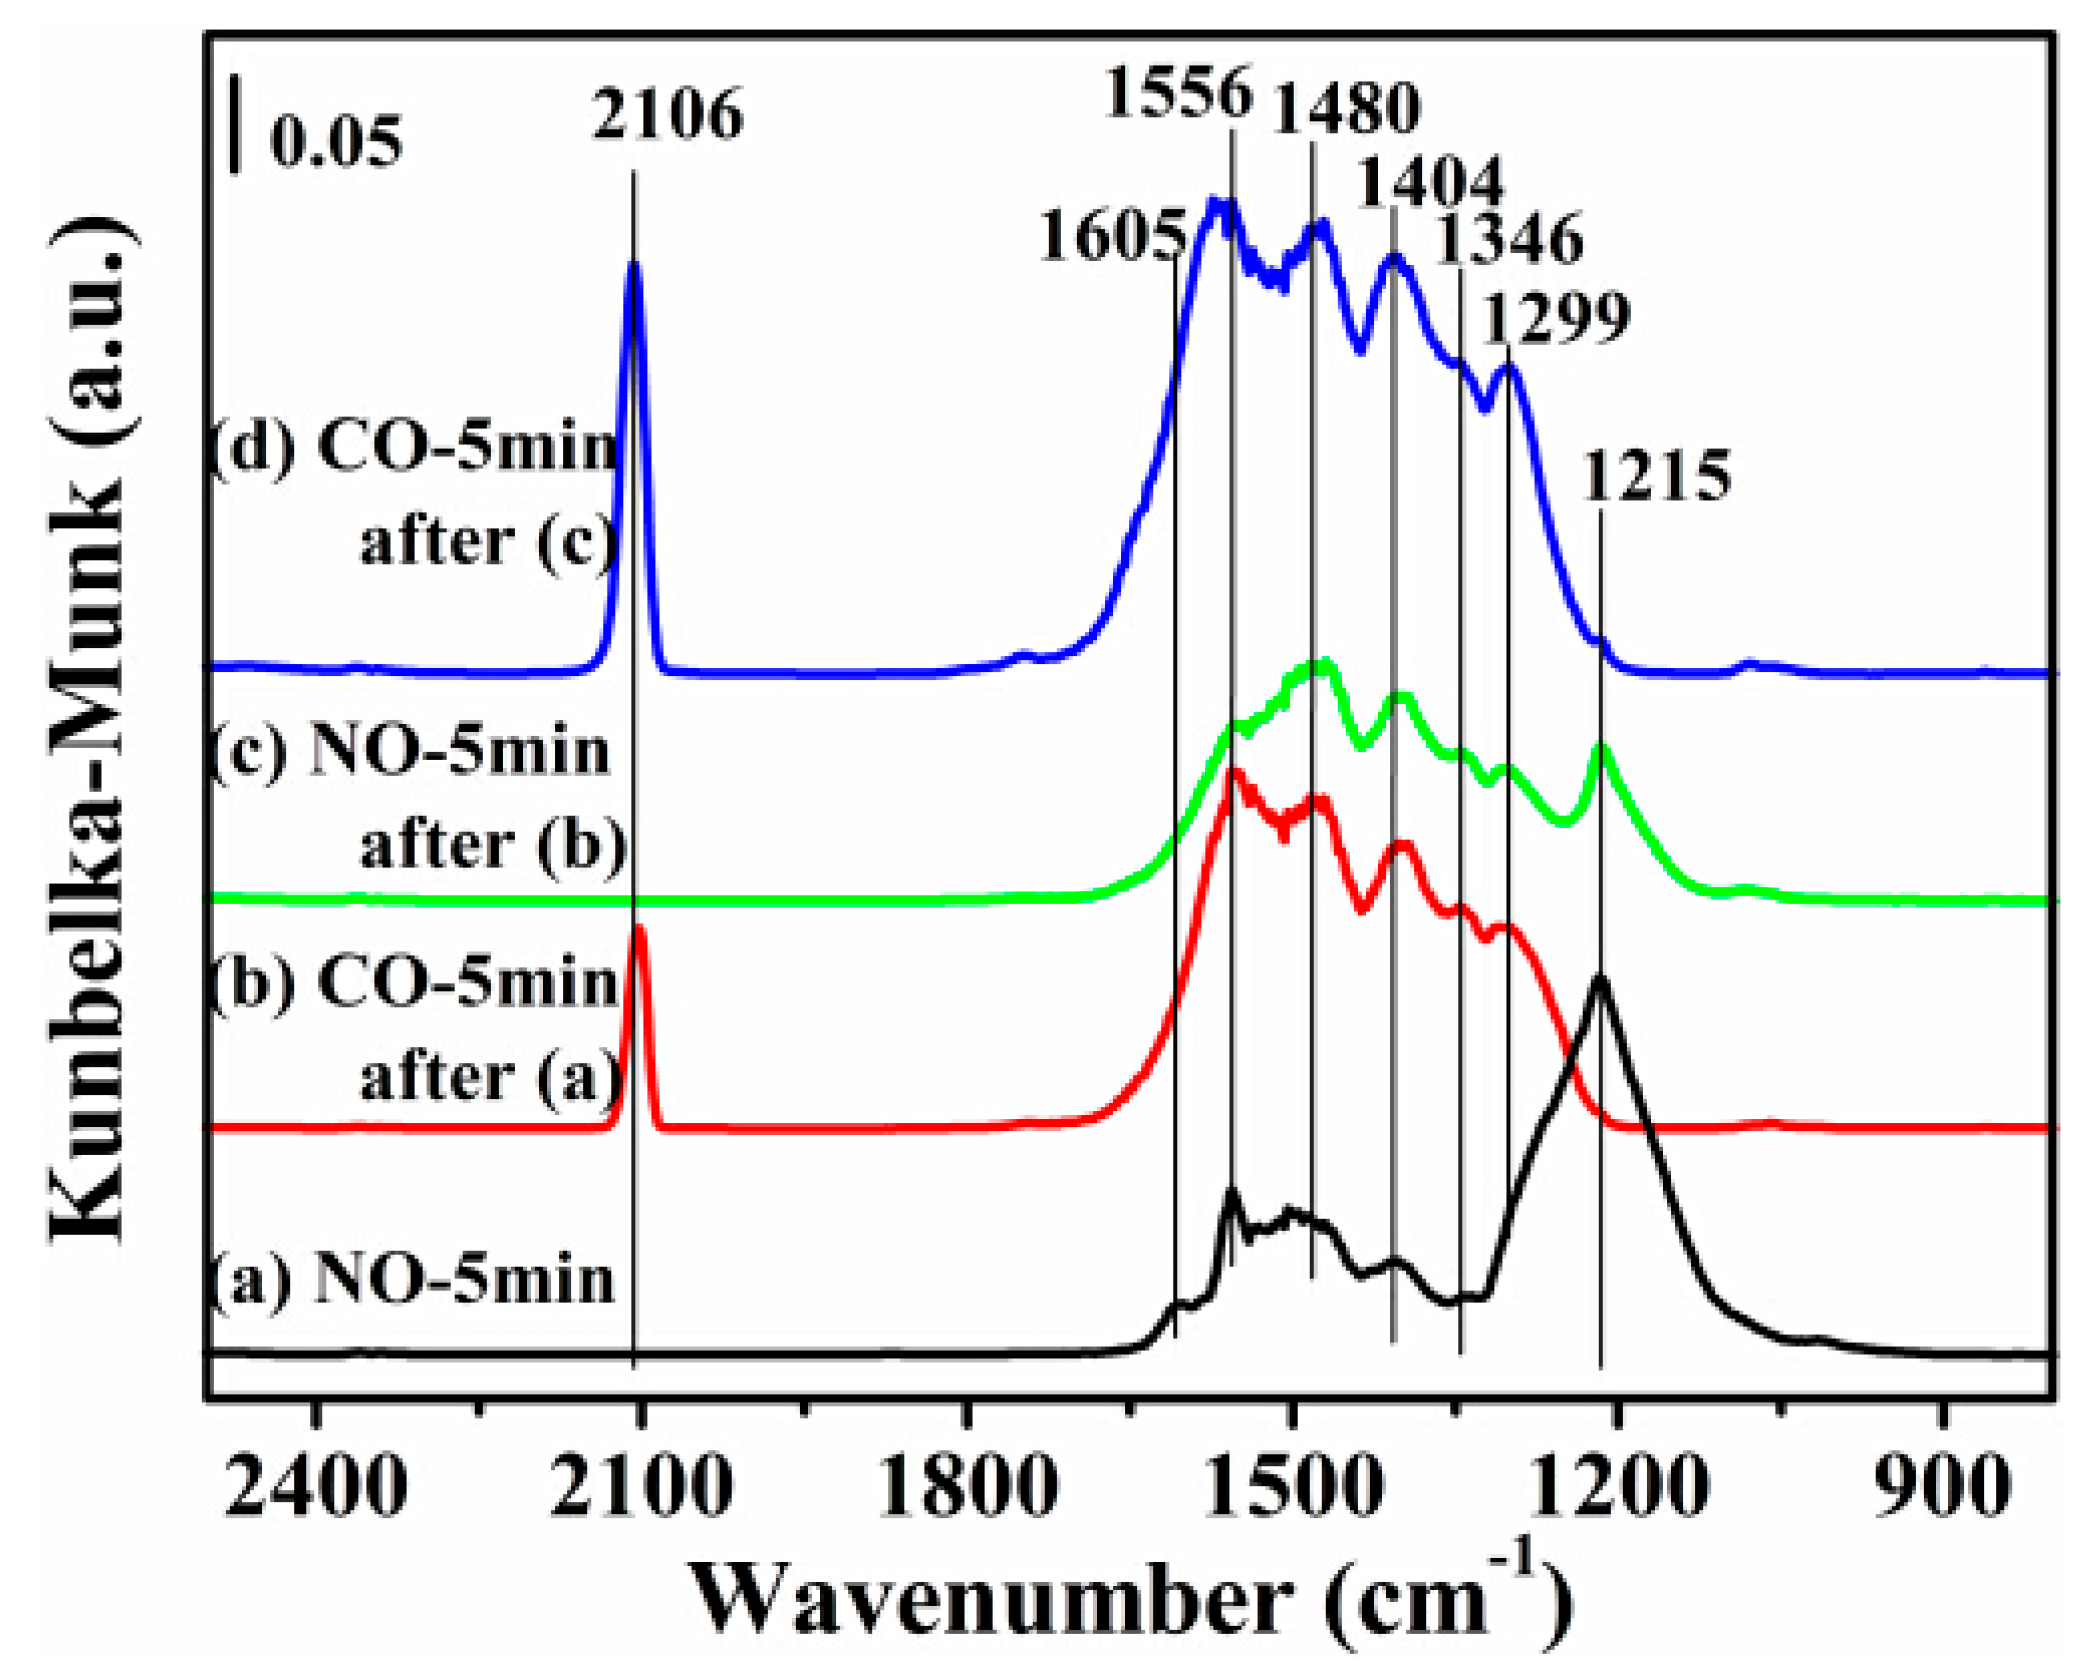
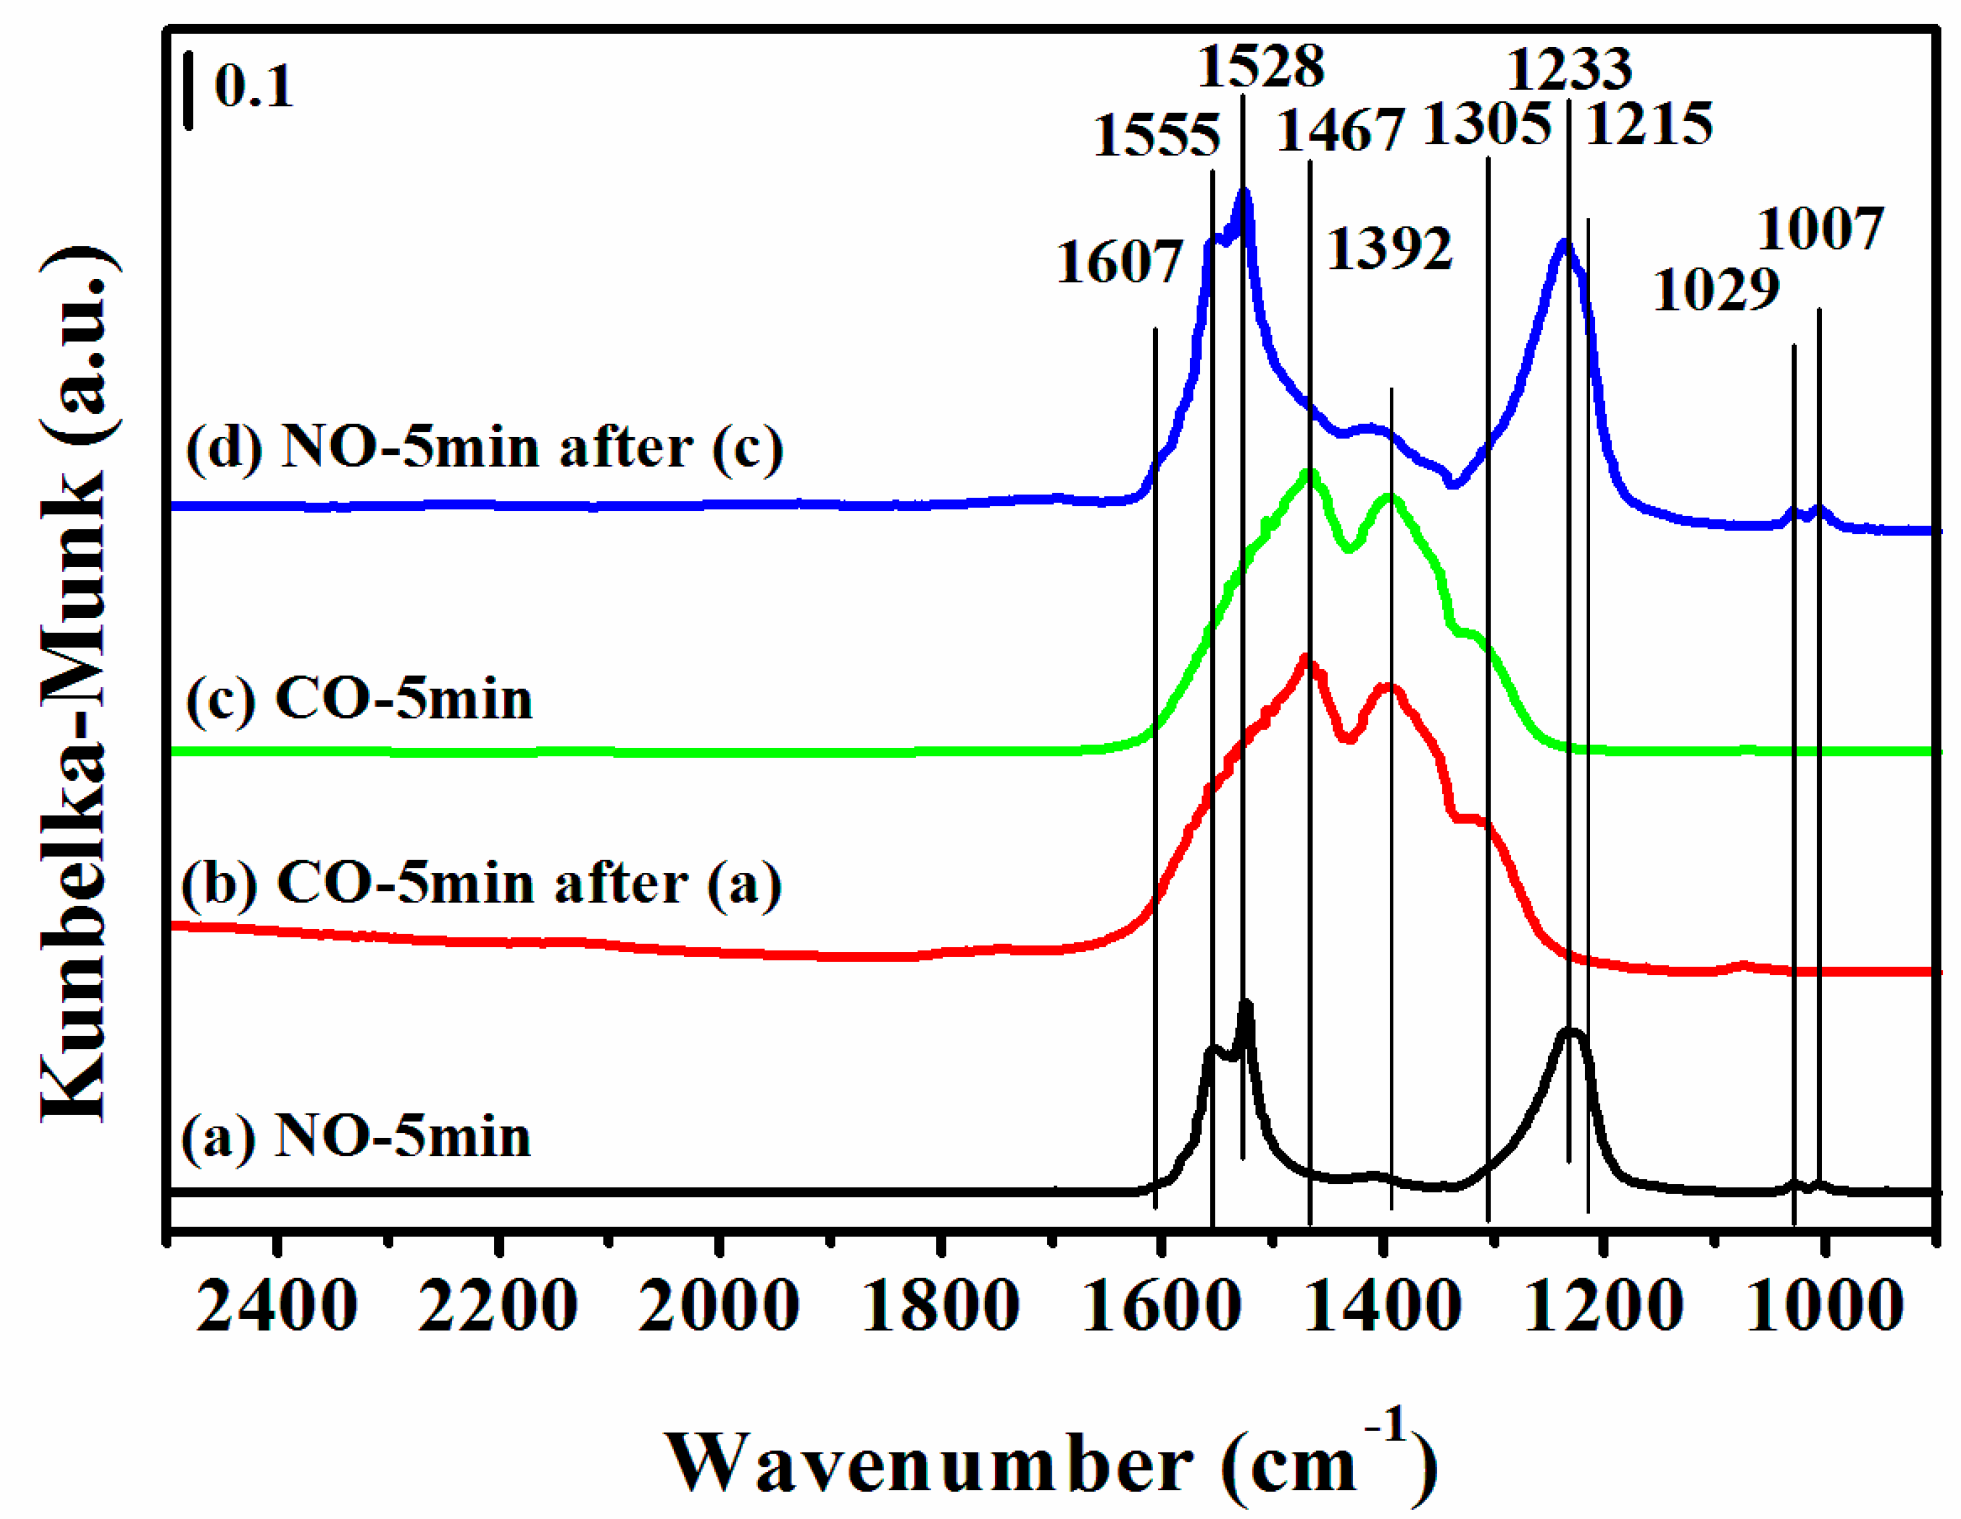
2.7. DRIFTS Studies
3. Experimental Section
3.1. Materials
3.2. Catalyst Preparation
3.3. Catalyst Characterization
3.4. Catalytic Activity Test
4. Conclusions
Supplementary Materials
Acknowledgments
Author Contributions
Conflicts of Interest
References
- Zhang, R.D.; Teoh, W.Y.; Amal, R.; Chen, B.H.; Kaliaguine, S. Catalytic reduction of NO by CO over Cu/CexZr1−xO2 prepared by flame synthesis. J. Catal. 2010, 272, 210–219. [Google Scholar] [CrossRef]
- Granger, P.; Dhainaut, F.; Pietrzik, S.; Malfoy, P.; Mamede, A.S.; Leclercq, L.; Leclercq, G. An overview: Comparative kinetic behaviour of Pt, Rh and Pd in the NO + CO and NO + H2 reactions. Top. Catal. 2006, 39, 65–76. [Google Scholar] [CrossRef]
- Hungria, A.B.; Fernándezgarcía, M.; Anderson, J.A.; Martínez-Arias, A. The effect of Ni in Pd–Ni/(Ce,Zr)O/AlO catalysts used for stoichiometric CO and NO elimination. Part 2: Catalytic activity and in situ spectroscopic studies. J. Catal. 2005, 235, 262–271. [Google Scholar] [CrossRef]
- Kolli, T.; Rahkamaa-Tolonen, K.; Lassi, U.; Savimäki, A.; Keiski, R.L. Comparison of catalytic activity and selectivity of Pd/(OSC + Al2O3) and (Pd + OSC)/Al2O3 catalysts. Catal. Today 2005, 100, 297–302. [Google Scholar] [CrossRef]
- Sarkar, A.D.; Khanra, B.C. CO oxidation and NO reduction over supported Pt-Rh and Pd-Rh nanocatalysts: A comparative study. J. Mol. Catal.A 2005, 229, 25–29. [Google Scholar] [CrossRef]
- Thirunavukkarasu, K.; Thirumoorthy, K.; Libuda, J.; Gopinath, C.S. A molecular beam study of the NO + CO reaction on Pd(111) surfaces. J. Phys. Chem. B 2005, 109, 13272–13282. [Google Scholar] [CrossRef] [PubMed]
- Yang, X.; Yang, L.Y.; Lin, S.Y.; Zhou, R.X. Investigation on properties of Pd/CeO2-ZrO2-Pr2O3 catalysts with different Ce/Zr molar ratios and its application for automotive emission control. J. Hazard. Mater. 2015, 285, 182–189. [Google Scholar] [CrossRef] [PubMed]
- Neyertz, C.; Volpe, M.; Perez, D.; Costilla, I.; Sanchez, M.; Gigola, C. NO reduction with CO in the presence and absence of H2O over Pd/γ-Al2O3 and Pd-VOx/γ-Al2O3 catalysts: The formation of HNCO, NH3 and stable surface species. Appl. Catal. A 2009, 368, 146–157. [Google Scholar] [CrossRef]
- Zhu, H.O.; Kim, J.R.; Ihm, S.K. Characteristics of Pt/WO3/CeO2/ZrO2 catalysts for catalytic reduction of NO by CO. Appl. Catal. B 2009, 86, 87–92. [Google Scholar] [CrossRef]
- Patel, A.; Shukla, P.; Rufford, T.; Wang, S.B.; Chen, J.L.; Rudolph, V.; Zhu, Z.H. Catalytic reduction of NO by CO over copper-oxide supported mesoporous silica. Appl. Catal. A 2011, 409–410, 55–65. [Google Scholar] [CrossRef]
- Liu, N.; Chen, X.Y.; Zhang, J.L.; Schwank, J.W. DRIFTS study of photo-assisted catalytic CO + NO redox reaction over CuO/CeO2-TiO2. Catal. Today 2015, 258, 139–147. [Google Scholar] [CrossRef]
- Yao, X.J.; Yu, Q.; Ji, Z.Y.; Lv, Y.Y.; Cao, Y.; Tang, C.J.; Gao, F.; Dong, L.; Chen, Y. A comparative study of different doped metal cations on the reduction, adsorption and activity of CuO/Ce0.67M0.33O2 (M = Zr4+, Sn4+, Ti4+) catalysts for NO + CO reaction. Appl. Catal. B 2013, 130–131, 293–304. [Google Scholar] [CrossRef]
- Hu, Y.H.; Dong, L.; Wang, J.; Ding, W.P.; Chen, Y. Activities of supported copper oxide catalysts in the NO + CO reaction at low temperatures. J. Mol. Catal. A 2000, 162, 307–316. [Google Scholar] [CrossRef]
- Chen, J.F.; Zhu, J.J.; Zhan, Y.Y.; Lin, X.Y.; Cai, G.H.; Wei, K.M.; Zheng, Q. Characterization and catalytic performance of Cu/CeO2 and Cu/MgO-CeO2 catalysts for NO reduction by CO. Appl. Catal. A 2009, 363, 208–215. [Google Scholar] [CrossRef]
- Hu, Y.H.; Dong, L.; Shen, M.M.; Liu, D.; Wang, J.; Ding, W.P.; Chen, Y. Influence of supports on the activities of copper oxide species in the low-temperature NO + CO reaction. Appl. Catal. B 2001, 31, 61–69. [Google Scholar] [CrossRef]
- Liu, L.J.; Chen, Y.; Dong, L.H.; Zhu, J.; Wan, H.Q.; Liu, B.; Zhao, B.; Zhu, H.Y.; Sun, K.Q.; Dong, L.; et al. Investigation of the NO removal by CO on CuO-CoOx binary metal oxides supported on Ce0.67Zr0.33O2. Appl. Catal. B 2009, 90, 105–114. [Google Scholar] [CrossRef]
- Gu, X.R.; Li, H.; Liu, L.C.; Tang, C.J.; Gao, F.; Dong, L. Promotional effect of CO pretreatment on CuO/CeO2 catalyst for catalytic reduction of NO by CO. J. Rare Earths 2014, 32, 139–145. [Google Scholar] [CrossRef]
- Zou, W.X.; Liu, L.C.; Zhang, L.; Li, L.L.; Cao, Y.A.; Wang, X.B.; Tang, C.J.; Gao, F.; Dong, L. Crystal-plane effects on surface and catalytic properties of Cu2O nanocrystals for NO reduction by CO. Appl.Catal. A 2015, 505, 334–343. [Google Scholar] [CrossRef]
- Wan, H.Q.; Li, D.; Dai, Y.; Hu, Y.H.; Liu, B.; Dong, L. Catalytic behaviors of CuO supported on Mn2O3 modified γ-Al2O3 for NO reduction by CO. J. Mol. Catal. A 2010, 332, 32–44. [Google Scholar] [CrossRef]
- Liu, L.J.; Liu, B.; Dong, L.H.; Zhu, J.; Wan, H.Q.; Sun, K.Q.; Zhao, B.; Zhu, H.Y.; Dong, L.; Chen, Y. In situ FT-infrared investigation of CO or/and NO interaction with CuO/Ce0.67Zr0.33O2 catalysts. Appl. Catal. B 2009, 90, 578–586. [Google Scholar] [CrossRef]
- Lv, Y.Y.; Zhang, H.L.; Cao, Y.; Dong, L.H.; Zhang, L.L.; Yao, K.A.; Gao, F.; Dong, L.; Chen, Y. Investigation of the physicochemical properties of CuO-CoO binary metal oxides supported on gamma-Al2O3 and their activity for NO removal by CO. J. Colloid Interface Sci. 2012, 372, 63–72. [Google Scholar] [CrossRef] [PubMed]
- Ge, C.Y.; Liu, L.C.; Liu, Z.T.; Yao, X.J.; Cao, Y.A.; Tang, C.J.; Gao, F.; Dong, L. Improving the dispersion of CeO2 on γ-Al2O3 to enhance the catalytic performances of CuO/CeO2/γ-Al2O3 catalysts for NO removal by CO. Catal. Commun. 2014, 51, 95–99. [Google Scholar]
- Yu, Q.; Yao, X.J.; Zhang, H.L.; Gao, F.; Dong, L. Effect of ZrO2 addition method on the activity of Al2O3-supported CuO for NO reduction with CO: Impregnation vs. Coprecipitation. Appl. Catal. A 2012, 423–424, 42–51. [Google Scholar] [CrossRef]
- Yu, Q.; Liu, L.J.; Dong, L.H.; Li, D.; Liu, B.; Gao, F.; Sun, K.Q.; Dong, L.; Chen, Y. Effects of Ce/Zr ratio on the reducibility, adsorption and catalytic activity of CuO/CexZr1−xO2/γ-Al2O3 catalysts for NO reduction by CO. Appl. Catal. B 2010, 96, 350–360. [Google Scholar] [CrossRef]
- Kim, J.R.; Myeong, W.J.; Ihm, S.K. Characteristics in oxygen storage capacity of ceria–zirconia mixed oxides prepared by continuous hydrothermal synthesis in supercritical water. Appl. Catal. B 2007, 71, 57–63. [Google Scholar] [CrossRef]
- Cao, J.L.; Wang, Y.; Zhang, T.Y.; Wu, S.H.; Yuan, Z.Y. Preparation, characterization and catalytic behavior of nanostructured mesoporous CuO/Ce0.8Zr0.2O2 catalysts for low-temperature CO oxidation. Appl. Catal. B 2008, 78, 120–128. [Google Scholar] [CrossRef]
- Mistria, R.; Rahaman, M.; Llorca, J.; Priolkar, K.R.; Colussi, S.; Ray, B.C.; Gayena, A. Liquid phase elective oxidation of benzene over nanostructured CuxCe1−xO2−δ (0.03 ≤ x ≤ 0.15). J. Mol. Catal. A 2014, 390, 187–197. [Google Scholar] [CrossRef]
- Piumetti, M.; Bensaid, S.; Russo, N.; Fino, D. Nanostructured ceria-based catalysts for soot combustion: Investigations on the surface sensitivity. Appl. Catal. B 2015, 165, 742–751. [Google Scholar] [CrossRef]
- Sun, S.S.; Mao, D.S.; Yu, J. Enhanced CO oxidation activity of CuO/CeO2 catalyst prepared by surfactant-assisted impregnation method. J. Rare Earths 2015, 33, 1268–1274. [Google Scholar] [CrossRef]
- Yuan, J.X.; Lou, L.P.; Chen, Y.X.; Zheng, X.M. Effects of CuO/CeO2 and CuO/γ-Al2O3 catalysts on NO + CO reaction. J. Mol. Catal. A 2003, 197, 193–205. [Google Scholar]
- Xu, C.J.; Hao, X.Y.; Gao, M.Y.; Su, H.Q.; Zeng, S.H. Important properties associated with catalytic performance over three-dimensionally ordered macroporous CeO2-CuO catalysts. Catal. Commun. 2016, 73, 113–117. [Google Scholar] [CrossRef]
- Yin, Y.L.; Liu, K.W.; Gao, M.Y.; Zhang, L.; Su, H.Q.; Zeng, S.H. Influence of the structure and morphology of CuO supports on the amount and properties of copper–cerium interfacial sites in inverse CeO2/CuO catalysts. J. Mol. Catal. A 2015, 404–405, 193–203. [Google Scholar] [CrossRef]
- Nakagawa, K.; Ohshima, T.; Tezuka, Y.; Katayama, M.; Katoh, M.; Sugiyama, S. Morphological effects of CeO2 nanostructures for catalytic soot combustion of CuO/CeO2. Catal. Today 2015, 246, 67–71. [Google Scholar] [CrossRef]
- Jeong, D.W.; Jang, W.J.; Na, H.S.; Shim, J.O.; Jha, A.; Roh, H.S. Comparative study on cubic and tetragonal Cu-CeO2-ZrO2 catalysts for water gas shift reaction. J. Ind. Eng. Chem. 2015, 27, 35–39. [Google Scholar] [CrossRef]
- Luo, M.; Ma, J.; Lu, J.; Song, Y.; Wang, Y. High-surface area CuO-CeO2 catalysts prepared by a surfactant-templated method for low-temperature CO oxidation. J. Catal. 2007, 246, 52–59. [Google Scholar] [CrossRef]
- Martínez-Aria, A.; Gamarra, D.; Fernández-García, M.; Wang, X.Q.; Hanson, J.C.; Rodriguez, J.A. Comparative study on redox properties of nanosized CeO2 and CuO/CeO2 under CO/O2. J. Catal. 2006, 240, 1–7. [Google Scholar]
- Barbato, P.S.; Colussi, S.; Benedetto, A.D.; Landi, G.; Lisi, L.; Llorca, J.; Trovarelli, A. CO preferential oxidation under H2-rich streams on copper oxide supported on Fe promoted CeO2. Appl. Catal. A 2015, 506, 268–277. [Google Scholar] [CrossRef]
- Zhang, G.J.; Shen, Z.R.; Liu, M.; Guo, C.H.; Sun, P.C.; Yuan, Z.Y.; Li, B.H.; Ding, D.T.; Chen, T.H. Synthesis and characterization of mesoporous ceria with hierarchical nanoarchitecture controlled by amino acids. J. Phys. Chem. B 2006, 110, 25782–25790. [Google Scholar] [CrossRef] [PubMed]
- Mullins, D.R.; Overbury, S.H.; Huntley, D.R. Electron spectroscopy of single crystal and polycrystalline cerium oxide surfaces. Surf. Sci. 1998, 409, 307–319. [Google Scholar] [CrossRef]
- Shen, Q.; Wu, M.; Wang, H.; He, C.; Hao, Z.; Wei, W.; Sun, Y. Facile synthesis of catalytically active CeO2 for soot combustion. Catal. Sci. Technol. 2015, 5, 1941–1952. [Google Scholar] [CrossRef]
- Matsouka, V.; Konsolakis, M.; Lambert, R.M.; Yentekakis, I.V. In situ DRIFTS study of the effect of structure (CeO2-La2O3) and surface (Na) modifiers on the catalytic and surface behaviour of Pt/γ-Al2O3 catalyst under simulated exhaust conditions. Appl. Catal. B 2008, 84, 715–722. [Google Scholar] [CrossRef]
- Cao, Y.; Ran, R.; Wu, X.; Weng, D. A new insight into the effects of barium addition on Pd-only catalysts: Pd-support interface and CO + NO reaction pathway. Appl. Catal. A 2015, 501, 17–26. [Google Scholar] [CrossRef]
- Martinez-Arias, A.; Soria, J.; Conesa, J.C.; Seoane, X.L.; Arcoya, A.; Catalufia, R. NO Reaction at Surface Oxygen Vacancies generated in Cerium Oxide. J. Chem. Soc. Faraday Trans. 1995, 91, 1679–1687. [Google Scholar] [CrossRef]
- Liu, J.; Zhao, Q.; Li, X.; Chen, J.; Zhang, D. Structure sensitivity of selective catalytic reduction of NO with propylene over Cu-doped Ti0.5Zr0.5O2−δ catalysts. Appl. Catal. B 2015, 165, 519–528. [Google Scholar] [CrossRef]
- Gamarra, D.; Munuera, G.; Hungría, A.B.; Fernández-García, M.; Conesa, J.C.; Midgley, P.A.; Wang, X.Q.; Hanson, J.C.; Rodríguez, J.A.; Martínez-Arias, A. Structure-activity relationship in nanostructured copper-ceria-based preferential CO oxidation catalysts. J. Phys. Chem. C 2007, 111, 11026–11038. [Google Scholar] [CrossRef]
- Wan, H.; Wang, Z.; Zhu, J.; Li, X.; Liu, B.; Gao, F.; Dong, L.; Chen, Y. Influence of CO pretreatment on the activities of CuO/γ-Al2O3 catalysts in CO + O2 reaction. Appl. Catal. B 2008, 79, 254–261. [Google Scholar] [CrossRef]
- Alexeev, O.S.; Krishnamoorthy, S.; Jensen, C.; Ziebarth, M.S.; Yaluris, G.; Roberie, T.G.; Amiridis, M.D. In situ FTIR characterization of the adsorption of CO and its reaction with NO on Pd-based FCC low NOx combustion promoters. Catal. Today 2007, 127, 189–198. [Google Scholar] [CrossRef]
- Bera, P.; Cámara, A.L.; Hornés, A.; Martínez-Arias, A. Comparative in Situ DRIFTS-MS Study of 12CO- and 13CO-TPR on CuO/CeO2 Catalyst. J. Phys. Chem. C 2009, 113, 10689–10695. [Google Scholar] [CrossRef]


| Sample | Copper Content (wt %) | Average Crystallite Size a (nm) | SA b (m2·g−1) | Pore Size c (nm) | RD/F2g d |
|---|---|---|---|---|---|
| CZ | - | 7.6 | 94 | 4.8 | 0.32 |
| 2CuOCZ | 2 | 7.5 | 98 | 4.9 | 0.24 |
| 5CuOCZ | 5 | 6.4 | 116 | 5.3 | 0.27 |
| 12CuOCZ | 12 | 5.5 | 121 | 4.9 | 0.15 |
| 16CuOCZ | 16 | 5.2 | 119 | 5.7 | 0.13 |
| Catalyst | Cu (at %) | Ce (at %) | Zr (at %) | O (at %) | Ce/Zr | Cu+/Cu2+ | Ce3+/Ce4+ c | Oads/(Oads + Ow + Olatt) | ||||
|---|---|---|---|---|---|---|---|---|---|---|---|---|
| T a | S b | T a | S b | T a | S b | T a | S b | |||||
| CZ | - | - | 30 | 33.5 | 3.3 | 3.8 | 66.7 | 62.7 | 8.82 | - | 0.24 | 0.43 |
| 2CuOCZ | 1.3 | 2.0 | 29.2 | 38.8 | 3.2 | 3.2 | 66.2 | 56.0 | 12.1 | - | 0.23 | 0.34 |
| 5CuOCZ | 2.8 | 5.5 | 28.3 | 28.0 | 3.1 | 1.8 | 65.7 | 64.7 | 15.6 | 0.071 | 0.22 | 0.37 |
| 12CuOCZ | 8.0 | 8.4 | 25.2 | 31.2 | 2.8 | 1.5 | 64.0 | 58.9 | 20.8 | 0.17 | 0.18 | 0.31 |
| 16CuOCZ | 10.6 | 10.8 | 23.6 | 27.9 | 2.6 | 2.4 | 63.1 | 59.0 | 11.6 | 0.14 | 0.19 | 0.29 |
© 2016 by the authors; licensee MDPI, Basel, Switzerland. This article is an open access article distributed under the terms and conditions of the Creative Commons Attribution (CC-BY) license (http://creativecommons.org/licenses/by/4.0/).
Share and Cite
Li, P.; Feng, L.; Yuan, F.; Wang, D.; Dong, Y.; Niu, X.; Zhu, Y. Effect of Surface Copper Species on NO + CO Reaction over xCuO-Ce0.9Zr0.1O2 Catalysts: In Situ DRIFTS Studies. Catalysts 2016, 6, 124. https://doi.org/10.3390/catal6080124
Li P, Feng L, Yuan F, Wang D, Dong Y, Niu X, Zhu Y. Effect of Surface Copper Species on NO + CO Reaction over xCuO-Ce0.9Zr0.1O2 Catalysts: In Situ DRIFTS Studies. Catalysts. 2016; 6(8):124. https://doi.org/10.3390/catal6080124
Chicago/Turabian StyleLi, Pengying, Lu Feng, Fulong Yuan, Dong Wang, Yongli Dong, Xiaoyu Niu, and Yujun Zhu. 2016. "Effect of Surface Copper Species on NO + CO Reaction over xCuO-Ce0.9Zr0.1O2 Catalysts: In Situ DRIFTS Studies" Catalysts 6, no. 8: 124. https://doi.org/10.3390/catal6080124