Article

Fabrication of Hierarchically Porous Reduced Graphene Oxide/SnIn4S8 Composites by a Low-Temperature Co-Precipitation Strategy and Their Excellent Visible-Light Photocatalytic Mineralization Performance

1
Key Laboratory of Jiangxi Province for Persistent Pollutants Control and Resources Recycle, Nanchang Hangkong University, Nanchang 330063, China
2
Department of Biomedical, Chemical and Environmental Engineering (DBCEE), University of Cincinnati, Cincinnati, OH 45221-0012, USA
*
Authors to whom correspondence should be addressed.
Catalysts 2016, 6(8), 113; https://doi.org/10.3390/catal6080113
Submission received: 11 June 2016 / Revised: 5 July 2016 / Accepted: 12 July 2016 / Published: 29 July 2016
(This article belongs to the Special Issue Photocatalytic Wastewater Treatment)

Abstract

:
Hierarchically porous reduced graphene oxide/SnIn4S8 (RGO/SnIn4S8) composites with visible-light response and strong mineralization ability were first successfully prepared by a facile low-temperature co-precipitation method, and were characterized by X ray diffraction (XRD), scanning electron microscope (SEM), Brunauer-Emmet-Teller (BET), UV-Visible spectrophotometer (UV-Vis), Raman spectra and Photoluminescence (PL) techniques. RGO/SnIn4S8 composite exhibits strong absorption in UV and visible-light range. The optimized 5% RGO/SnIn4S8 possesses the optimal photocatalytic degradation efficiency and the best mineralization performance with complete degradation of Rhodamine B (RhB) within 70 min and 73.17% mineralization yield within 160 min under visible-light irradiation, which is much higher than that of pure SnIn4S8. The main reactive species, which play crucial roles in the degradation and mineralization of RhB, follow the order of h+ > ·O2 > ·OH. The intermediate products of RhB degradation were analyzed by using high performance liquid chromatography-tandem mass spectrometry (HPLC-MS), and the possible degradation pathways and mechanism were proposed. Moreover, 5% RGO/SnIn4S8 exhibits excellent reusability and stability without an obvious decrease in photocatalytic activity after four consecutive photocatalytic degradation-regeneration experiments.

Graphical Abstract

1. Introduction

Water pollution has attracted public attention due to the environmental and health risks [1,2,3,4,5]. Dye contamination has become a major factor that contributes to water quality deterioration, and poses a potential hazard to living organisms due to the toxic, carcinogenic and mutagenic properties of dyes and their by-products [6,7,8,9,10]. Hence, the removal of organic dye pollutants from the wastewater becomes very essential. Up to now, several methods have been adopted to remove dyes from wastewater, including adsorption, coagulation, biological treatment, electrochemical treatment and heterogeneous photocatalytic oxidation technology [11,12,13,14,15]. Among these methods, heterogeneous photocatalytic oxidation technology is one of the best available technologies for dye removal from wastewater due to its strong oxidation power, moderate operation temperature, and green-chemistry related procedures.
To date, TiO2 is regarded as one of the most promising semiconductor photocatalysts for degrading organic compounds because of its high photocatalytic activity, low cost, non-toxicity, chemical stability, and biocompatibility [16,17,18,19]. However, TiO2 has a large band gap (3.2 eV for anatase and 3.0 eV for rutile) and can only respond to ultraviolet (UV) irradiation, which restrict its practical application [20,21,22,23]. Moreover, a number of intermediates are usually produced during the TiO2 photocatalytic degradation process, and are difficult to be further degraded. Some intermediates are even more toxic than their parental pollutants, thus it is urgent to develop new visible-light-responsive photocatalysts that can mineralize pollutants to inorganic products within a short reaction time.
Ternary chalcogenide compounds have attracted much concern due to their narrow band gap and high stability. Stannum indium sulfide (SnIn4S8) is a representative ternary chalcogenide semiconductor, and exhibits potential application in photocatalysis [24,25,26]. However, a single SnIn4S8 semiconductor usually has a small specific surface area and fast electron–hole recombination, which limit its photocatalytic efficiency. Hence, further modification of SnIn4S8 photocatalysts for high photon quantum efficiency is indispensable.
Reduced graphene oxide (RGO) has large specific surface area, superior electrical conductivity, high carrier mobility, and excellent mechanical properties, and is usually used as a good support to enhance the photocatalytic activities of some photocatalysts [27,28,29,30,31]. Herein, we first report a facile and simple synthesis of reduced graphene oxide/SnIn4S8 (RGO/SnIn4S8) composites with strong mineralization ability by a low-temperature co-precipitation method. The morphology, structure and photocatalytic activity of the RGO/SnIn4S8 composites were studied. The photocatalytic degradation kinetics, mineralization kinetics and degradation pathways of Rhodamine B (RhB) were systematically investigated under visible-light irradiation. Moreover, the possible photocatalytic mechanism of RGO/SnIn4S8 was provided.

2. Results and Discussion

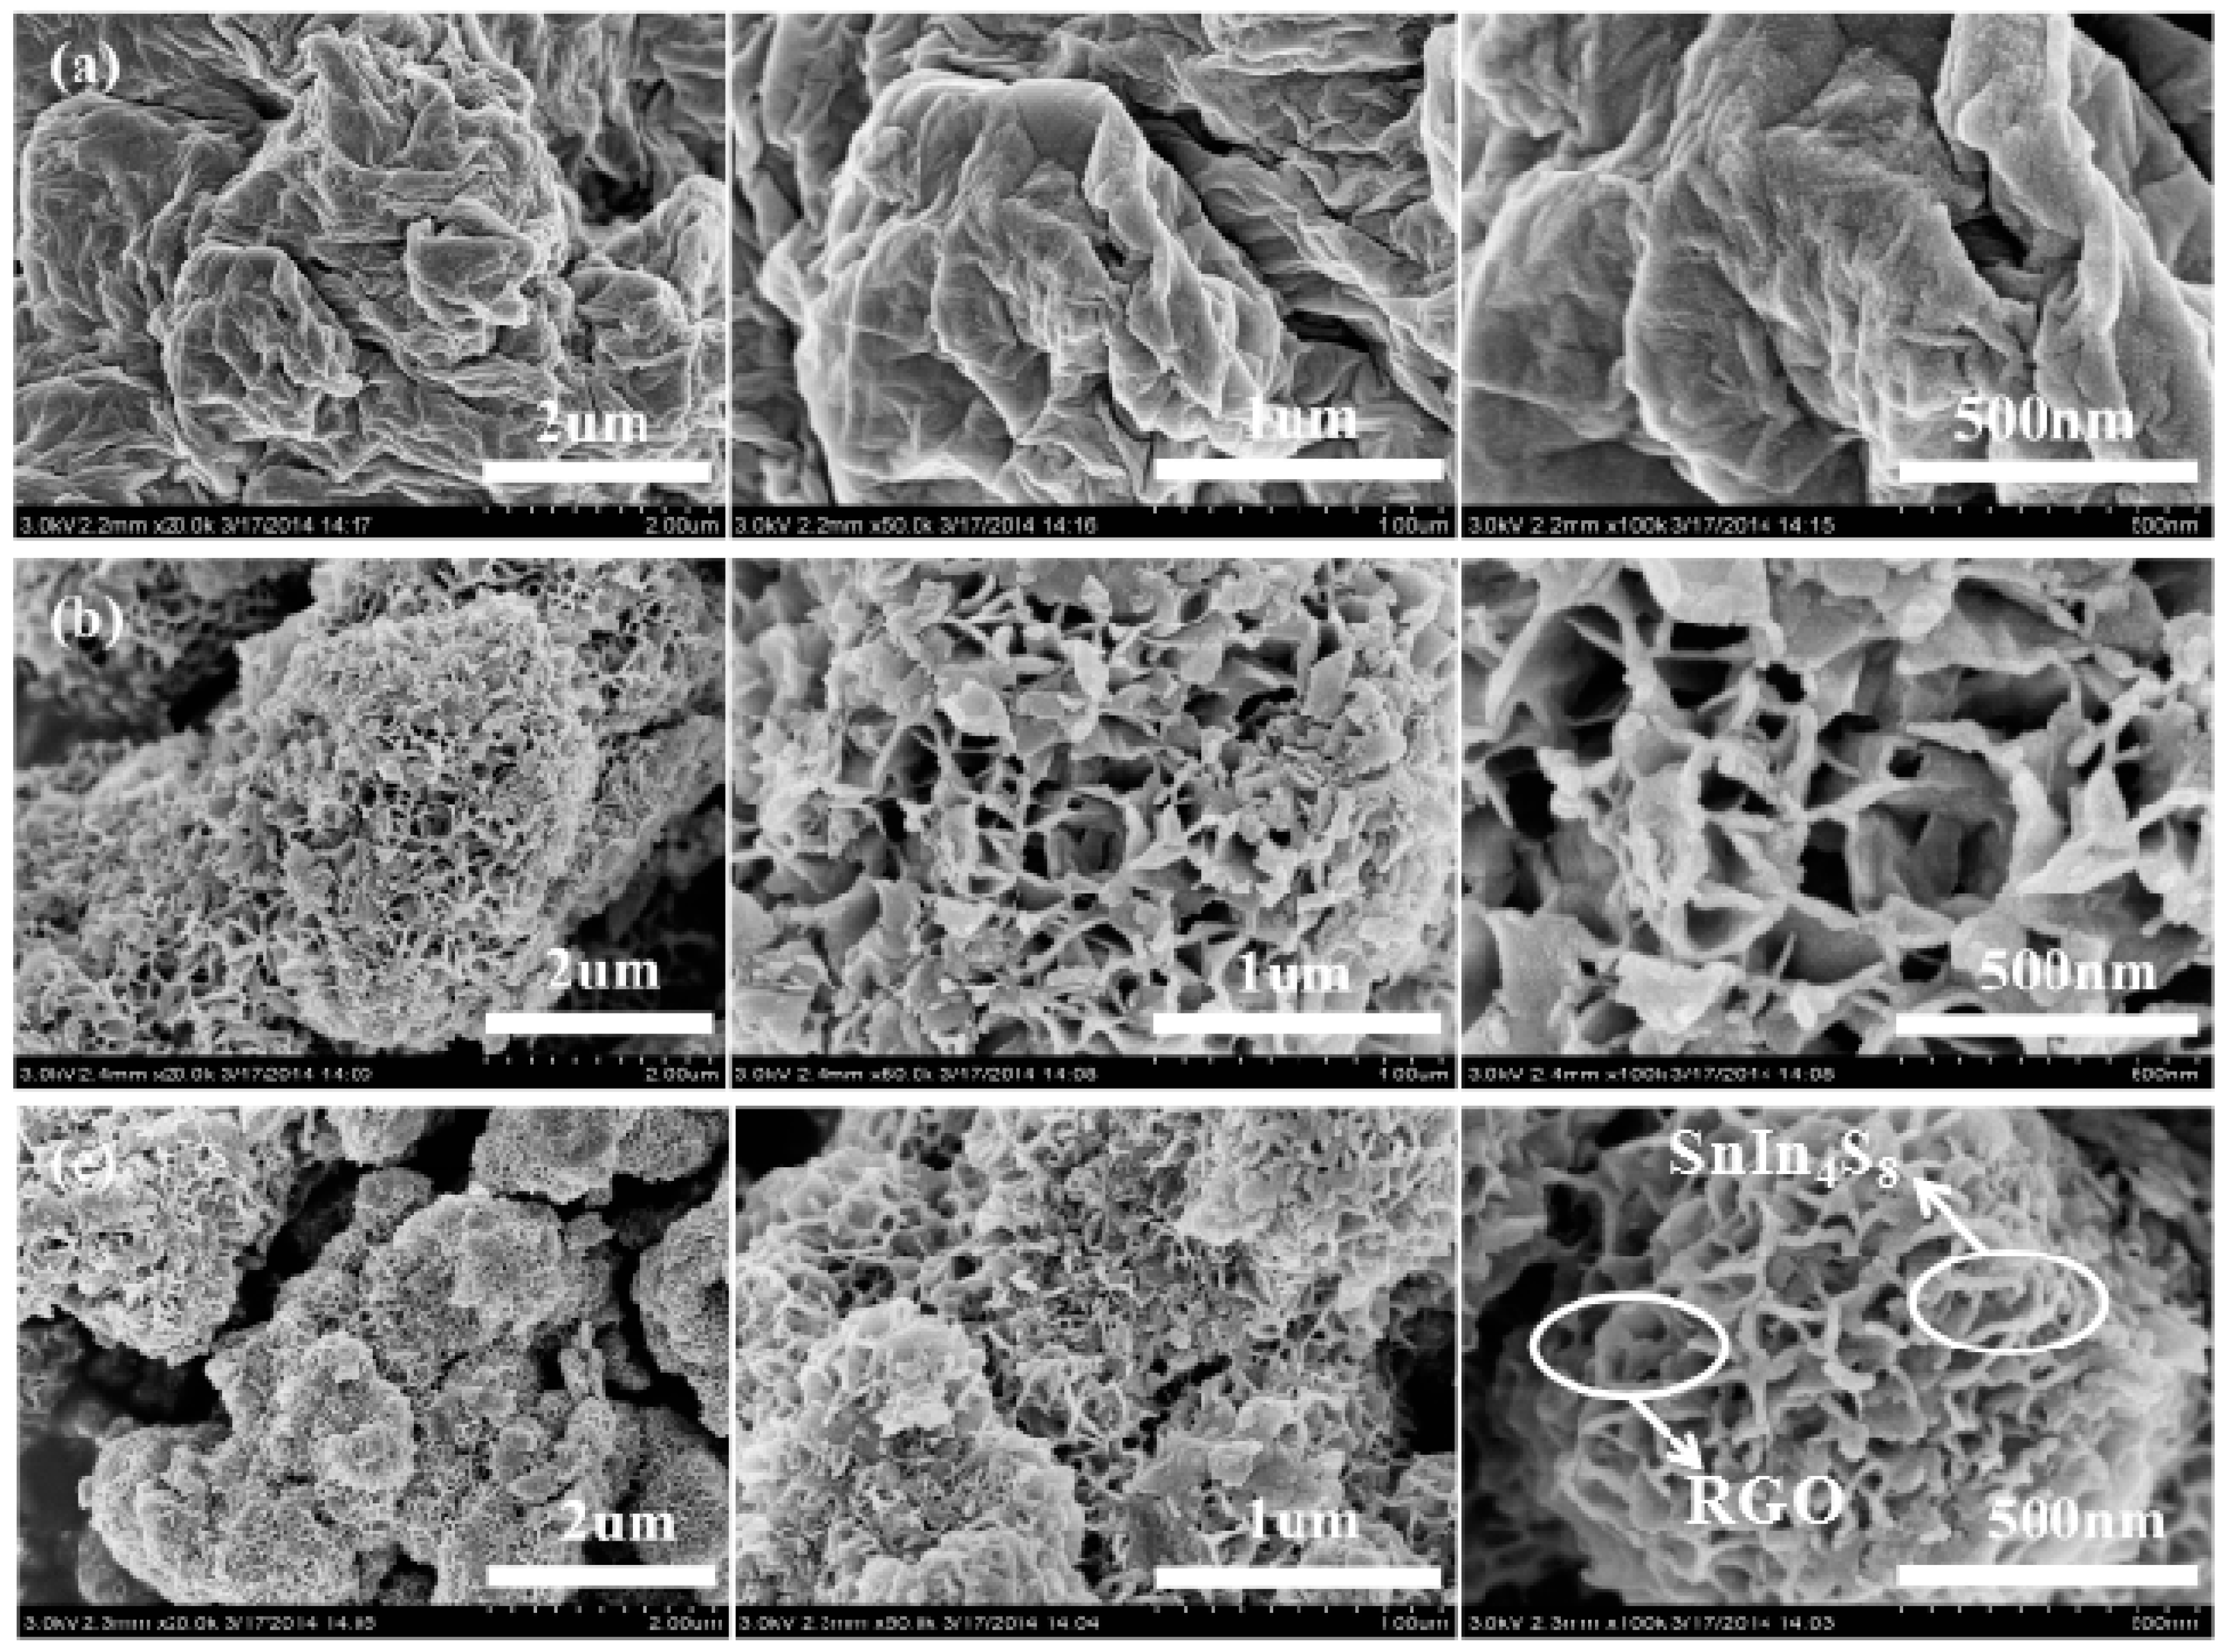
2.1. Morphology Analysis
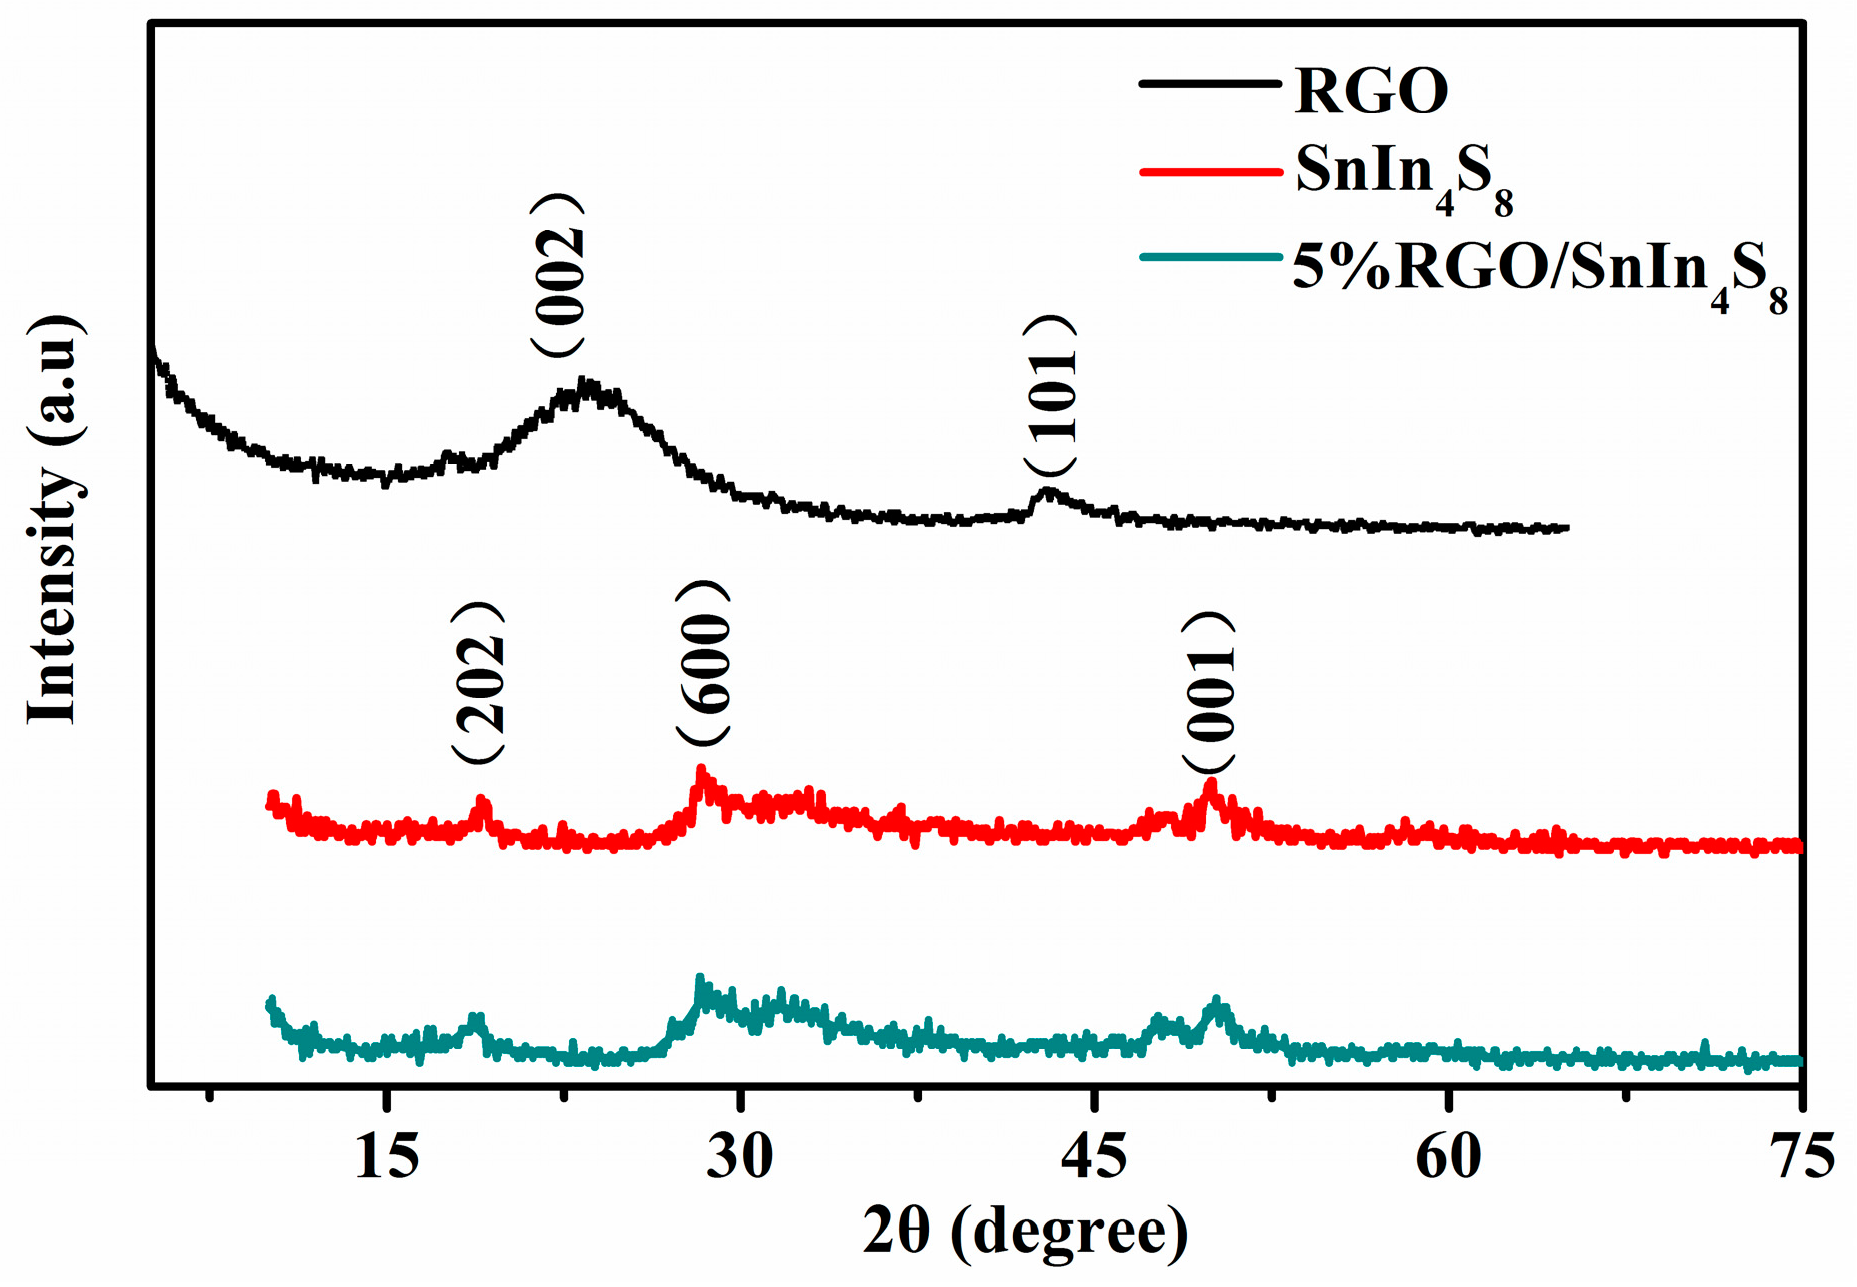
SEM images of RGO, pure SnIn4S8 and RGO/SnIn4S8 composite are shown in Figure 1. As shown in Figure 1a, the bare RGO is full of wrinkles, and the wrinkles form a curled and corrugated morphology. Pure SnIn4S8 possesses a network-like superstructure, which is constructed by numerous two-dimensional (2D) nanosheets with a thickness of about 10 nm. The assembly of the nanosheets produces abundant hierarchical pores at nanoscale (Figure 1b). In the case of the RGO/SnIn4S8 composite (Figure 1c), the nanosheets become obviously thinner, and the hierarchical pores between the nanosheets are smaller than those of pure SnIn4S8.

2.2. XRD Analysis

Figure 2 shows the XRD patterns of bare RGO, pure SnIn4S8 and RGO/SnIn4S8 composite. It is obvious that bare RGO shows two characteristic diffraction peaks at 22.9° and 42.7°, corresponding to (002) and (100) planes of RGO [32]. The pure SnIn4S8 and RGO/SnIn4S8 composite have similar XRD profiles. The main diffraction peaks are observed at about 2θ = 19.0°, 28.4° and 50.1°, which can be indexed to the (202), (600) and (001) crystalline planes of tetragonal phase of SnIn4S8, respectively [33]. However, no RGO characteristic diffraction peaks are found in the XRD patterns of RGO/SnIn4S8 composite, which is possibly due to the limited amount and the destroyed regular stacks of RGO in the composite [34].

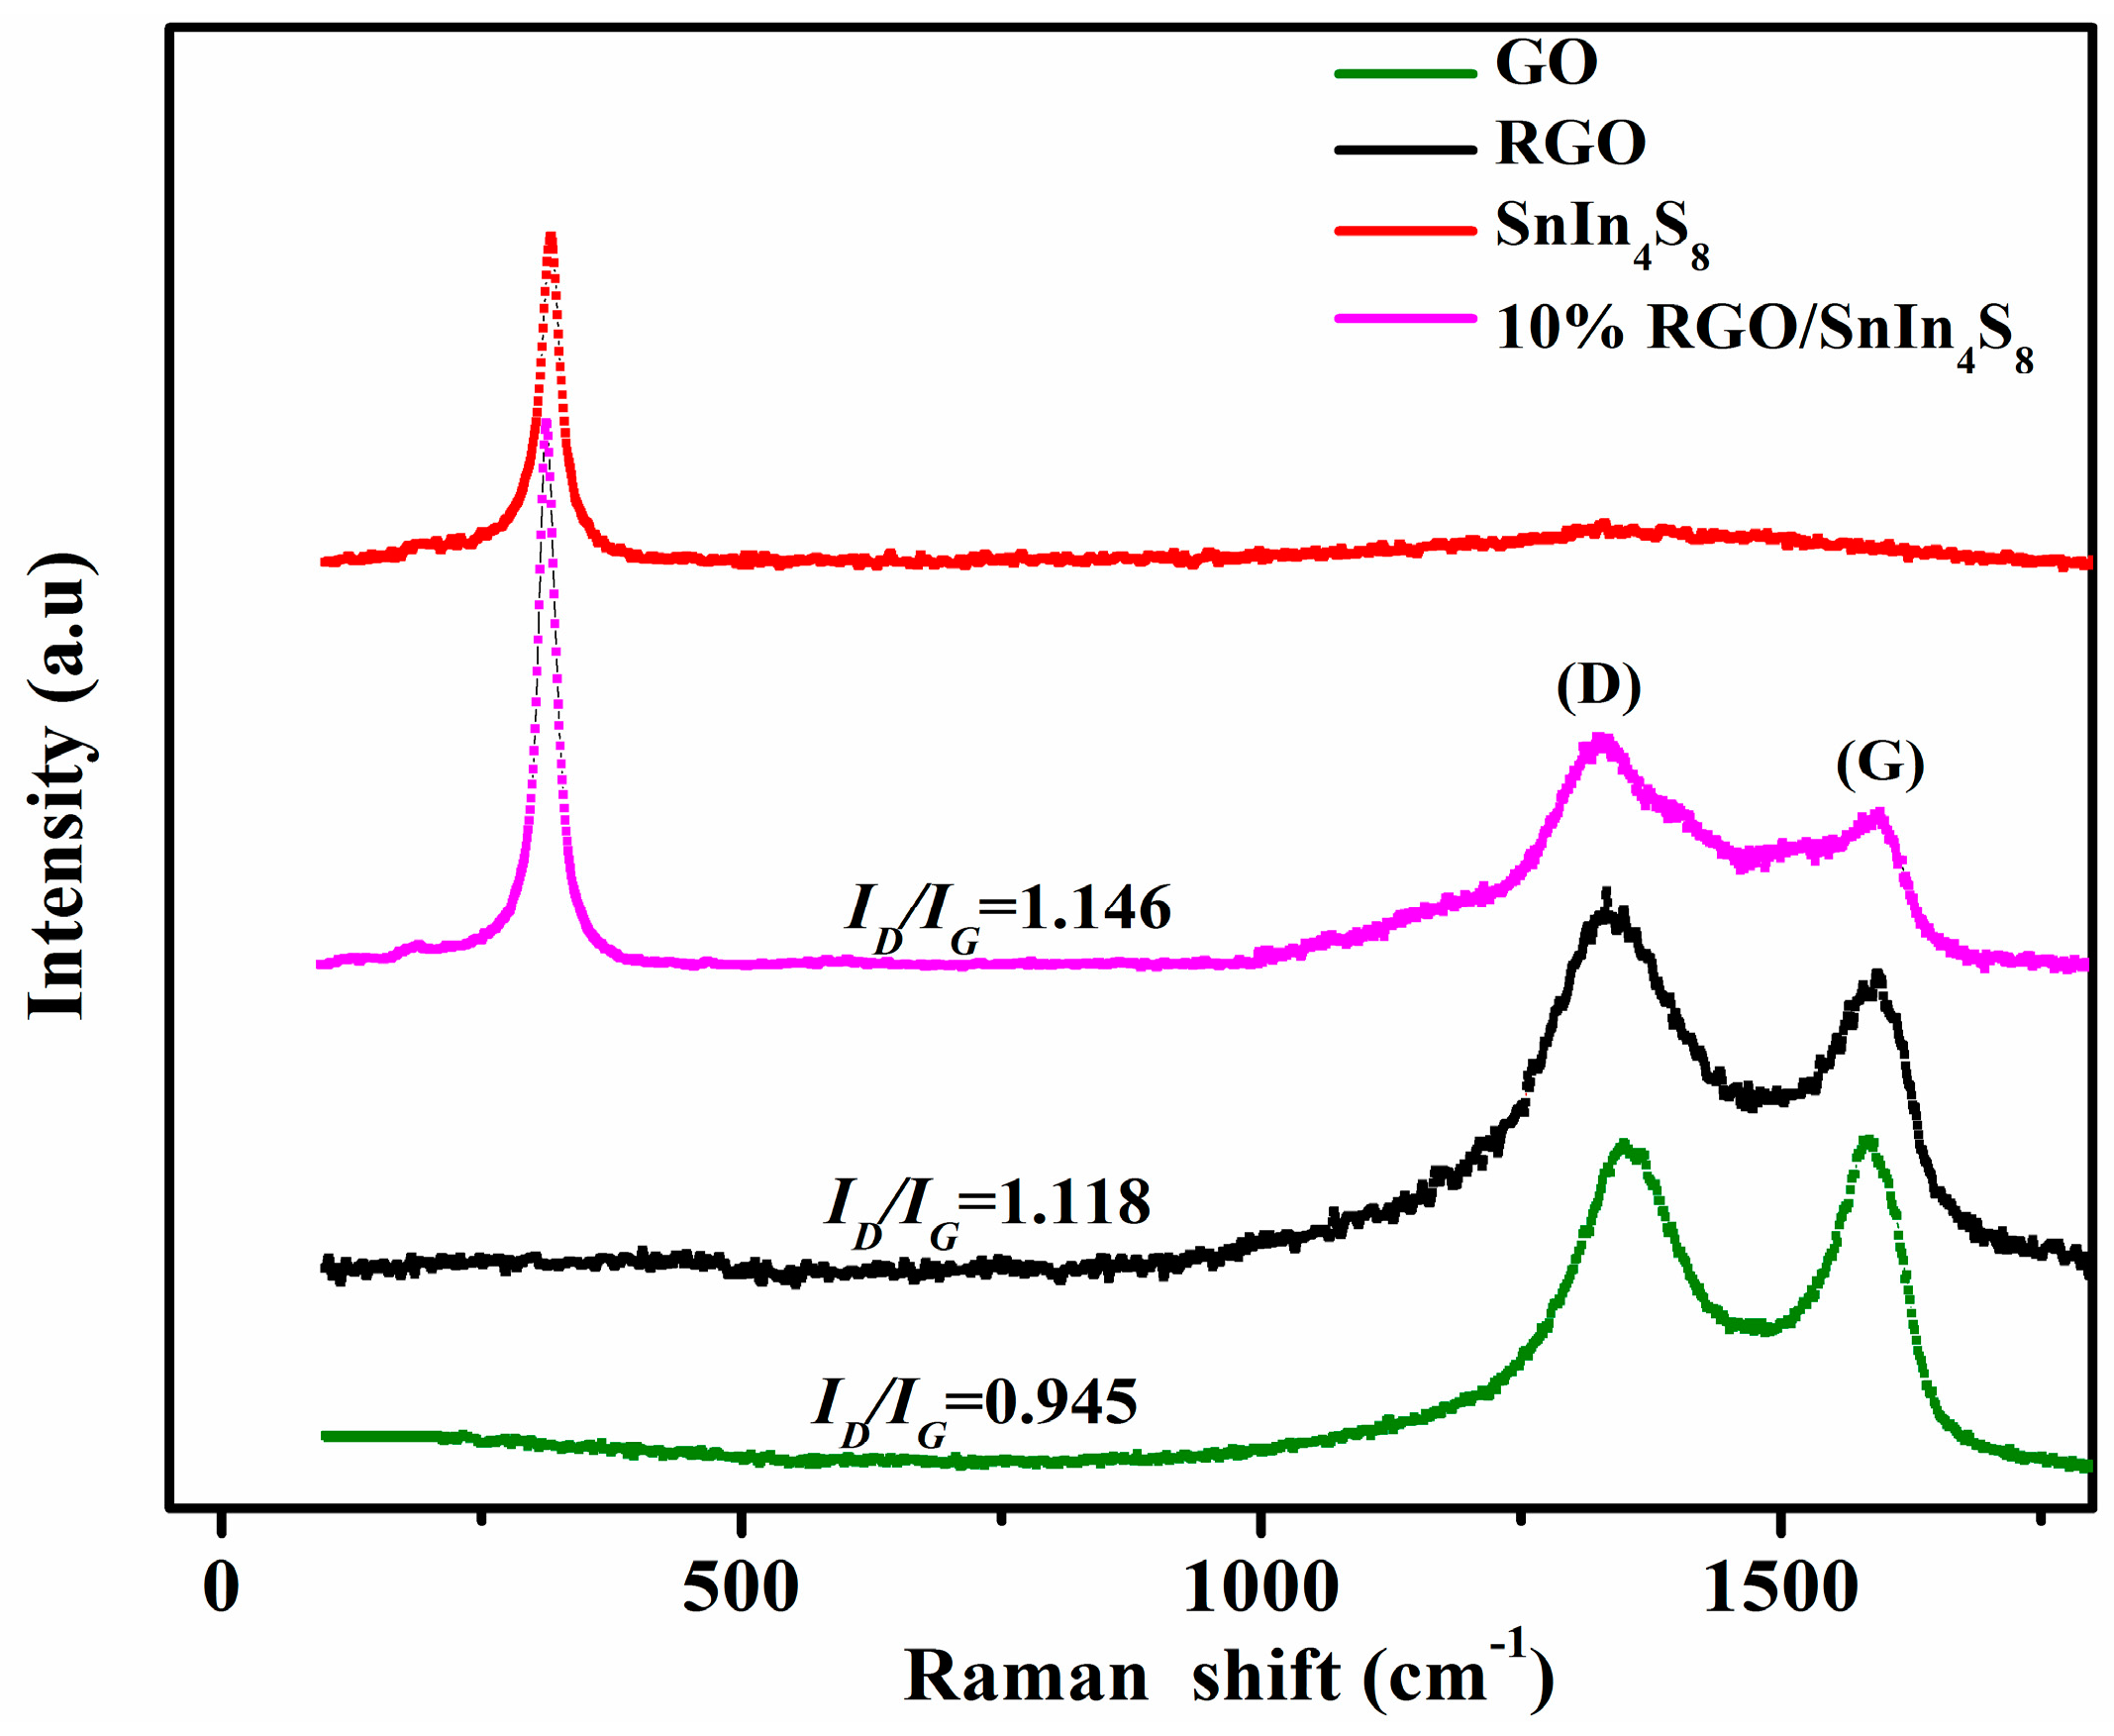
2.3. Raman Spectroscopy

It is well known that Raman spectroscopy is a powerful method for the characterization of sp2 and sp3 hybridized carbon atoms in graphene to distinguish the ordered and disordered/defect structures. Therefore, Raman spectroscopy of GO, RGO, SnIn4S8 and RGO/SnIn4S8 composite was carried out (Figure 3). The two characteristic peaks of GO can be found at 1350 and 1585 cm−1, corresponding to the D band (disorder peak) and G band (graphitic peak), respectively. The D band and G band of RGO located at 1344 and 1599 cm−1, respectively. The shift of D band to around 1344 cm−1 indicates the considerable increase in thickness of graphitic structure and size of the in-plane sp2 domains [35]. In case of SnIn4S8, SnIn4S8 shows strong Raman characteristic peaks at 323 cm−1. For the RGO/SnIn4S8 composite, we observed the characteristic bands of SnIn4S8 at 323 cm−1 as well as the D band (ca. 1329 cm−1) and G band (ca. 1602 cm−1) of RGO, suggesting that the structure of RGO is maintained in the RGO/SnIn4S8 composite. The intensity ratio of D band to G band (ID/IG) can estimate the degree of disorder/defects in graphene. The ID/IG of GO is about 0.945, while the ID/IG of RGO and RGO/SnIn4S8 composite is about 1.118 and 1.146, respectively. The increase of ID/IG is attributed to the reduction and restoration of the sp2 network of GO during the reduction process and the formation of more defects in RGO.

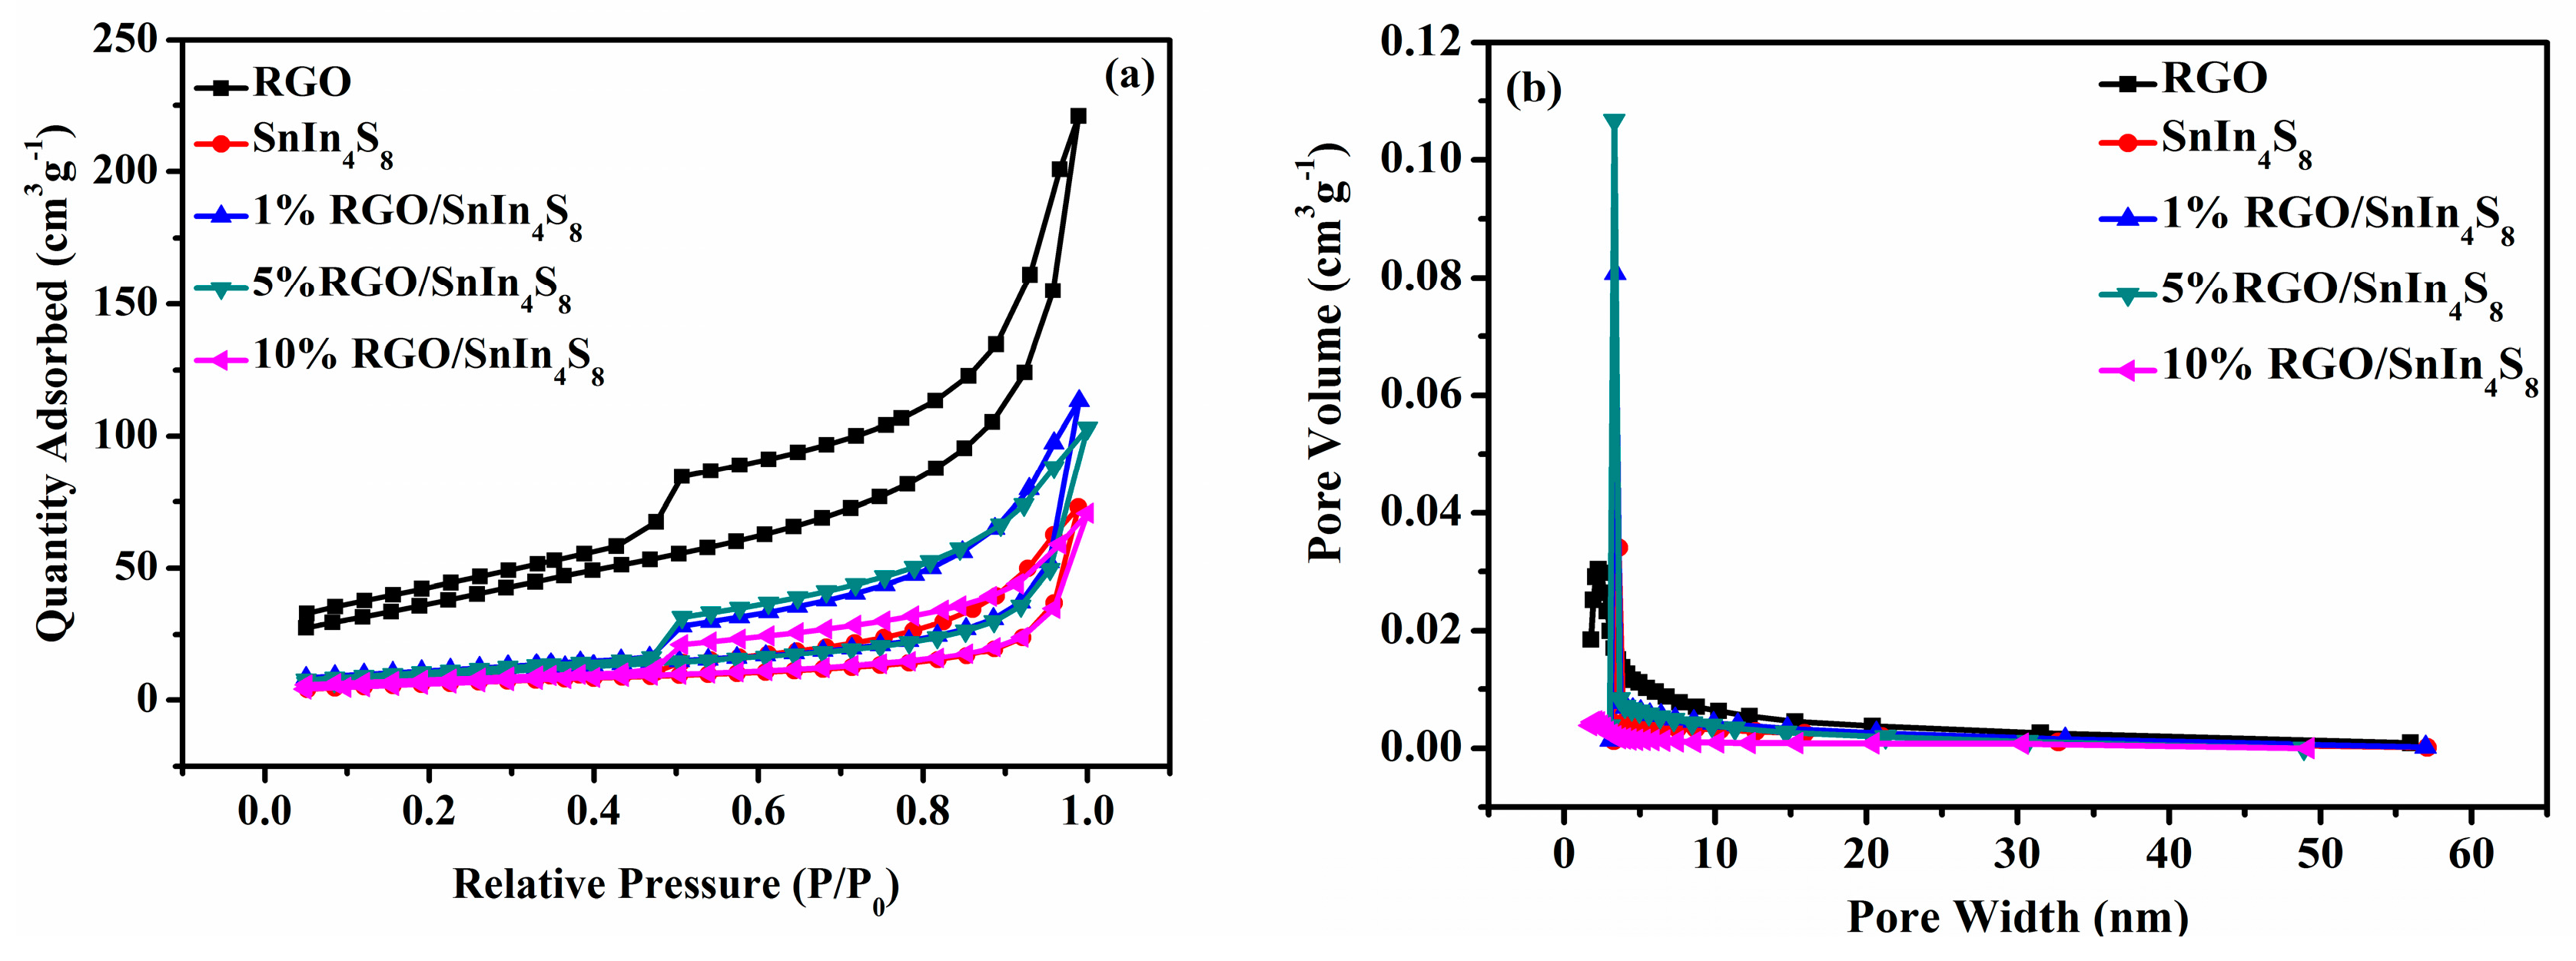
2.4. BET Surface Areas and Pore Structures

The Brunauer-Emmet-Teller (BET) surface area and pore structure play important roles in the photocatalytic performance of photocatalysts. Figure 4 shows the nitrogen adsorption-desorption isotherms and the corresponding pore size distribution curves of RGO, pure SnIn4S8 and RGO/SnIn4S8 composites with different RGO content. The nitrogen adsorption-desorption curves of these samples are type IV (Brunauer-Deming-Deming-Teller (BDDT) classification), indicating the presence of mesopores [36]. These isotherms exhibit H3 hysteresis loops, suggesting that slit-like pores were formed by the aggregation of plate-like particles, which is consistent with the above SEM analysis. The results of BET surface area, pore volume, and average pore size of RGO, pure SnIn4S8 and RGO/SnIn4S8 are listed in Table 1. With the increase of RGO content in the composite samples, the specific surface area increases first and then decreases. When the content of RGO is 1% and 5%, the specific surface area is the largest (about 35 m2·g−1) [37,38,39].

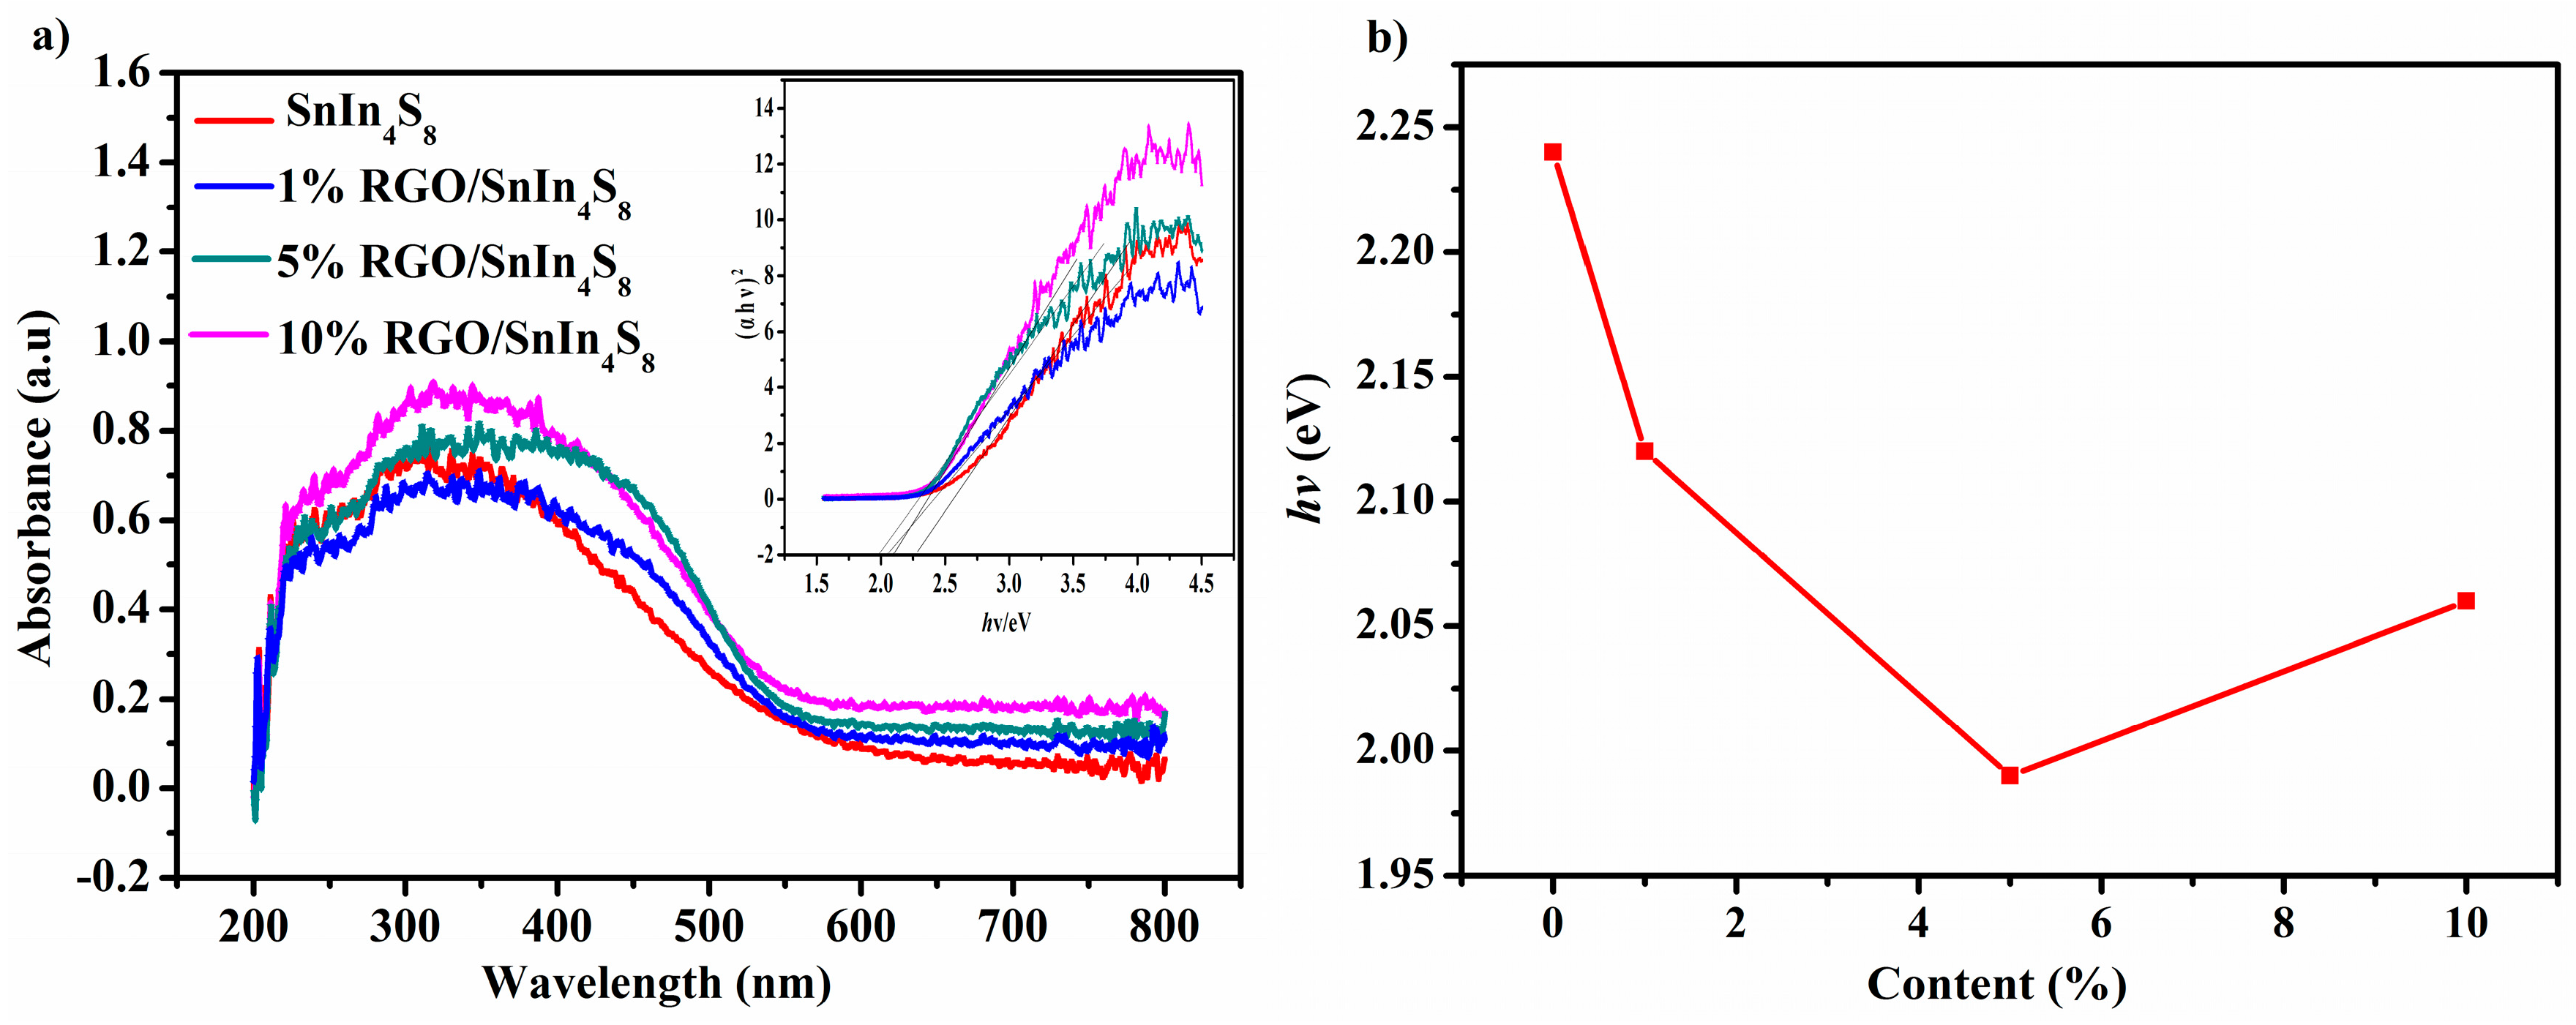
2.5. Optical Properties

Figure 5 shows the UV-Visible diffuse reflectance spectroscopy of pure SnIn4S8 and RGO/SnIn4S8 composites. Compared with pure SnIn4S8, the absorption of the RGO/SnIn4S8 composites obviously enhanced in ultraviolet (UV) and visible-light regions. Moreover, the absorption edge of the RGO/SnIn4S8 composites shows a red-shift to a higher wavelength, which is probably attributed to reduced reflection of light and the interfacial interaction between SnIn4S8 and RGO support to create a smooth charge–carrier transport [40].
The band gap energies (Eg) can be estimated from the following Kubelka−Munk equation:
( α h v ) n = k ( h v E g )
where α is the absorption coefficient, k is a constant, hv is the photonic energy, Eg is the absorption band gap energy, n is 2 and 1/2 for a direct and indirect band gap semiconductor, respectively. Plot of (αhv)2 against hv based on the direct transition is shown in inset of Figure 5. According to the inset of Figure 5, the Eg of pure SnIn4S8, 1% RGO/SnIn4S8, 5% RGO/SnIn4S8 and 10% RGO/SnIn4S8 are estimated to be about 2.24, 2.12, 1.99 and 2.06 eV, respectively.

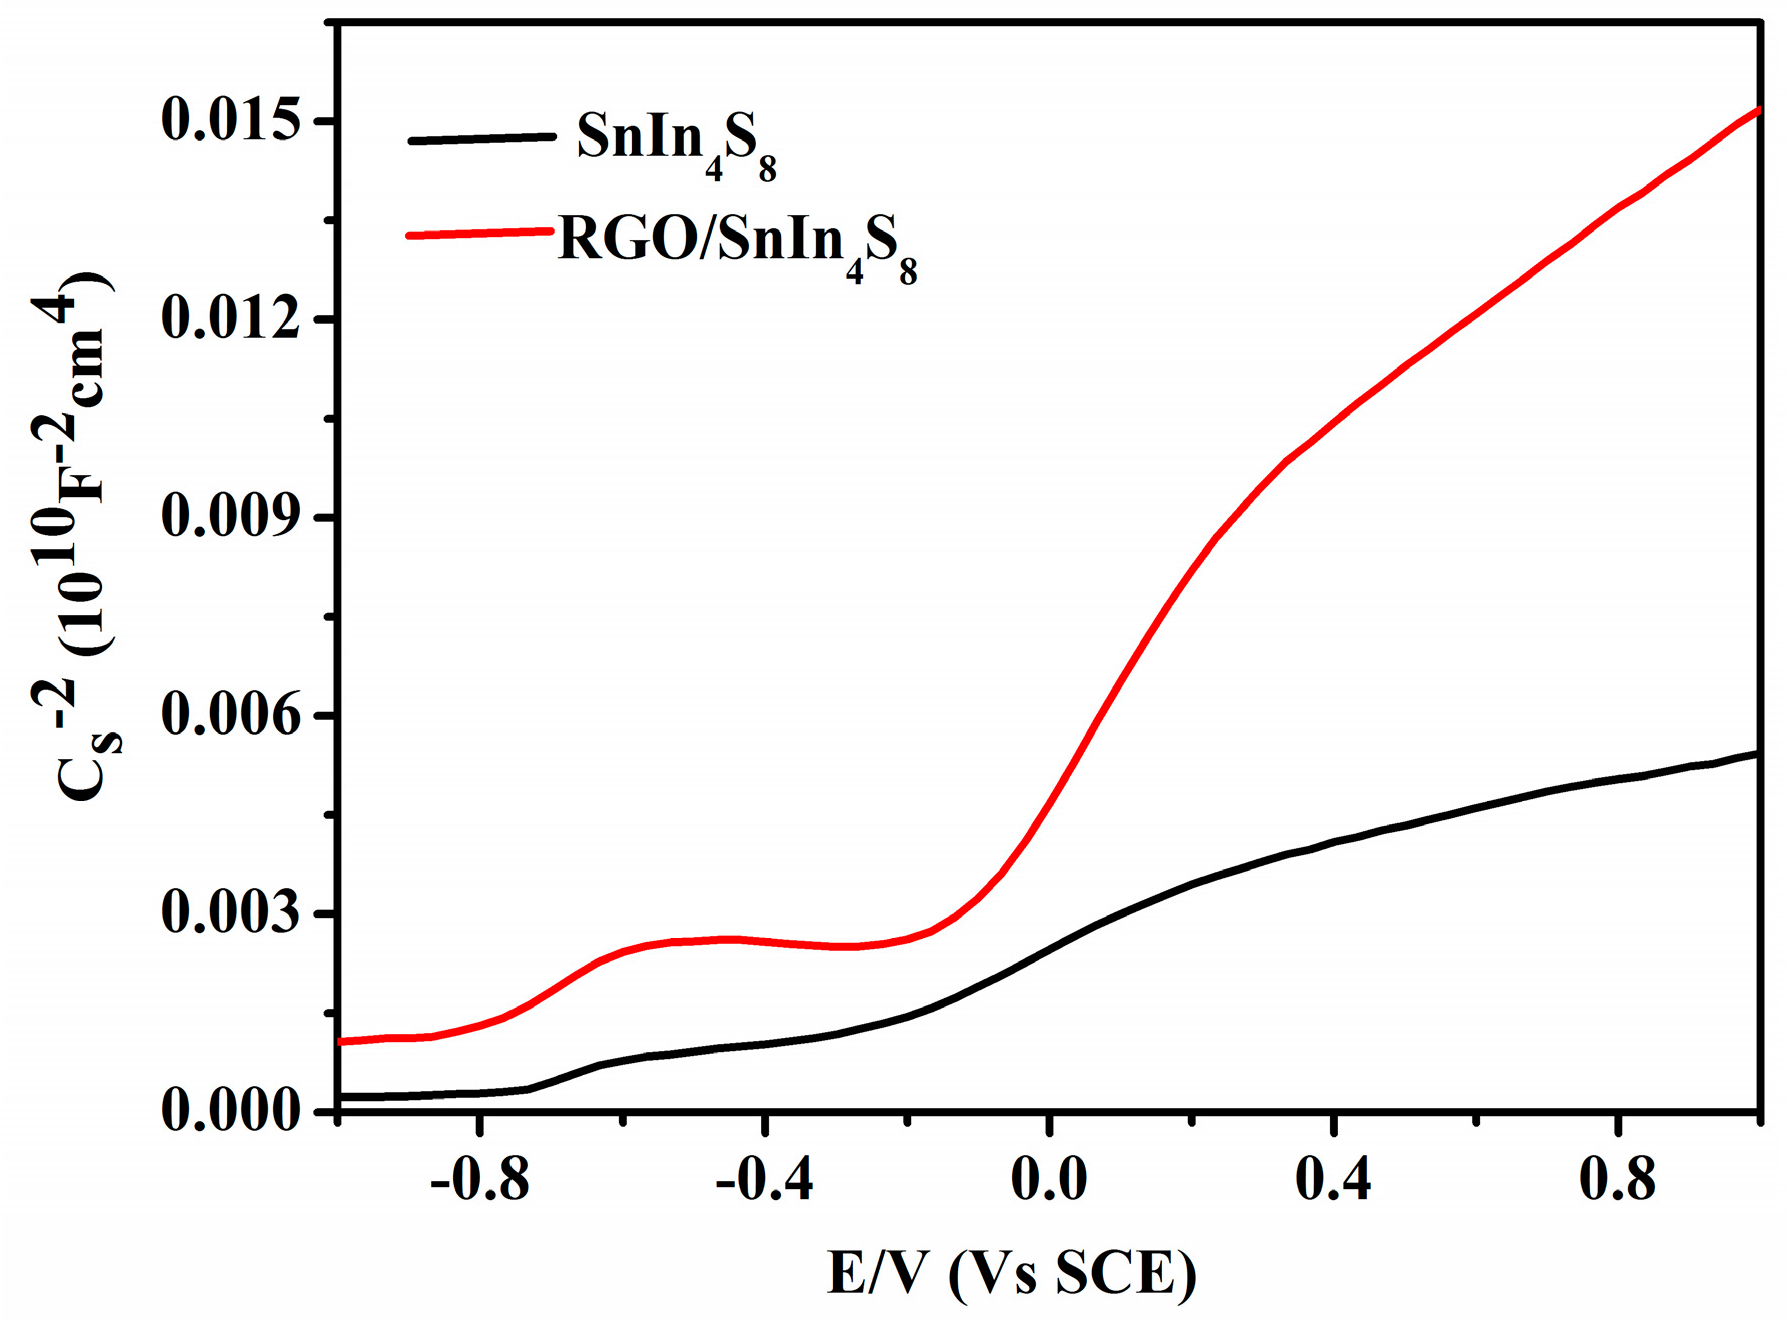
2.6. Mott-Schottky Analysis

The flat band potential (Efb) of pure SnIn4S8 and RGO/SnIn4S8 composite can be estimated from the Mott-Schottky equation:
1 C 2 = 2 ε ε 0 N d ( E E f b k B T e )
where C is the space charge capacitance, ε is the dielectric constant of the semiconductor, ε0 is the permittivity of free space, Nd is the donor density, E is the applied potential, Efb is the flat-band potential, kB is Boltzmann’s constant (1.38 × 10⁻²³ J·K−1), T is the absolute temperature, and e is the electronic charge. The positive slope of the linear part indicates that pure SnIn4S8 and RGO/SnIn4S8 composite show the characteristic of n-type semiconductor (Figure 6). The Efb value can be determined by extrapolating the linear part of the curve to 1 C 2 = 0, and the Efb values of SnIn4S8 and RGO/SnIn4S8 composite are −0.614 and −0.294 V versus the saturated calomel electrode (SCE), respectively. Supposing the difference between flat potential and conduction band can be negligible for n-type semiconductors [41], the Efb value is approximately equal to the ECB value. Compared with pure SnIn4S8, the ECB value of RGO/SnIn4S8 shifted to the positive direction, which could explain their enhanced photocatalytic activities. The electronic properties of pure SnIn4S8 and RGO/SnIn4S8 composite are listed in Table 2.

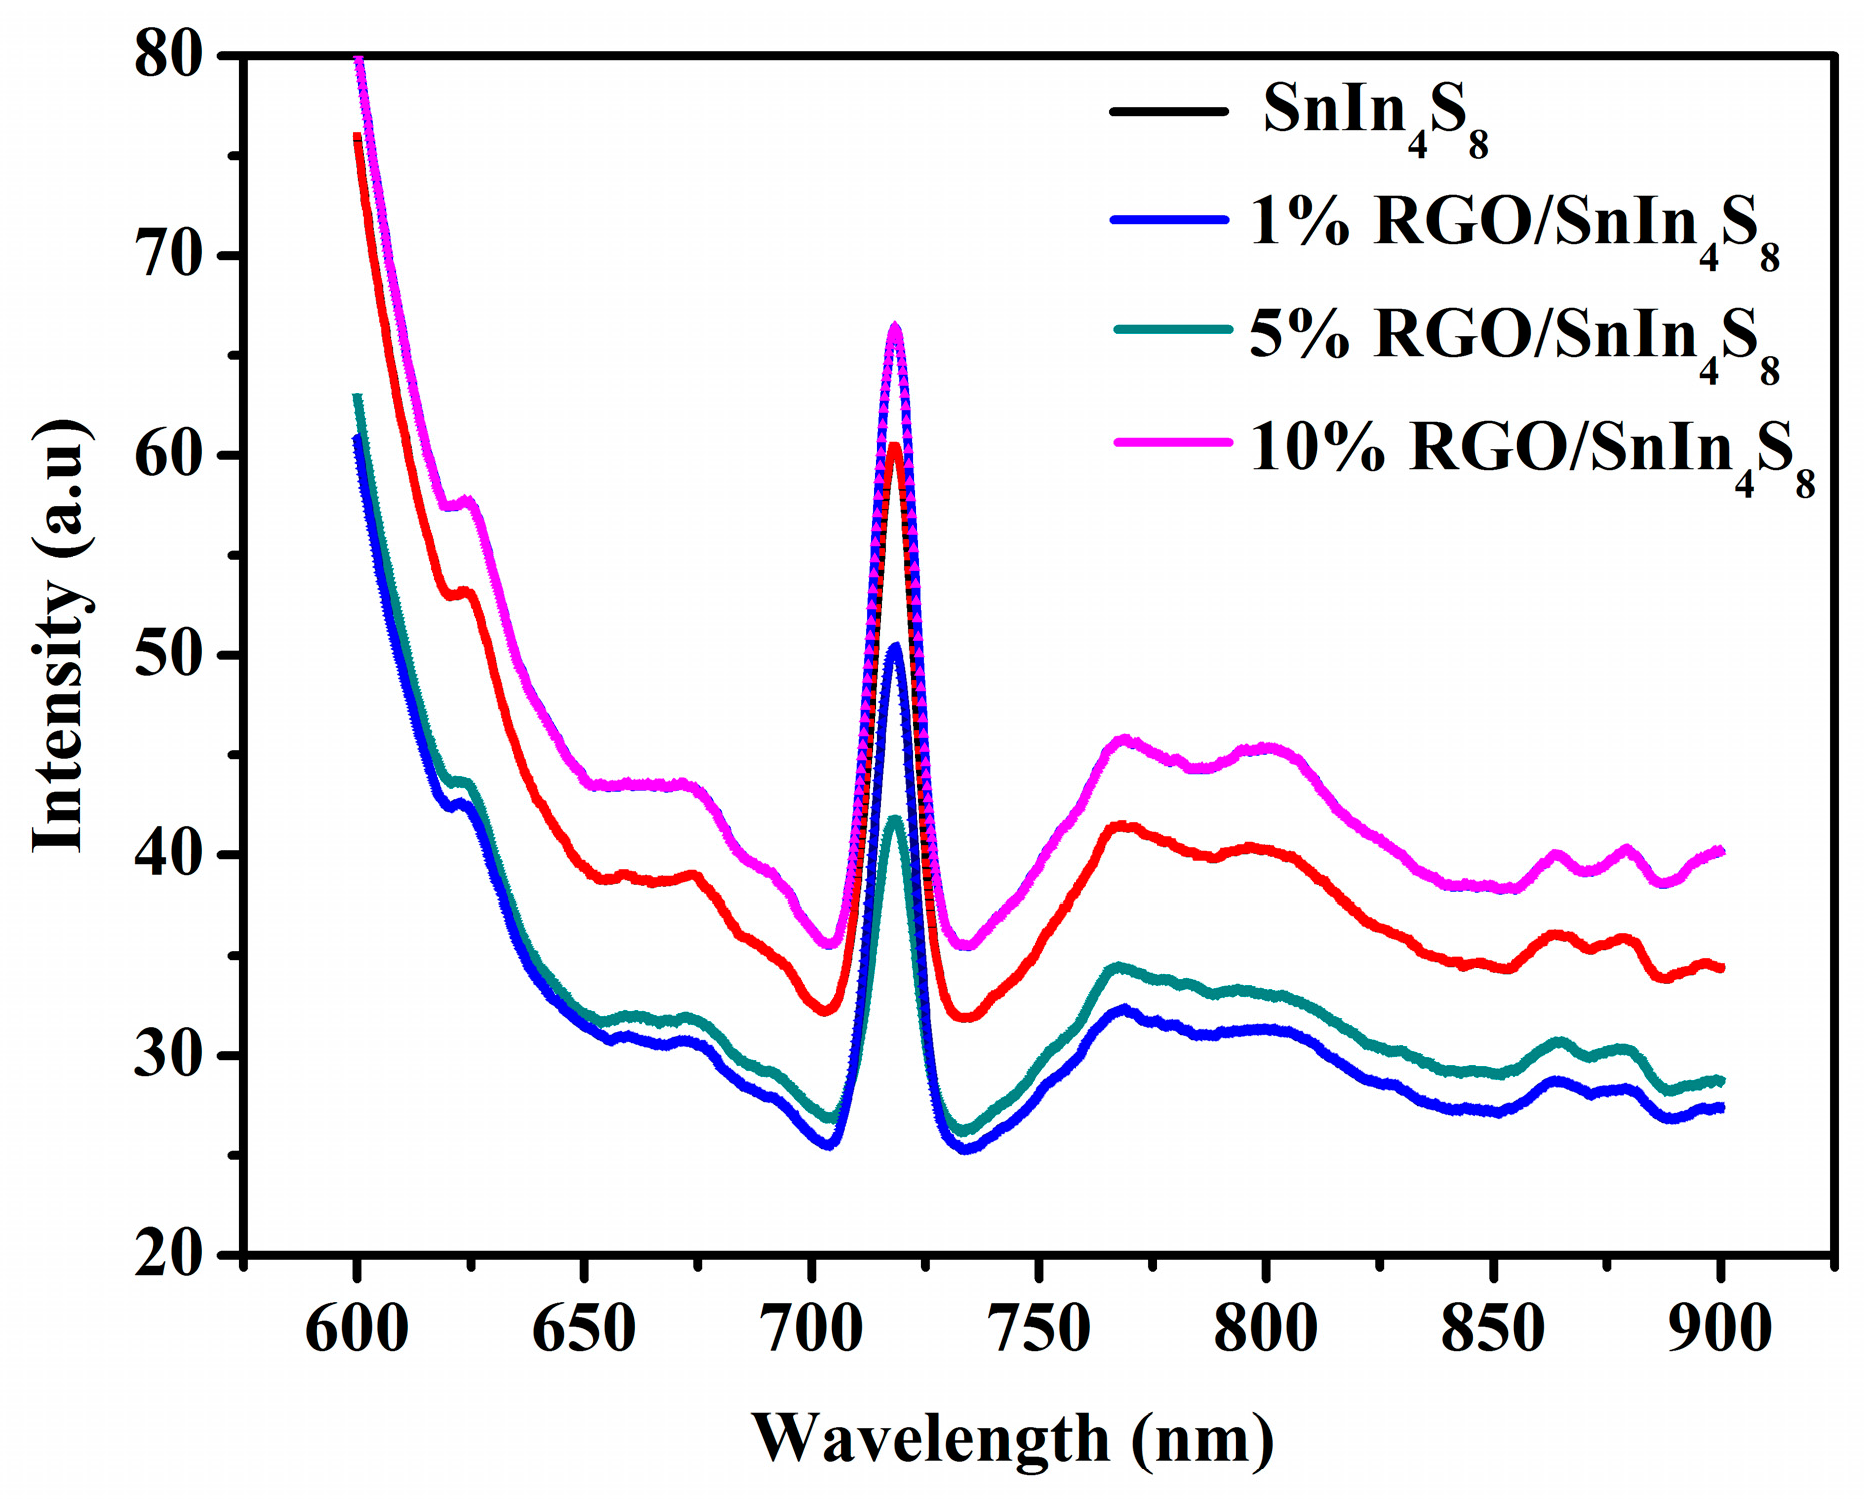
2.7. PL Emission Spectra

Figure 7 shows PL emission spectra of pure SnIn4S8 and RGO/SnIn4S8 composites with different RGO proportions. As displayed in Figure 7, with increasing RGO content from 0% to 5%, the PL intensity decreased, but further increasing RGO content from 5% to 10% resulted in the increase of PL signals. It can be seen that 5% RGO/SnIn4S8 composites gives the weakest PL intensity than that of all other samples. The results indicated that proper RGO content is able to retard the recombination of photogenerated electron–hole pairs more effectively, but excess RGO can promote the recombination of photogenerated electron–hole pairs.

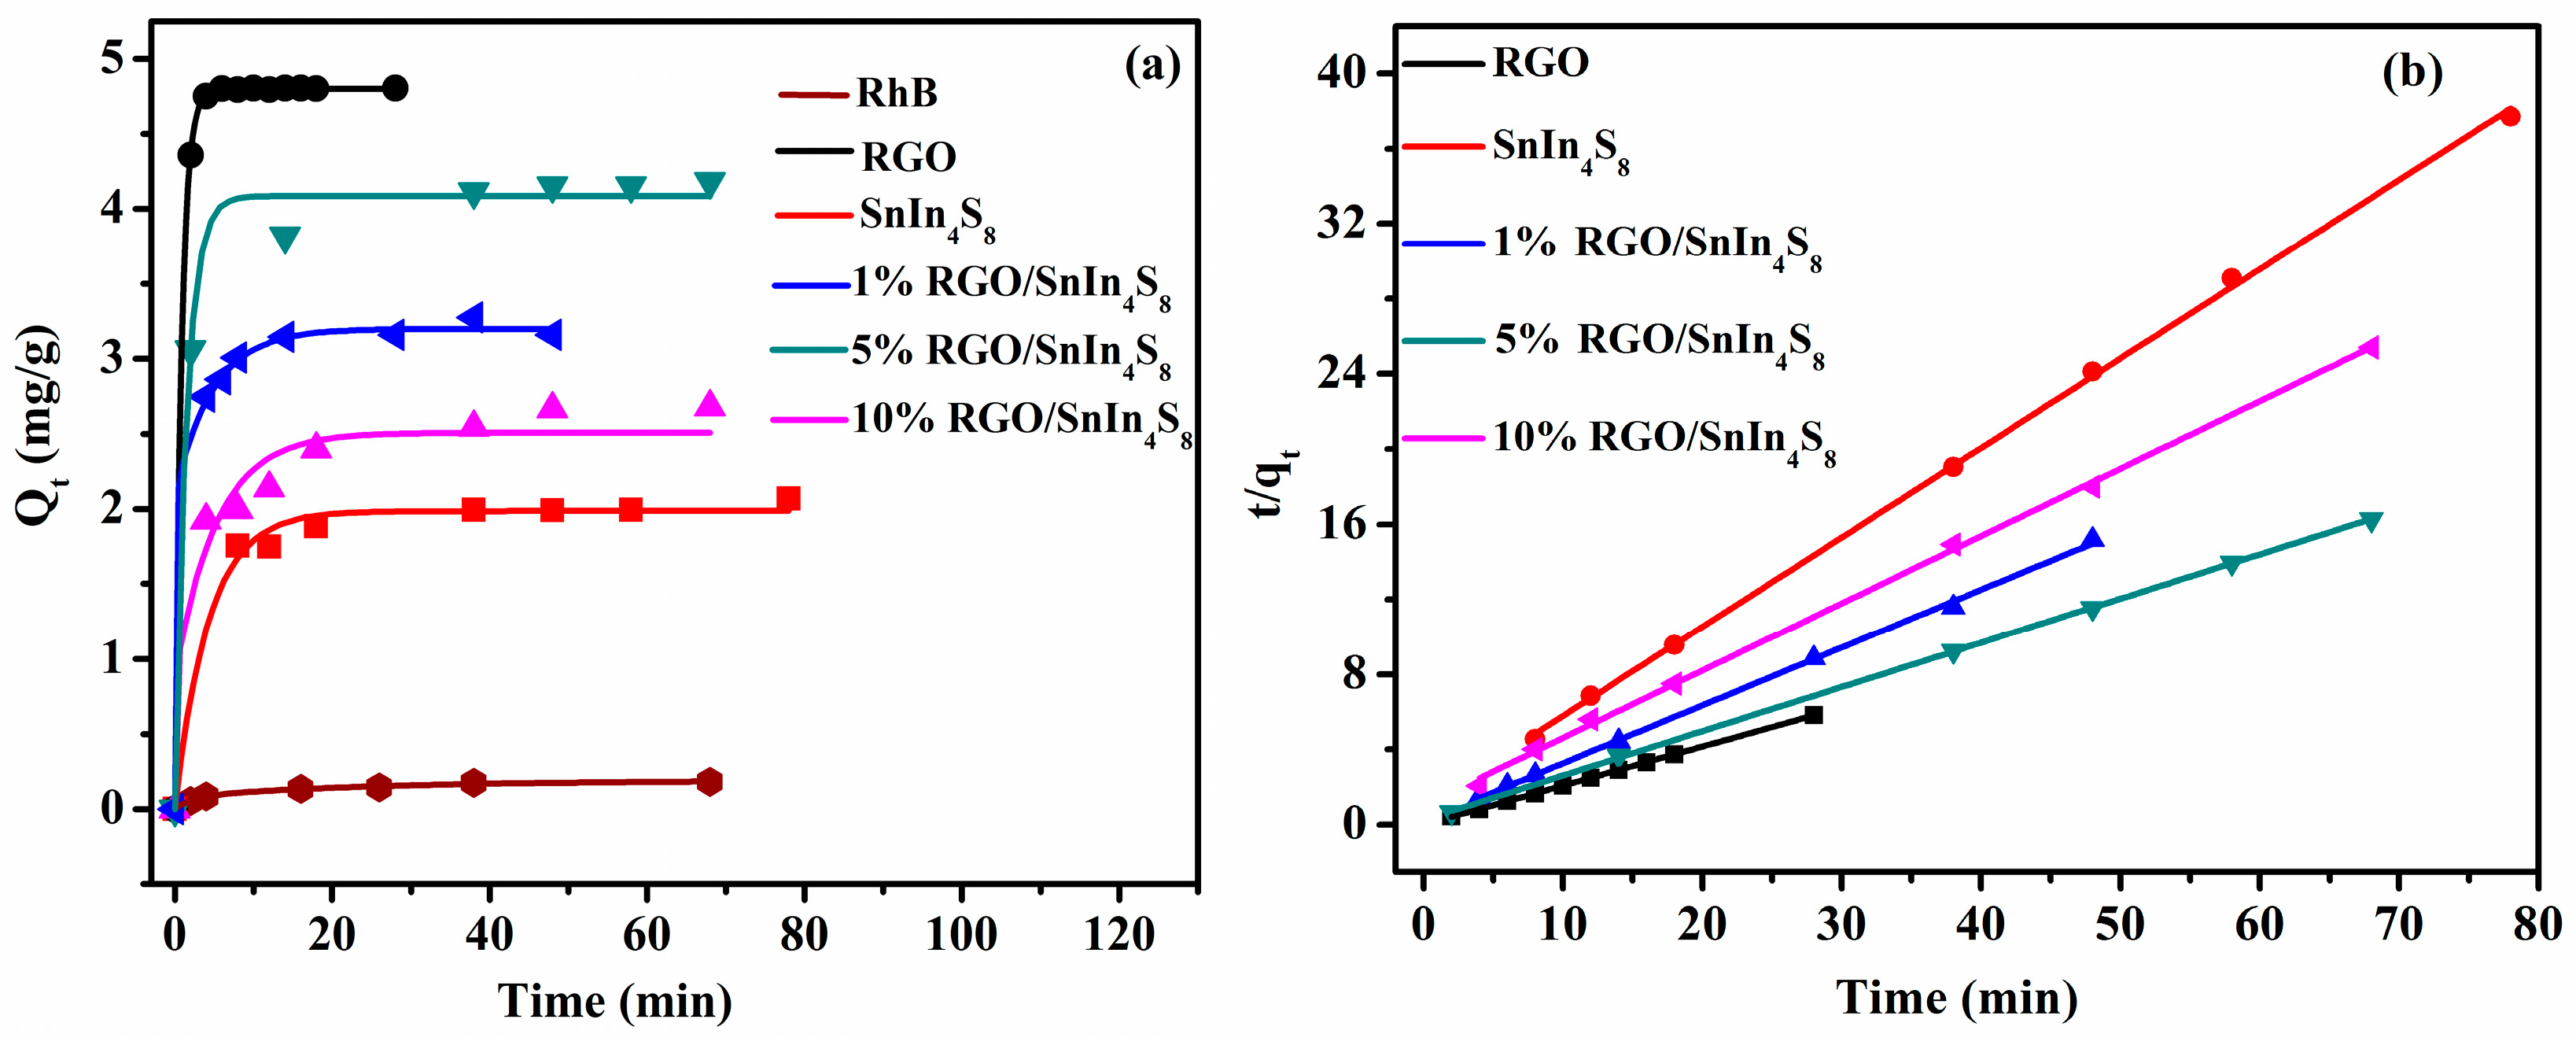
2.8. Adsorption Kinetics

Adsorption kinetics of pollutant molecules on photocatalysts is a key factor that could have an important influence on subsequent photocatalytic reaction. The adsorption kinetics of RhB on RGO, pure SnIn4S8 and RGO/SnIn4S8 composites with different RGO content was investigated in the dark, and the results are shown in Figure 8a. The adsorption amount of RhB on RGO, SnIn4S8 and RGO/SnIn4S8 increases rapidly with time during the first 15 min, then it increases slowly from 15 to 40 min, and finally it does not change, indicating that the adsorption/desorption equilibrium is established in 40 min. The equilibrium adsorption capacity of RGO, pure SnIn4S8 and RGO/SnIn4S8 composites with different RGO content based on experiment (qe,exp) is listed in Table 3.
The pseudo-first-order and pseudo-second-order equations were used to fit the adsorption kinetics data of RhB on RGO, pure SnIn4S8 and RGO/SnIn4S8 composites. The pseudo-first-order rate equation is expressed as
l n ( q e q t ) = K 1 t + l n q e
where qe and qt are the amounts of RhB adsorbed on photocatalysts at adsorption equilibrium and any time t, respectively (mg·g−1); K1 is adsorption rate constant (min−1). The K1, correlation coefficients (R2) and calculated qe (qe,cal) values established from pseudo-first-order equation are depicted in Table 3. The R2 values are relatively low, and the calculated qe,cal value is far from the experimental value (qe,exp), indicating that the adsorption dynamics of RhB on RGO, pure SnIn4S8 and RGO/SnIn4S8 composites do not follow the pseudo-first-order kinetic model.
The linear form of pseudo-second-order model is expressed as followed:
t q t = t q e + 1 K 2 q e 2
where qt and qe is the amount of adsorbate at any time t and adsorption equilibrium (mg·g−1), and K2 is the constant rate of pseudo-second-order adsorption (g·mg−1·min−1). The regression curve of t/qt versus t was rather linear (Figure 8b), and all parameters determined from pseudo-second-order model are also summarized in Table 3. The R2 values are close to 1, and the calculated qe (qe,cal) from the pseudo-second-order model is very close to the experimental value, suggesting that RhB adsorption on RGO, pure SnIn4S8 and RGO/SnIn4S8 composites followed the pseudo-second-order model with an important chemisorption process.

2.9. Photocatalytic Activities

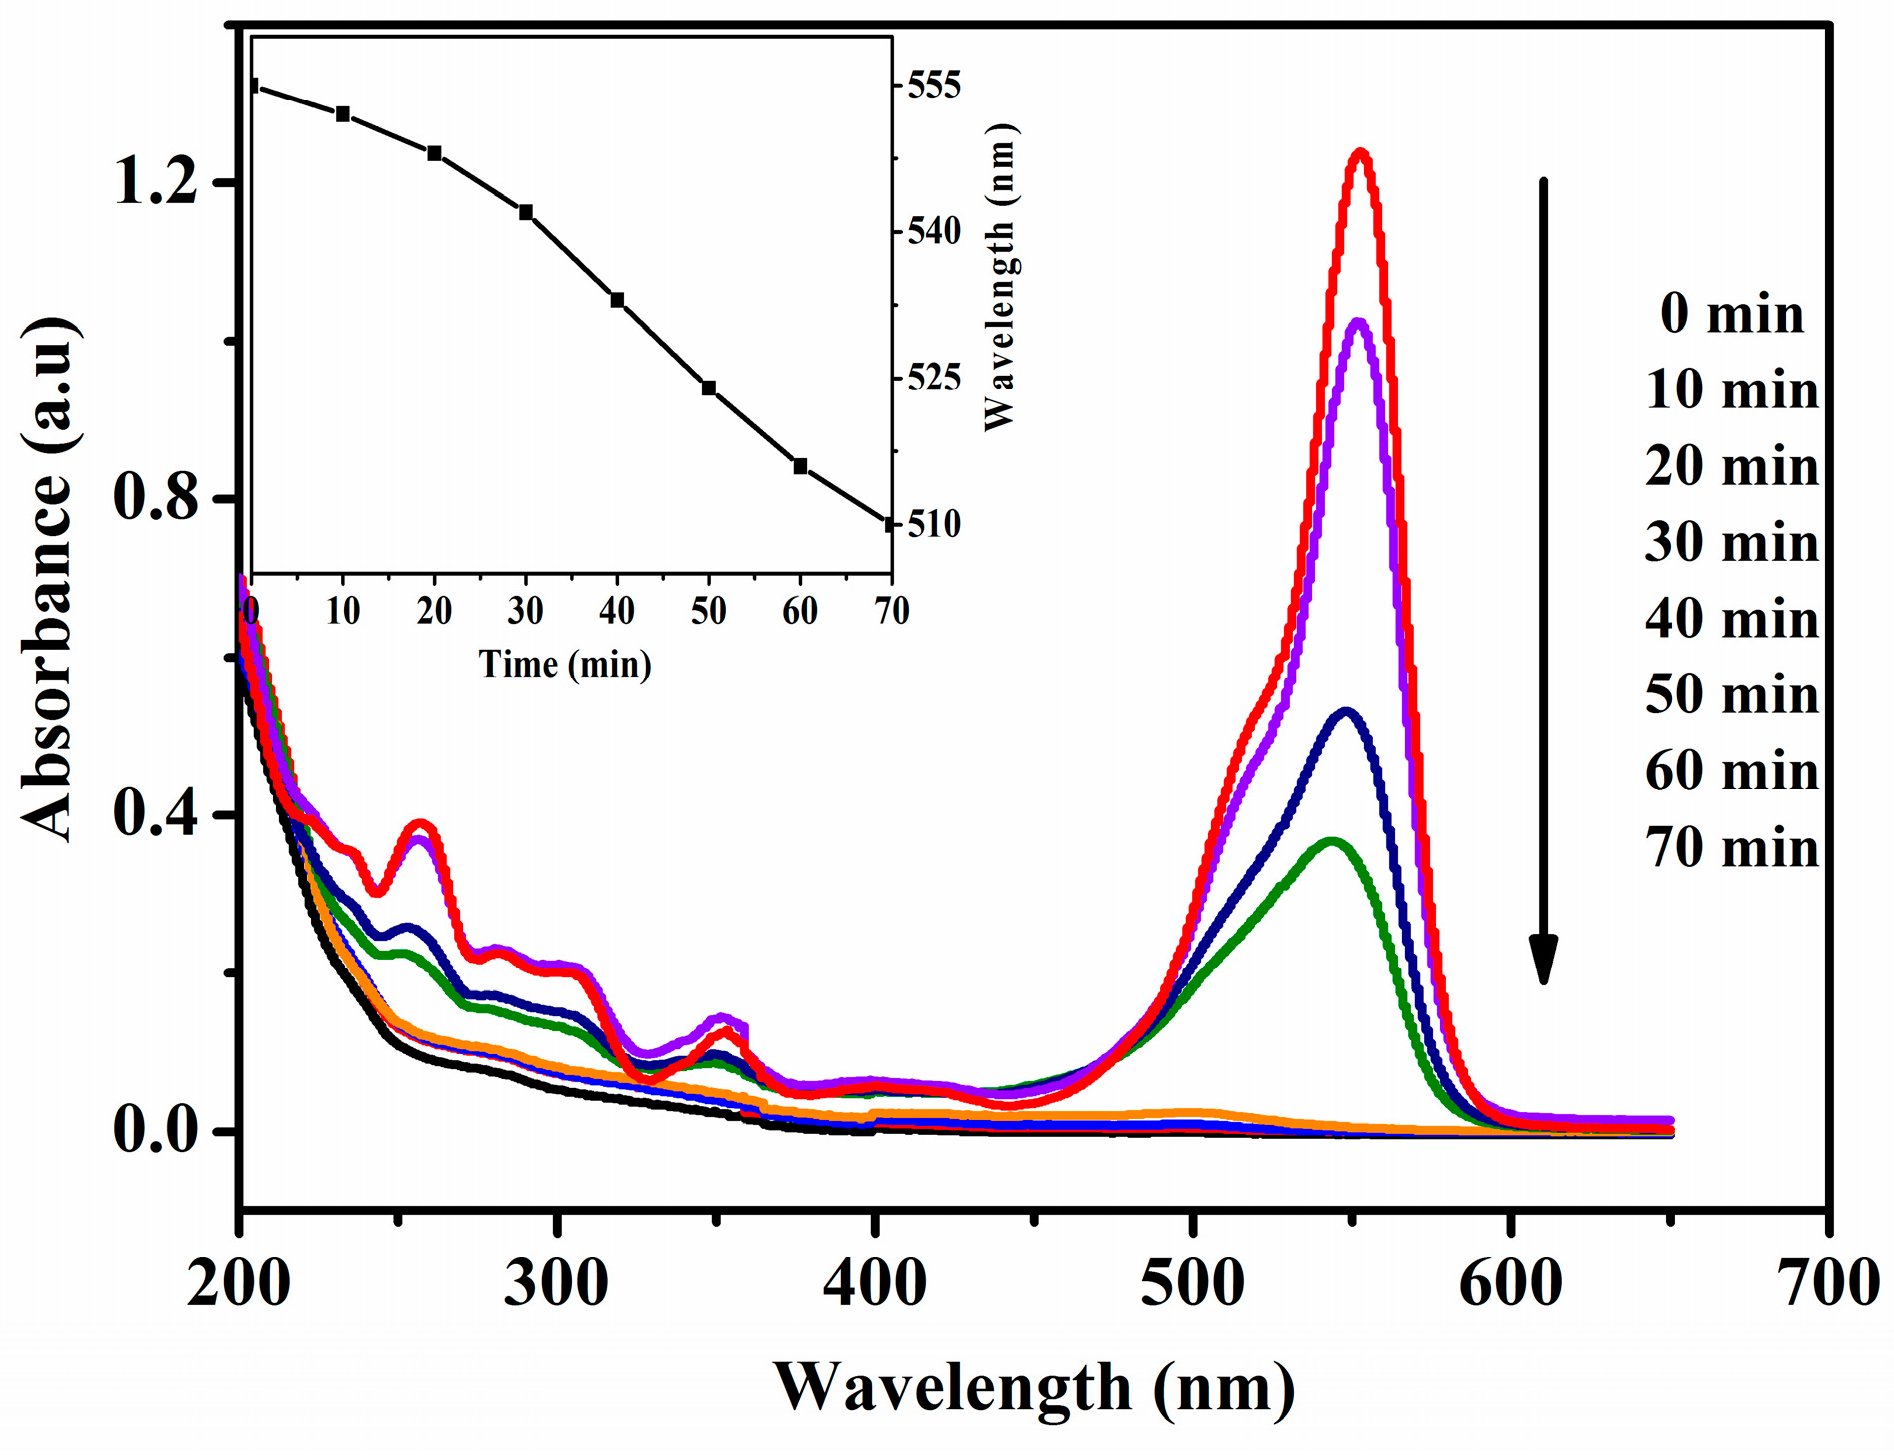
2.9.1. The Temporal Change of UV-Visible Spectra during the Photocatalytic Degradation

Figure 9 shows the UV-Visible spectral changes during the photocatalytic degradation of RhB under visible-light irradiation. As the reaction proceeds, the maximum absorption wavelength of RhB at 554 nm disappear quickly, and there are obvious hypsochromic shifts in the maximum absorption peak position, which shifts from 554 to 510 nm [42]. Moreover, the absorption intensity decreases. The inset shows the maximum absorption wavelength as a function of reaction time. During the early stage of photocatalytic degradation process, the peak positions did not change obviously because of the relatively high concentration of RhB and the low concentration of intermediate products. With a further degradation of RhB and the formation of abundant N-deethylated intermediate products, the blue-shift phenomenon became clear.

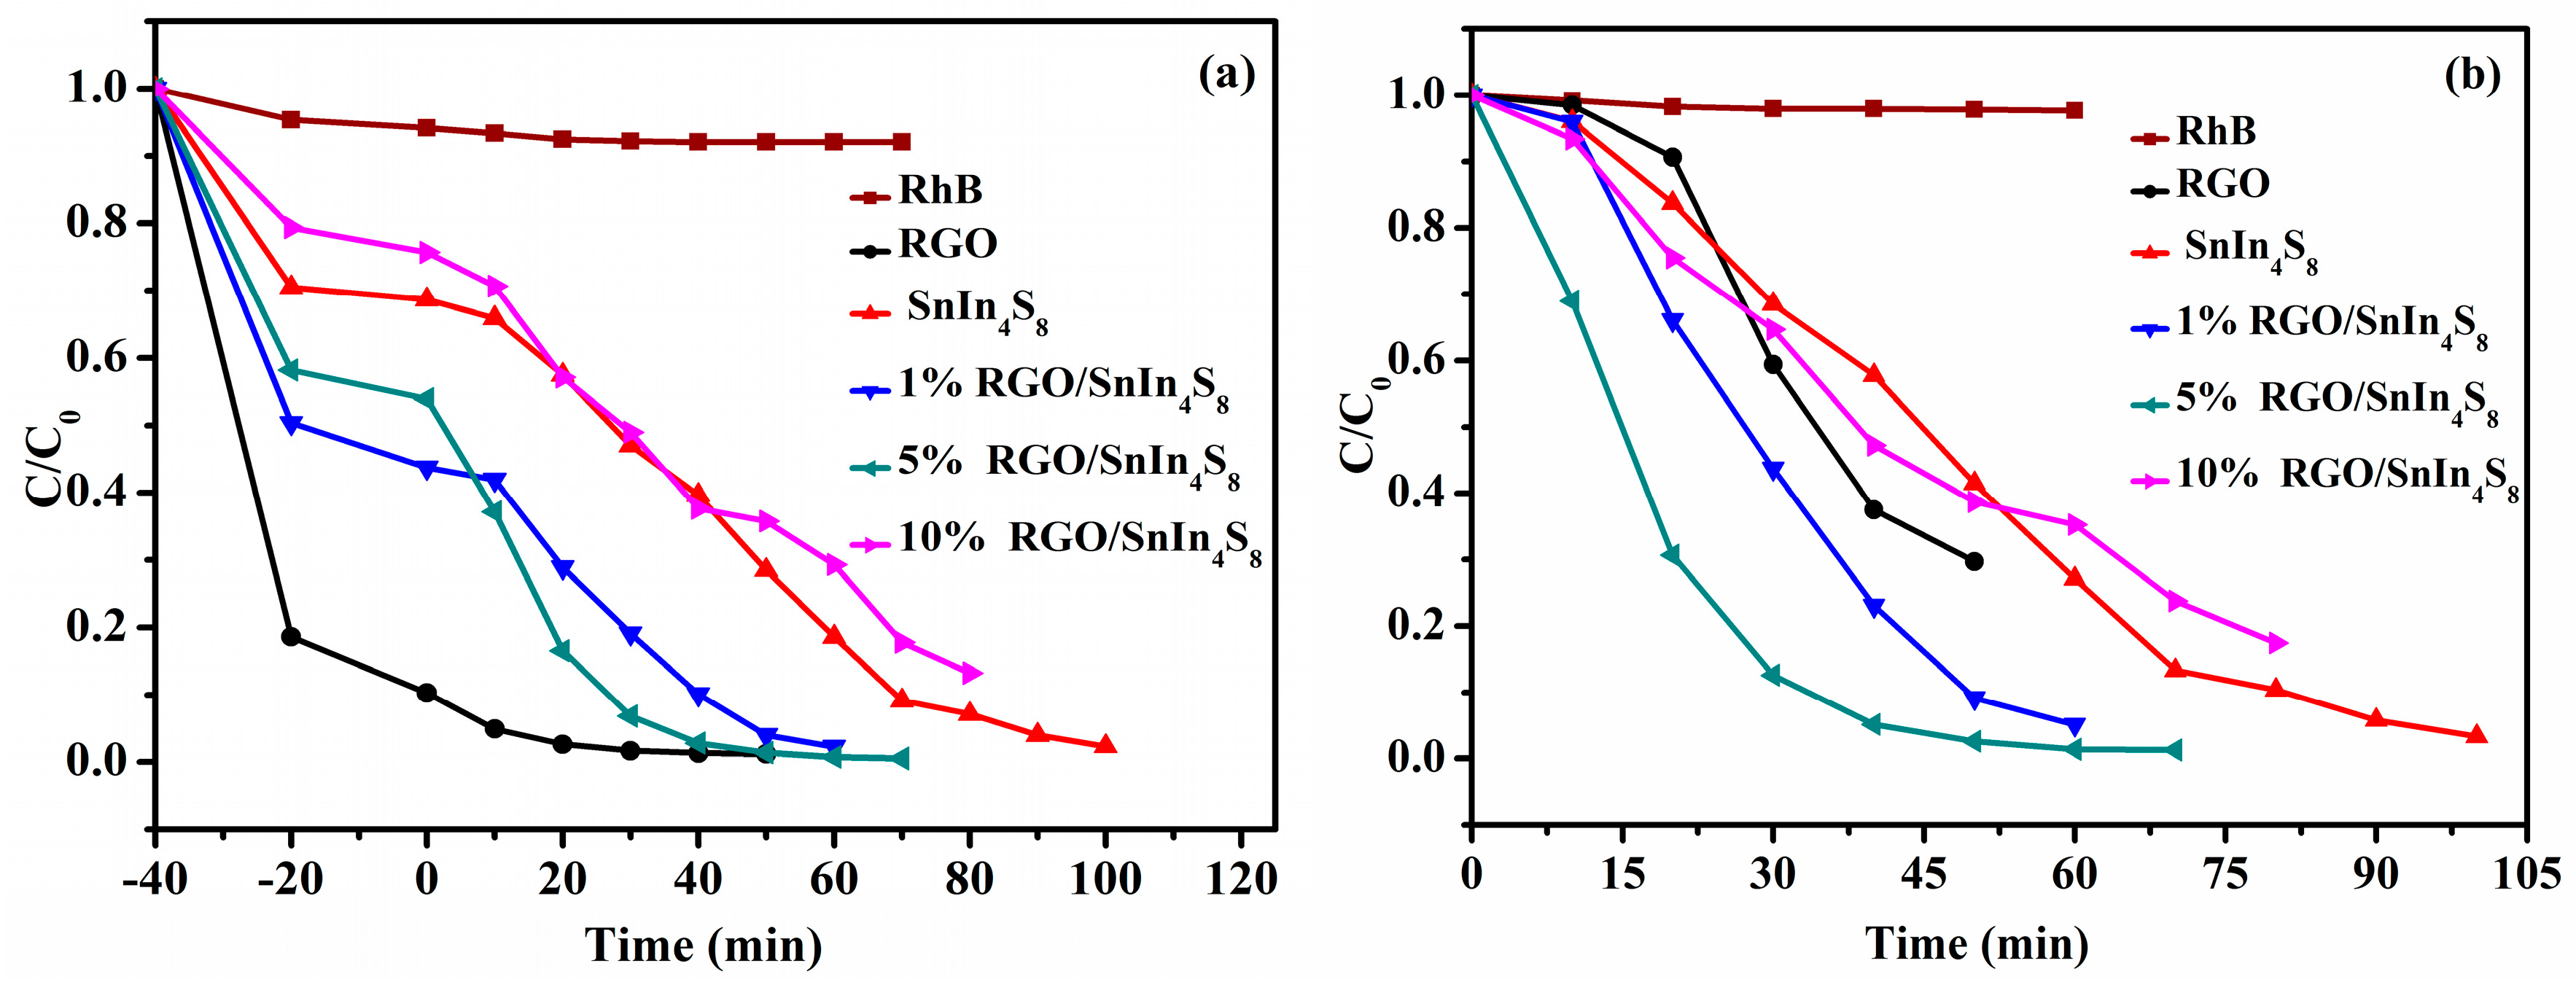
2.9.2. Adsorption and Photocatalytic Degradation of RhB

In order to separate the contribution of adsorption and degradation in the experiment, the adsorption process in the dark and photocatalytic degradation of RhB over RGO, pure SnIn4S8 and RGO/SnIn4S8 composites under visible-light irradiation were carried out (Figure 10a). In the absence of a catalyst, the concentration change of RhB solution is very slight (around 6% during 70 min exposure), indicating that the self-degradation under visible-light irradiation can be neglected. In the presence of RGO, about 90% of RhB was adsorbed by RGO before the photodegradation, indicating that RGO is an excellent adsorbent. By discounting the adsorption contribution, the photocatalytic degradation of RhB over RGO, pure SnIn4S8 and RGO/SnIn4S8 composites under visible-light irradiation was shown in Figure 10b. In the presence of pure SnIn4S8 and RGO/SnIn4S8 composites, RhB photodegradation is remarkably enhanced. The photocatalytic activity of RGO/SnIn4S8 composite is much higher than that of pure SnIn4S8 and RGO, and the photocatalytic activity of RGO/SnIn4S8 composites is greatly influenced by the RGO content. The photocatalytic activity of RGO/SnIn4S8 composite increases with increasing RGO content from 0% to 5%. When the percent of RGO reaches 5%, RGO/SnIn4S8 exhibits the highest photocatalytic activity, giving rise to the almost complete removal of RhB within 70 min under visible-light irradiation. However, as the proportion of RGO further increases, the degradation efficiency decreases gradually, and the degradation of RhB needs much longer time. One possible reason is that an appropriate amount of RGO is beneficial for the generation and transfer of photo-generated electrons and holes at heterojunction interfaces, while excessive RGO could shield SnIn4S8 from light as well as promote electron–hole recombination [43]. Therefore, due to the demands of both the charge transfer and light harvesting, the photocatalytic activity of RGO/SnIn4S8 first increases and then decreases with the increase of RGO content, leading to the highest photocatalytic activity of 5% RGO/SnIn4S8.

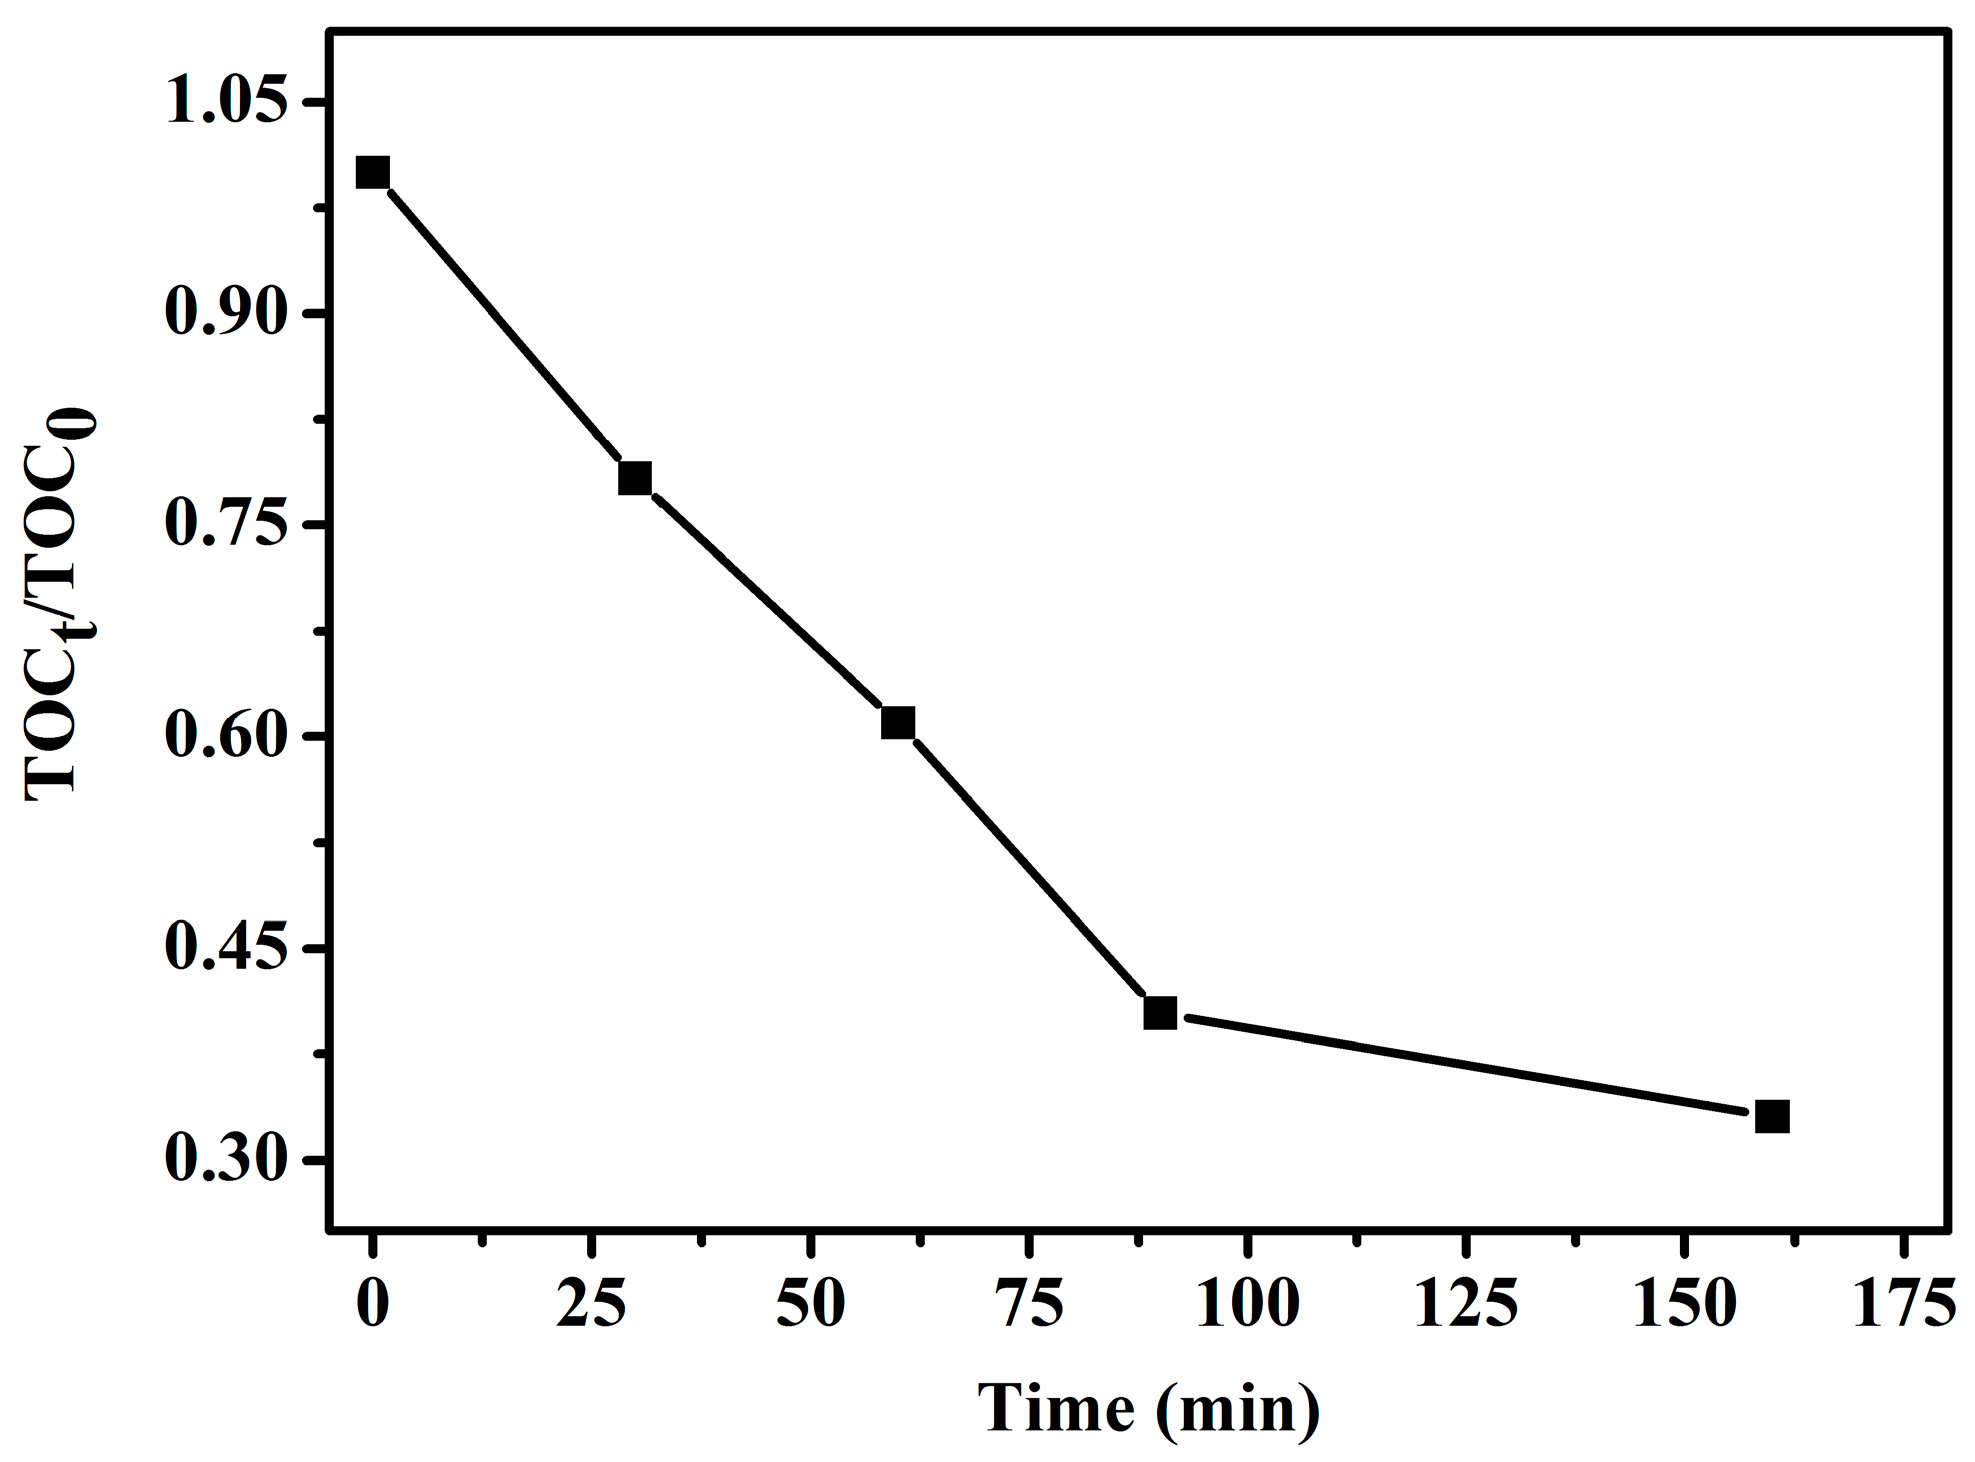
2.9.3. Mineralization of Aqueous RhB

The mineralization efficiency of RhB was monitored by TOC analyzer. Figure 11 shows TOC removal of RhB in presence of RGO/SnIn4S8 under visible-light irradiation for 160 min. The TOC removal efficiency was calculated according to the following equation:
T O C   r e m o v a l   e f f i c i e n c y = T O C 0 T O C t T O C 0 × 100 %
where TOC0 represents the initial TOC value of RhB solution, and TOCt is the TOC value at any time t. It can be seen from Figure 11 that TOC removal efficiency of RhB solution increases with increasing visible-light irradiation time, and the TOC removal efficiency reaches 73.17% after exposure to visible-light irradiation for 160 min, indicating that the most of RhB and its N-deethylation intermediate products were decomposed into inorganic species.

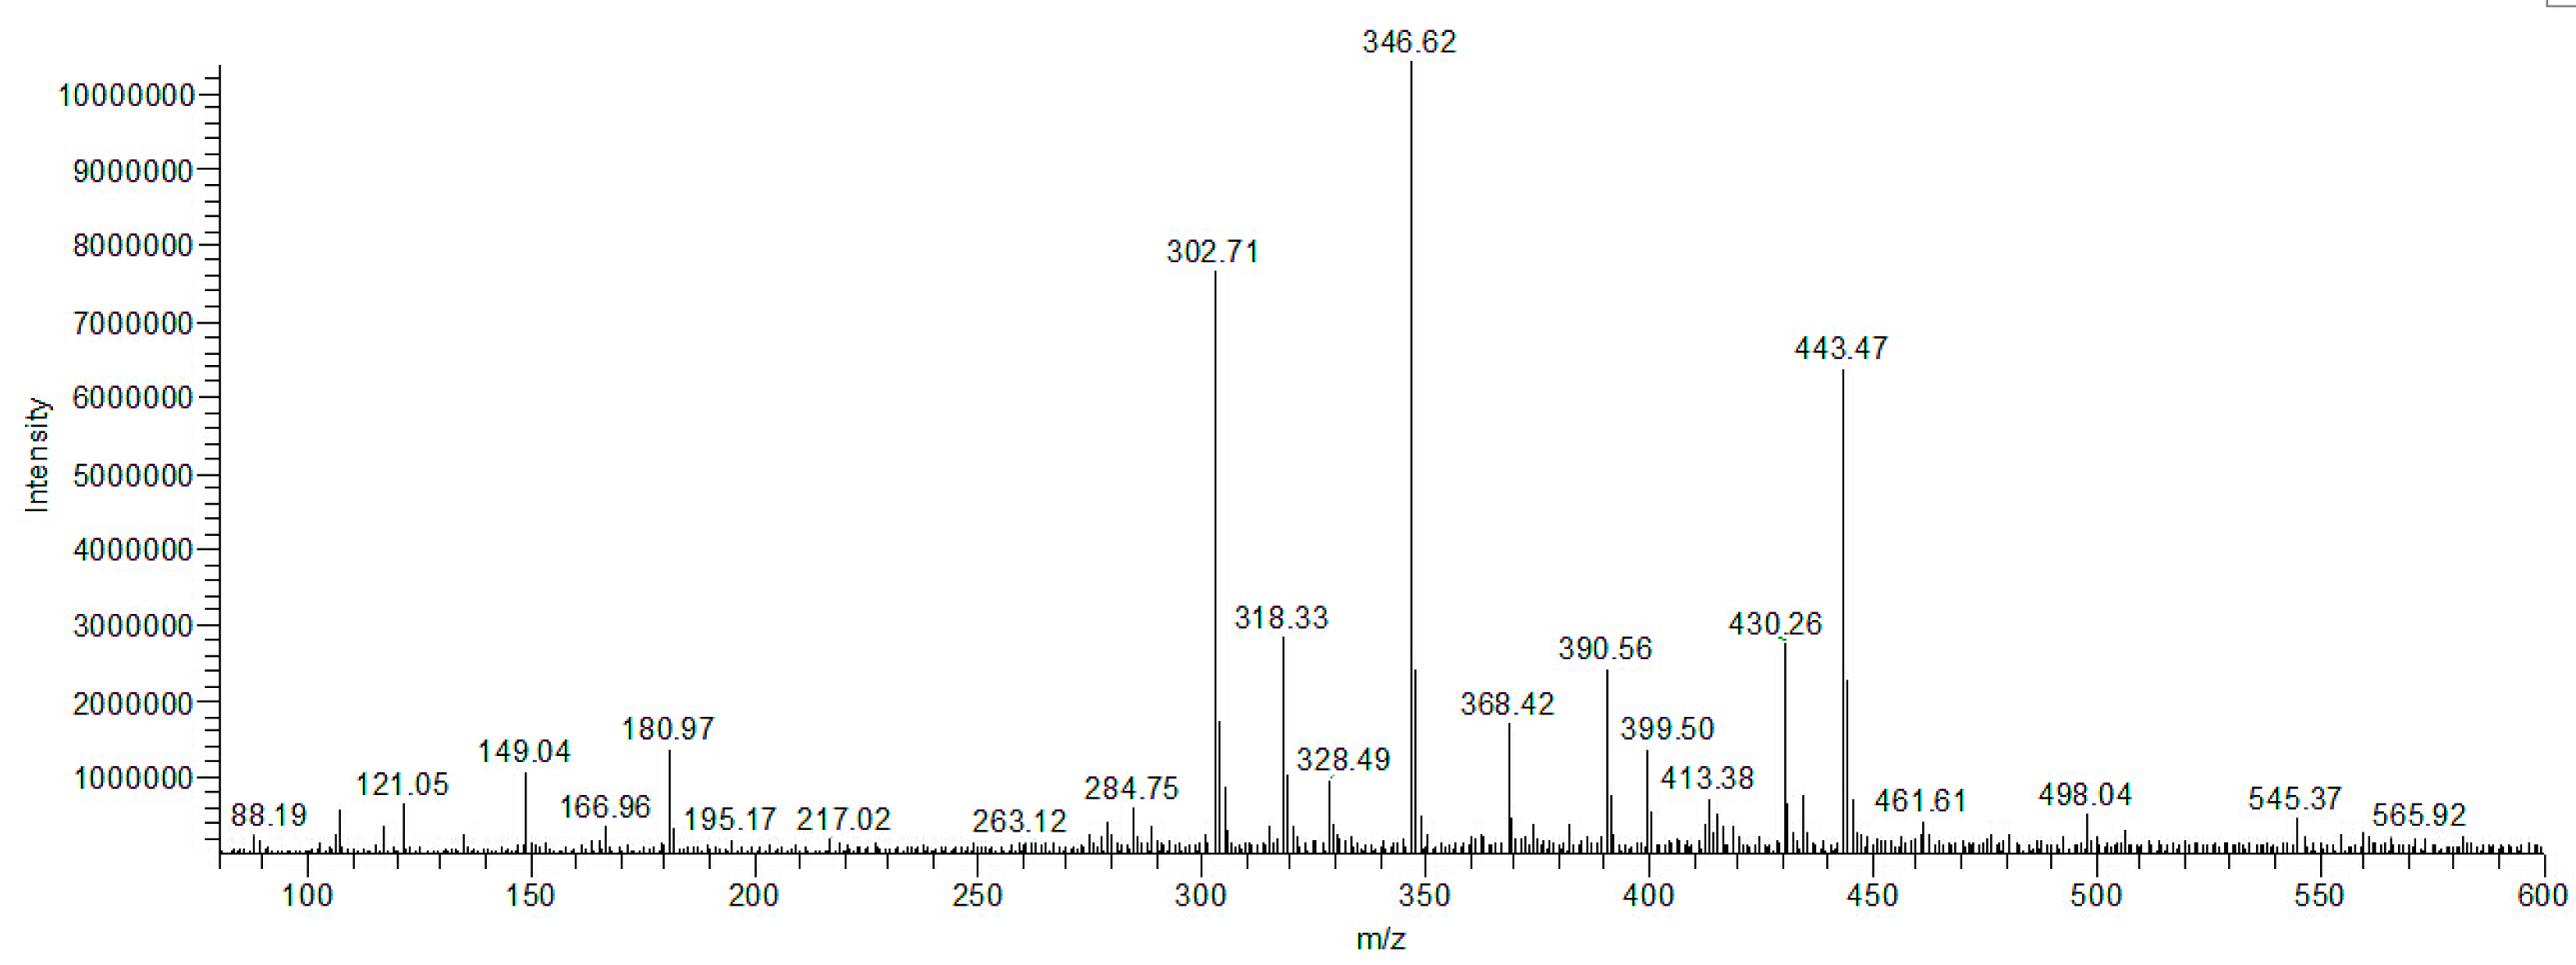
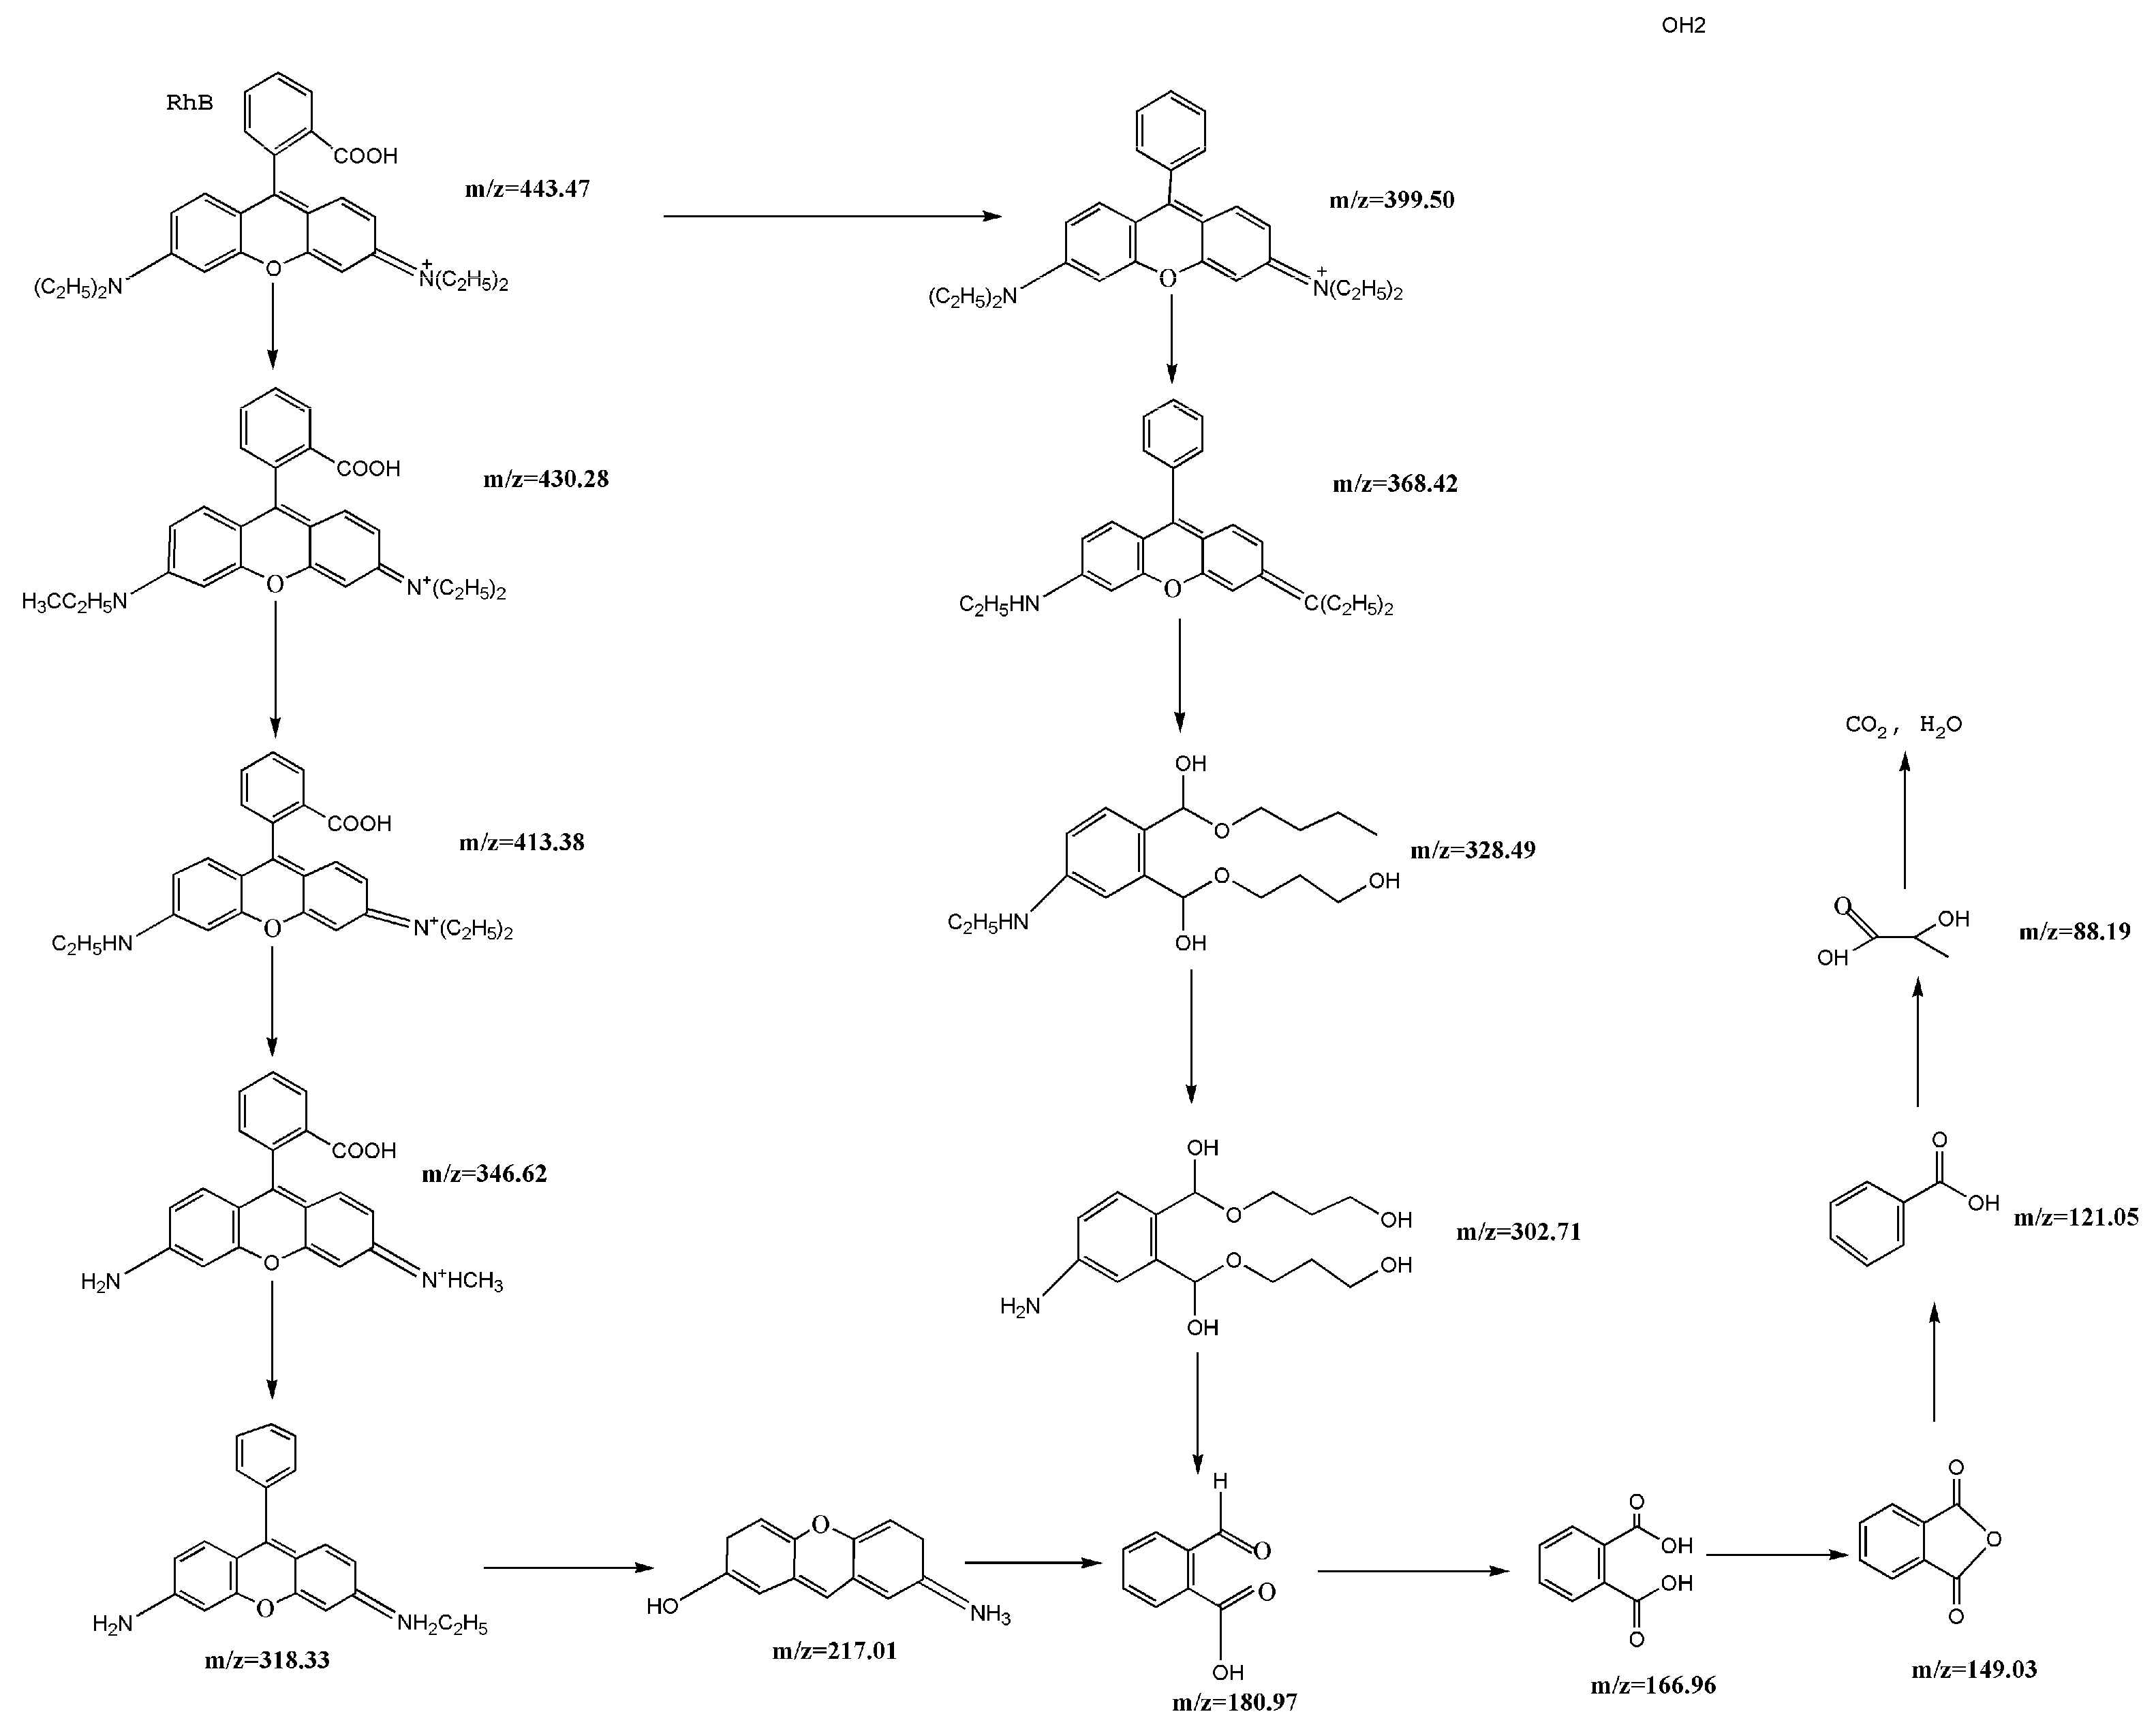
2.10. Separation and Identification of Intermediates

To further understand the photocatalytic degradation and mineralization pathways of RhB, RhB and its intermediate products were analyzed using HPLC-MS (Figure 12). According to the m/z values of the intermediate products and the structure of RhB, we have inferred the pathways of photocatalytic degradation and mineralization (Figure 13). The mass peaks at m/z 443, 413, 399, 346, and 328 correspond to RhB and its N-deethylated intermediates (N,N-diethyl-N'-ethylrhodamine (DER), N,N-diethylrhodamine (DR), N-ethylrhodamine (ER), and rhodamine (R)). As further oxidation proceeded, adipic acid, phthalic acid, isophthalic acid, and terephthalic acid were generated. Finally, these small molecules were mineralized into CO2 and H2O, which can be proved by TOC results.

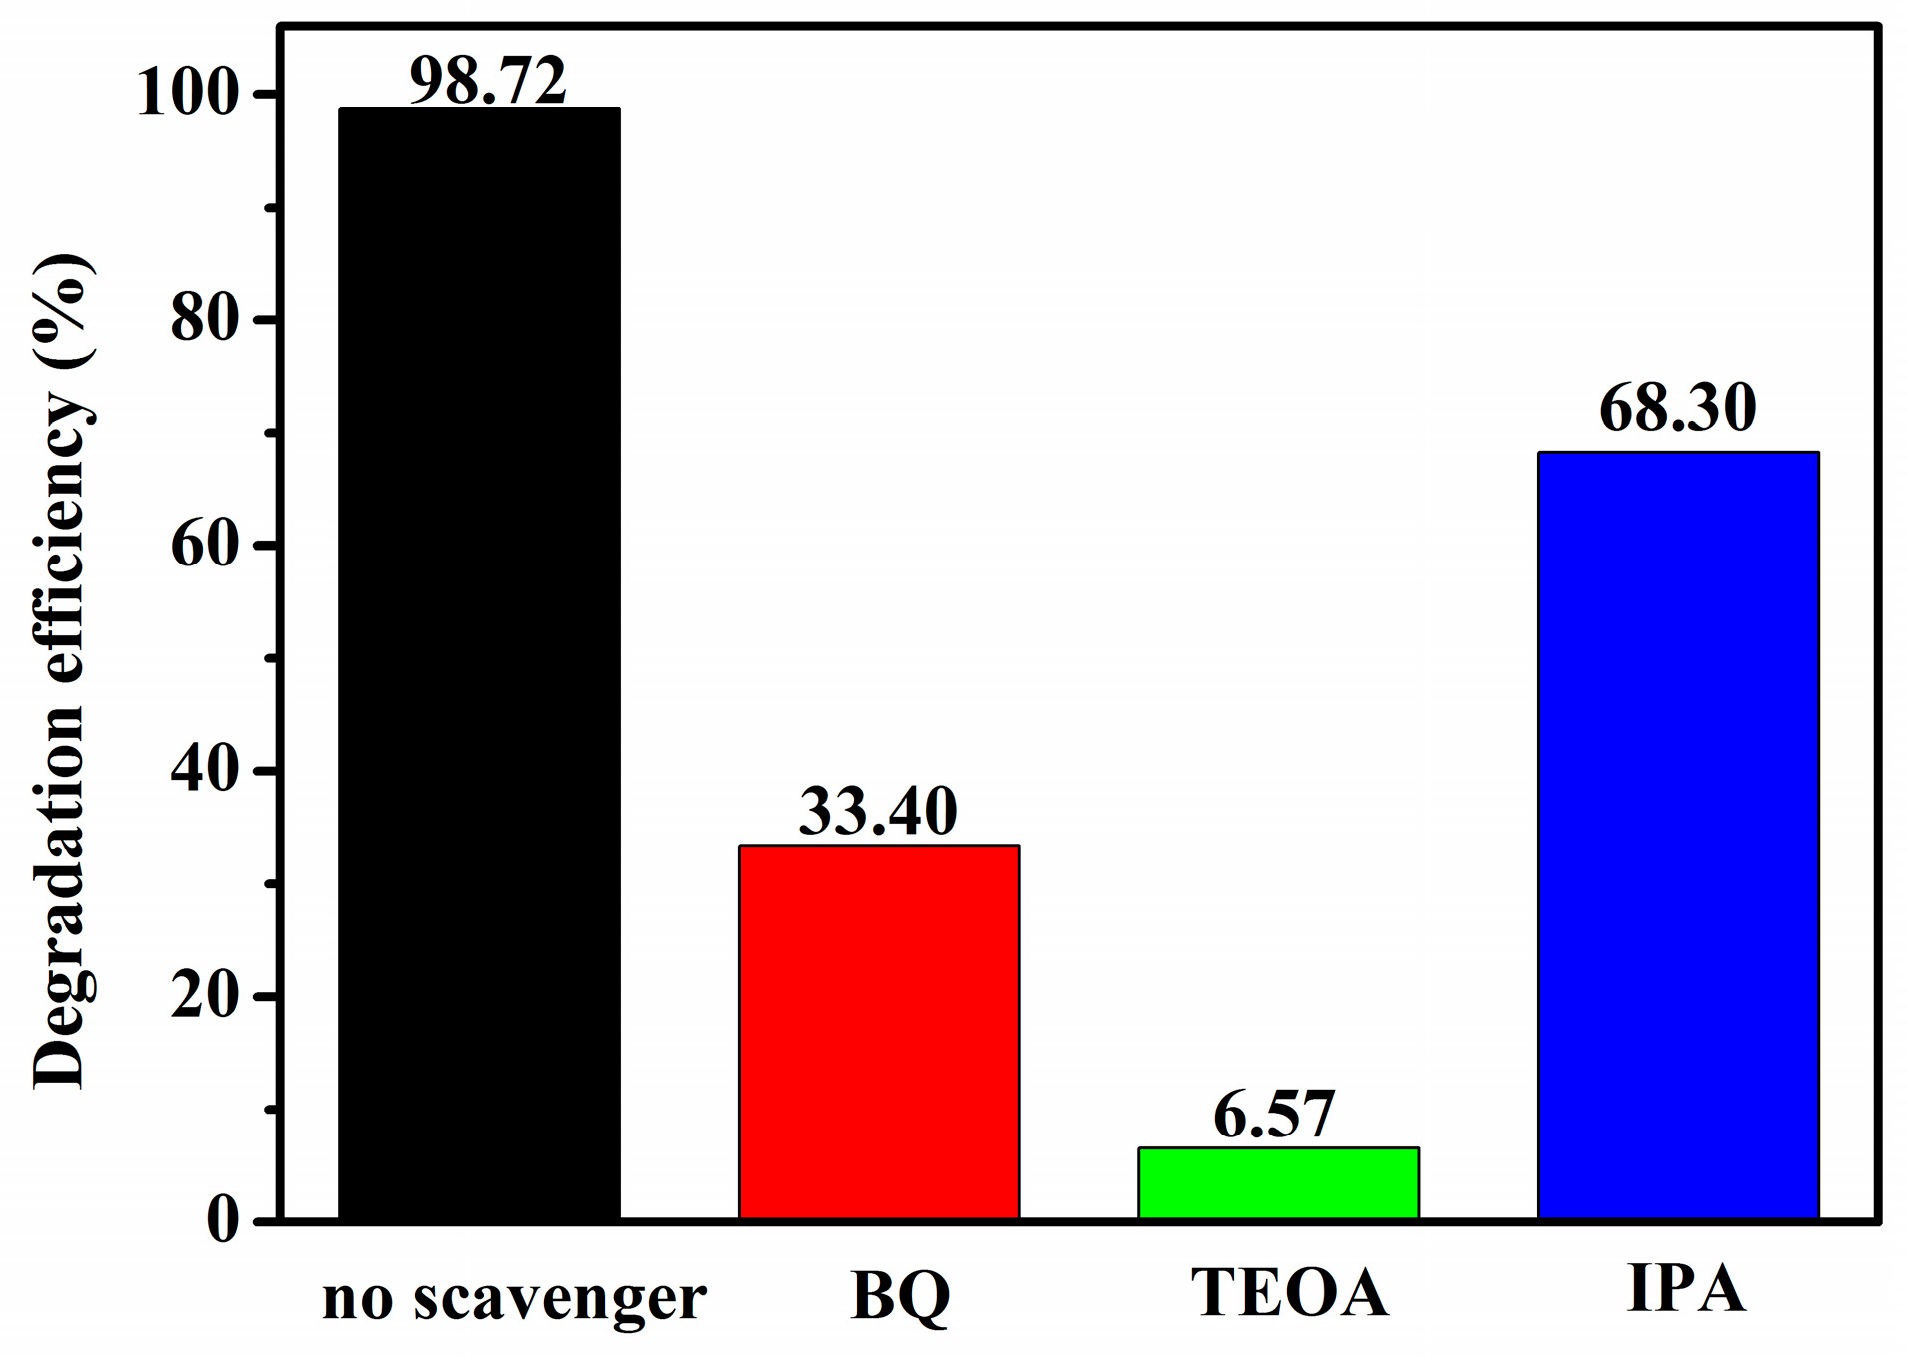
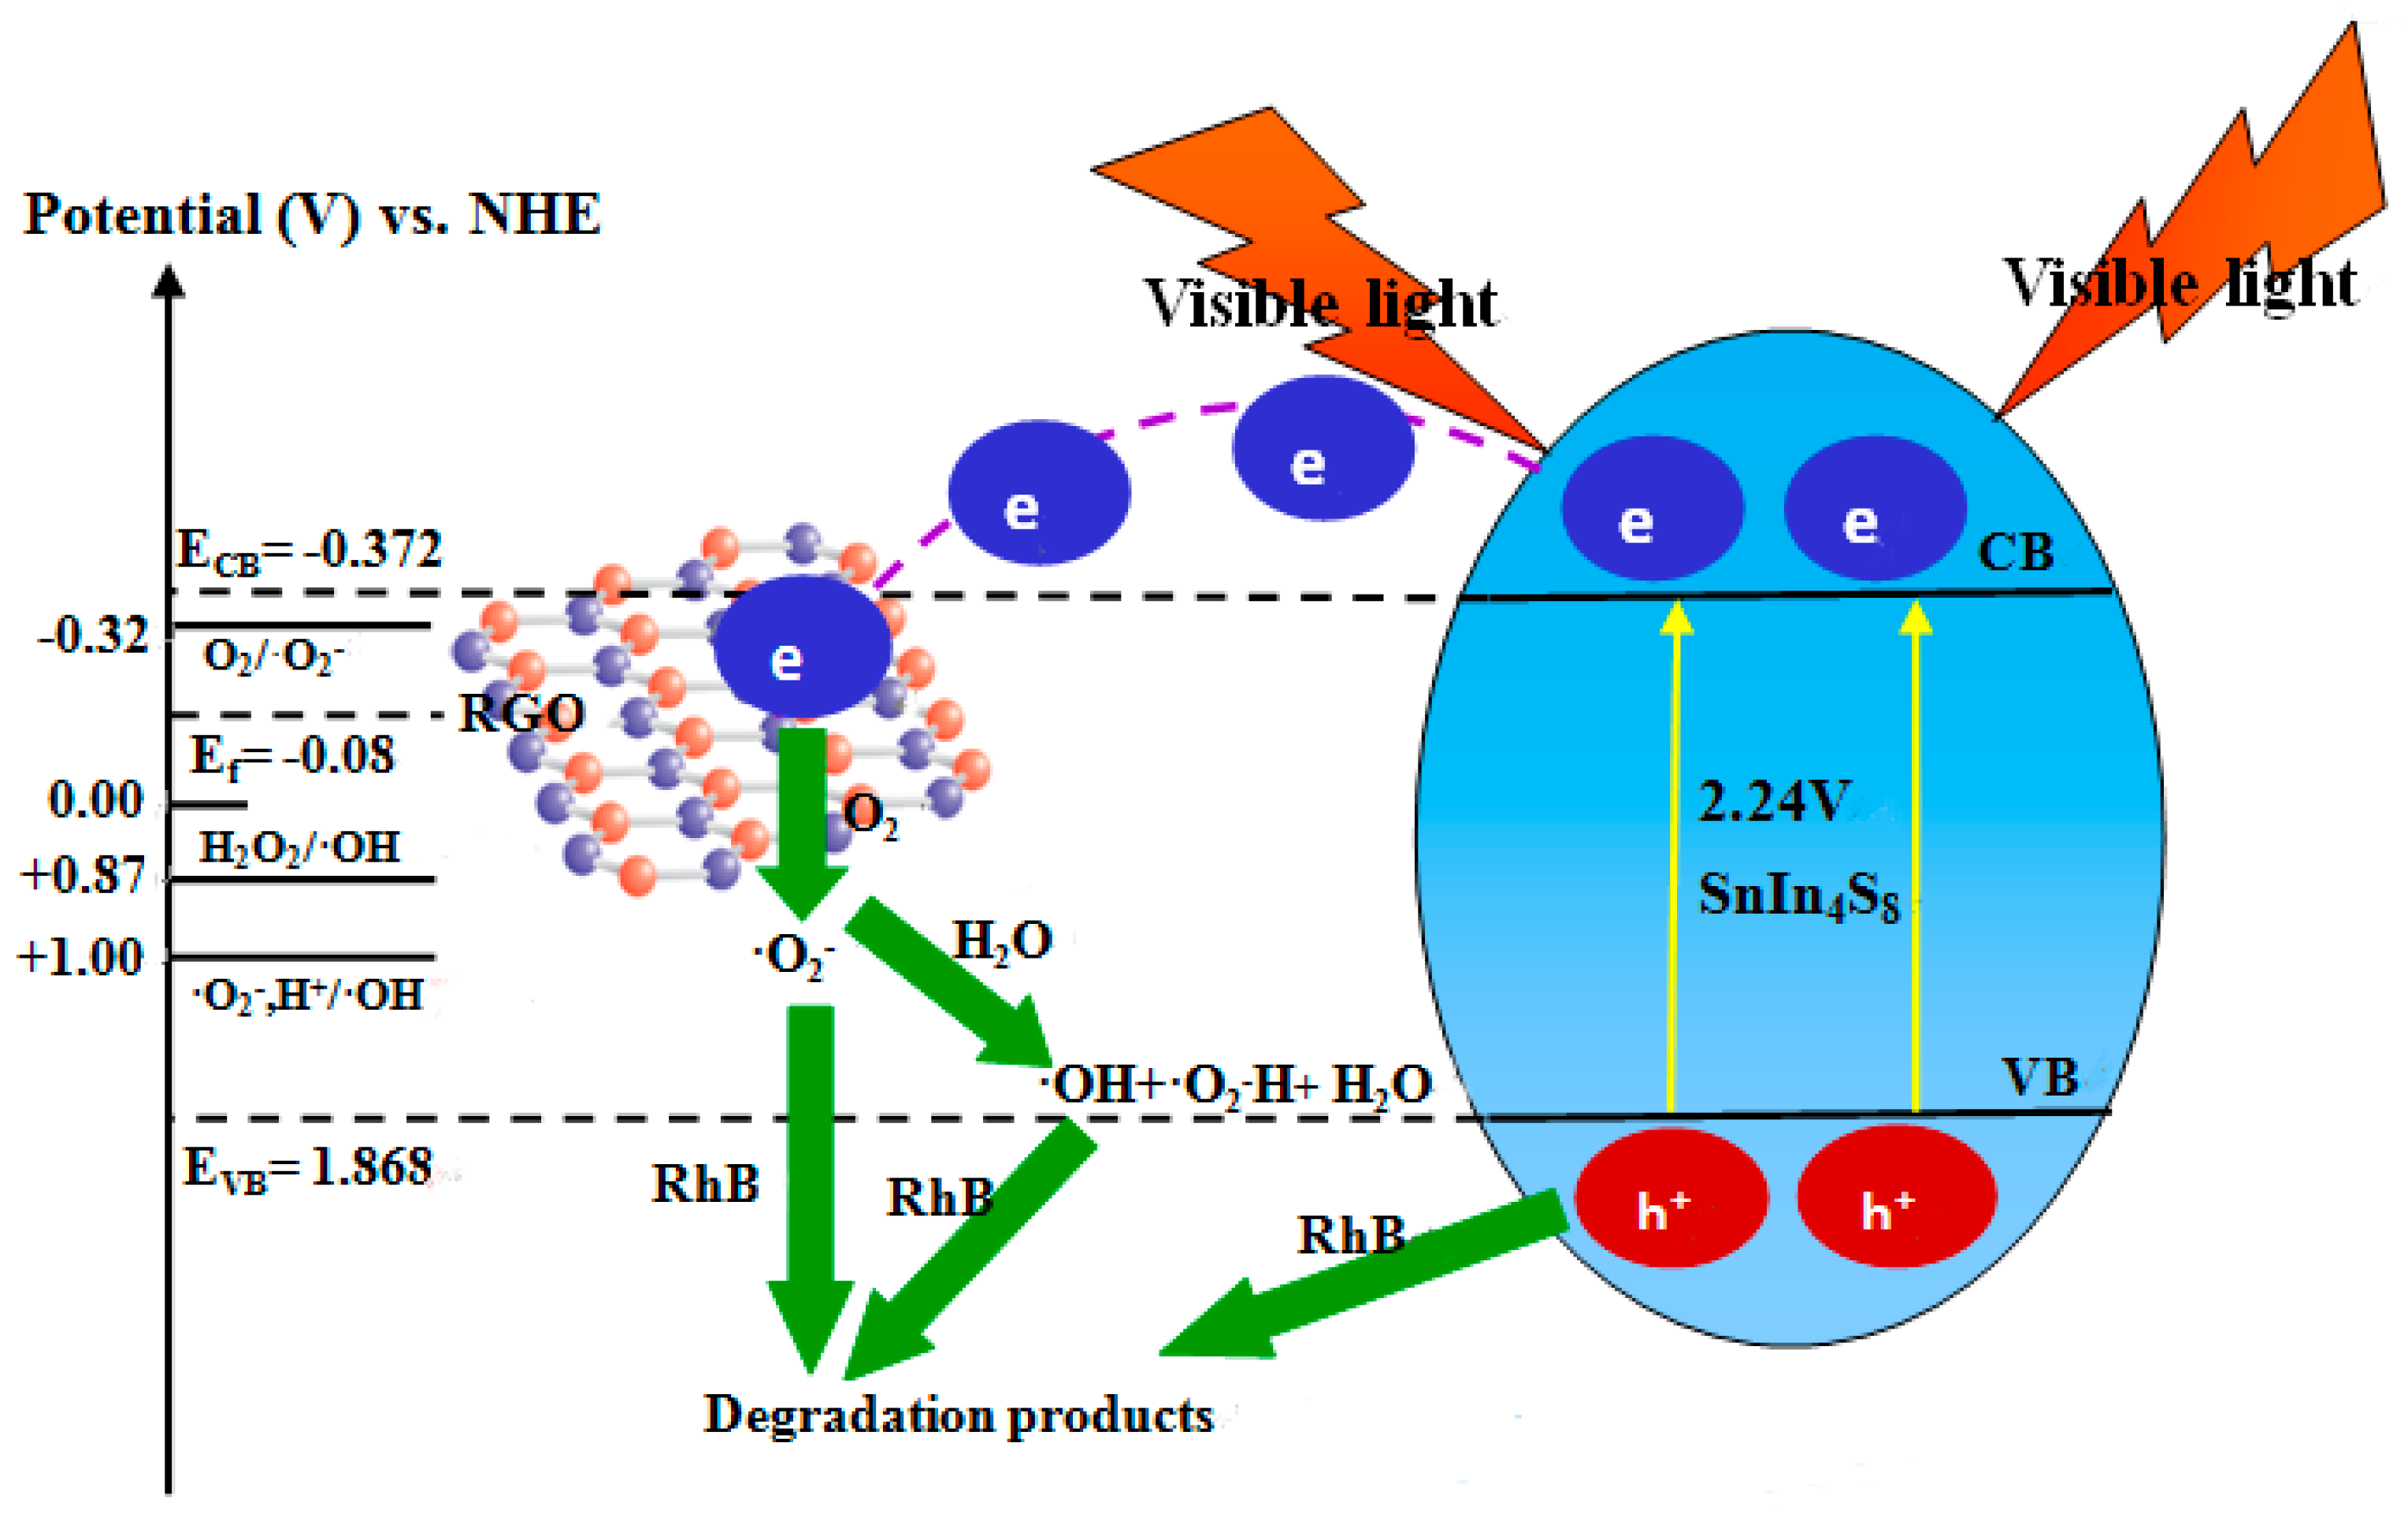
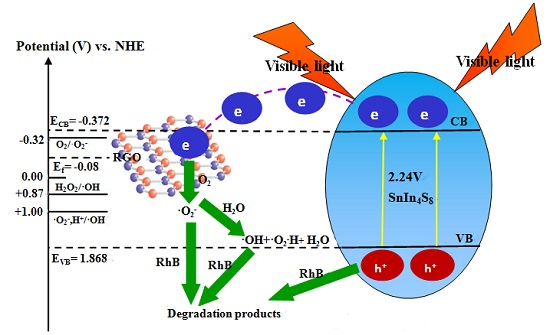
2.11. Photocatalytic Mechanism

It is very important to examine main reactive species (such as h+, ·OH and ·O2 radicals) in photocatalytic reaction for understanding the photocatalytic mechanism of RGO/SnIn4S8 under visible-light irradiation. Figure 14 shows the degradation efficiency of RhB over 5% RGO/SnIn4S8 in the presence of isopropanol (IPA, ·OH quencher), triethanolamine (TEOA, h+ quencher) and benzoquinone (BQ, ·O2 quencher). When no quenchers were added, the degradation efficiency of RhB is 98.72%. When TEOA and BQ scavengers were added, the RhB degradation efficiency was significantly reduced to 6.57% and 33.40%, respectively. In the case of adding an IPA scavenger, the degradation efficiency of RhB decreased to 68.30%. Therefore, it can be concluded that h+, ·O2 and ·OH are the main active species which play crucial roles in the degradation of RhB, and the order of affecting degradation efficiency of RhB follows that of h+ > ·O2 > ·OH.
Based on the experiment results and the reported literature [44,45,46], the generation and transfer of the photogenerated electrons and holes in RGO/SnIn4S8 composites are illustrated in Scheme 1. As shown in Scheme 1, under visible-light irradiation, the electrons (e) excited in valence band (VB) would transfer to the conduction band (CB) of SnIn4S8, whereas the holes (h+) would generate in the VB of SnIn4S8. The photo-generated e in the CB of the SnIn4S8 can be injected into RGO, therefore hindering the recombination process of the e-h+ pairs. The photo-generated e in RGO could react with adsorbed O2 to form ·O2 radicals. Most of ·O2 radicals play an important role in the degradation of RhB molecules, others could further react with H2O to generate hydroxyl radicals (·OH). The h+ in the VB of SnIn4S8 are decisive to oxidize RhB molecules adsorbed on the surface of RGO/SnIn4S8 composites, meanwhile, ·O2 and ·OH radicals are beneficial to the degradation of RhB. The photocatalytic process of RhB under visible-light irradiation, among with 1RhB* and 3RhB* represent the öST and the triplet respectively [47,48]. The equations are as follows:
(1) e _ + R G O R G O ( e _ ) (2) R G O ( e _ ) + O 2 O 2 _ (3) O 2 _ + H 2 O O 2 H + O H _ (4) R h B + + O 2 R h B O 2 decomposition products (5) R h B + + H O 2 decomposition products
Equation (2) is followed by Reaction (7) and the following sequence:
(6) R h B + h v ( v i s ) 1 R h B * o r 3 R h B 3 (7) R 1 h B * o r R 3 h B * + R G O / S n I n 4 S 8 R h B + + S n I n 4 S 8 ( h + + e _ ) (8) R h B + decomposition products (9) R h B + + O H _ R h B + O H (10) R h B + O H decomposition products

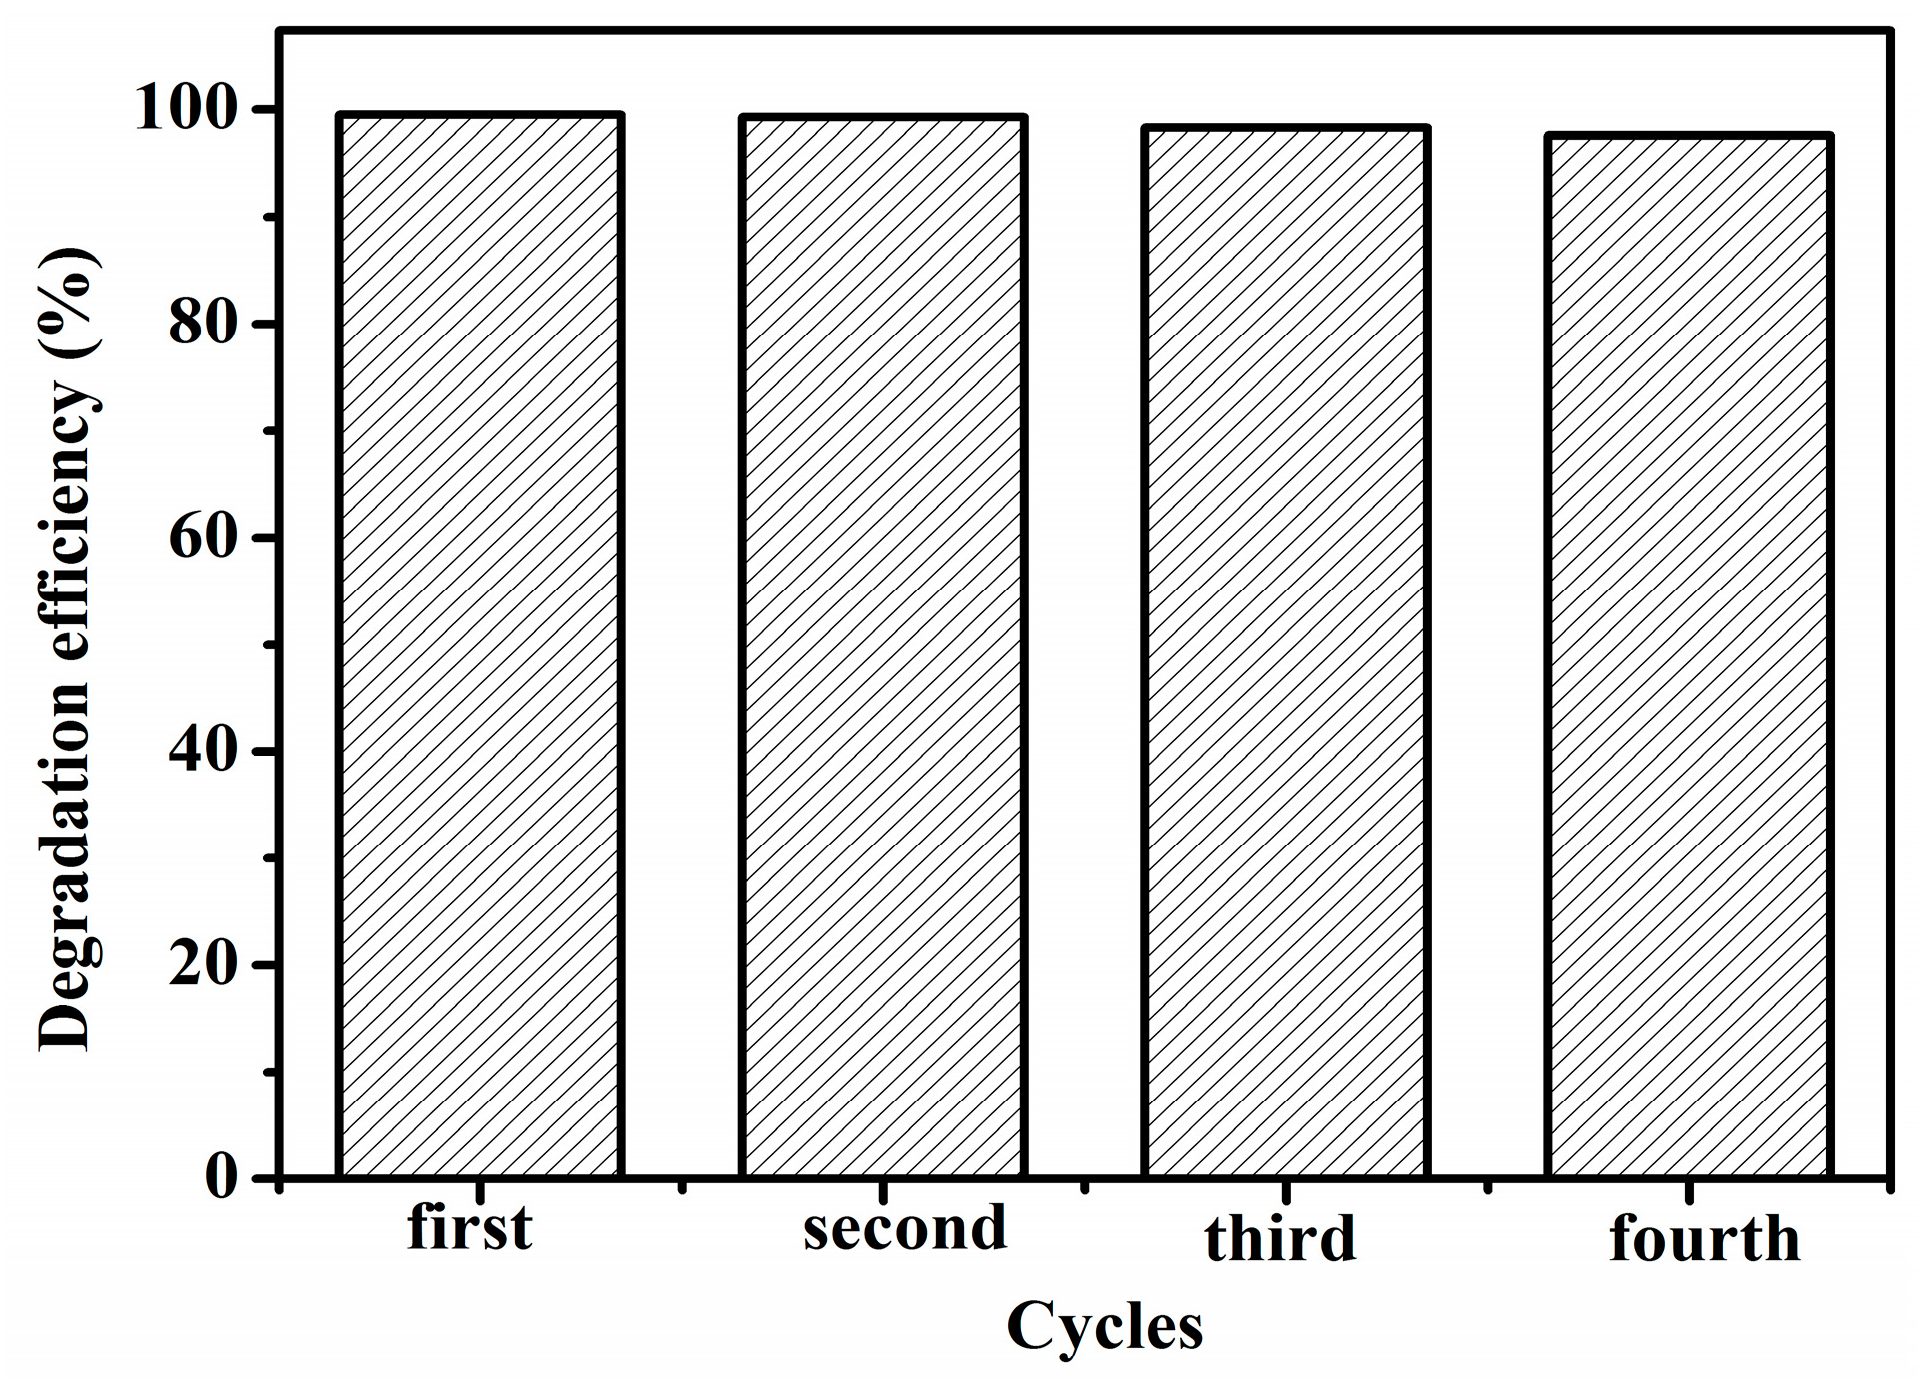
2.12. Regeneration and Reuse of Spent RGO/SnIn4S8 Composites

The stability of RGO/SnIn4S8 composites has also been studied to evaluate its economic value and practical application. As shown in Figure 15, after four consecutive photocatalytic degradation-regeneration cycles, the photocatalytic performance of the regenerated 5% RGO/SnIn4S8 composites is similar to that of their fresh counterparts, indicating that 5% RGO/SnIn4S8 composites exhibit high stability, and could be used repeatedly.

3. Experimental Section

3.1. Materials and Chemicals

Thioacetamide (TAA) was attained from Tianjin Chemical Reagent Plant (Tianjin, China). Tin (IV) chloride pentahydrate (SnCl4·5H2O) and indium (III) chloride tetrahydrate (InCl3·4H2O) were received from Aladdin Chemistry Co. Ltd. (Shanghai, China). Graphite powder, 80% hydrazine hydrate, anhydrous ethanol, sodium sulfate (Na2SO4) and iso-propyl alcohol (IPA) were obtained from Shantou Xilong Chemical Co., Ltd. (Shantou, China). p-Benzoquinone (BQ) was supplied by Shanghai Crystal Pure Reagent Co., Ltd. (Shanghai, China). Triethanolamine (TEOA) was acquired from Shanghai Chemical Reagent Co., Ltd. (Shanghai, China). Rhodamine B (RhB) was provided by Shanghai Chemical Technology Co., Ltd. (Shanghai, China). All the reagents were of analytical grade and used without further purification. Deionized water was further purified using a Milli-Q water system (Bedford, MD, USA).

3.2. The Low-Temperature Co-Precipitation Synthesis of Pure SnIn4S8 and RGO/SnIn4S8 Composite

Graphene oxide (GO) was prepared by the modified Hummers method [49], and then GO was reduced to RGO by 80% hydrazine hydrate. To synthesize RGO/SnIn4S8 composites with different amount of RGO, a simple low-temperature co-precipitation method was used. In a typical procedure, 0.521 g of SnCl4·5H2O (2.0 mmol) and 1.769 g of InCl3·4H2O (8.0 mmol) were dissolved in 50 mL of anhydrous ethanol under magnetic stirring, and then 1.127 g of TAA (15 mmol) was added to the above solution. The mixture solution was stirred for about 25 min until the solution became transparent, then a certain amount of RGO was added to the mixture solution and followed by ultrasonication for 20 min to form a transparent solution. The above solution was transferred to a 150 mL three flask with a condensing unit and maintained at bath temperature of 80 °C for 5 h under continuous stirring, then cooled to room temperature naturally. The obtained yellow precipitate was filtered and washed with distilled water and absolute ethanol several times, and dried at 80 °C in vacuum for 12 h. The samples with different molar ratio of C to Sn were designated as pure SnIn4S8, 1% RGO/SnIn4S8, 5% RGO/SnIn4S8 and 10% RGO/SnIn4S8, respectively.

3.3. Characterization

U-3900H scan UV-Vis spectrophotometer (Hitachi, Tokyo, Japan) equipped with a Labsphere diffuse reflectance accessory was used to obtain the reflectance spectra of the photocatalysts over a range of 200–800 nm. Morphologies of the photocatalysts were analyzed by scanning electron microscopy (SEM) instrument (Shimadzu, Kyoto, Japan). BET surface areas and pore structures were measured using a GEMINI VII 2390 surface area and porosity analyzer (Micromeritics, Atlanta, GA, USA). X-ray diffraction (XRD) patterns of products were obtained by using an automatic X-ray diffractometer (XRD, Rigaku D/max 2200PC, Karlsruhe, Germany) with Cu Kα radiation. Raman spectra of samples were obtained using a LabRAM HR spectrophotometer (Jobin Yvon, Paris, France) with an excitation wavelength of 632.8 nm. The photoluminescence (PL) were measured using F-7000 fluorescence spectrophotometer (Hitachi, Tokyo, Japan) with an excitation wavelength of 474 nm. The total organic carbon (TOC) of the samples was analyzed by using an Apollo 9000 TOC analyzer (Terkmar-Dohrmann, Atlanta, GA, USA). The intermediate products were analyzed by using LCQ-Deca-XP high performance liquid chromatography-tandem mass spectrometry (HPLC-MS, Thermo Finnigan, Atlanta, GA, USA).

3.4. Electrochemical Measurement

The flat-band potential of 5% RGO/SnIn4S8 was determined by extrapolating the Mott-Schottky plots. Mott-Schottky plots were performed on an electrochemical workstation (CHI660C, Shanghai Chenhua Instrument Corporation, Beijing, China) with a standard three-electrode cell in the potential range between −1.0 and 1.0 V with scan frequency of 1000 Hz and 0.025 V sinus amplitude. This three-electrode cell was consisted of a saturated calomel electrode (SCE) as reference electrode, a graphite electrode as counter electrode, RGO/SnIn4S8-modified indium tin oxide (ITO) conducting glass as the working electrode, and 0.5 mol·L−1 Na2SO4 as the electrolyte.

3.5. Adsorption Dynamics in the Dark

In addition, 0.03 g of pure SnIn4S8, 1% RGO/SnIn4S8, 5% RGO/SnIn4S8, 10% RGO/SnIn4S8, or RGO was mixed with 160 mL of 10 mg·L−1 RhB solution in a conical flask, respectively. The conical flasks were shaken at 20 °C in the dark. In addition, 3 mL suspension was sampled at different time intervals, and filtered immediately to remove the photocatalysts. The concentration of RhB in the filtrate was measured by HPLC with detection wavelength of 553.5 nm. The adsorbed amount at any time t (qt) is calculated as follows:
q t = ( C 0 C t ) V m
where C0 (mg·L−1) is the initial RhB concentration, Ct (mg·L−1) is the RhB concentration at time t, V (mL) is the volume of RhB solution, and m (g) is the mass of the photocatalysts.

3.6. Visible-Light Photocatalytic Activity Measurement

A 300 W xenon lamp (PLS-SXE300, Beijing Trusttech Co., Ltd., Beijing, China) with a 400 nm cut-off filter (400 nm < λ < 780 nm) was used as the source of visible light. The photocatalytic activities of pure SnIn4S8 and RGO/SnIn4S8 were evaluated by the degradation of RhB under visible-light irradiation. Typically, 30 mg of pure SnIn4S8 or RGO/SnIn4S8 composite was added to 160 mL of RhB solution (10 mg·L−1), respectively. Before irradiation, the suspensions were magnetically stirred in the dark for 40 min in order to establish an adsorption-desorption equilibrium. Under continuous stirring, the mixed solution was irradiated by visible light. The reaction suspension was sampled at intervals of 10 min. After immediate filtration, the clear solution was analyzed using a 754 UV-Vis spectrometer at a wavelength of 553.5 nm, which is the maximum absorption wavelength of RhB. The concentration of RhB was estimated by a calibration curve. The intermediate products were analyzed by using HPLC-MS.

3.7. Regeneration and Reuse of Spent RGO/SnIn4S8 Composite Catalyst

In order to evaluate the stability and reusability of RGO/SnIn4S8, consecutive photocatalytic degradation-regeneration cycles were repeated four times. The spent RGO/SnIn4S8 composite was recovered from the mixture solution by filtration and washed with plenty of water (0.1 g RGO/SnIn4S8 composite with 400 mL water), then dried at 60 °C for 4 h. The regenerated RGO/SnIn4S8 composite was used for subsequent cycles of photocatalytic degradation under similar reaction conditions as carried out with fresh catalyst.

4. Conclusions

We successfully prepared hierarchically porous reduced graphene oxide/SnIn4S8 (RGO/SnIn4S8) composites with visible-light response and strong mineralization ability by a facile low-temperature co-precipitation method. Compared with pure SnIn4S8, RGO/SnIn4S8 composite exhibits enhanced absorption in UV and visible-light range. The RGO content was optimized, and the optimal content of RGO nanosheets is 5%. The optimal 5% RGO/SnIn4S8 possesses the best photocatalytic degradation efficiency and mineralization performance with complete degradation of Rhodamine B within 70 min and 73.17% mineralization yield within 160 min under visible-light irradiation, which is much higher than that of pure SnIn4S8. The main reactive species that affect degradation and mineralization efficiency of RhB follow the order of h+ > ·O2 > ·OH. The intermediate products of RhB degradation were analyzed, and the possible degradation pathways and detailed degradation mechanism were proposed. Moreover, 5% RGO/SnIn4S8 exhibits excellent reusability and stability without obvious decrease of photocatalytic activity.

Acknowledgments

This work was supported by Natural Science Foundation of China (51308278, 51178213, 51238002), National Science Fund for Excellent Young Scholars (51422807), Department of Education Fund of Jiangxi Province (GJJ150742) and Science Fund for Excellent Young Scholars of Jiangxi Province (20122BAB213014).

Author Contributions

Fang Deng conceived and designed the experiments; Xule Pei performed the experiments; Fang Deng and Xule Pei analyzed the data; Key Laboratory of Jiangxi Province for Persistent Pollutants Control and Resources Recycle, Nanchang Hangkong University contributed reagents/materials/analysis tools; All the authors discussed the results, analyzed data and wrote this paper.

Conflicts of Interest

The authors declare no conflict of interests.

References

  1. Elimelech, M.; Phillip, W.A. The future of seawater desalination: Energy, technology, and the environment. Science 2011, 333, 712–717. [Google Scholar] [CrossRef] [PubMed]
  2. Chao, J.; Xie, Z.; Duan, X.B.; Dong, Y.; Wang, Z.; Xu, J.; Liang, B.; Shan, B.; Ye, J.; Chen, D.; et al. Visible-light-driven photocatalytic and photoelectrochemical properties of porous SnSx(x = 1,2) architectures. CrystEngComm. 2012, 14, 3163–3168. [Google Scholar] [CrossRef]
  3. Elfghi, F.M.; Zaidi, S.A.; Abdullah, E.C.; Ali, K.M. Applications of graphene and its derivatives as an adsorbent for heavy metal and dye removal: A systematic and comprehensive overview. RSC Adv. 2015, 5, 50392–50420. [Google Scholar]
  4. Marahel, F.; Khan, M.A.; Marahelac, E.; Bayestiac, I.; Desalin, S. Kinetics, thermodynamics, and isotherm studies for the adsorption of BR2 dye onto avocado integument. Water Treat. 2015, 53, 826–835. [Google Scholar] [CrossRef]
  5. Zhang, X.; Chen, C.; Lin, P.; Hou, A.; Niu, Z.; Wang, J. Emergency drinking water treatment during source water pollution accidents in China: Origin analysis, framework and technologies. Environ. Sci. Technol. 2011, 45, 161–167. [Google Scholar] [CrossRef] [PubMed]
  6. Xiong, Z.; Zhang, L.L.; Ma, J.Z.; Zhao, X.S. Photocatalytic degration of dyes over graphene-gold nanocomposites under visible light irradiation. Chem. Commun. 2010, 46, 6099–6101. [Google Scholar] [CrossRef] [PubMed]
  7. Lei, Y.; Xing, Y.; Fan, W.; Song, S.; Zhang, H. Synthesis characterization and optical property of flower-like indium tin sulfide nanostructures. Dalton Trans. 2009, 162, 1620–1623. [Google Scholar] [CrossRef] [PubMed]
  8. Ge, M.; Zhu, N.; Zhao, Y.; Li, J.; Liu, L. Sunlight-assisted degradation of dye pollutants in Ag3PO4 suspension. Ind. Eng.Chem. Res. 2012, 51, 5167–5173. [Google Scholar] [CrossRef]
  9. Wang, J.Q.; Liu, Y.H.; Chen, M.W. Excellent capability in degrading azo dyes by MgZn-based metallic glass powders. Nature 2012, 2, 148–152. [Google Scholar] [CrossRef] [PubMed]
  10. Dukkancl, M.; Vinatoru, M.; Mason, T.J. The sonochemical decolourisation of textile azo dye Orange II: Effects of Fenton type reagents and UV light. Ultrason. Sonochem. 2014, 21, 846–853. [Google Scholar] [CrossRef] [PubMed]
  11. Gu, Y.; Zhang, Y.; Zhang, F.; Wei, J.; Wang, C.; Du, Y.; Ye, W. Investigation of photoelectrocatalytic activity of Cu2O nanoparticles for p-nitrophenol using rotating ring-disk electrode and application for electrocatalytic determination. Electrochim. Acta 2010, 56, 953–958. [Google Scholar] [CrossRef]
  12. Cheng, Z.; Liao, J.; He, B.; Zhang, F.; Zhang, F.; Huang, X.; Zhou, L. One-Step fabrication of graphene oxide enhanced magnetic composite gel for highly efficient dye adsorption and catalysis. ACS Sustain. Chem. Eng. 2015, 3, 1677–1685. [Google Scholar] [CrossRef]
  13. Mondal, T.; Bhowmick, A.K. Synthesis and characterization of bi-functionalized graphene and expanded graphite using n-butyl lithium and their use for efficient water soluble dye adsorption. J. Mater. Chem. A 2013, 1, 8144–8153. [Google Scholar] [CrossRef]
  14. Zhou, L.; He, B.; Huang, J. One-step synthesis of robust amine-and vinyl-capped magnetic iron oxide nanoparticles for polymer grafting, dye adsorption, and catalysis. ACS Appl. Mater. Inter. 2013, 5, 8678–8685. [Google Scholar] [CrossRef] [PubMed]
  15. Yang, Y.; Liao, H.; Tong, Z.; Wang, C. Porous Ag/polymer composite microspheres for adsorption and catalytic degradation of organic dyes in aqueous solutions. Compos. Sci. Technol. 2015, 107, 137–144. [Google Scholar] [CrossRef]
  16. Nishikawa, M.; Mitani, Y.; Nosaka, Y. Photocatalytic reaction mechanism of Fe(III)-grafted TiO2 studied by means of ESR spectroscopy and chemi-luminescence photometry. J. Phys. Chem. C 2012, 116, 14900–14907. [Google Scholar] [CrossRef]
  17. Dinh, C.T.; Yen, H.; Kleitz, F.; Do, T.O. Three-dimensional ordered assembly of thin-shell Au/TiO2 hollow nanospheres for enhanced visible-light-driven photocatalysis. Angew. Chem. Int. Ed. 2014, 53, 6618–6623. [Google Scholar] [CrossRef] [PubMed]
  18. Yu, J.; Ma, T.; Liu, G.; Cheng, B. Enhanced photocatalytic activity of bimodal meso-porous titania powders by C60 modification. Dalton Trans. 2011, 40, 6635–6644. [Google Scholar] [CrossRef] [PubMed]
  19. Deng, F.; Liu, Y.; Luo, X.B.; Wu, S.L.; Luo, S.L.; Au, C.; Qi, R. Sol-hydrothermal synthesis of inorganic-framework molecularly imprinted TiO2/SiO2 nanocomposite and its preferential photocatalytic degradation towards target contaminant. J. Hazard. Mater. 2014, 278, 108–115. [Google Scholar]
  20. Sackmann, E.K.; Fulton, A.; Beebe, D.J. The present and future role of microfluidics in biomedical research. Nature 2014, 507, 181–189. [Google Scholar] [CrossRef] [PubMed]
  21. Liu, S.; Liu, C.; Wang, W.; Cheng, B.; Yu, J. Unique photocatalytic oxidation reactivity and selectivity of TiO2-graphene nanocomposites. Nanoscale 2012, 4, 3193–3200. [Google Scholar] [PubMed]
  22. Yang, X.; Chen, W.; Huang, J.; Zhou, Y.; Zhu, Y.; Li, C. Rapid degradation of methylene blue in a novel heterogeneous Fe3O4@rGO@TiO2-catalyzed photo-Fenton system. Nature 2015, 5, 10632–10642. [Google Scholar] [CrossRef] [PubMed]
  23. Niu, M.; Cheng, D.; Cao, D. SiH/TiO2 and GeH/TiO2 heterojunctions: Promising TiO2-based photocatalysts under visible light. Nature 2014, 4, 4810–4815. [Google Scholar] [CrossRef] [PubMed]
  24. Yan, T.; Li, L.; Li, G.; Wang, Y.; Hu, W.; Guan, X. Porous SnIn4S8 microspheres in a new polymorph that promotes dyes degradation under visible light irradiation. J. Hazard. Mater. 2011, 186, 272–279. [Google Scholar] [CrossRef] [PubMed]
  25. Lei, Y.Q.; Wang, G.H.; Zhou, L.; Hu, W.; Song, S.Y.; Fan, W.Q.; Zhang, H.J. Cubic spinel In4SnS8: Electrical transport properties and electrochemical hydrogen storage properties. Dalton Trans. 2010, 39, 7021–7024. [Google Scholar] [CrossRef] [PubMed]
  26. Wang, L.; Li, X.; Teng, W.; Zhao, Q.; Shi, Y.; Yue, R.; Chen, Y. Efficient photocatalytic reduction of aqueous Cr(VI) over flower-like SnIn4S8 microspheres under visible light illumination. J. Hazard. Mater. 2013, 244–245, 681–688. [Google Scholar] [CrossRef] [PubMed]
  27. Chen, D.; Feng, H.; Li, J. Graphene oxide: Preparation, functionalization and electrochemical applications. Chem. Rev. 2012, 112, 6027–6053. [Google Scholar] [CrossRef] [PubMed]
  28. Xiang, Q.; Yu, J.; Jaroniec, M. Graphene-based semiconductor photocatalysts. Chem. Soc. Rev. 2012, 41, 782–796. [Google Scholar] [CrossRef] [PubMed]
  29. Tu, W.; Zhou, Y.; Zou, Z. Versatile graphene-promoting photocatalytic performance of semiconductors: Basic principles, synthesis, solar Energy Conversion, and environmental applications. Adv. Funct. Mater. 2013, 23, 4996–5008. [Google Scholar] [CrossRef]
  30. Ong, W.L.; Gao, M.; Ho, G.W. Hybrid organic PVDF–inorganic M–rGO–TiO2 (M = Ag, Pt) nanocomposites for multifunctional volatile organic compound sensing and photocatalytic degradation–H2 production. Nanoscale 2013, 5, 11283–11290. [Google Scholar] [CrossRef] [PubMed]
  31. Gao, M.; Peh, C.K.N.; Ong, W.L.; Ho, G.W. Green chemistry synthesis of a nanocomposite grapheme hydrogel with three-dimensional nano-mesopores for photocatalytic H2 production. RSC Adv. 2013, 3, 13169–13177. [Google Scholar] [CrossRef]
  32. Liu, X.; Pan, L.; Lv, T.; Zhu, G.; Sun, Z.; Sun, C. Microwave-assisted synthesis of CdS-reduced graphene oxide composites for photocatalytic reduction of Cr(VI). Chem. Commun. 2011, 47, 11984–11986. [Google Scholar] [CrossRef] [PubMed]
  33. Yavari, F.; Kritzinger, C.; Gaire, C.; Song, L.; Gulapalli, H.; Tasciuc1, T.B.; Ajayan, P.M.; Koratkar, N. Tunable bandgap in graphene by the controlled adsorption of water molecules. Small 2010, 6, 2535–2538. [Google Scholar] [CrossRef] [PubMed]
  34. Ding, M.Y.; Tang, Y.; Star, A. Understanding interfaces in metal–graphitic hybrid nanostructures. J. Phys. Chem. Lett. 2013, 4, 147–160. [Google Scholar] [CrossRef] [PubMed]
  35. Perera, S.D.; Mariano, R.G.; Vu, K.; Nour, N.; Seitz, O.; Chabal, Y.; Balkus, K.J. Hydrothermal synthesis of graphene-TiO2 nanotube composites with enhanced photocatalytic activity. ACS Catal. 2012, 2, 949–956. [Google Scholar] [CrossRef]
  36. Leofanti, G.; Padovan, M.; Tozzola, G.; Venturelli, B. Surface area and pore texture of catalysts. Catal. Today 1998, 90, 207–219. [Google Scholar] [CrossRef]
  37. Walton, K.S.; Snurr, R.Q. Applicability of the BET method for determining surface areas of microporous metal−organic frameworks. J. Am. Chem. Soc. 2007, 129, 8552–8556. [Google Scholar] [CrossRef] [PubMed]
  38. Lozano-Castelló, D.; Cazorla-Amorós, D.; Linares-Solano, A.; Shiraishi, S.; Kurihara, H.; Oya, A. Influence of pore structure and surface chemistry on electric double layer capacitance in non-aqueous electrolyte. Carbon 2003, 41, 1765–1775. [Google Scholar] [CrossRef]
  39. Xiang, Q.J.; Lv, K.L.; Yu, J.G. Pivotal role of fluorine in enhanced photocatalytic activity of anatase TiO2 nanosheets with dominant (001) facets for the photocatalytic degradation of acetone in air. Appl. Catal. B Environ. 2010, 96, 557–564. [Google Scholar] [CrossRef]
  40. Zhang, J.; Yu, J.; Jaroniec, M.; Gong, J.R. Noble metal-free reduced graphene oxide-ZnxCd1−xS nanocomposite with enhanced solar photocatalytic H2-production performance. Nano Lett. 2012, 12, 4584–4589. [Google Scholar] [CrossRef] [PubMed]
  41. Lim, J.; Murugan, P.; Lakshminarasimhan, N.; Kim, J.Y.; Lee, J.S.; Lee, S.H.; Choi, W. Synergic photocatalytic effects of nitrogen and niobium co-doping in TiO2 for the redox conversion of aquatic pollutants under visible light. J. Catal. 2014, 310, 91–99. [Google Scholar] [CrossRef]
  42. Yang, Y.H.; Chen, X.Y.; Feng, Y.; Yang, G.W. Physical mechanism of blue-shift of UV luminescence of a single pencil-like ZnO nanowire. Nano Lett. 2007, 7, 3879–3883. [Google Scholar] [CrossRef] [PubMed]
  43. Bu, Y.; Chen, Z.; Li, W.; Hou, B. Highly efficient photocatalytic performance of graphene−ZnO quasi-shell-core composite material. ACS Appl. Mater. Inter. 2013, 5, 12361–12368. [Google Scholar] [CrossRef] [PubMed]
  44. Ong, W.; Voon, S.; Tan, L.; Goh, B.; Yong, S.; Chai, S. Enhanced daylight-induced photocatalytic activity of solvent exfoliated graphene (SEG)/ZnO hybrid nanocomposites toward degradation of reactive black 5. Ind. Eng. Chem. Res. 2014, 53, 17333–17344. [Google Scholar] [CrossRef]
  45. Yang, L.; Sun, W.; Luo, S.; Luo, Y. White fungus-like mesoporous Bi2S3 ball/TiO2 heterojunction with high photocatalytic efficiency in purifying 2,4-dichlorophenoxyaceticacid/Cr(VI) contaminated water. Appl. Catal. B Environ. 2014, 156–157, 25–34. [Google Scholar] [CrossRef]
  46. Zhang, Y.; Chen, Z.; Liu, S.; Xu, Y. Size effect induced activity enhancement and anti-photocorrosion of reduced graphene oxide/ZnO composites for degradation of organic dyes and reduction of Cr(VI) in water. Appl. Catal. B Environ. 2013, 140–141, 598–607. [Google Scholar] [CrossRef]
  47. Rajeshwar, K.; Osugi, M.E.; Chanmanee, W.; Chenthamarakshan, C.R.; Zanoni, M.V.B.; Kajitvichyanukul, P.; Krishnan-Ayer, R. Heterogeneous photocatalytic treatment of organic dyes in air and aqueous media. J. Photoch. Photobio. C Photochem. Rev. 2008, 9, 171–192. [Google Scholar] [CrossRef]
  48. Qu, P.; Zhao, J.C.; Zang, L.; Shen, T.; Hidaka, H.S. Enhancement of the photoinduced electron transfer from cationic dyes to colloidal TiO2 particles by addition of an anionic surfactant in acidic media. Colloids Surfaces A Physicochem. Eng. Aspects 1998, 138, 39–50. [Google Scholar] [CrossRef]
  49. Avouris, P. Graphene: Electronic and photonic properties and devices. Nano Lett. 2010, 10, 4285–4294. [Google Scholar] [CrossRef] [PubMed]
Figure 1. Scanning electron microscope (SEM) images of (a) reduced graphene oxide (RGO); (b) pure SnIn4S8 and (c) RGO/SnIn4S8 composite.
Catalysts 06 00113 g001
Figure 2. X ray diffraction (XRD) patterns of RGO, pure SnIn4S8, and RGO/SnIn4S8 composite.
Catalysts 06 00113 g002
Figure 3. Raman spectroscopy of GO, RGO, pure SnIn4S8, and RGO/SnIn4S8 composite.
Catalysts 06 00113 g003
Figure 4. Nitrogen adsorption-desorption isotherms (a) and the corresponding pore size distribution curves (b) of RGO, pure SnIn4S8, and RGO/SnIn4S8 composites with different RGO content.
Catalysts 06 00113 g004
Figure 5. (a) UV-Visible diffuse reflectance spectra and plots of (αhv)2 versus hv (inset) of pure SnIn4S8 and RGO/SnIn4S8 composites with different RGO proportions; (b) the band gap can be changed with different RGO content in RGO/SnIn4S8 composites.
Catalysts 06 00113 g005
Figure 6. Mott–Schottky curves of pure SnIn4S8 and RGO/SnIn4S8 composites.
Catalysts 06 00113 g006
Figure 7. Photoluminescence (PL) spectra of pure SnIn4S8 and RGO /SnIn4S8 with different RGO content.
Catalysts 06 00113 g007
Figure 8. (a) adsorption kinetics for RhB adsorption on RGO, pure SnIn4S8, and RGO/SnIn4S8 composites with different RGO content; (b) linear plot of t/q vs. t for RGO, pure SnIn4S8, and RGO/SnIn4S8 composites with different RGO content.
Catalysts 06 00113 g008
Figure 9. UV-Visible spectral changes of RhB solution in the presence of 5% RGO/SnIn4S8 as a function of reaction time. Inset: maximum absorption wavelength shifts as a function of reaction time.
Catalysts 06 00113 g009
Figure 10. Photodegradation of RhB over RGO, pure SnIn4S8 and RGO/SnIn4S8 composites with different RGO content under visible-light irradiation: (a) including the dark adsorption; (b) discounting the adsorption contribution.
Catalysts 06 00113 g010
Figure 11. Total organic carbon (TOC) changes of aqueous RhB on 5% RGO/SnIn4S8 under visible-light irradiation.
Catalysts 06 00113 g011
Figure 12. Mass spectrum view of RhB and its intermediates that appeared in the photodegradation process.
Catalysts 06 00113 g012
Figure 13. The proposed degradation pathways of RhB in RGO/SnIn4S8 suspension under visible-light irradiation.
Catalysts 06 00113 g013
Figure 14. Effect of different scavengers on the RhB photodegradation by 5% RGO/SnIn4S8 under visible-light irradiation for 120 min.
Catalysts 06 00113 g014
Scheme 1. A schematic illustration for the photocatalytic mechanism of RhB on reduced graphene oxide (RGO)/SnIn4S8 composites under visible-light irradiation.
Catalysts 06 00113 sch001
Figure 15. Regeneration and reuse of 5% RGO/SnIn4S8 composites.
Catalysts 06 00113 g015
Table 1. Physical properties of reduced graphene oxide (RGO), pure SnIn4S8 and RGO/SnIn4S8 composites with different RGO content.
SamplesSBET (m2·g−1)Pore Volume (cm3·g−1)Average Pore Size (nm)
RGO134.310.0293.402
SnIn4S823.350.1119.067
1% RGO/SnIn4S835.020.17520.015
5% RGO/SnIn4S835.290.15918.094
10% RGO/SnIn4S823.480.10918.628
Table 2. Electronic properties of SnIn4S8 and RGO/SnIn4S8.
SampleEg (eV)Vfb (V vs. SCE)VfbECB (V vs. NHE)EVB (V) a
SnIn4S82.24−0.614−0.3721.868
5% RGO/SnIn4S81.99−0.294−0.0521.938
a Calculated according to: EVB = Eg + ECB.
Table 3. Adsorption kinetic parameters for RhB adsorption on RGO, pure SnIn4S8 and RGO/SnIn4S8 composites with different RGO content.
Sampleqexp (mg·g−1)Pseudo-First-OrderPseudo-Second-Order
qcal (mg·g−1)K1 (min−1)R2qcal (mg·g−1)K2 (g·mg−1·min−1)R2
RGO4.8050.4530.3230.5184.8262.4520.999
SnIn4S82.0370.7190.04760.7122.1020.2180.999
1% RGO/SnIn4S83.1572.8370.39450.9853.2440.5010.998
5% RGO/SnIn4S84.1811.8550.08180.9194.2430.2080.999
10% RGO/SnIn4S82.6771.6900.09230.8832.7890.1240.998

