Article

A Novel Delafossite Structured Visible-Light Sensitive AgFeO2 Photocatalyst: Preparation, Photocatalytic Properties, and Reaction Mechanism

Department of Environmental Engineering, Zhejiang University, Hangzhou 310058, China
*
Author to whom correspondence should be addressed.
Catalysts 2016, 6(5), 69; https://doi.org/10.3390/catal6050069
Submission received: 23 February 2016 / Revised: 29 April 2016 / Accepted: 4 May 2016 / Published: 10 May 2016
(This article belongs to the Special Issue Photocatalytic Wastewater Treatment)

Abstract

:
This work presents a systematic study of a novel efficient visible-light sensitive AgFeO2 photocatalyst. The photocatalysts were prepared via simple hydrothermal procedure at 160 °C with different reaction time. The structures, morphologies, specific surface areas, and optical properties of the photocatalysts were explored by X-ray diffraction (XRD), field emission scanning electron microscopy (FE-SEM), Brunauer-Emmett-Teller (BET) model, and UV-vis diffuse reflectance spectra (DRS). Photoluminescence and photocurrent analysis were conducted for the understanding of photogenerated electron-hole pair separation. AgFeO2 with a six-hour hydrothermal procedure demonstrated the most efficient photocatalytic performance which resulted in 97% degradation of methyl orange (MO) within 180 min. The enhanced photocatalytic activity was attributed to the combined effect of its relatively large surface area and high separation electron-hole pair efficiency. Holes and ·O2 were the dominant reactive species responsible for MO degradation and holes played the leading role according to the quenching effects analysis and detection of active species. The conduction and valence band position of AgFeO2 were calculated to be −0.5 V and 1.32 V, respectively. Based on active species detection, along with the band structure, the photocatalytic mechanism was proposed.

Graphical Abstract

1. Introduction

As a potential green technology for energy conversion and environmental protection, photocatalysts have attracted increasing attention during the past decades [1,2,3,4]. TiO2 has been the most widely studied photocatalyst due to its high photocatalytic performance, high chemical stability, none-toxicity, and low cost [5,6]. However, due to its relatively wide band gap (3.2 eV), TiO2 only can be excited under UV irradiation which is only 4% of solar energy [7]. In recent years, efforts have been directed to the area of developing photocatalysts that are able to utilize visible light [8,9], which accounts for 43% of the total solar energy [7]. Generally, there are two main synthesis strategies for the preparation of visible-light sensitive photocatalysts. One is to employ chemical modification on a UV-active photocatalyst. The other is to exploit novel materials with a narrow band gap. Many narrow-band silver-based semiconductors such as Ag3VO4 [10], Ag2Mo3O11 [11], Ag3PO4 [12], Ag2CO3 [13], AgGaO2 [14], and Ag2CrO4 [15] exhibited high activity in degradation of pollutant as well as split water. Thus increasing attention has been drawn to development of high-efficient silver-based visible-light sensitive photocatalysts.
Recently, a silver-containing material AgFeO2 with delafossite structure has attracted interests due to its potential application in antibacterial [16], sensors [17], and energy storage [18]. Delafossite-structured oxides, most of which are semiconductors [19], can be denoted by ABO2. It has a layered structure and can crystallize in two polytyes on the basis of different stacking modes of the alternating layers. One is rhombohedral 3R-(R   3 ¯ m) polytype and the other one is hexagonal 2H-(P63/mmc) polytype. One layer is formed by O–A–O where the A cation (Cu+ or Ag+) is linearly coordinated to two oxygen ions. The other layer is constructed from edge-sharing BO6 blocks where the B cations are typically Ga3+, Fe3+, Cr3+, In3+, and Co3+. The O–A–O layers interweave with BO6 layers along the c-axis and can play the role of separate conduction paths for holes and electrons, respectively [14]. Those structure features are favorable in photocatalysis and delafossite oxides such as AgGaO2 and AgInO2 have shown visible-light photocatalytic activity in dye degradation [20]. Therefore, as a red-brown delafossite-structured oxide, AgFeO2 may be a qualified candidate for visible-light response photocatalyst.
The studies of AgFeO2 are limited so far. Aside from the reports mentioned above, there were several reports focusing on the synthesis and electrochemistry of AgFeO2 [21,22,23]. However, as far as we know, no studies have been dealt with the photocatalytic property over AgFeO2. Here, for the first time, AgFeO2 was investigated as a novel visible-light sensitive photocatalyst. Hydrothermal procedure was adopted for the preparation of the photocatalyst and the influences of different hydrothermal times toward structure, morphology, surface area, optical properties, and photogenerated electron-hole pair separation efficiency were investigated in detail. Photodegradation of methyl orange (MO) under visible light irradiation was experimented and the relationship between characterization results with photodegradation property was properly discussed. In addition, photocatalyst nature and band structure determination were performed. Combined with active species detection and quenching tests, the photocatalytic mechanism of AgFeO2 was further proposed in our work.

2. Result and Discussion

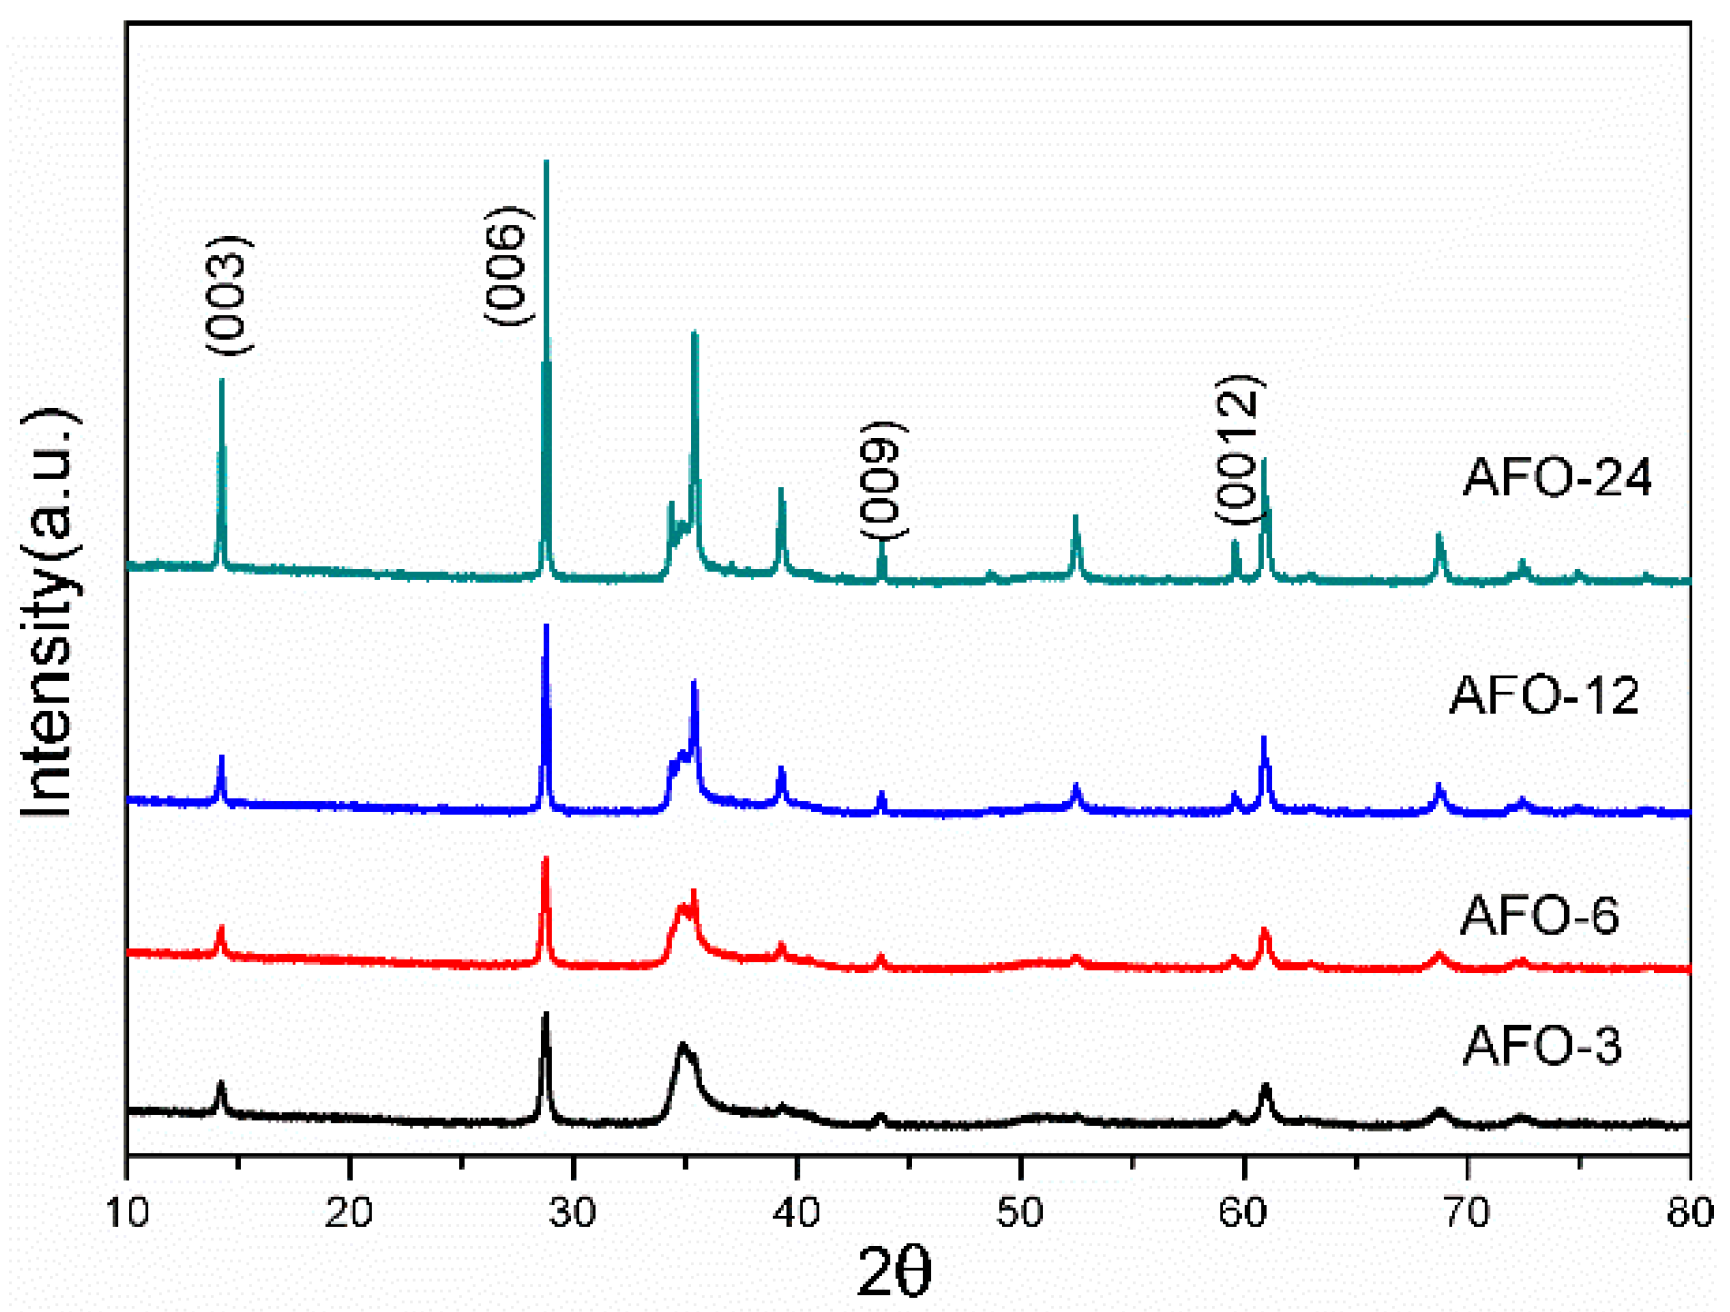
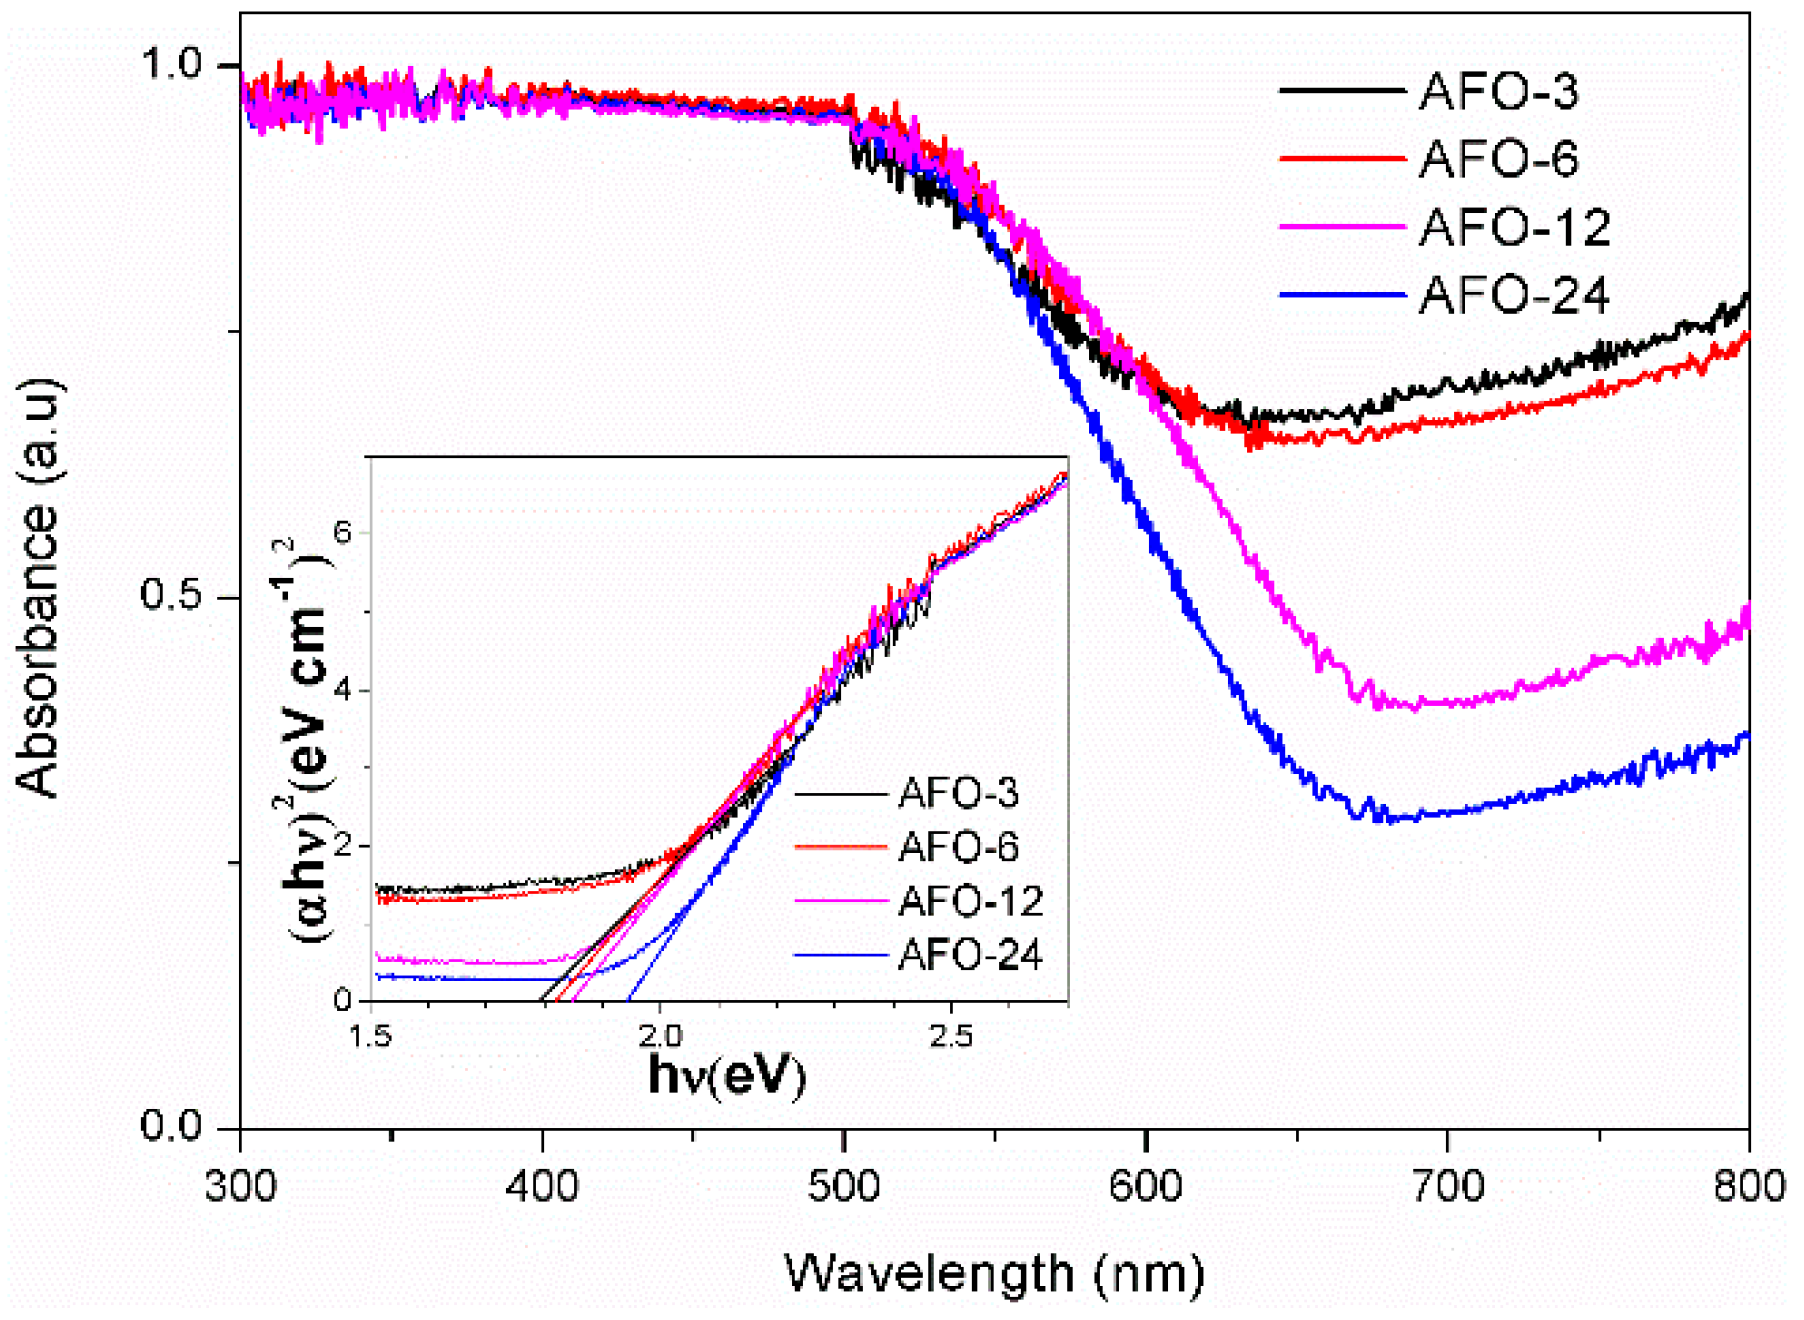
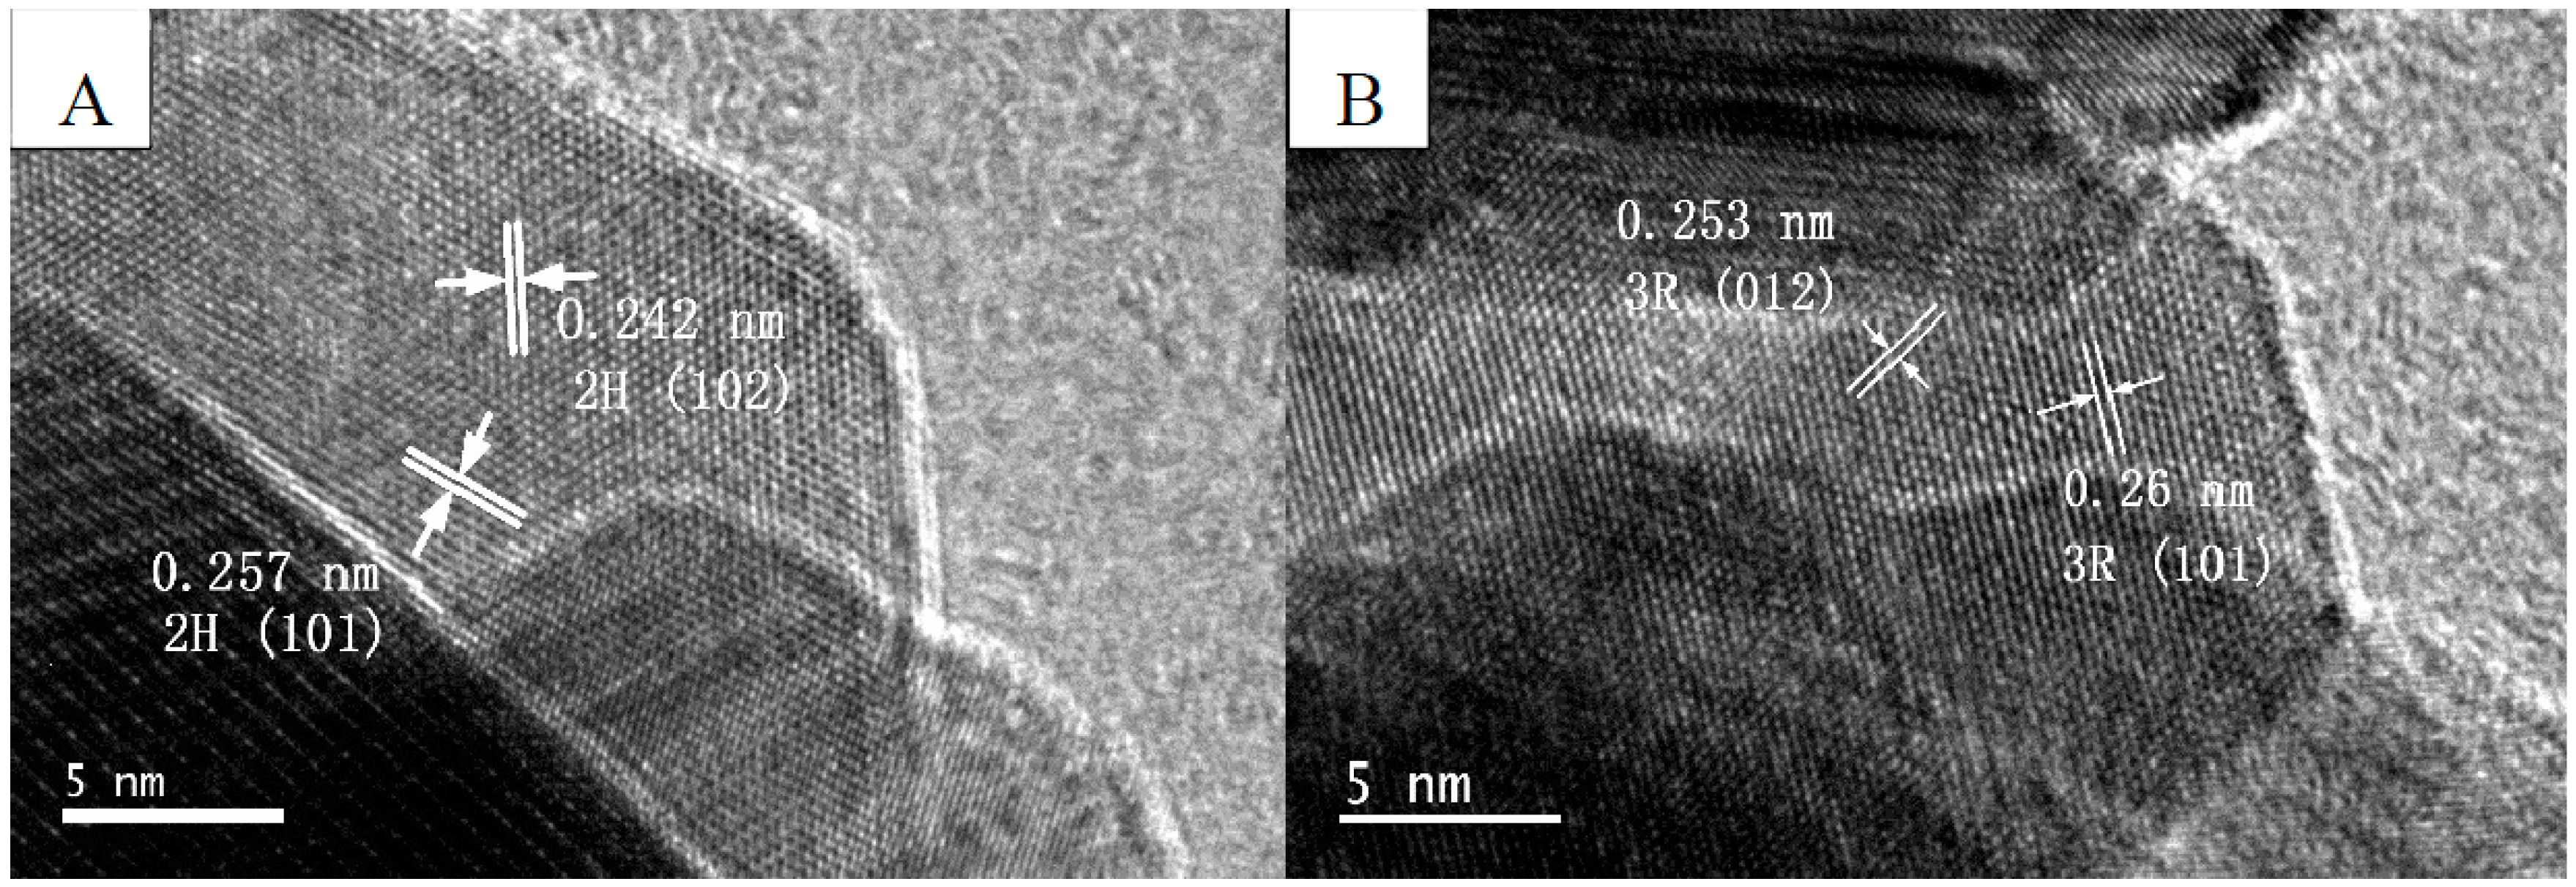
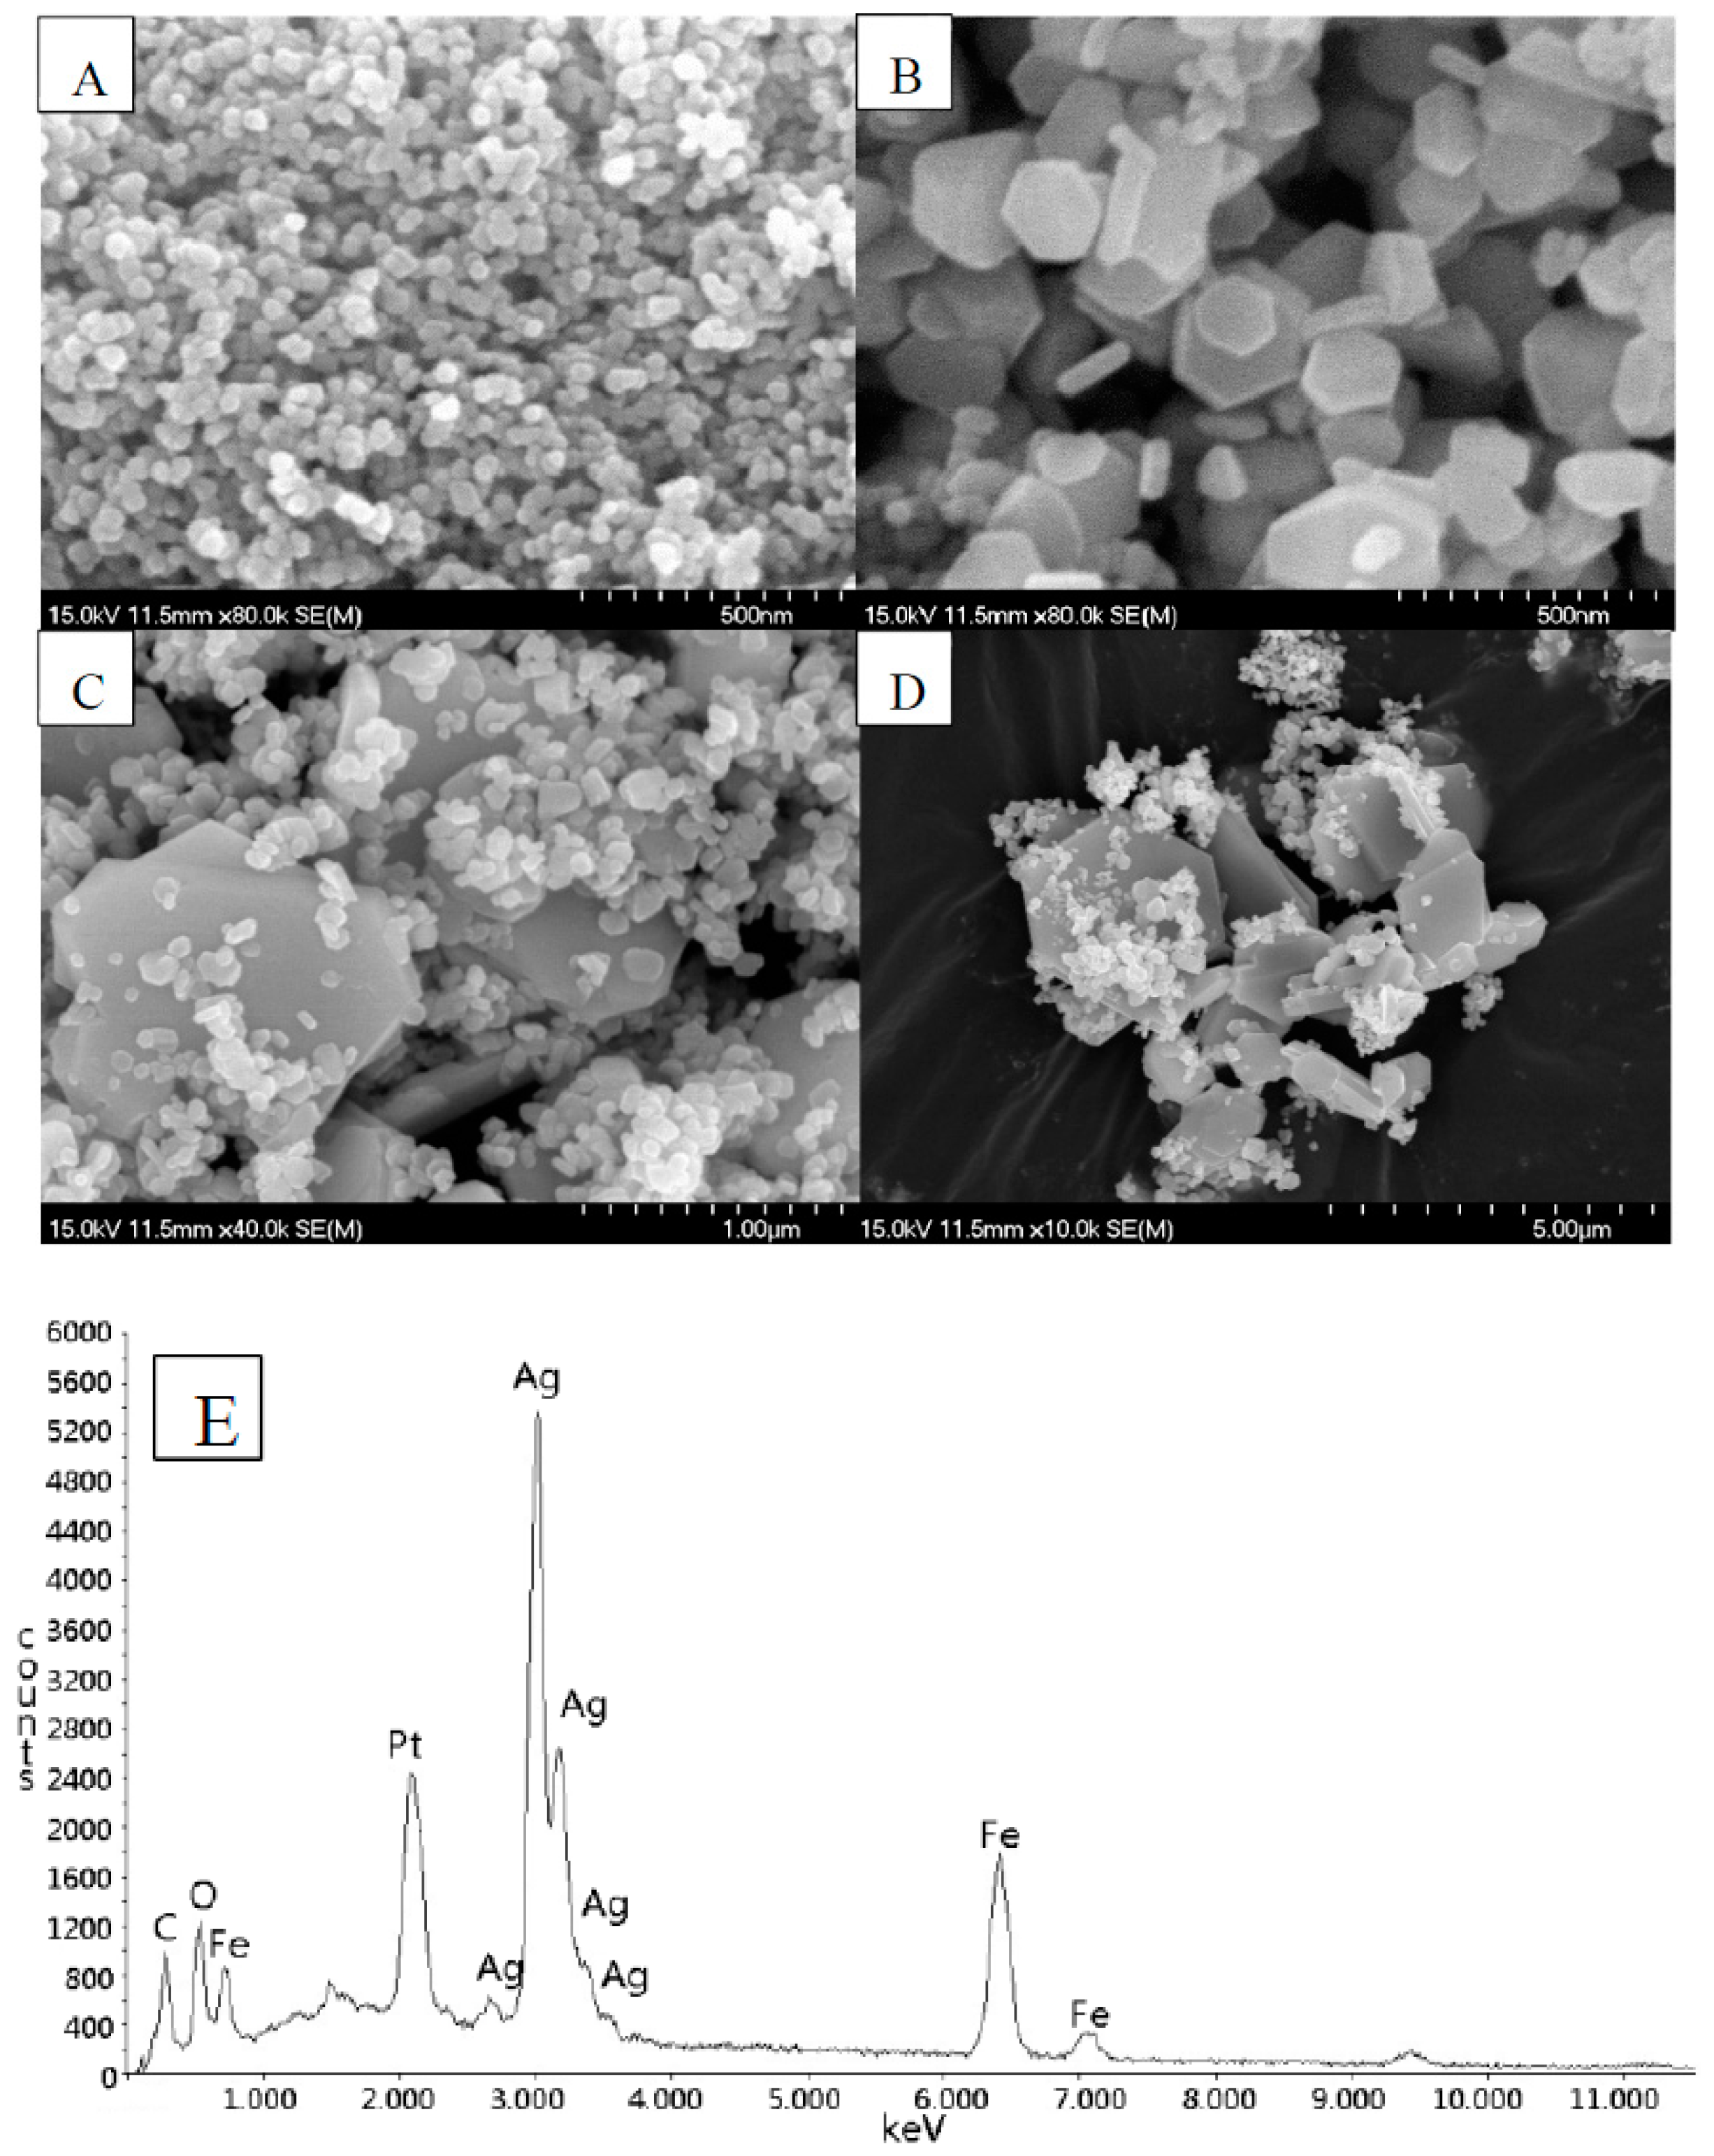
2.1. Structure, Morphology, and Optical Properties

The crystalline phase contents of the AgFeO2 samples with hydrothermal time from 3 h to 24 h were investigated from the X-ray diffraction patterns as displayed in Figure 1. All diffraction peaks can be assigned to α-AgFeO2 (mainly 3R structure, JCPDS: 75-2147, small amount of 2H structure, JCPDS: 25-0765). The co-existence of 3R and 2H phase is common in delafossite structures [14,18]. No peaks from metallic silver, Ag2O, and FeOOH which were reported during the synthesis of AgFeO2 [21] are observed. In the diffraction pattern of AFO-3, the peak intensities are relatively low and the width of its diffraction peaks is broad indicating low crystallization of this sample. As the hydrothermal time increases, the peak intensities of the as-prepared samples become stronger and the widths of the diffraction peaks become narrow. It indicates that more and greater AgFeO2 crystallites form and crystallization enhances with increasing hydrothermal time. A remarkable intensity enhancement is observed for the (00l) reflections in the XRD patterns which indicates AgFeO2 crystal possesses a preferred c-axis orientation. It is a common feature for the majority of the delafossite-type oxides synthesized via hydrothermal treatment [24].
Transmission electron microscope (TEM) characterization was conducted and the high resolution transmission electron microscopy (HRTEM) images of AFO-6 are illustrated in Figure 2. The clear lattice fringes indicate the high-crystallinity of sample. The fringe spacing of 0.242 nm and 0.257 nm agree with the spacing of the (102) and (101) lattice plane of hexagonal AgFeO2 as shown in Figure 2A. The fringe spacing of 0.253 nm and 0.26 nm agree with the spacing of the (012) and (101) lattice plane of rhombohedral AgFeO2 as shown in Figure 2B. The result confirms the co-existence of 2H and 3R phase in AgFeO2.
FE-SEM was performed to study the morphologies and particle size of the as-prepared photocatalysts. The images are illustrated in Figure 3. It reveals that significant growth in particle size as a function of hydrothermal time. Sample AFO-3 consists of homogeneous irregular nanoparticles with the diameter around 50 nm. In sample AFO-6, in addition to irregular nanoparticles, particles shaped into hexagonal platelets with the diameter of 150–250 nm form as presented in Figure 3B. Large plate-like particles appear in sample AFO-12. The particles are about 1 μm in size. With the advance of hydrothermal time, the size of those plate-like particles grows to about 2–3 μm and the amount further increases. Very few irregular nanoparticles can be found in AFO-24 and large plate-like particles is dominant. EDS analysis of AFO-6 was performed in order to further investigate the structure of AgFeO2 as shown in Figure 3E. It is revealed that the prepared AgFeO2 is comprised of Ag, Fe, and O. The Pt element was from conductive coating process for FE-SEM analysis of the sample and the C element was from the substrate. The molar percentage of Ag, Fe, and O were 15.87%, 16.19%, and 34.94%, respectively. The element ratio of Ag, Fe, and O is close to 1:1:2 which is the theoretical element ratio of AgFeO2.
As an important factor for photocatalysis, the Brunauer-Emmett-Teller (BET) specific surface area of each sample was investigated by nitrogen sorption. The surface area exhibits a close relationship with hydrothermal time. AFO-3 possesses the largest specific surface area in all the samples which is 22 m2/g. With increasing hydrothermal time, AgFeO2 samples show a significant decrease in the specific surface areas. The surface area of AFO-6, AFO-12, and AFO-24 are 14 m2/g, 8.8 m2/g, and 2.6 m2/g, respectively. The BET specific surface area of AFO-24 is only one-eighth of AFO-3’s. The decline of surface area is caused by the increasing crystallite sizes of the AgFeO2 samples which is confirmed by FE-SEM results as shown in Figure 3.
Photoabsorption capability is an important factor affecting the photocatalytic performance [25,26]. UV-vis DRS was adopted for evaluation and the results are shown in Figure 4. All the samples exhibited a strong capacity of light absorption in both ultraviolet and visible light regions with a trailing edge in 640–680 nm. It is worth noting that all the samples possessed continuous absorption band at wavelength larger than the absorption edge. The broad absorption indicates the existence of free carriers attributed to impurity states within the gap [27]. Enhanced absorption of visible light at wavelengths larger than the absorption edge can be observed for the AFO-3 and AFO-6 compared to the other two samples. It may be resulting from the enhanced intensity of the scattered light in the photocatalysts with a smaller particle size [28]. The band gap of AgFeO2 samples are determined based on the Kubelka-Munk method by the following equation:
α h ν = A ( h ν E g ) 1 / 2
where α is the absorption coefficient, is the incident photon energy, A is the absorption constant, Eg is the band gap energy. Plots of   ( α h ν ) 2 versus h ν from the spectral data are displayed in the inset of Figure 4. The direct band gaps of AFO-3, AFO-6, AFO-12, and AFO-24 are estimated to be 1.79, 1.82, 1.85, and 1.95 eV, respectively. They are close to the predicted value (1.9 eV) of AgFeO2 from GGA calculations [19].

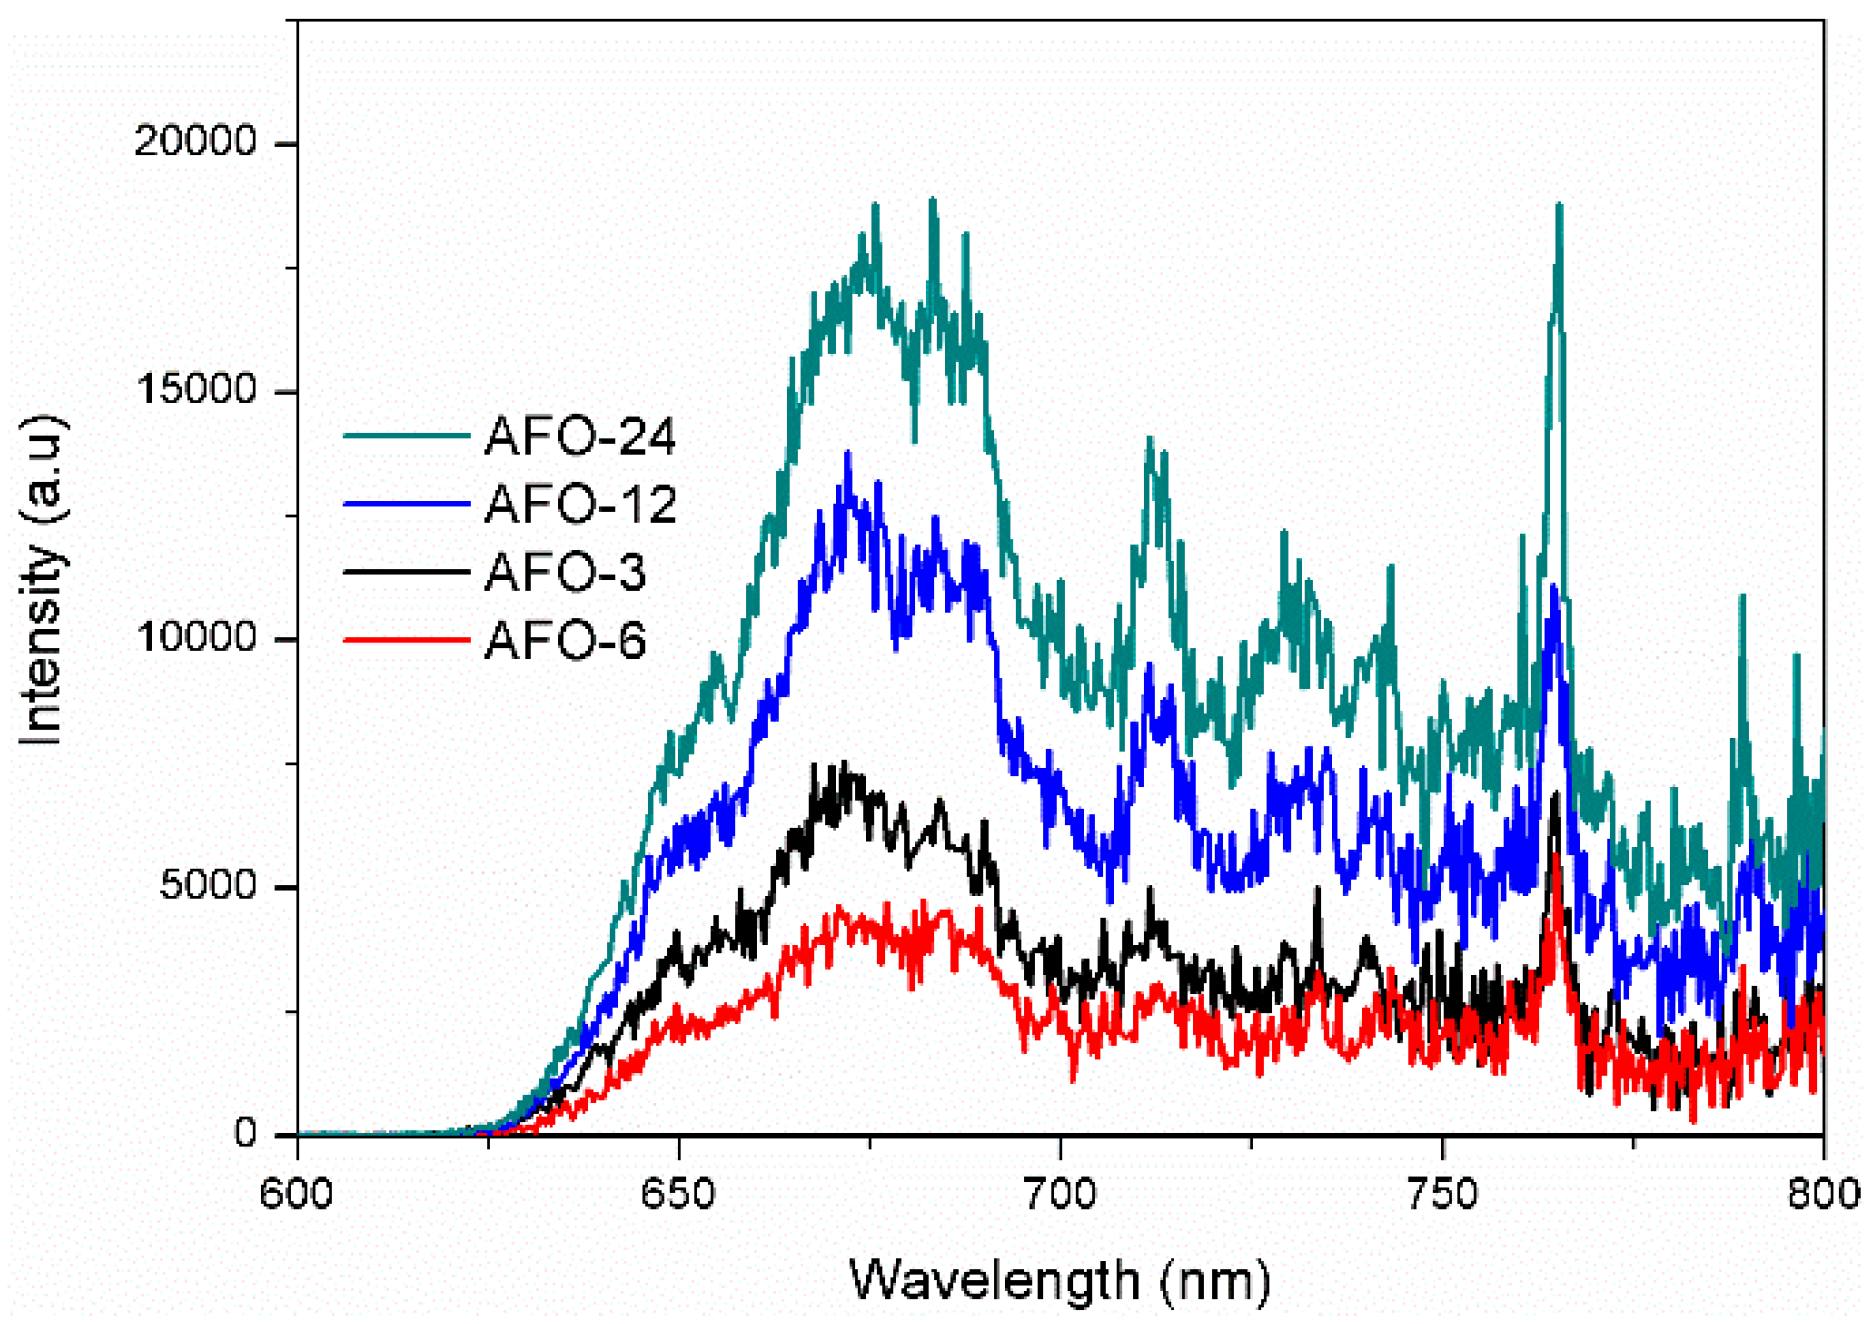
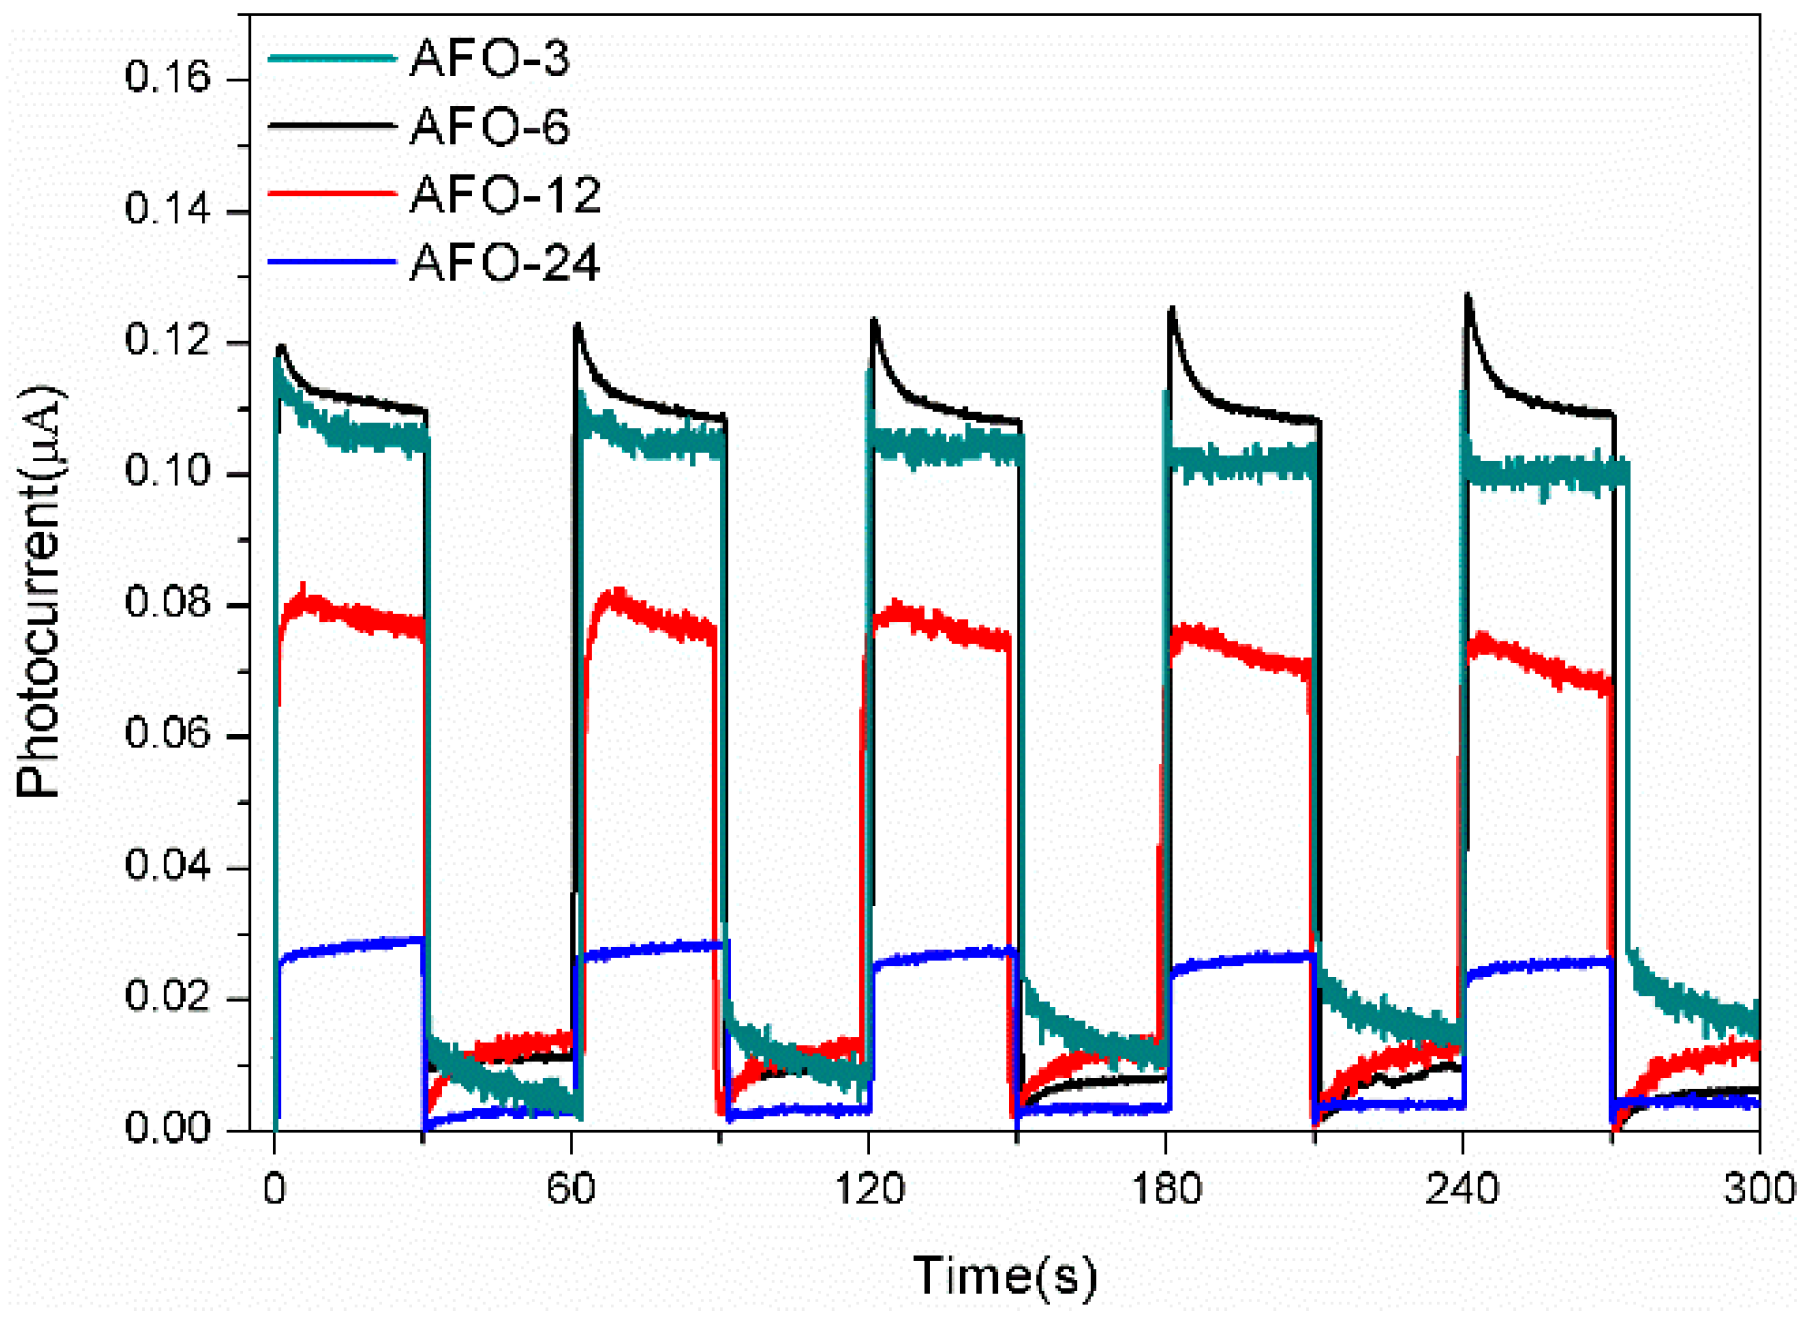
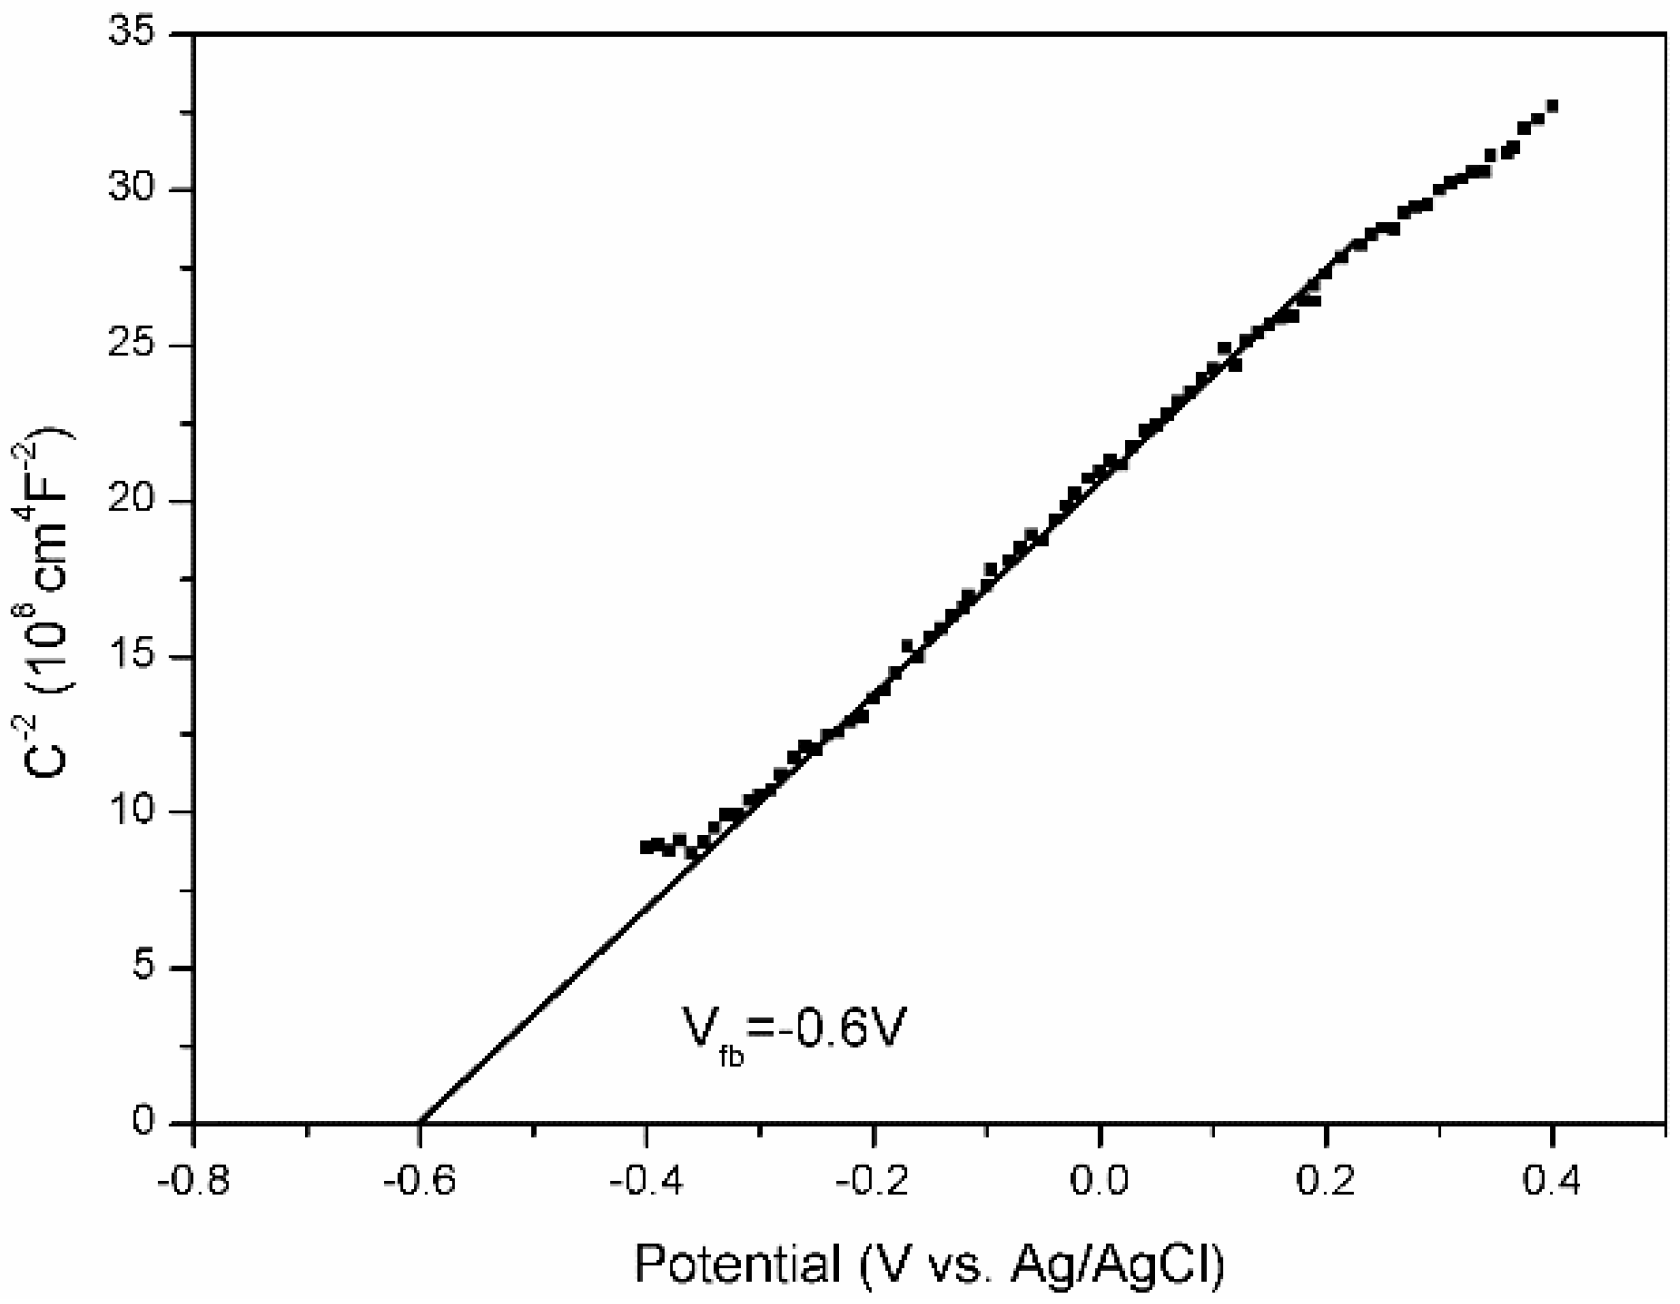
2.2. Photoluminescence and Photocurrent Analysis

PL emission spectrum derived from the recombination of free charge carriers and is widely used for illustration of the photo-generated electron-hole pair recombination process [29]. Namely, the higher photoluminescence intensity is, the higher recombination rate of the electron-hole pairs over the photocatalyst is. Figure 5 shows the comparison of PL spectra with 450 nm excitation wavelength for the AgFeO2 samples with different hydrothermal times at room temperature. The PL intensity decreases as: AFO-24 > AFO-12 > AFO-3 > AFO-6. It reveals that AFO-6 possessed the lowest electron-hole pair recombination rate which could lead to an enhanced photocatalytic activity. A trend toward increased PL intensity with longer hydrothermal time during synthesis process of AgFeO2 can be clearly observed for AFO-24, AFO-12, and AFO-6. This can be ascribed to the increase of particle size during hydrothermal treatment as confirmed in FE-SEM (Figure 3). Limited to carrier mobility, the diffusion length of the photo-generated carriers with photocatalyst crystallite is short. For large size crystallite, many of those carriers recombined before they reach the interface. Hence, the small size of a photocatalyst is generally beneficial for inhibiting the recombination of photo-generated carriers [27]. However, crystalline defects or weak crystallization is common in the small-sized particles, which favors the recombination of electron-hole pairs [30,31,32]. Thus the enhanced PL intensity of AFO-3 compared to AFO-6 can be ascribed to the weak crystallization in AFO-3 which is in accordance with the XRD results as shown in Figure 1.
The photocatalytic redox reactions are closely related to the separation efficiency of photogenerated carriers arose from the excited semiconductors [33]. Photocurrents of AgFeO2 samples were measured under chopped visible light illumination at open circuit. As shown in Figure 6, all the samples exhibit anode photocurrent and the value of photocurrent for each sample follows the order as: AFO-6 > AFO-3 > AFO-12 > AFO-24. The AFO-6 sample possesses the highest photocurrent of 0.11 μA/cm2 which is about four times the photocurrent of AFO-24 (0.25 μA/cm2). The enhanced photocurrent suggests efficient separation efficiency of photogenerated carriers which can contribute to the enhancement of photocatalytic activity. It may result from the relatively high visible light absorption as shown in Figure 4 and low recombination rate of photogenerated electron-hole pairs as presented in PL analysis.

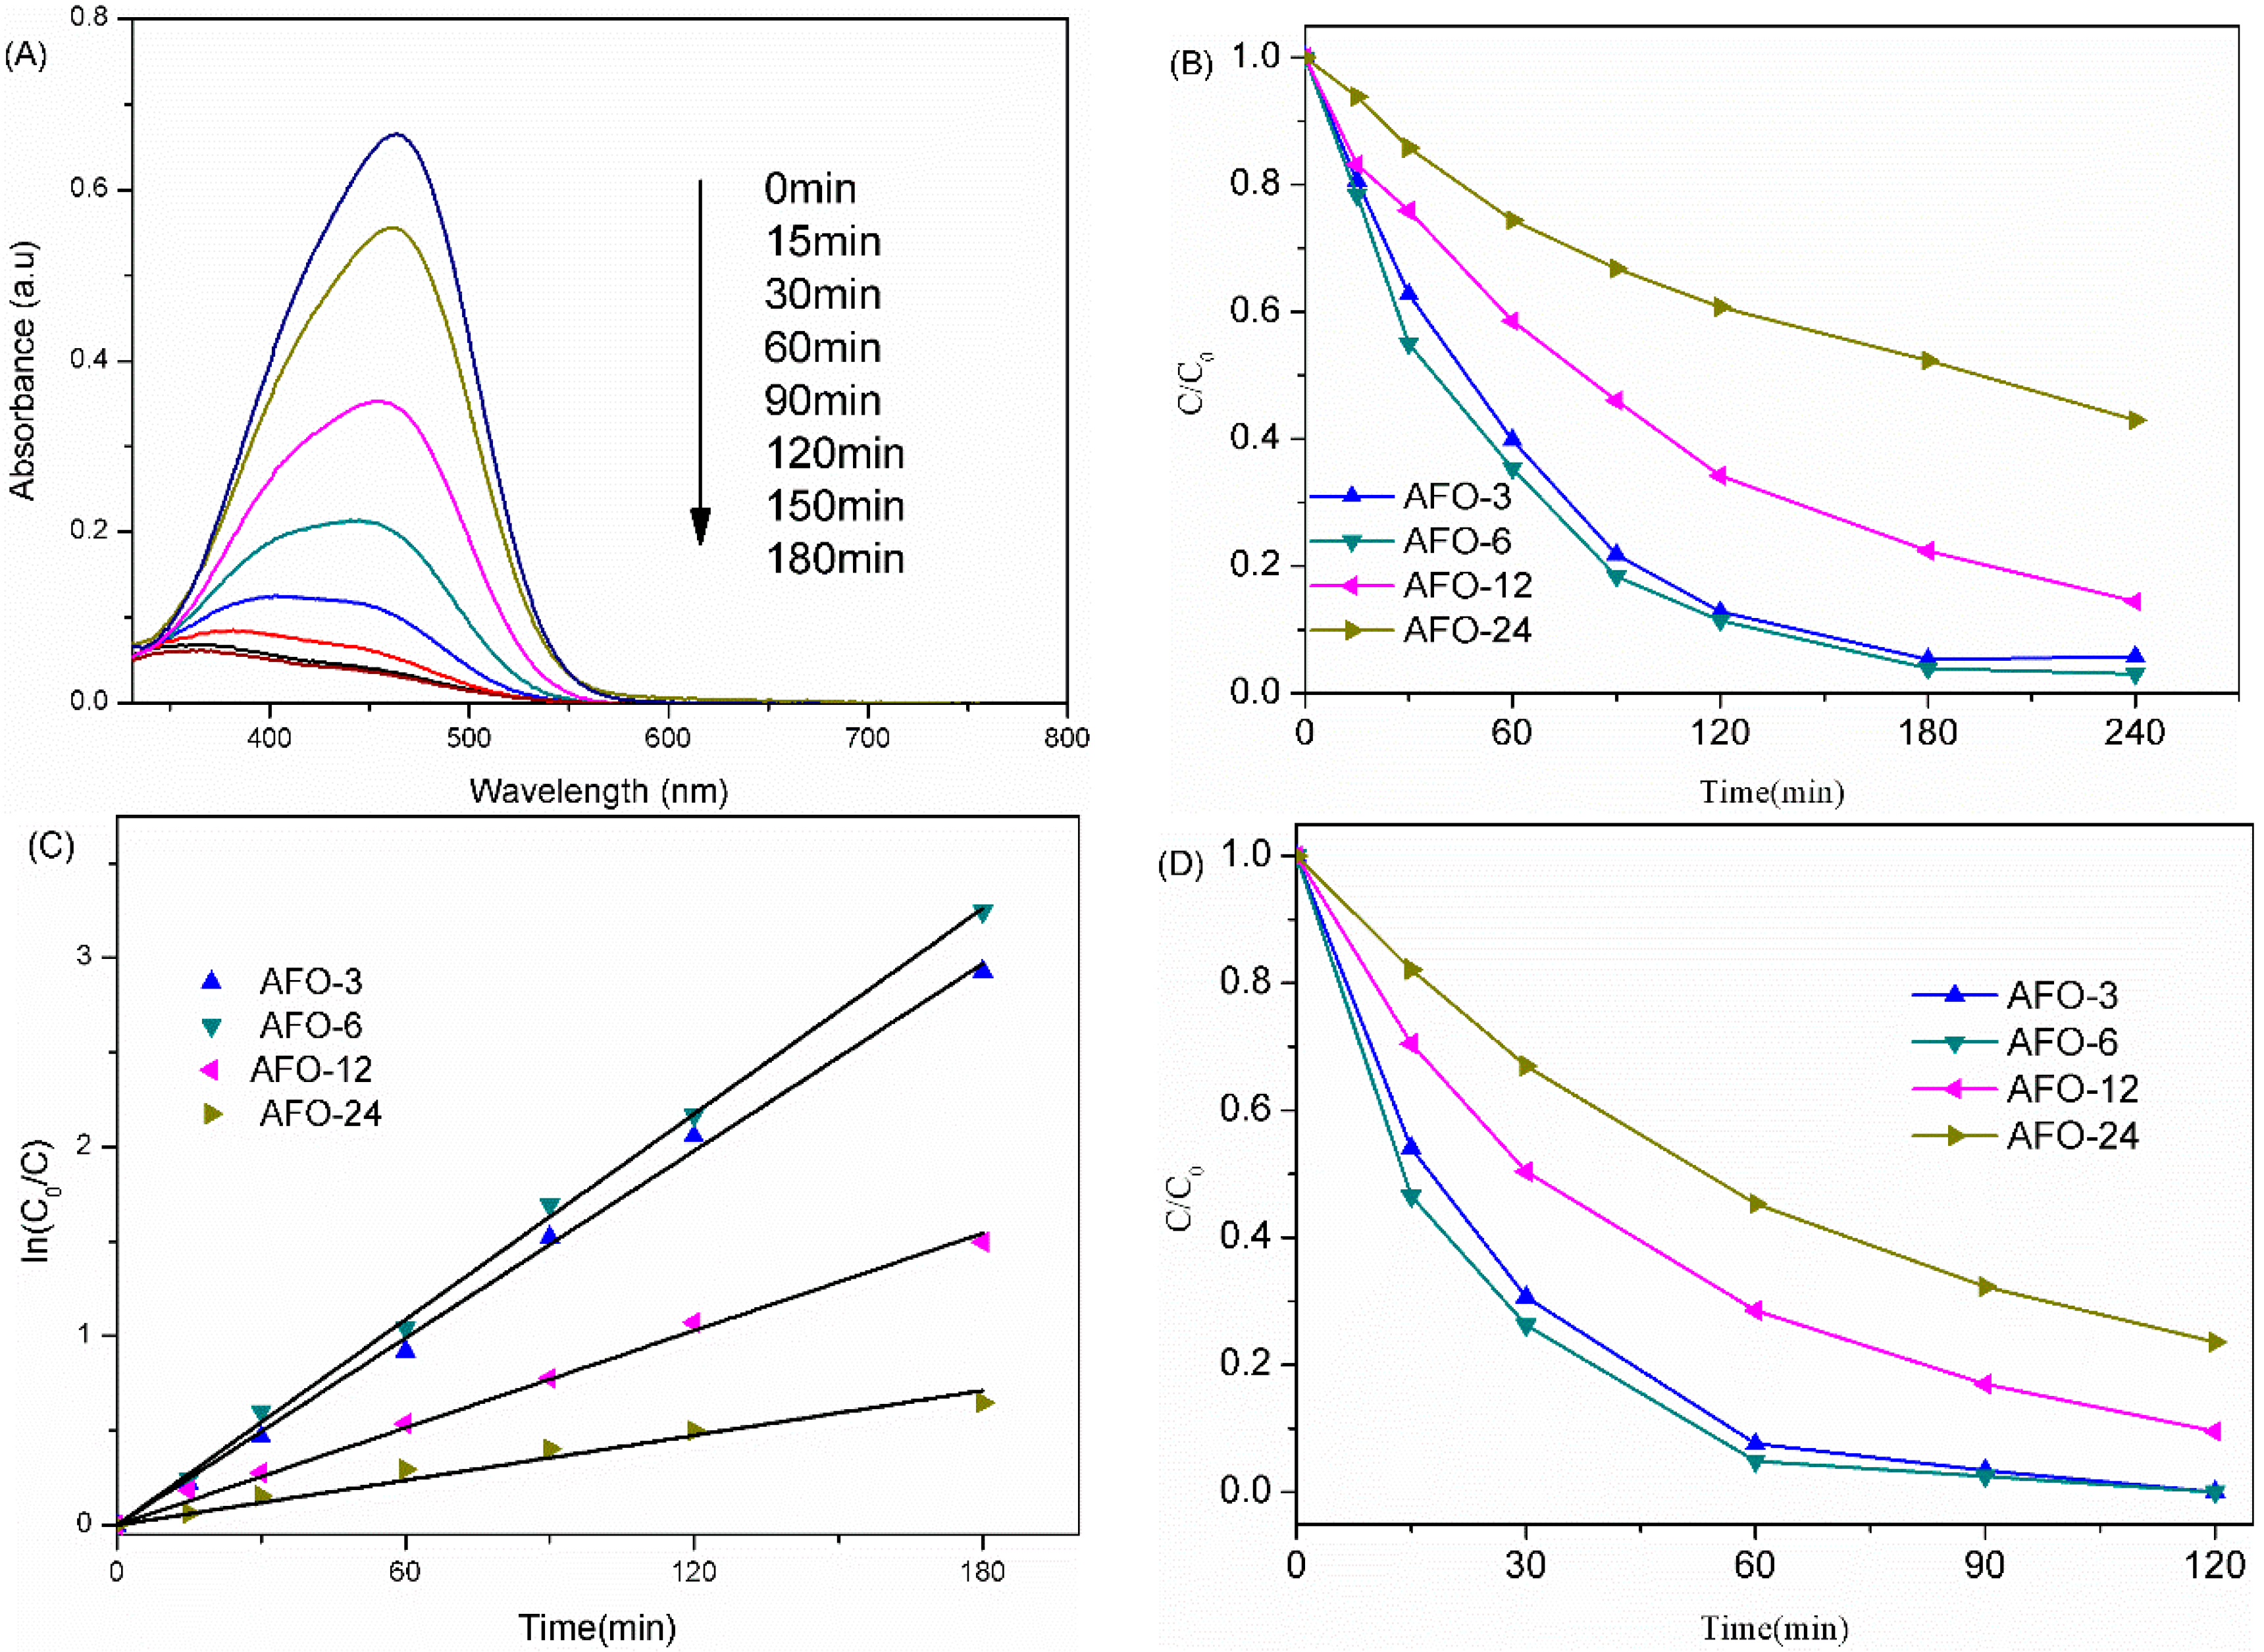
2.3. Photocatalytic Activity of AgFeO2

To evaluate the photocatalytic activities of the as-synthesized AgFeO2 samples, the degradation of MO in aqueous solution under visible light illumination (λ > 420 nm) was carried out. Figure 7A shows the temporal change of absorption spectra of MO solutions as a function of time in the presence of AFO-6. The peak intensity of MO at around 461 nm decreases as the irradiation time increases which suggests the MO structure is broken down over the photocatalyst. After 150 min of irradiation, decolorization of MO is observed and no new absorption peak appears indicating the complete destruction of the chromophoric structure.
The photocatalytic performance of the samples with different hydrothermal time is given in Figure 7B. All the AgFeO2 samples possess photocatalytic activity towards MO solution under visible light irradiation. However, samples with various hydrothermal hours demonstrate significant differences on photodegradation performance. The AFO-6 sample shows the highest activity compared to other samples. 97% of MO is decomposed after 180 min of irradiation while only 45% of MO is decomposed under the same condition for AFO-24. In order to investigate the photoreaction model of AgFeO2, the ln(C0/C) against time t for the MO degradation under visible light is plotted in Figure 7C, where C0 is the initial MO concentration and C is the MO concentration at time t. The linear dependence is obviously seen in the figure. It demonstrates that the photocatalytic degradation reactions of AgFeO2 samples follow pseudo-first-order kinetics. The apparent reaction rate k (min−1) can be calculated from the expression: ln(C0/C) = kt, The reaction rates of AFO-3, AFO-6, AFO-12, and AFO-24 are 0.0165 min−1, 0.0181 min−1, 0.00789 min−1, and 0.00396 min−1, respectively. The largest reaction rate is obtained from AFO-6 and is about 4.6 times of the value for AFO-24. The values of k for the samples in decreasing order are AFO-6, AFO-3, AFO-12, and AFO-24.
Moreover, in order to rule out the dye-sensitization mechanism, Bisphenol A (BPA), a non-colored pollutant was also chosen as the target. The photodegradation of BPA over AgFeO2 under visible light is performed and the result is shown in Figure 7D. All the samples present fair photodegradation ability on BPA. Therefore, it is proven that the degradation of pollutant comes from the photocatalytic process of AgFeO2 instead of dye-sensitization. The degradation of BPA exhibits a similar tendency with MO degradation and AFO-6 possesses the highest photocatalytic activity which achieves 100% removal of BPA in 120 min.
According to the above experimental results, the superior activity of AFO-6 can be attributed to two main factors. One is the relative large surface area of AFO-6. The BET surface area of AFO-6 is 14 m2/g, which was much higher than that of AFO-12 (8.8 m2/g) and AFO-24 (2.6 m2/g). Larger surface area of photocatalysts can lead to possession of more surface active sites that are available for reaction [34]. Moreover, it also brought more surfaces reached by the visible light thus enhanced light harvesting and led to ample photo-generated electron-hole pairs. The other one is the high separation electron-hole pair efficiency of AFO-6. It is generally accepted that whether the electron-hole pairs can be effectively separated is one of the key factors in photocatalytic degradation. The AFO-6 possesses the lowest PL intensity (Figure 5) and the greatest photocurrent (Figure 6) compared to AFO-3, AFO-12, and AFO-24. We can conclude from these results that more separated electron-hole pairs generated in AFO-6 and subsequently enhanced its photocatalytic activity. As a result, although AFO-3 owns a larger surface area than AFO-6, the relatively low separation efficiency limits its photocatalytic efficiency and exhibits lower degradation rate than AFO-6.

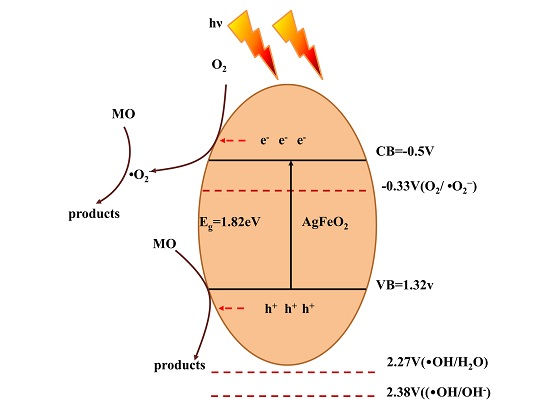
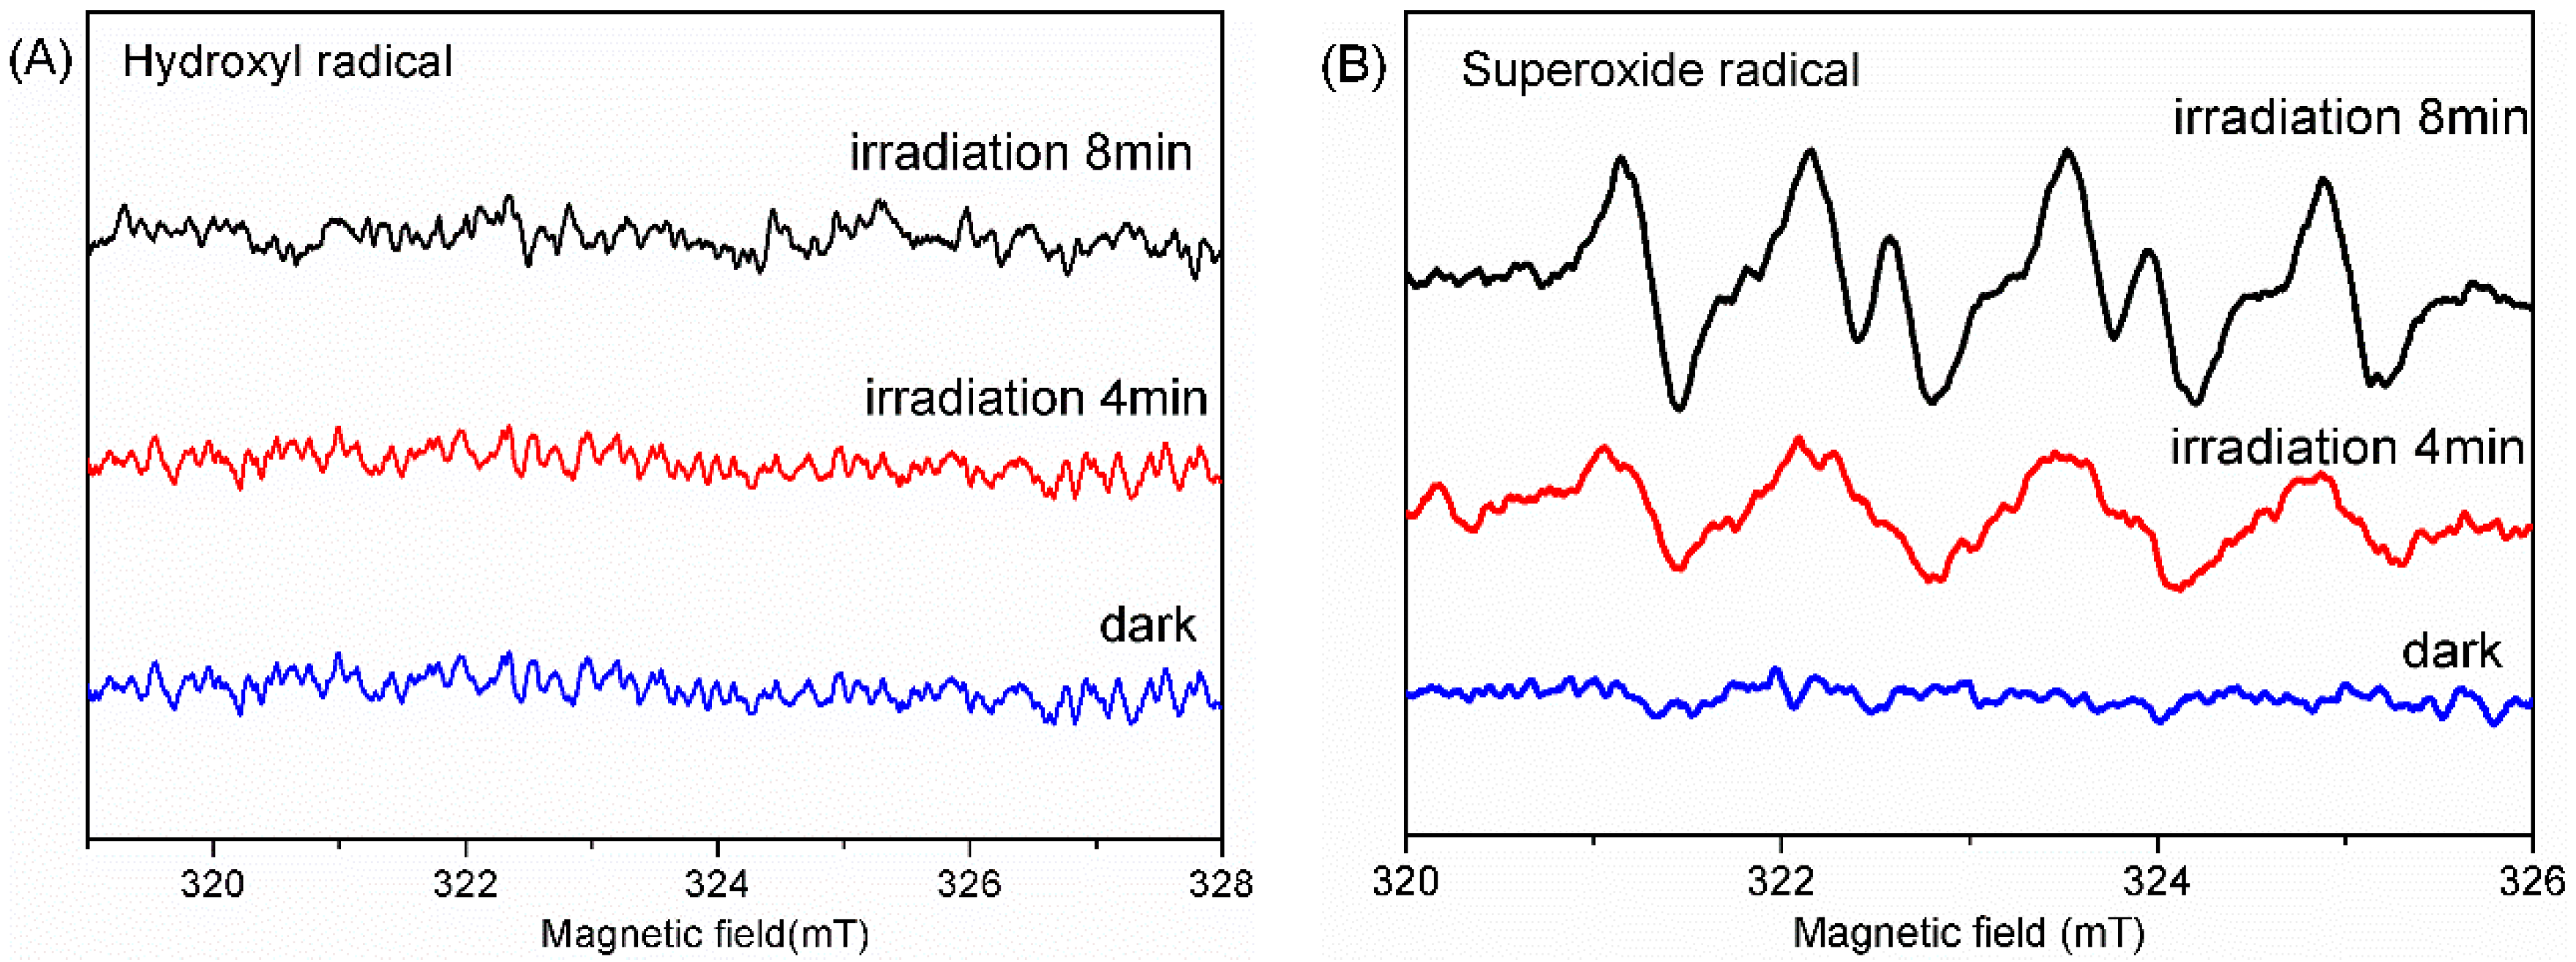
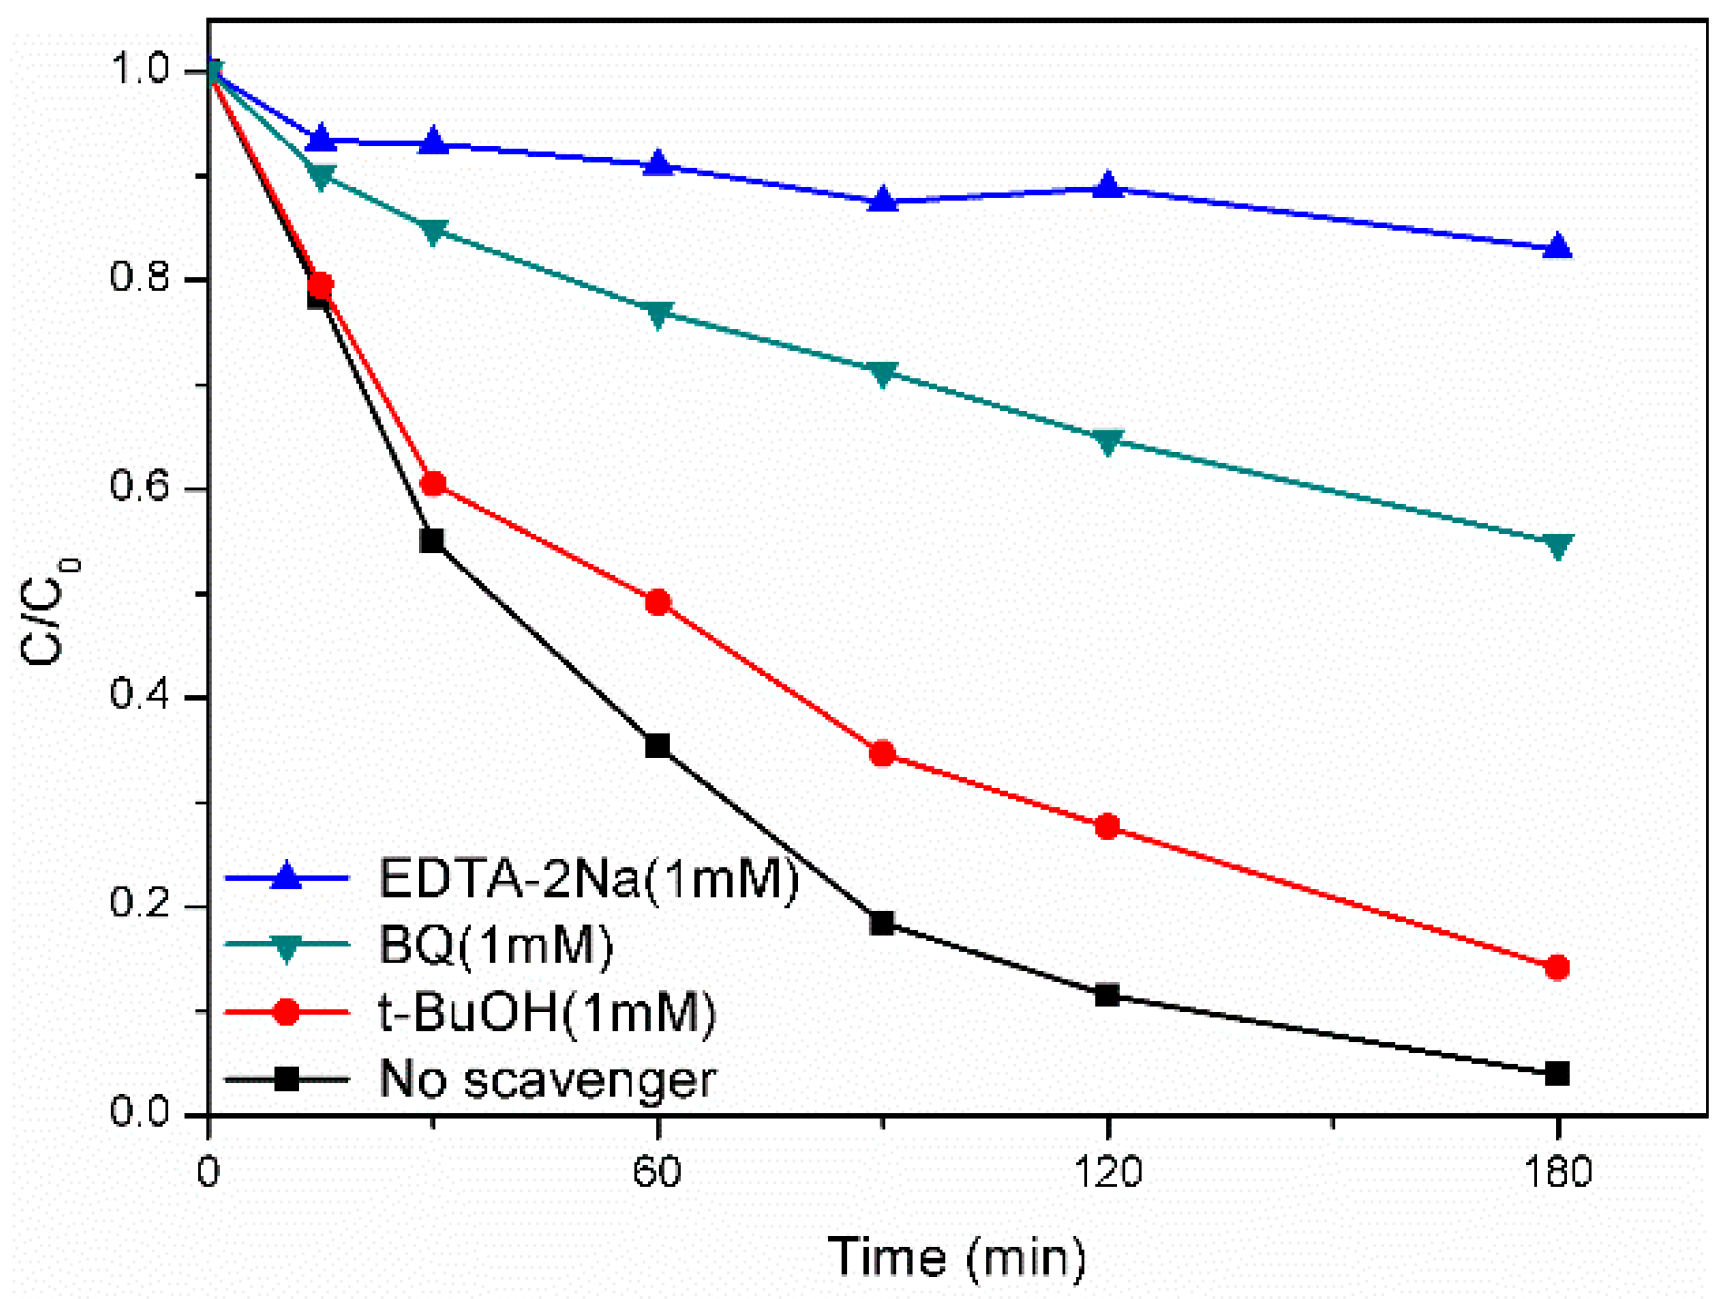
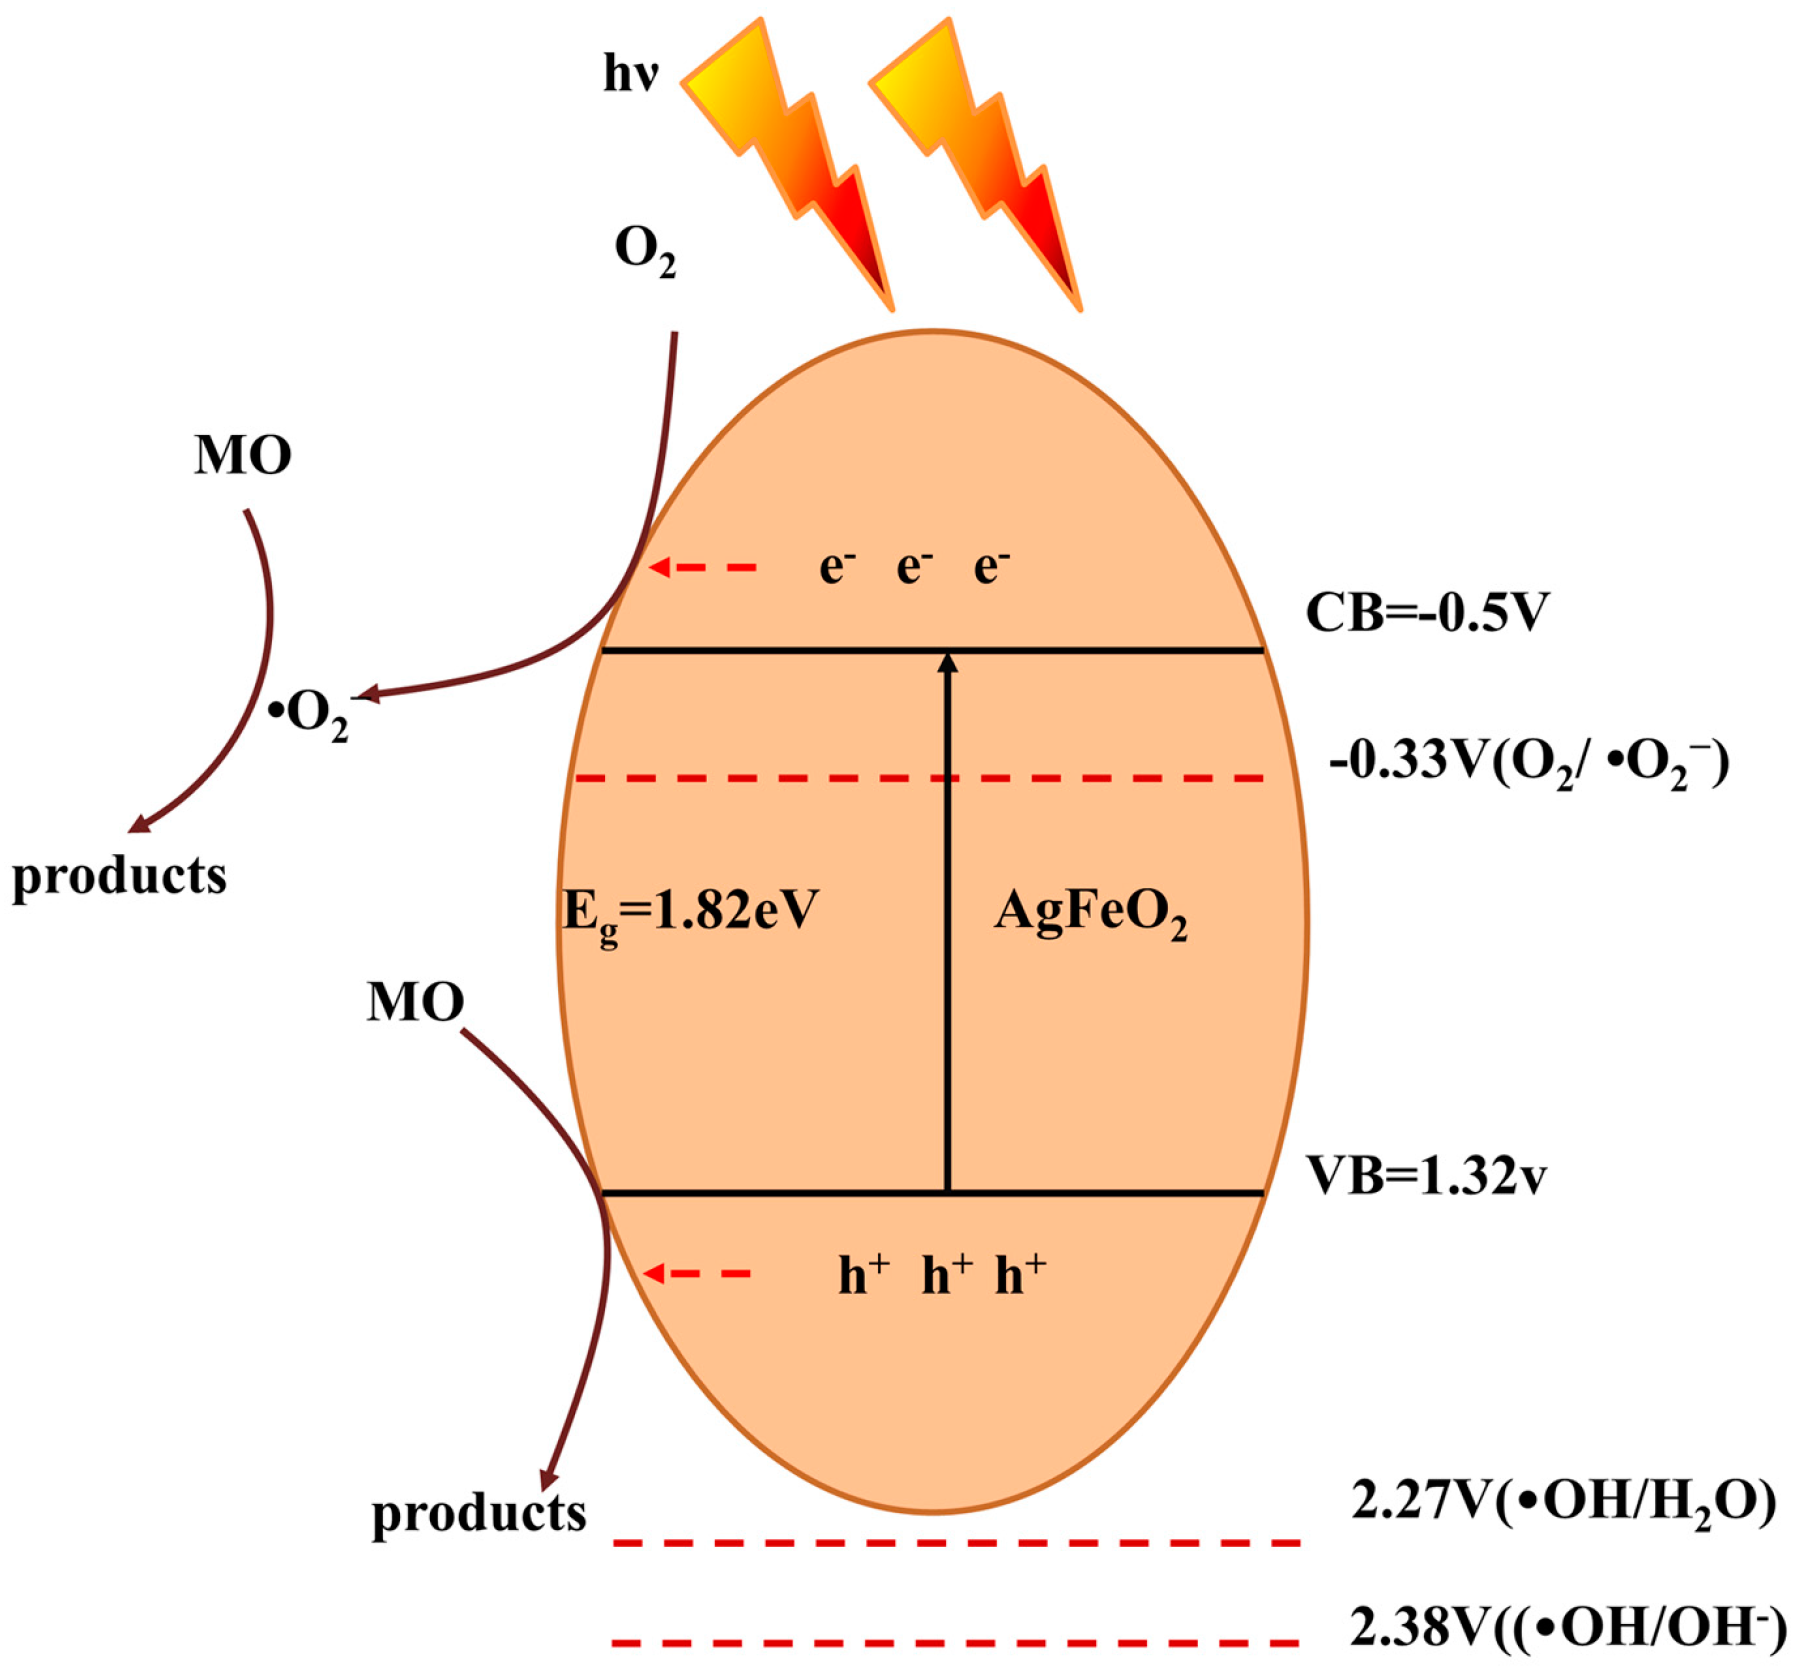
2.4. Photocatalytic Mechanism of AgFeO2

It is well known that the nature and band structure of a photocatalyst is the foundation for exploring its photocatalytic mechanism. An electrochemical method was adopted for investigation. Figure 8 shows the Mott-Schottky plot of AFO-6 obtained in the N2-purged 0.1 M Na2SO4 solution at 5 kHz. The positive slope of the curve indicates the n-type nature of the sample. This is in agreement with the generation of anode current under visible light illumination. The conduction band potential (ECB) of the n-type semiconductor is located 0.1–0.2 V above the flatband potential (Efb). By extrapolation, the Mott-Schottky plot, Efb of AFO-6 was estimated to be −0.6V versus Ag/AgCl (equivalent to −0.4V vs. NHE at pH = 7). Therefore, ECB of AFO-6 is about −0.5V. The valence band potential (EVB) of AFO-6 is calculated using
EVB = ECB + Eg
As discussed above, Eg of AFO-6 is 1.82 eV thus the EVB values are calculated to be 1.32 V.
It is of paramount importance to detect the main active species in the photocatalytic mechanism of synthesized AgFeO2. As photo-generated hole (h+), ·OH and ·O2 are the main active species in the photodegradation process, the detection was realized by applying activated species trapping experiment. A certain amount of ethylenediaminetetraacetic acid disodium salt (EDTA-2Na), tert-butanol (t-BuOH), and benzoquinone (BQ) was separately utilized as trapping agent for hole, ·OH and ·O2−, respectively [35,36]. With regard to AFO-6, the suppressive degree of degradation rate with different trap agents shows distinct difference as illustrated in Figure 9. The addition of t-BuOH exhibits only a little inhibition of degradation photocatalytic activity. It can be inferred that the ·OH radical is not crucial in MO photodegradation process. On the other hand, the addition of EDTA-2Na almost completely suppresses the degradation of MO. Only 17% of MO is decomposed by AFO-6 after 180 min while 96% is under the same condition without h+ trapping agent. It suggests that the holes are the dominant oxidative species in AgFeO2 photocatalytic process. Moreover, the addition of BQ also significantly retards the degradation rate which reveals that ·O2 played an important role in the reaction. ESR spin-trap with 5,5-dimethyl-1-pyrroline N-oxide (DMPO) measurement of AFO-6 was introduced to further investigate the generation of radical species. As displayed in Figure 10A, no characteristic four peaks of DMPO-·OH with intensity 1:2:2:1 exist before or after visible light irradiation. It suggests that in the photocatalytic process of AgFeO2, ·OH radicals are absent. However, characteristic peaks of DMPO-·O2 are observed under visible light illumination as illustrated in Figure 10B. It confirms the existence of ·O2 under irradiation.
Based on the experimental results mentioned above, a possible photocatalytic reaction mechanism of AgFeO2 is proposed as displayed in Scheme 1. When subject to the visible light irradiation, electron-hole pairs were generated in AgFeO2 and then they migrated to the surface of AgFeO2. The EVB potential of AgFeO2 (1.32 V) is not positive enough compared with the standard reduction potential of ·OH /H2O (2.27 V) or ·OH /OH (2.38 V). It is not possible for the production of ·OH from h+ thus the photocatalytic degradation of MO is attributed to direct oxidation from h+ rather than ·OH. For photogenerated electrons, the ECB potential of AgFeO2 is more negative than E0 (O2/·O2) (−0.33 V vs. NHE) [37]. Therefore, those electrons are captured by dissolved O2 in the dye solution to produce ·O2 which are also able to degrade MO effectively. In a word, the high photocatalytic activity of AgFeO2 for MO mainly attributes to h+ as well as ·O2, and h+ is the leading oxidant.

3. Materials and Methods

3.1. Synthesis

All the chemicals used in this study were of analytical reagent grade without further purification. AgFeO2 were synthesized by a hydrothermal reaction of Fe(NO3)3∙9H2O and AgNO3. Typically, 4 mmol Fe(NO3)3∙9H2O and 4 mmol AgNO3 were dissolved in 40 mL of deionized water. After stirred for 10 min, 20 mL 1.6 M NaOH solution was added to the above mixed solution drop by drop. The mixture was stirred for another 30 min and transferred to an 80 mL Teflon autoclave. Then, the aqueous suspensions were heated at 160 °C for 3 h, 6 h, 12 h, and 24 h, respectively. The obtained precipitations were cooled to room temperature, filtered, and washed with distilled water as well as ethanol for several times to remove un-reacted reagents, and then dried at 60 °C for 6 h in darkness. Finally, a series of samples with different reaction times were prepared, and the corresponding products were denoted as AFO-3, AFO-6, AFO-12, and AFO-24.

3.2. Characterization

X-ray diffraction (XRD) of the samples was performed using an X’Pert Pro PANalytical (PANalytical, Almelo, The Netherlands ) X-ray diffract meter with Cu-Kα radiation (γ = 0.154 nm) in the 2θ range of 10°–80°. The accelerating voltage and the applied current were 40 kV and 40 mA, respectively. The field emission scanning electron microscopy (FE-SEM, Hitachi, Tokyo, Japan) images of the samples were recorded using a HITACHIS-4700 field emission scanning electron microscope coupled with an energy dispersive spectrometer (EDS). Transmission electron microscope (TEM) characterization was conducted on a FEI Tecnai G2 F20 S-TWIN transmission electron (FEI, Hillsboro, OR, USA). The specific surface area was measured by the Brunauer–Emmett–Teller (BET) method from the N2 adsorption-desorption isotherm. The UV-vis diffuse reflectance spectra (UV-vis DRS) was obtained by employing a Pgeneral TU-1901 spectrophotometer (Pgeneral, Beijing, China) using BaSO4 as the reflectance standard. An Edinburgh Instrument FlSP920 photoluminescence spectrometer (Edinburgh Instrument, Livingston, UK) was used for the photoluminescence (PL) spectra of the catalysts at room temperature. The excitation wavelength was 450 nm. The electron spin resonance (ESR) technique (with DMPO) was used to detect the radical species on a JEOL JES FA200 electron paramagnetic resonance spectrometer (JEOL Ltd., Tokyo, Japan).
The photoelectrochemical measurements were performed in a conventional three-electrode cell equipped with a quartz window on CHI 660D electrochemical workstation (Chenhua Instruments, Shanghai, China). The Ag/AgCl electrode was the reference electrode and a platinum sheet served as the counter electrode. The working electrodes were photocatalyst films. The preparation procedure is as follows: 20 mg of as-prepared AgFeO2 sample was added to a solution containing 1 mL of dimethylformamide (DMF) and 20 μL of Nafion DE 520 solution (5 wt. %, DuPont, Wilmington, USA). The mixture was ultrasonically dispersed for 40 min. Then 40 μL of the homogeneous mixture was dispersed on a fixed 10 mm × 10 mm area of a cleaned indium-tin oxide (ITO) glass with a size of 20 mm × 40 mm. The remaining part of the ITO glass was sealed with epoxy resin. The estimated loading amount of AgFeO2 is 0.78 mg/cm2. After drying at room temperature, the as-prepared electrode was further annealed at 80 °C in a vacuum oven overnight to remove the resin and uniform red-brown AgFeO2 film electrodes were obtained. 0.1 M Na2SO4 solution purged with N2 gas was used as the electrolyte. Photocurrent-time curves were recorded at open circuit potential with 30 s light on/off cycles. Mott-Schottky analysis was performed by sweeping the range of −0.75–1.25 V versus V Ag/AgCl with a frequency of 5 kHz under dark conditions.

3.3. Photocatalytic Evaluation

The evaluation of photocatalytic activities was performed by examining degradation properties of MO (100 mL, 10 mg/L) and BPA with 100 mg of the as-synthesized photocatalyst in a double-walled reactor with water coolant. A 300 W Xe lamp with a 420 nm cutoff filter fixed above the reactor was used as light source. The suspension was magnetic stirred for 30 min in darkness to reach adsorption-desorption equilibrium before irradiation. At given time intervals, 3.5 mL of sample from the irradiated suspension was taken and centrifuged at 10,000 rpm for 10 min to obtain pollutant solution without photocatalyst. The concentration of MO was analyzed on a UV-vis spectrophotometer (TU-1800PC, Pgeneral, Shanghai, China) at 461 nm. The concentration of BPA was recorded using a high-performance liquid chromatography (HPLC, LC-2010A HT, Shimadzu, Kyoto, Japan) with a UV-vis detector. An Inertsil ODS-SP column was used and a mixture of acetonitrile and water (65/35, v/v) was used as mobile phase. The flow rate was set at 1.0 mL/min and the detection wavelength was 276 nm.

4. Conclusions

In summary, novel n-type AgFeO2 photocatalysts were synthesized via hydrothermal procedure with different reaction times. The samples exhibit distinct visible light induced photodegradation efficiency in methyl orange with varied hydrothermal reaction time. AgFeO2 with six-hour hydrothermal procedure demonstrated the optimal degradation efficiency which could lead to 97% of methyl orange decomposition in 180 min. The enhanced photocatalytic performance is attributed to the combined effect of relatively large surface area and high separation electron-hole pair efficiency. On the basis of Mott-Schottky plot and UV-vis DRS experimental results, the valence and conduction band potentials of AgFeO2 were calculated to be 1.32 V and −0.5 V, respectively. The higher conduction band position than E0 (O2/·O2) and higher valence band position than ·OH /H2O or ·OH /OH led to the existence of ·O2 and the absence of ·OH which were confirmed by ESR tests. Holes and ·O2 were the main reactive species for efficient photodegradation of methyl orange in the AgFeO2 photocatalytic system. This work demonstrates a comprehensive study of AgFeO2 as an efficient photocatalyst for aqueous pollutant oxidation. In addition, the narrow band gap and high conduction band position of this material revealed from experiments might also make it a strong candidate for H2 production in the future.

Acknowledgments

This work was supported by National Major Science and Technology Program for Water Pollution Control and Treatment of China (No. 2014ZX07101-012) and Major Science and Technology Projects Focus on Social Development Projects of Zhejiang Province (Nos. 2014C03002).

Author Contributions

L.Y conceived and designed the experiments; L.Y., Y.S., and R.F. conducted the experiments; L.Y. and L.L. analyzed the data; L.Y. drafted the manuscript. X.W and H.S. revised it.

Conflicts of Interest

The authors declare no conflict of interest.

References

  1. Ge, S.; Zhang, L. Efficient visible light driven photocatalytic removal of RhB and NO with low temperature synthesized In(OH)xSy hollow nanocubes: A comparative study. Environ. Sci. Technol. 2011, 45, 3027–3033. [Google Scholar] [CrossRef] [PubMed]
  2. Li, X.; Zhang, P.; Jin, L.; Shao, T.; Li, Z.; Cao, J. Efficient photocatalytic decomposition of perfluorooctanoic acid by indium oxide and its mechanism. Environ. Sci. Technol. 2012, 46, 5528–5534. [Google Scholar] [CrossRef] [PubMed]
  3. Zhao, J.; Yang, X. Photocatalytic oxidation for indoor air purification: A literature review. Build. Environ. 2003, 38, 645–654. [Google Scholar] [CrossRef]
  4. Herrmann, J.M. Heterogeneous photocatalysis: Fundamentals and applications to the removal of various types of aqueous pollutants. Catal. Today 1999, 53, 115–129. [Google Scholar] [CrossRef]
  5. Xiao, X.; Hu, R.; Liu, C.; Xing, C.; Zuo, X.; Nan, J.; Wang, L. Facile microwave synthesis of novel hierarchical Bi24O31Br10 nanoflakes with excellent visible light photocatalytic performance for the degradation of tetracycline hydrochloride. Chem. Eng. J. 2013, 225, 790–797. [Google Scholar] [CrossRef]
  6. Andersen, J.; Pelaez, M.; Guay, L.; Zhang, Z.; O’Shea, K.; Dionysiou, D.D. NF-TiO2 photocatalysis of amitrole and atrazine with addition of oxidants under simulated solar light: Emerging synergies, degradation intermediates, and reusable attributes. J. Hazard. Mater. 2013, 260, 569–575. [Google Scholar] [CrossRef] [PubMed]
  7. Zhao, W.; Guo, Y.; Faiz, Y.; Yuan, W.T.; Sun, C.; Wang, S.M.; Deng, Y.H.; Zhuang, Y.; Li, Y.; Wang, X.; et al. Facile in-suit synthesis of Ag/AgVO3 one-dimensional hybrid nanoribbons with enhanced performance of plasmonic visible-light photocatalysis. Appl. Catal. B 2015, 163, 288–297. [Google Scholar] [CrossRef]
  8. Tran, P.D.; Wong, L.H.; Barber, J.; Loo, J.S.C. Recent advances in hybrid photocatalysts for solar fuel production. Energ. Environ. Sci. 2012, 5, 5902–5918. [Google Scholar] [CrossRef]
  9. Pan, B.; Xie, Q.; Wang, H.; Zhu, J.; Zhang, Y.; Su, W.; Wang, X. Synthesis and photocatalytic hydrogen production of a novel photocatalyst LaCO3OH. J. Mater. Chem. A 2013, 1, 6629–6634. [Google Scholar] [CrossRef]
  10. Konta, R.; Kato, H.; Kobayashi, H.; Kudo, A. Photophysical properties and photocatalytic activities under visible light irradiation of silver vanadates. Phys. Chem. Chem. Phys. 2003, 5, 3061–3065. [Google Scholar] [CrossRef]
  11. Feng, M.; Song, J.M.; Li, X.G.; Yu, S.H. Ultralong Silver Trimolybdate Nanowires: Synthesis, Phase Transformation, Stability, and Their Photocatalytic, Optical, and Electrical Properties. ACS Nano 2011, 5, 6726–6735. [Google Scholar] [CrossRef] [PubMed]
  12. Yi, Z.; Ye, J.; Kikugawa, N.; Kako, T.; Ouyang, S.; Stuart-Williams, H.; Yang, H.; Cao, J.; Luo, W.; Li, Z. An orthophosphate semiconductor with photooxidation properties under visible-light irradiation. Nat. Mater. 2010, 9, 559–564. [Google Scholar] [CrossRef] [PubMed]
  13. Xu, C.; Liu, Y.; Huang, B.; Li, H.; Qin, X.; Zhang, X.; Dai, Y. Preparation, characterization, and photocatalytic properties of silver carbonate. Appl. Surf. Sci. 2011, 257, 8732–8736. [Google Scholar] [CrossRef]
  14. Yoshihiko Maruyama, H.I.; Hashimoto, K. Visible Light Sensitive Photocatalyst, Delafossite Structured r-AgGaO2. J. Phys. Chem. B 2006, 110, 23274–23278. [Google Scholar] [CrossRef] [PubMed]
  15. Xu, D.; Cao, S.; Zhang, J.; Cheng, B.; Yu, J. Effects of the preparation method on the structure and the visible-light photocatalytic activity of Ag2CrO4. Beilstein J. Nanotechnol. 2014, 5, 658–666. [Google Scholar] [CrossRef] [PubMed]
  16. Abdelhamid, H.N.; Talib, A.; Wu, H.F. Facile synthesis of water soluble silver ferrite (AgFeO2) nanoparticles and their biological application as antibacterial agents. RSC Adv. 2015, 5, 34594–34602. [Google Scholar] [CrossRef]
  17. Shi, Z.; Wang, T.; Lin, H.; Wang, X.; Ding, J.; Shao, M. Excellent surface-enhanced Raman scattering (SERS) based on AgFeO2 semiconductor nanoparticles. Nanoscale 2013, 5, 10029–10033. [Google Scholar] [CrossRef] [PubMed]
  18. Jessica, K.K.; Durham, L.; Takeuchi, E.S.; Marschilokac, A.C.; Takeuchi, K.J. Synthetic control of composition and crystallite size of silver ferrite composites profound electrochemistry impacts. Chem. Comm. 2015, 51, 5120–5123. [Google Scholar]
  19. Ong, K.P.; Bai, K.; Blaha, P.; Wu, P. Electronic Structure and Optical Properties of AFeO2 (A = Ag Cu) within GGA Calculations. Chem. Mater. 2007, 19, 634–640. [Google Scholar] [CrossRef]
  20. Dong, H.; Li, Z.; Xu, X.; Ding, Z.; Wu, L.; Wang, X.; Fu, X. Visible light-induced photocatalytic activity of delafossite AgMO2 (M = Al, Ga, In) prepared via a hydrothermal method. Appl. Catal. B 2009, 89, 551–556. [Google Scholar] [CrossRef]
  21. Krehula, S.; Musić, S. Formation of AgFeO2, α-FeOOH, and Ag2O from mixed Fe(NO3)3–AgNO3 solutions at high pH. J. Mol. Struct. 2013, 1044, 221–230. [Google Scholar] [CrossRef]
  22. Farley, K.E.; Marschilok, A.C.; Takeuchi, E.S.; Takeuchi, K.J. Synthesis and Electrochemistry of Silver Ferrite. Electrochem. Solid State Lett. 2012, 15, A23–A27. [Google Scholar] [CrossRef]
  23. Murthy, Y.L.N.; Kondala Rao, T.; Kasi viswanath, I.V.; Singh, R. Synthesis and characterization of nano silver ferrite composite. J. Magn. Magn. Mater. 2010, 322, 2071–2074. [Google Scholar] [CrossRef]
  24. William, E.M.; Sheets, C.; Barnabe, A.; Marks, T.J.; Poeppelmeier, K.R. Hydrothermal Synthesis of Delafossite-Type Oxides. Chem. Mater. 2006, 18, 7–20. [Google Scholar]
  25. Moniz, S.J.; Shevlin, S.A.; Martin, D.J.; Guo, Z.X.; Tang, J. Visible-light driven heterojunction photocatalysts for water splitting—A critical review. Energ. Environ. Sci. 2015, 8, 731–759. [Google Scholar] [CrossRef]
  26. Li, H.; Hou, W.; Tao, X.; Du, N. Conjugated polyene-modified Bi2MO6 (MMo or W) for enhancing visible light photocatalytic activity. Appl. Catal. B 2015, 172–173, 27–36. [Google Scholar] [CrossRef]
  27. Omeiri, Y.G.S.; Bouguelia, A.; Trari, M. Photoelectrochemical characterization of the delafossite CuFeO2: Application to removal of divalent metals ions. J. Electroanal. Chem. 2008, 614, 31–40. [Google Scholar] [CrossRef]
  28. Jeevanandam, P.; Mulukutla, R.; Phillips, M.; Chaudhuri, S.; Erickson, L.; Klabunde, K. Near infrared reflectance properties of metal oxide nanoparticles. J. Phys. Chem. C 2007, 111, 1912–1918. [Google Scholar] [CrossRef]
  29. Yamashita, H.; Ichihashi, Y.; Zhang, S.G.; Matsumura, Y.; Souma, Y.; Tatsumi, T.; Anpo, M. Photocatalytic decomposition of NO at 275 K on titanium oxide catalysts anchored within zeolite cavities and framework. Appl. Surf. Sci. 1997, 121, 305–309. [Google Scholar] [CrossRef]
  30. Ohtani, B.; Ogawa, Y.; Nishimoto, S.I. Photocatalytic activity of amorphous-anatase mixture of titanium (IV) oxide particles suspended in aqueous solutions. J. Phys. Chem. B 1997, 101, 3746–3752. [Google Scholar] [CrossRef]
  31. Carp, O.; Huisman, C.L.; Reller, A. Photoinduced reactivity of titanium dioxide. Prog. Solid State Chem. 2004, 32, 33–177. [Google Scholar] [CrossRef]
  32. Tanaka, K.; Capule, M.F.; Hisanaga, T. Effect of crystallinity of TiO2 on its photocatalytic action. Chem. Phys. Lett. 1991, 187, 73–76. [Google Scholar] [CrossRef]
  33. Zhu, Y.P.; Ma, T.Y.; Ren, T.Z.; Li, J.; Du, G.H.; Yuan, Z.Y. Highly dispersed photoactive zinc oxide nanoparticles on mesoporous phosphonated titania hybrid. Appl. Catal. B 2014, 156–157, 44–52. [Google Scholar] [CrossRef]
  34. Arendt, R. The molten salt synthesis of single magnetic domain BaFe12O19 and SrFe12O19 crystals. J. Solid State Chem. 1973, 8, 339–347. [Google Scholar] [CrossRef]
  35. Chen, Z.; Wang, W.; Zhang, Z.; Fang, X. High-efficiency visible-light-driven Ag3PO4/AgI photocatalysts: Z-scheme photocatalytic mechanism for their enhanced photocatalytic activity. J. Phys. Chem. C 2013, 117, 19346–19352. [Google Scholar] [CrossRef]
  36. Li, F.; Wang, X.; Zhao, Y.; Liu, J.; Hao, Y.; Liu, R.; Zhao, D. Ionic-liquid-assisted synthesis of high-visible-light-activated N–B–F-tri-doped mesoporous TiO2 via a microwave route. Appl. Catal. B 2014, 144, 442–453. [Google Scholar] [CrossRef]
  37. Kim, J.; Lee, C.W.; Choi, W. Platinized WO3 as an environmental photocatalyst that generates OH radicals under visible light. Environ. Sci. Technol. 2010, 44, 6849–6854. [Google Scholar] [CrossRef] [PubMed]
Figure 1. XRD patterns of as-prepared AgFeO2 samples with different reaction times.
Catalysts 06 00069 g001
Figure 2. HRTEM image of 2H phase (A) and 3R phase (B) of AFO-6.
Catalysts 06 00069 g002
Figure 3. FE-SEM image of AFO-3 (A), AFO-6 (B), AFO-12 (C), AFO-24 (D), and EDS spectrum of AFO-6 (E).
Catalysts 06 00069 g003
Figure 4. UV-vis absorption spectra of as-prepared AgFeO2 photocatalysts with different hydrothermal time. The inset shows the plots of (αhν)2 versus for the samples.
Catalysts 06 00069 g004
Figure 5. Photoluminescence emission spectra of AgFeO2 samples with different hydrothermal time.
Catalysts 06 00069 g005
Figure 6. Photocurrent response of as-prepared AgFeO2 samples with different reaction time.
Catalysts 06 00069 g006
Figure 7. Time-dependent UV-vis absorption spectra of MO in the presence of AFO-6 (A) Time-course variation of C/C0 of MO solution (B). Linear simulation curves of MO photodegradation (C) and time-course variation of C/C0 of BPA solution (D) under visible light illumination over AgFeO2 samples with different reaction times.
Catalysts 06 00069 g007
Figure 8. Mott-Schottky plot of AFO-6 film measured in 0.1 M Na2SO4.
Catalysts 06 00069 g008
Figure 9. Photodegradation of MO over AFO-6 under visible light irradiation with addition of different trapping agents.
Catalysts 06 00069 g009
Figure 10. ESR spectra of AFO-6 (λ > 420 nm): DMPO-·OH in water (A) and DMPO-·O2 in methanol (B).
Catalysts 06 00069 g010
Scheme 1. Schematic illustration of photocatalytic mechanism within AgFeO2 under visible light irradiation.
Catalysts 06 00069 sch001

