Article

Effect of Ce and Co Addition to Fe/Al2O3 for Catalytic Methane Decomposition

by
Ahmed Sadeq Al-Fatesh
1,
Ashraf Amin
2,
Ahmed Aidid Ibrahim
1,
Wasim Ullah Khan
1,
Mostafa Aly Soliman
3,
Raja Lafi AL-Otaibi
4 and
Anis Hamza Fakeeha
1,*
1
Chemical Engineering Department, College of Engineering, King Saud University, P.O. Box 800, Riyadh 11421, Saudi Arabia
2
Chemical Engineering & Pilot Plant Department Engineering Research Division, National Research Centre, 33 El-Bohouth St., Dokki, Cairo 12311, Egypt
3
Chemical Engineering Department, The British University in Egypt, El-Shorouk 11837, Egypt
4
King Abdulaziz City for Science and Technology, Riyadh 11421, Saudi Arabia
*
Author to whom correspondence should be addressed.
Catalysts 2016, 6(3), 40; https://doi.org/10.3390/catal6030040
Submission received: 11 December 2015 / Revised: 16 February 2016 / Accepted: 26 February 2016 / Published: 8 March 2016

Abstract

:
Catalytic methane decomposition is studied in a fixed bed reactor. Two sets of bimetallic catalysts are employed, namely: 30%Fe-X%Ce/Al2O3 and 30%Fe-X%Co/Al2O3, and compared with monometallic 30%Fe/Al2O3 catalyst. The effect of promoting Fe with Ce and Co and reduction temperature are investigated. The results reveal that Ce addition has shown a negative impact on H2 yield while a positive effect on H2 yield and catalyst stability are observed with Co addition. In terms of number of moles of produced hydrogen per active sites, Fe/Al2O3 has shown a higher number of moles of hydrogen compared to bimetallic catalysts. The catalyst reduced at 500 °C exhibits better activity as compared to the catalyst reduced at 950 °C. Carbon nano-tubes are deposited on the catalyst within the range of 14–73 nm diameter. Two types of carbon nanotubes are detected: Cα and Cγ.

Graphical Abstract

1. Introduction

Hydrogen is the ultimate clean energy carrier; when hydrogen is burned, only water is produced as a by-product. Hydrogen can be produced from different sources, including: water splitting, hydrocarbons cracking, and biomass gasification. The cheapest process for hydrogen production is the steam reforming of methane. Hydrogen produced from methane steam reforming is contaminated with carbon monoxide. CO is poisonous for different catalysts in industries at which hydrogen is used as a raw material. Due to technical and financial limitations, it is not feasible to produce CO-free hydrogen from methane steam reforming. Catalytic methane decomposition is a process by which methane decomposes over a catalytic surface to its basic elements: solid carbon and gaseous hydrogen.
Methane is the most stable hydrocarbon, which eliminates the possibility of methane thermal cracking at temperatures lower than 1200 °C. Different catalysts were studied for methane decomposition including: carbonaceous catalysts, like activated carbon and carbon black, metal catalysts, especially iron group metals, and noble metals, like Pd and Pt [1,2]. Metallic catalysts are used effectively for methane catalytic cracking [1,3,4]. The iron group elements can be used successfully to decompose methane into carbon and hydrogen. Ni is extensively used as a catalyst for catalytic methane decomposition due its superior catalytic activity reported in literature. Fe is distinguished with a high carbon deactivation resistance. Carbon nanotubes are produced as a co-product during methane catalytic decomposition [5,6]. Due to its unique properties, carbon nanotubes are a field of potential interest with wide applications in different fields [7]. Carbon nanotubes have wide commercial applications including adsorption processes, electronics and catalysis [1,8,9,10].
Iron containing catalysts are widely used in research to assess their activity and to study the produced carbon filaments. Jang and Cha [11] employed iron supported over alumina in a fluidized bed reactor for catalytic decomposition of methane. The results revealed that hydrogen yield increased with temperature. However, no appreciable conversion has been reported at temperatures lower than 800 °C. Mixed catalyst showed a better stability due to oxidation of a small portion of deposited carbon by lattice oxygen in oxygen containing compounds like ceria and formation of filamentous carbon [12,13].
Avdeeva et al. [14] investigated the performance of Fe/Al2O3 and Fe-Co/Al2O3 using a fixed bed reactor to study the carbon deposited from methane decomposition. They concluded that Fe/Al2O3 carbon capacity has increased when Co is added. The catalyst carbon capacity has increased remarkably by adding 6%Co to 50%Fe/Al2O3 from 26.5 to 52.4 g/gcat. Introducing Co to Fe catalyst has affected Fe crystal formation which facilitate Fe reduction [12]. Fe-Co spinel was confirmed containing cobalt ferrites [12,13].
Reshetenko et al. [15] studied the catalytic methane decomposition in a fluidized bed reactor using Fe/Al2O3, Fe-Co/Al2O3, and Fe-Ni/Al2O3 at the temperature range of 600–650 °C. The results indicated the positive effect on catalyst carbon capacity by adding Co to Fe. Different loadings of active sites were used. The maximum carbon capacity (145 g/gcat) was observed with bimetallic catalysts in the following weight percentage ranges: 50–65 wt. % Fe, 5–10 wt. % Co (or Ni), and 25–40 wt. % Al2O3. The authors attributed the improvement attained with the bimetallic catalysts to the formation of the special crystal structure leading to an optimum particle size distribution. Different characterization techniques have confirmed the formation of an alloy between Fe and Co.
Tang et al. [16] employed Fe/CeO2 for methane decomposition using a fixed bed reactor at 750 °C. The optimum activity was observed with a catalyst composed of 60 wt. % Fe2O3 and 40 wt. % CeO2. CO was detected due to carbon oxidation by high mobility lattice oxygen from Ceria. Comparing Fe and Ceria and Fe-Ce bimetallic catalysts, Ce monometallic catalyst showed very small CH4 conversion activity. Fe catalyst showed 60% CH4 conversion after 25 min, then the catalyst was completely deactivated after 50 min. Using mixed catalysts, around 77% CH4 conversion was observed after 25 min with 60 wt. % Fe2O3-40 wt. % CeO2 and 40 wt. % Fe2O3-60 wt. % CeO2. The conversion reported for both catalysts decreased gradually to 25% after 150 min, then it maintained a stable value until the reaction was terminated at 250 min. The improved dispersion of Fe catalyst after adding Ce is attributed to the increased distance between Fe particles due to loading Ce. Such interaction between Fe and Ce does not include a formation of alloy between Fe and Ce. However, the formation of a solid solution of Fe and Ce was reported in literature [16,17].
Bayat et al. [18] employed iron promoted nickel catalysts supported on nanocrystalline gamma alumina as a catalyst for methane decomposition to produce CO-free hydrogen and carbon nano-fibers using a fixed bed reactor. The results have revealed that Fe addition to nickel has improved catalyst stability since carbon diffusion is enhanced reducing the encapsulating carbon formation.
Ibrahim et al. [19] studied catalytic methane decomposition using Fe catalyst supported on alumina for hydrogen production in a fixed bed reactor at 700 °C. The authors used different weight percentages of Fe/Al2O3 (15%–100%). For Fe loadings (15%–60%), a maximum hydrogen yield of 77% was attained with 60 wt. % Fe. For higher Fe loadings, a decrease in hydrogen yield was reported due to the decrease in Fe dispersion resulting from reduction in available surface area of active sites. Bimetallic catalysts may attain better stability and activity due to the presence of different combinations of active sites.
Those active sites will play different roles, which will facilitate the reaction and enhance the reaction rate. In this article, catalytic methane decomposition is studied in a fixed bed reactor to maximize CH4 conversion by varying the operating conditions and catalyst. Bimetallic catalysts Fe-Co/Al2O3 and Fe-Ce/Al2O3 are used at 700 °C. Different factors are considered, including: catalyst loading, time on stream, reduction temperature, and reaction temperature. The aim of our work is to investigate the effect of Ce/Co addition of Fe/Al2O3 catalyst, to understand the role of the bimetallic catalyst for methane decomposition, and to study the effect of reaction conditions on the mono and bi-metallic catalysts.

2. Results and Discussion

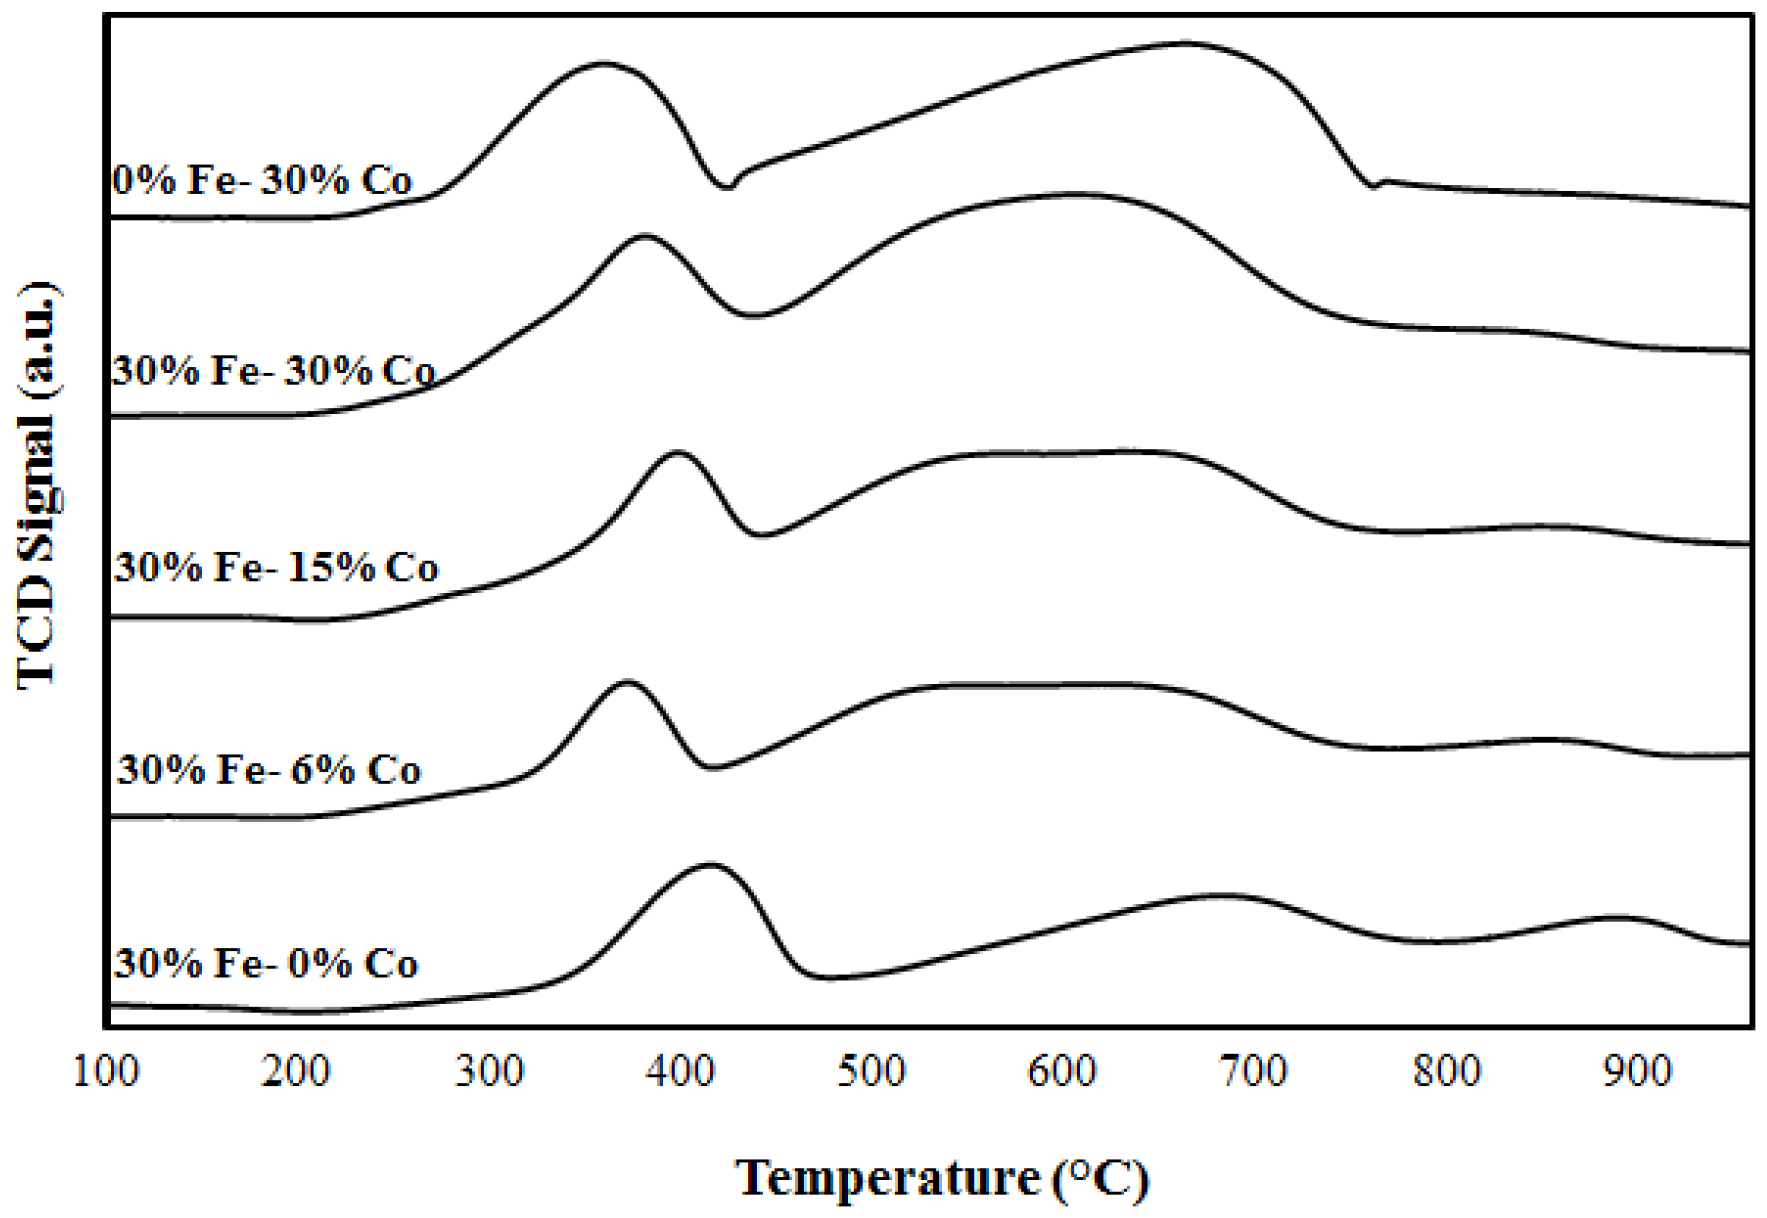
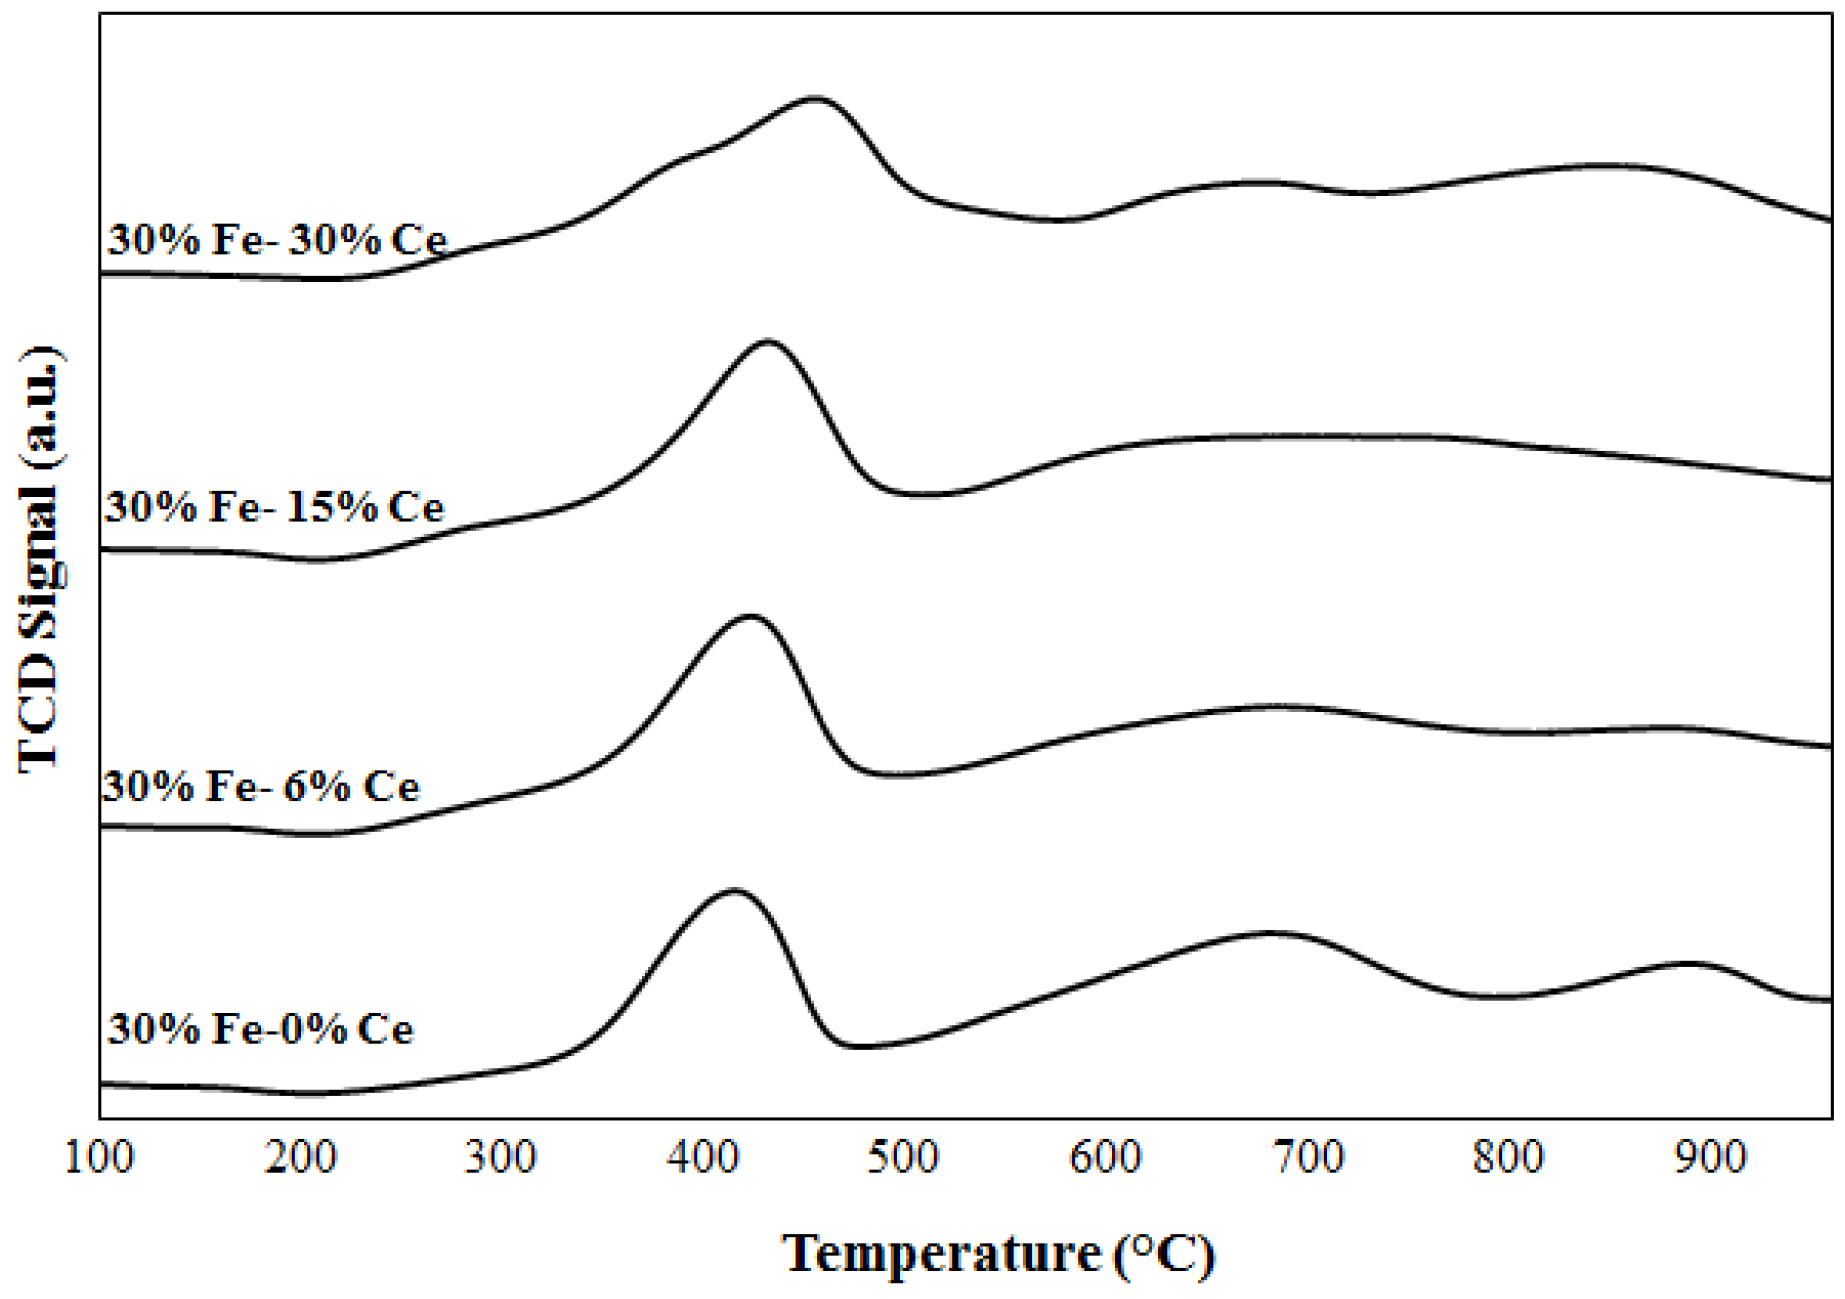
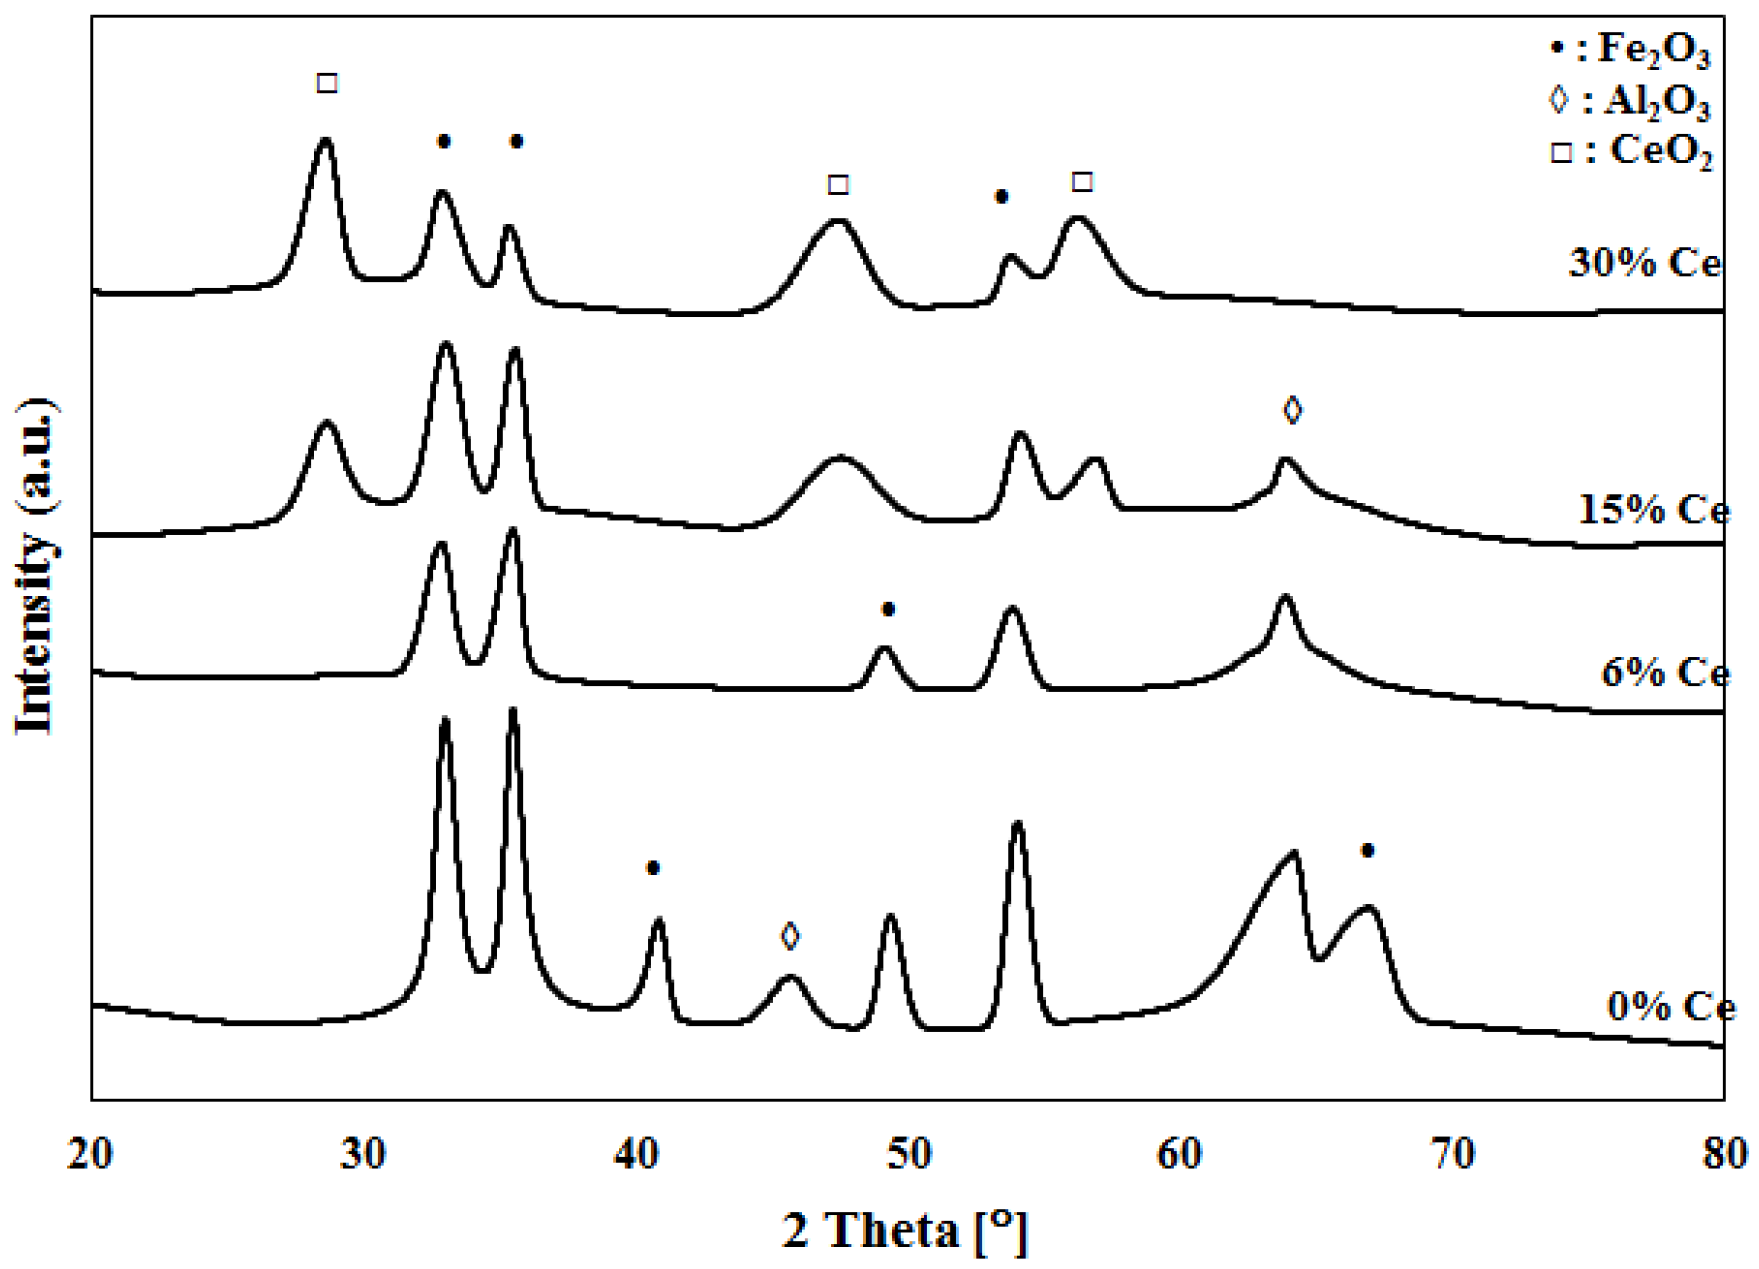
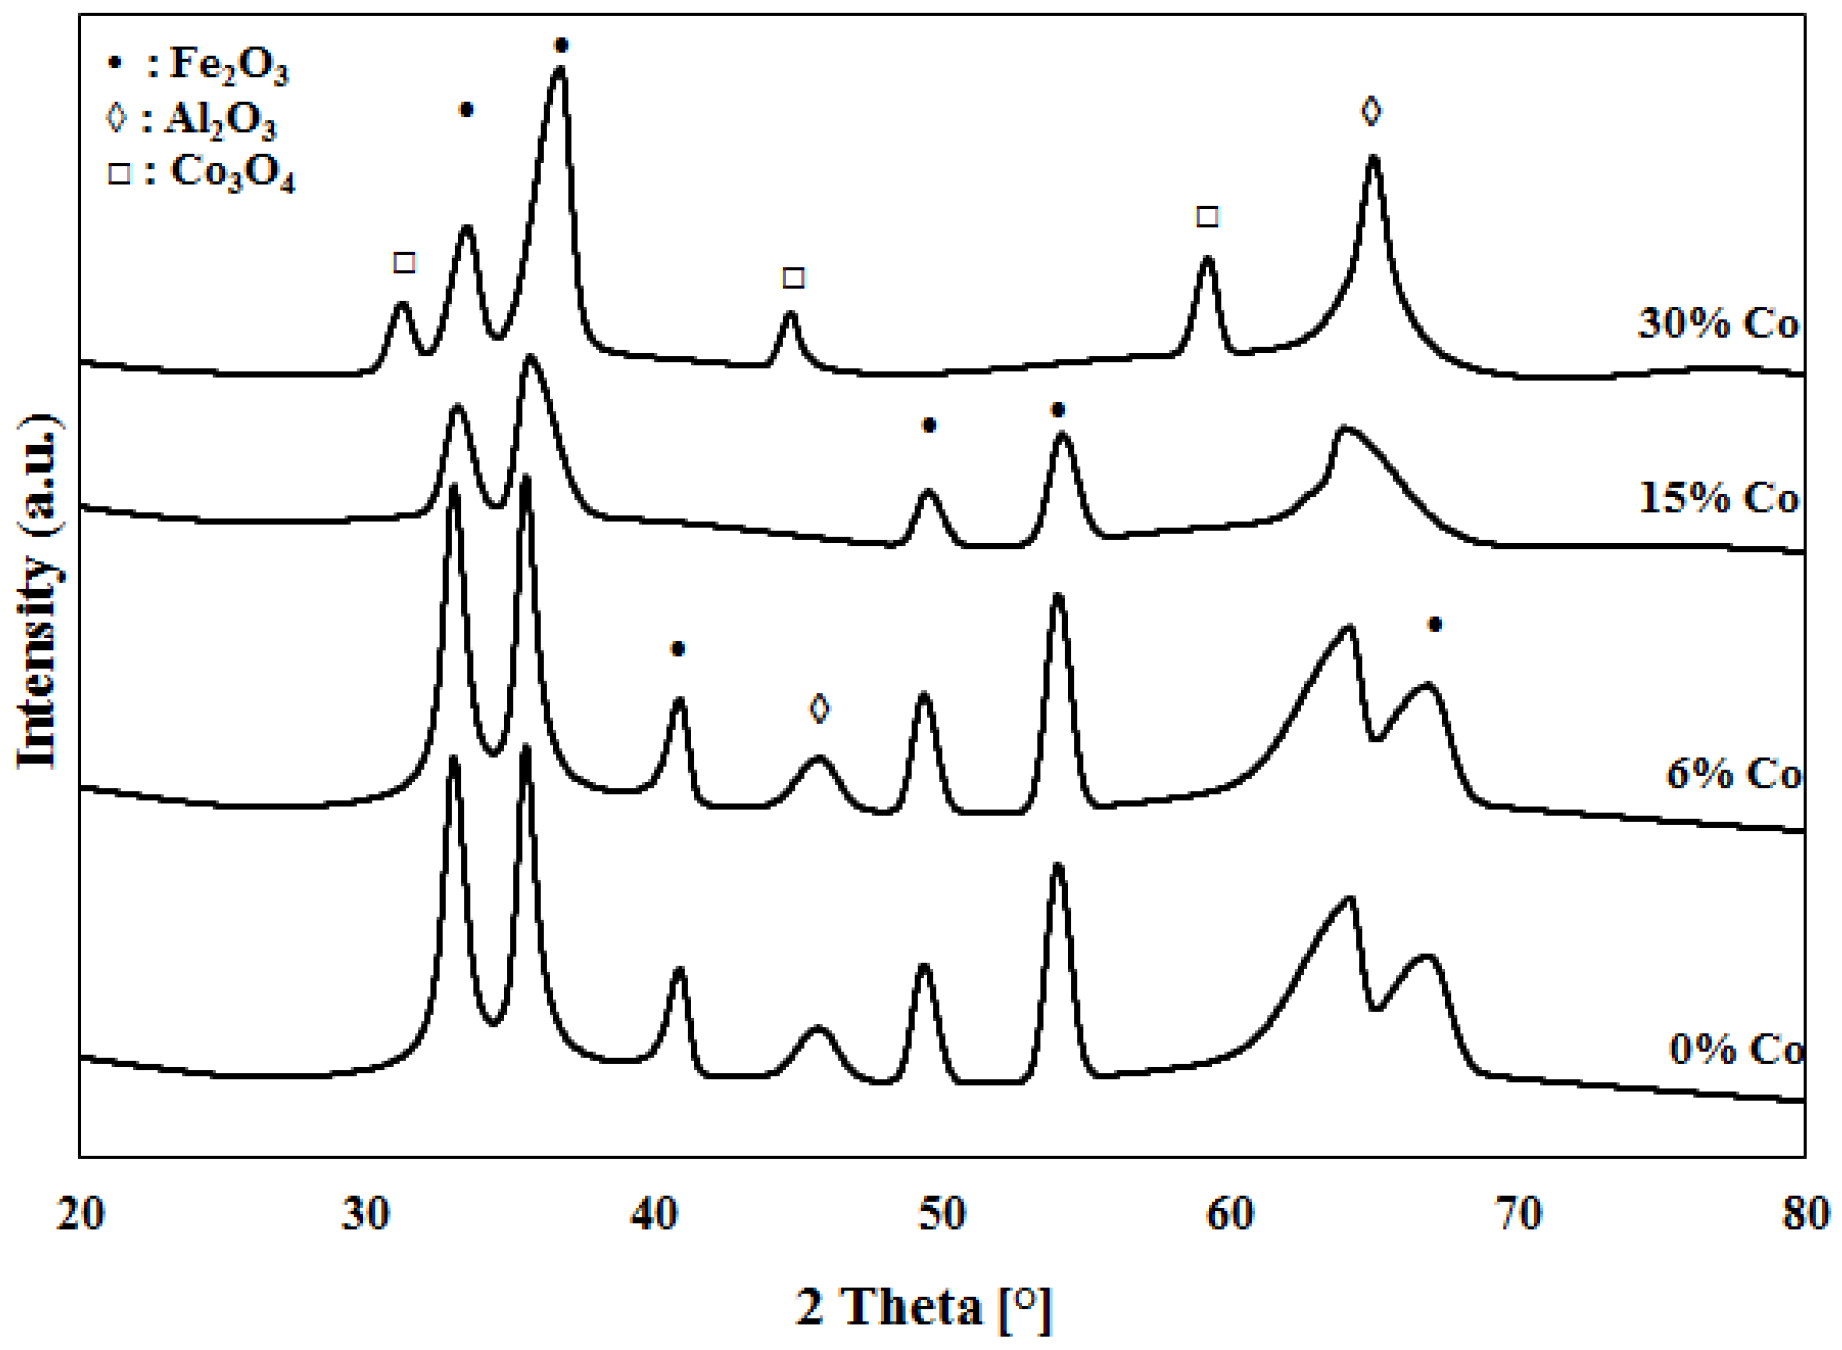
2.1. Catalyst Characterization

The TPR profiles of Fe-Co and Fe-Ce catalysts were collected to investigate the interactions between the two metals and between metals and alumina support. Figure 1 and Figure 2 show the TPR profiles for 30%Fe-X%Co/Al2O3 and 30%Fe-X%Ce/Al2O3, respectively. The H2-TPR analysis was performed over 30%Fe/Al2O3 catalyst as a reference profile and over mixed catalysts (30%Fe-X%Ce/Al2O3 and 30%Fe-X%Co/Al2O3). As shown in Figure 1, monometallic 30%Fe/Al2O3 catalyst showed two peaks at 420 °C and a broad signal with a peak around 680 °C corresponding to conversion of Fe2O3 to Fe3O4 and reduction of Fe3O4 to Fe, respectively [13,20,21,22]. The monometallic profile of 30%Co/Al2O3 has shown two peaks between 260 and 400 °C and between 410 and 750 °C. The TPR results have shown an interference between peaks observed for 30%Fe/Al2O3 and 30% Co/Al2O3 [21,22]. For mixed catalyst, 30%Fe-X%Co/Al2O3 catalyst profiles demonstrated a peak between 370 and 390 °C, which is attributed to the reduction of Fe2O3 to Fe3O4; while the broad signal observed between 500 °C and 730 °C represents a dual reduction mechanism starting with Co3O4 to Co slightly above 500 °C and Fe3O4 to Fe above 600 °C [13,20,21,22]. The simultaneous reduction of Fe3O4 and Co3O4 indicates the possibility of an interaction between Fe and Co, as confirmed by the hydrogen chemisorption [13,15,21,22]. One can note that the change in the bimetallic catalyst composition does not have a significant impact on the redox behavior of the catalyst, which may indicate the lack of formation of chemical compounds between Fe and Co particles.
Figure 2 illustrates the TPR profiles of 30%Fe-X%Ce/Al2O3 catalysts. By comparing the mixed catalyst (Fe-Ce) profiles with Fe catalyst profile, one sharp peak is observed for 30%Fe-X%Ce/Al2O3 catalysts between 370 and 390 °C which is attributed to the reduction of Fe2O3 to Fe3O4. A broad spectrum is observed between 450 and 750 °C. This spectrum represents a dual reduction mechanism, including reduction of ceria to Ce at 530 °C and Fe3O4 to Fe above 600 °C. [17,23,24]. The simultaneous reduction of Fe3O4 and CeO2 indicates an overlapping reduction, which may indicate an interaction between Fe and Ce [17,23,25]. The interaction of Fe and Ce is not expected to result in a formation of chemical compounds [17,23,24,25].
Table 1 shows the BET surface area in m2/g as measured using N2 physisorption. A drop of 30%Fe/Al2O3 BET surface area is observed when CO/Ce is added in 6%. The drop in surface area is larger in case of 30%Fe-6%Co/Al2O3 compared to 30%Fe-6%Ce/Al2O3. The measured BET surface area increases with increasing CO/Ce percentage from 6% to 15% and 30% in the bimetallic catalyst. The BET surface area increase was higher when Ce is added compared to Co addition.
Hydrogen chemisorption is reported for fresh catalysts reduced at 500 °C and 950 °C, as shown in Table 2. For catalysts reduced at 500 °C, 30%Fe/Al2O3 catalyst exhibited the highest dispersion value of 22.15%, while 30%Fe/Al2O3 catalyst reduced at 950 °C showed the lowest dispersion value of 0.34%. The dispersion results of 30%Fe/Al2O3 indicates a remarkable negative impact of reduction at 950 °C on Fe dispersion due to sintering which is expected due to higher reduction temperature. The effect of 30%Fe/Al2O3 alloying with Co and Ce is demonstrated by considering the dispersion values in Table 2 for mixed catalysts. Fresh 30%Fe-15%Ce/Al2O3 and 30%Fe-15%Co/Al2O3 catalysts reduced at 500 °C demonstrated a lower dispersion value compared to fresh 30%Fe/Al2O3 (13.36% and 11.71%, respectively). The dispersion has decreased due to the addition of an extra 50% of active site e.g., Co or Ce to 30%Fe/Al2O3. 30%Fe-15%Ce/Al2O3 reduced at 950 °C catalyst has shown a higher dispersion value compared to 30%Fe-15%Ce/Al2O3 catalyst reduced at 500 °C, which may be attributed to the stabilization effect of Ce preventing excessive dispersion. The improved overall dispersion of 30%Fe-15%Ce/Al2O3 at 950 °C is attributed to better reduction achieved at 950 °C. 30%Fe-15%Co/Al2O3 catalyst reduced at 500 °C and 950 °C exhibited dispersion values of 11.71% and 11.98%, respectively. 30%Fe-15%Co/Al2O3 dispersion results showed that catalyst stability attained after adding Co prevented sintering of catalyst, and the better reduction achieved at 950 °C maintained almost the same value of dispersion compared to catalysts reduced at 500 °C. TPR results showed a reduction peak at temperatures higher than 500 °C for 30%Fe-X%Co/Al2O3.
XRD patterns for calcined 30%Fe-X%Co/Al2O3 and calcined 30%Fe-X%Ce/Al2O3 catalyst are presented in Figure 3 and Figure 4, respectively. A similar pattern has been observed for 30%Fe/Al2O3 and 30%Fe-6%Co/Al2O3 samples, which indicates that the addition of a small amount of Co to Fe does not have an effect on the crystal lattice of 30%Fe/Al2O3. Figure 3 illustrates a remarkable change in the crystal lattice of 30%Fe/Al2O3 when Co is added at a ratio of ½ or higher to iron (30%Fe-15%Co/Al2O3 and 30%Fe-30%Co/Al2O3). However, a dramatic change is observed with the crystal lattice of 30%Fe/Al2O3 due to Ce addition, even when added in small amounts, 30%Fe-6%Ce/Al2O3, as shown in Figure 4.
Complicated and overlapping XRD profiles are detected for the mixed catalysts. For 30%Fe-X%Co/Al2O3 catalysts, crystal phases of Fe2O3, Al2O3, and Co3O4 are identified as shown in Figure 3. Peaks at 2θ values of 34°, 37°, 41°, 47°, 53° and 67° are corresponding to that of Fe2O3. Peaks at 2θ values of 28°, 43°, and 57° are corresponding to that of Co3O4. While 44° and 66° peaks are corresponding to Al2O3 [21,22]. For 30%Fe-X%Ce/Al2O3 catalysts, crystal phases of Fe2O3, Al2O3, and CeO2 are detected as shown in Figure 4. Peaks at 2θ values of 34°, 37°, 41°, 47°, 53°, and 67° are corresponding to that of Fe2O3. Peaks at 2θ values of 28°, 47°, and 56° are corresponding to that of CeO2. While 44° and 66° peaks are corresponding to Al2O3 [23,25]. Formation of solid solution of hematite and ceria is confirmed in the literature [16,26,27]. However, the XRD results did not indicate the presence of mixed crystals of Fe and Co or Fe and Ce, as revealed by TPR results. The XRD results have shown a clear effect of promoting of Fe with Ce and Co as indicated by shifting and disappearance of some peaks. For example, Fe2O3 peaks at 41° and 67° disappear with the increase of Co/Ce weight percentage in the mixed catalyst.

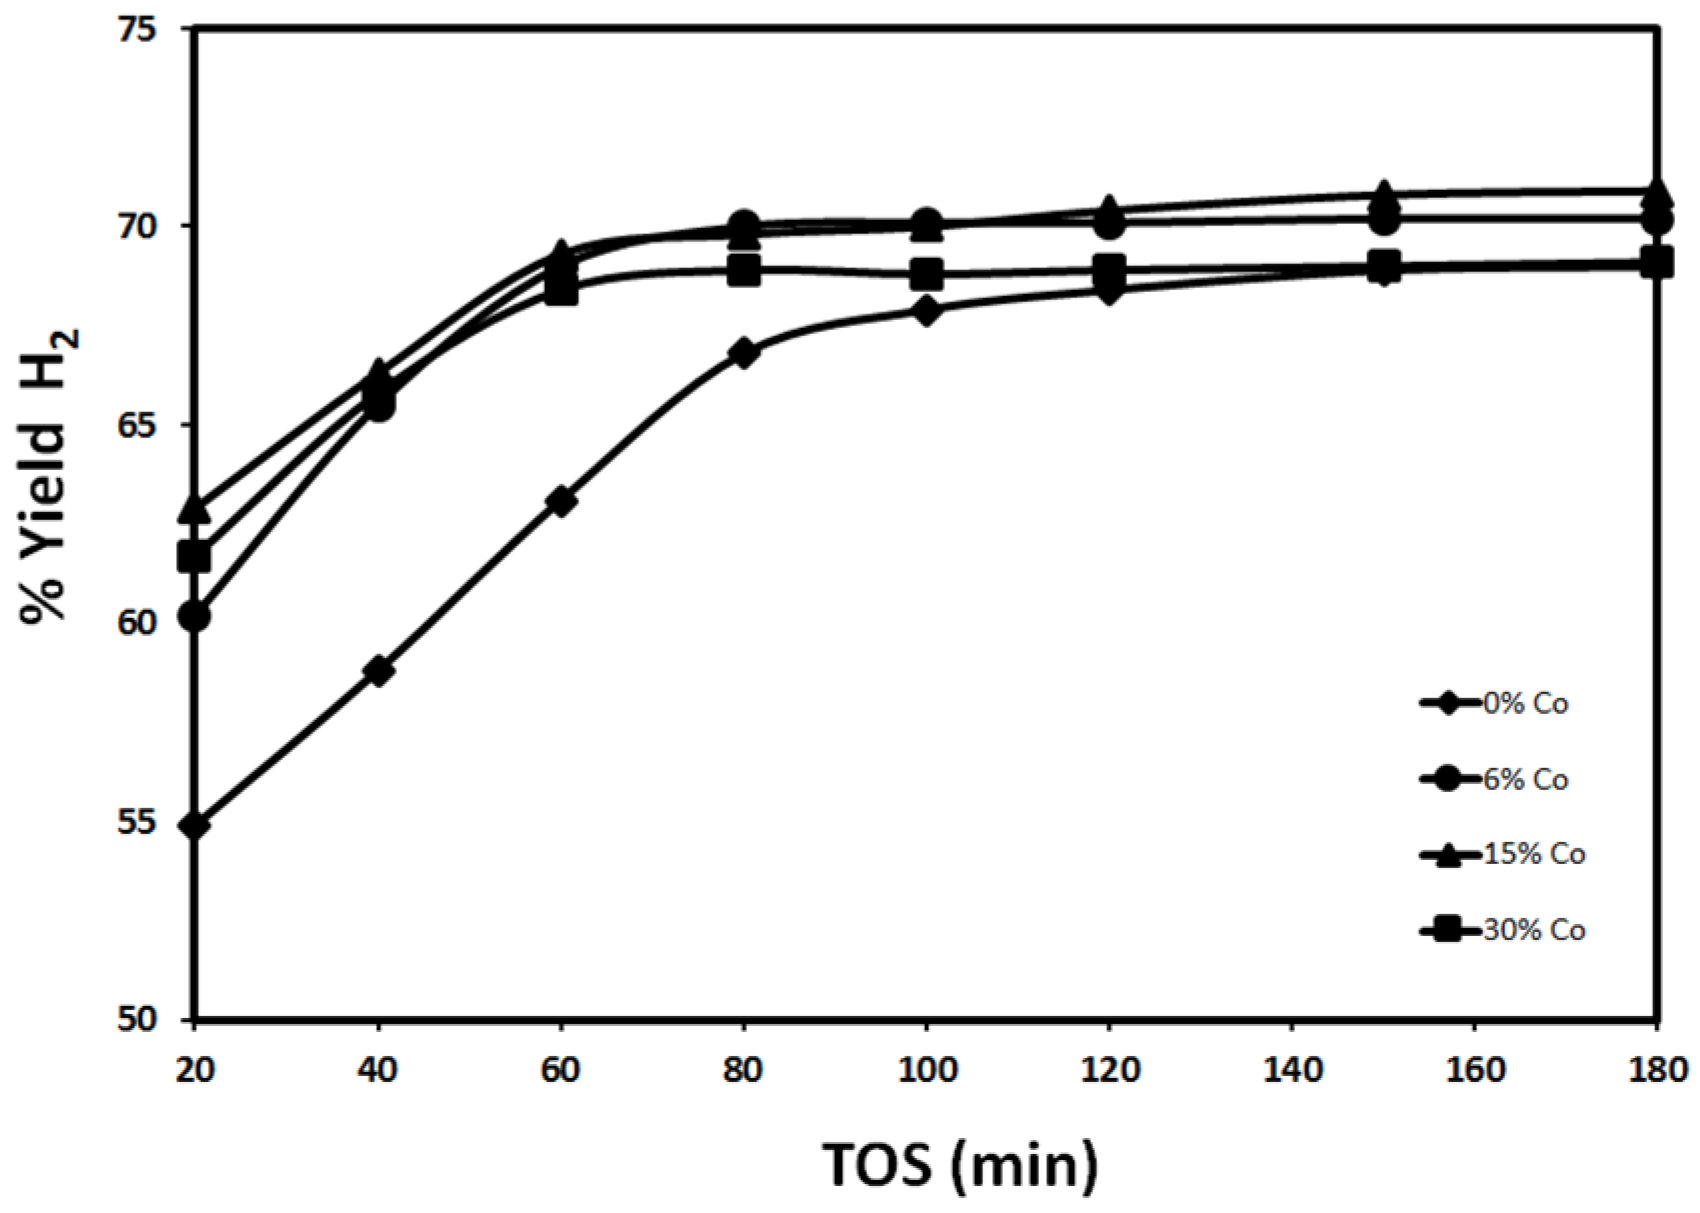
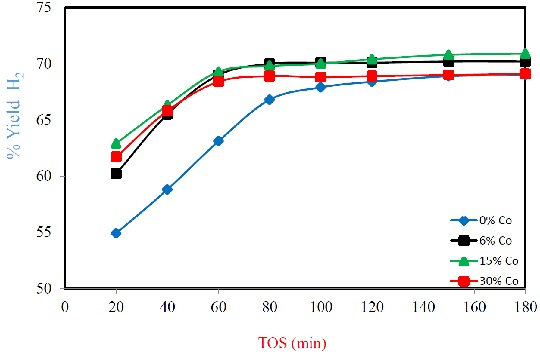
2.2. Catalyst Performance

2.2.1. Effect of Reduction Temperature

The effect of promoting 30%Fe/Al2O3 catalyst with Ce or Co is the focus of the present study. The effect of Ce addition to 30%Fe/Al2O3 is investigated and the results are shown below in Figure 5 and Figure 6. Figure 5 and Figure 6 show H2 yield using 30%Fe-X%Ce/Al2O3 reduced at 500 °C and 950 °C, respectively. Figure 5 illustrates the drop in H2 yield obtained using 30%Fe/Al2O3 when Ce is added. By comparing H2 yield after 20 min on the stream, 30%Fe/Al2O3 exhibited a 54.9% yield. The best Fe-Ce mixed catalyst performance after 20 min is observed with 30%Fe-15%Ce/Al2O3 around 52.8% H2 yield. After 180 min, a similar discrepancy is observed; 69% and 65.6% H2 yields are witnessed using 30%Fe/Al2O3 and 30%Fe-15%Ce/Al2O3, respectively. Nearly parallel H2 yield lines are noted for 30%Fe/Al2O3, 30%Fe-15%Ce/Al2O3, and 30%Fe-30%Ce/Al2O3 ordered from highest to lowest H2 yield. 30%Fe-6%Ce/Al2O3 demonstrated H2 yield almost similar to 30%Fe-30%Ce/Al2O3 20 min from the onset of the reaction, then H2 yield increased rapidly between 60 and 80 min; then, it reached a value slightly higher than H2 yield observed with 30%Fe-15%Ce/Al2O3. The rapid increase of 30%Fe-6%Ce/Al2O3 reported H2 yield between 60 and 80 min can be explained by the rearrangement of Fe-Ce lattice by thermal treatment at 700 °C approaching a performance closer to 30%Fe/Al2O3 and/or the reduction of more active sites using produced hydrogen at 700 °C [23,24,25]. The experimental results revealed that reduction was conducted effectively for CeO2 sites, since neither CO nor CO2 has been detected for 30%Fe-X%Ce/Al2O3.
Generally, a steady increase in H2 yield was observed for all 30%Fe-X%Ce/Al2O3 catalysts. The improvement of catalyst performance is attributed to the insufficient reduction duration at 500 °C especially for Fe sites. By releasing more hydrogen because of methane cracking, a better reduction of the catalyst sites can be achieved. The negative effect of Ce addition could be explained by a reduction in active sites subjected to the reaction due to sintering.
Catalyst reduced at 950 °C has demonstrated a lower catalytic performance compared to catalyst reduced at 500 °C as shown in Figure 6. The remarkable drop in yield may be attributed to active site sintering. H2 yield using 30%Fe-6%Ce/Al2O3 is higher than that obtained with other catalysts. 30%Fe/Al2O3, 30%Fe-15%Ce/Al2O3, and 30%Fe-30%Ce/Al2O3 demonstrate a stable performance over the entire reaction time. While 30%Fe-6%Ce/Al2O3 performance improved slightly with time, since H2 yield increased from 15.3% after 20 min to 18.1% after 180 min. The improvement in 30%Fe-6%Ce/Al2O3 performance with time indicates that adding Ce to Fe catalyst in small amounts may be beneficial for catalytic activity. This observation can be explained by considering the formation of bimetallic catalysts, which facilitates methane decomposition, since it provides two types of active sites. In addition, lattice oxygen in ceria may help in maintaining catalyst activity for longer periods by oxidizing part of the deposited carbon, which may reduce the deactivating carbon. The higher weight percentage of Ce may increase the possibility of sintering.
Figure 7 and Figure 8 show the effect of Co addition to 30%Fe/Al2O3 for catalysts reduced at 500 °C and 950 °C, respectively. In general, Co addition has a positive effect on 30%Fe/Al2O3 performance. The mixed catalysts 30%Fe-X%Co/Al2O3 showed a higher H2 yield compared to 30%Fe/Al2O3. Figure 7 demonstrates the effect of Co addition, when the catalyst is reduced at 500 °C. After 20 min., 30%Fe-15%Co/Al2O3 catalyst showed a H2 yield of 62.9% as compared to 54.9% reported for 30%Fe/Al2O3. After that, 30%Fe-15%Co/Al2O3 and 30%Fe-6%Co/Al2O3 exhibited a better performance compared to 30%Fe-30%Co/Al2O3 and 30%Fe/Al2O3. The positive effect of Co addition is attributed to the fact that Co is an element of the iron group, which is well known as a powerful catalyst for hydrocarbon cracking. In addition, Fe-Co mixture has higher capacity of carbon compared to Fe. Higher carbon capacity refers to a better durability of catalyst towards deposited carbon preventing quick catalyst deactivation due to formation of encapsulating carbon [14]. While the deterioration in catalyst performance for 30%Fe-30%Co/Al2O3 is due to faster sintering as the amount of active sites increases. Similar to 30%Fe-X%Ce/Al2O3 reduced at 500 °C, a remarkable improvement in H2 yield has been observed as the time on stream increases between 20 and 80 min. This improvement is due to the release of the H2 from methane decomposition, which continued the reduction of Fe and Co active sites leading to an overall increase in the total number of active sites available for the reaction. After 80 min, H2 yield reached a stable value, which indicates some kind of equilibrium on the catalyst surface between the carbon deposition rate and methane decomposition [1,2]. By comparing the molar low rate of hydrogen in terms of moles of hydrogen normalized to grams of active phase per hour produced using 30%Fe/Al2O3 and 30%Fe-X%Co/Al2O3 as shown in Figure 9, the results show that a higher number of moles is produced over monometallic Fe catalyst compared to Fe-Co mixed catalysts.
By increasing the reduction temperature to 950 °C, H2 yield decreased significantly since the active sites sintering at such a high temperature will lead to a substantial reduction in the surface area available for reaction. As shown in Figure 8, the maximum yield after 20 min is 32.4% and 52.4% after 180 min as observed with respect to 30%Fe-30%Co/Al2O3. 30%Fe/Al2O3 exhibits H2 yield values of 13.6% and 11.7% after 20 and 180 minutes, respectively, which is considerably less than the yield observed with 30%Fe-X%Co/Al2O3. One can notice a clear difference in catalytic performance after reducing 30%Fe-X%Co/Al2O3 catalysts at 950 °C. The H2 yield is still higher than that observed with 30%Fe-X%Ce/Al2O3 reduced at 950 °C. The results shown in Figure 8 suggest that promoting Fe/Al2O3 with Co has increased Fe stability as Co increases due to the catalytic behavior of Co and the increased carbon capacity of the bimetallic catalyst (Fe-Co) [14], as discussed in the previous paragraph.

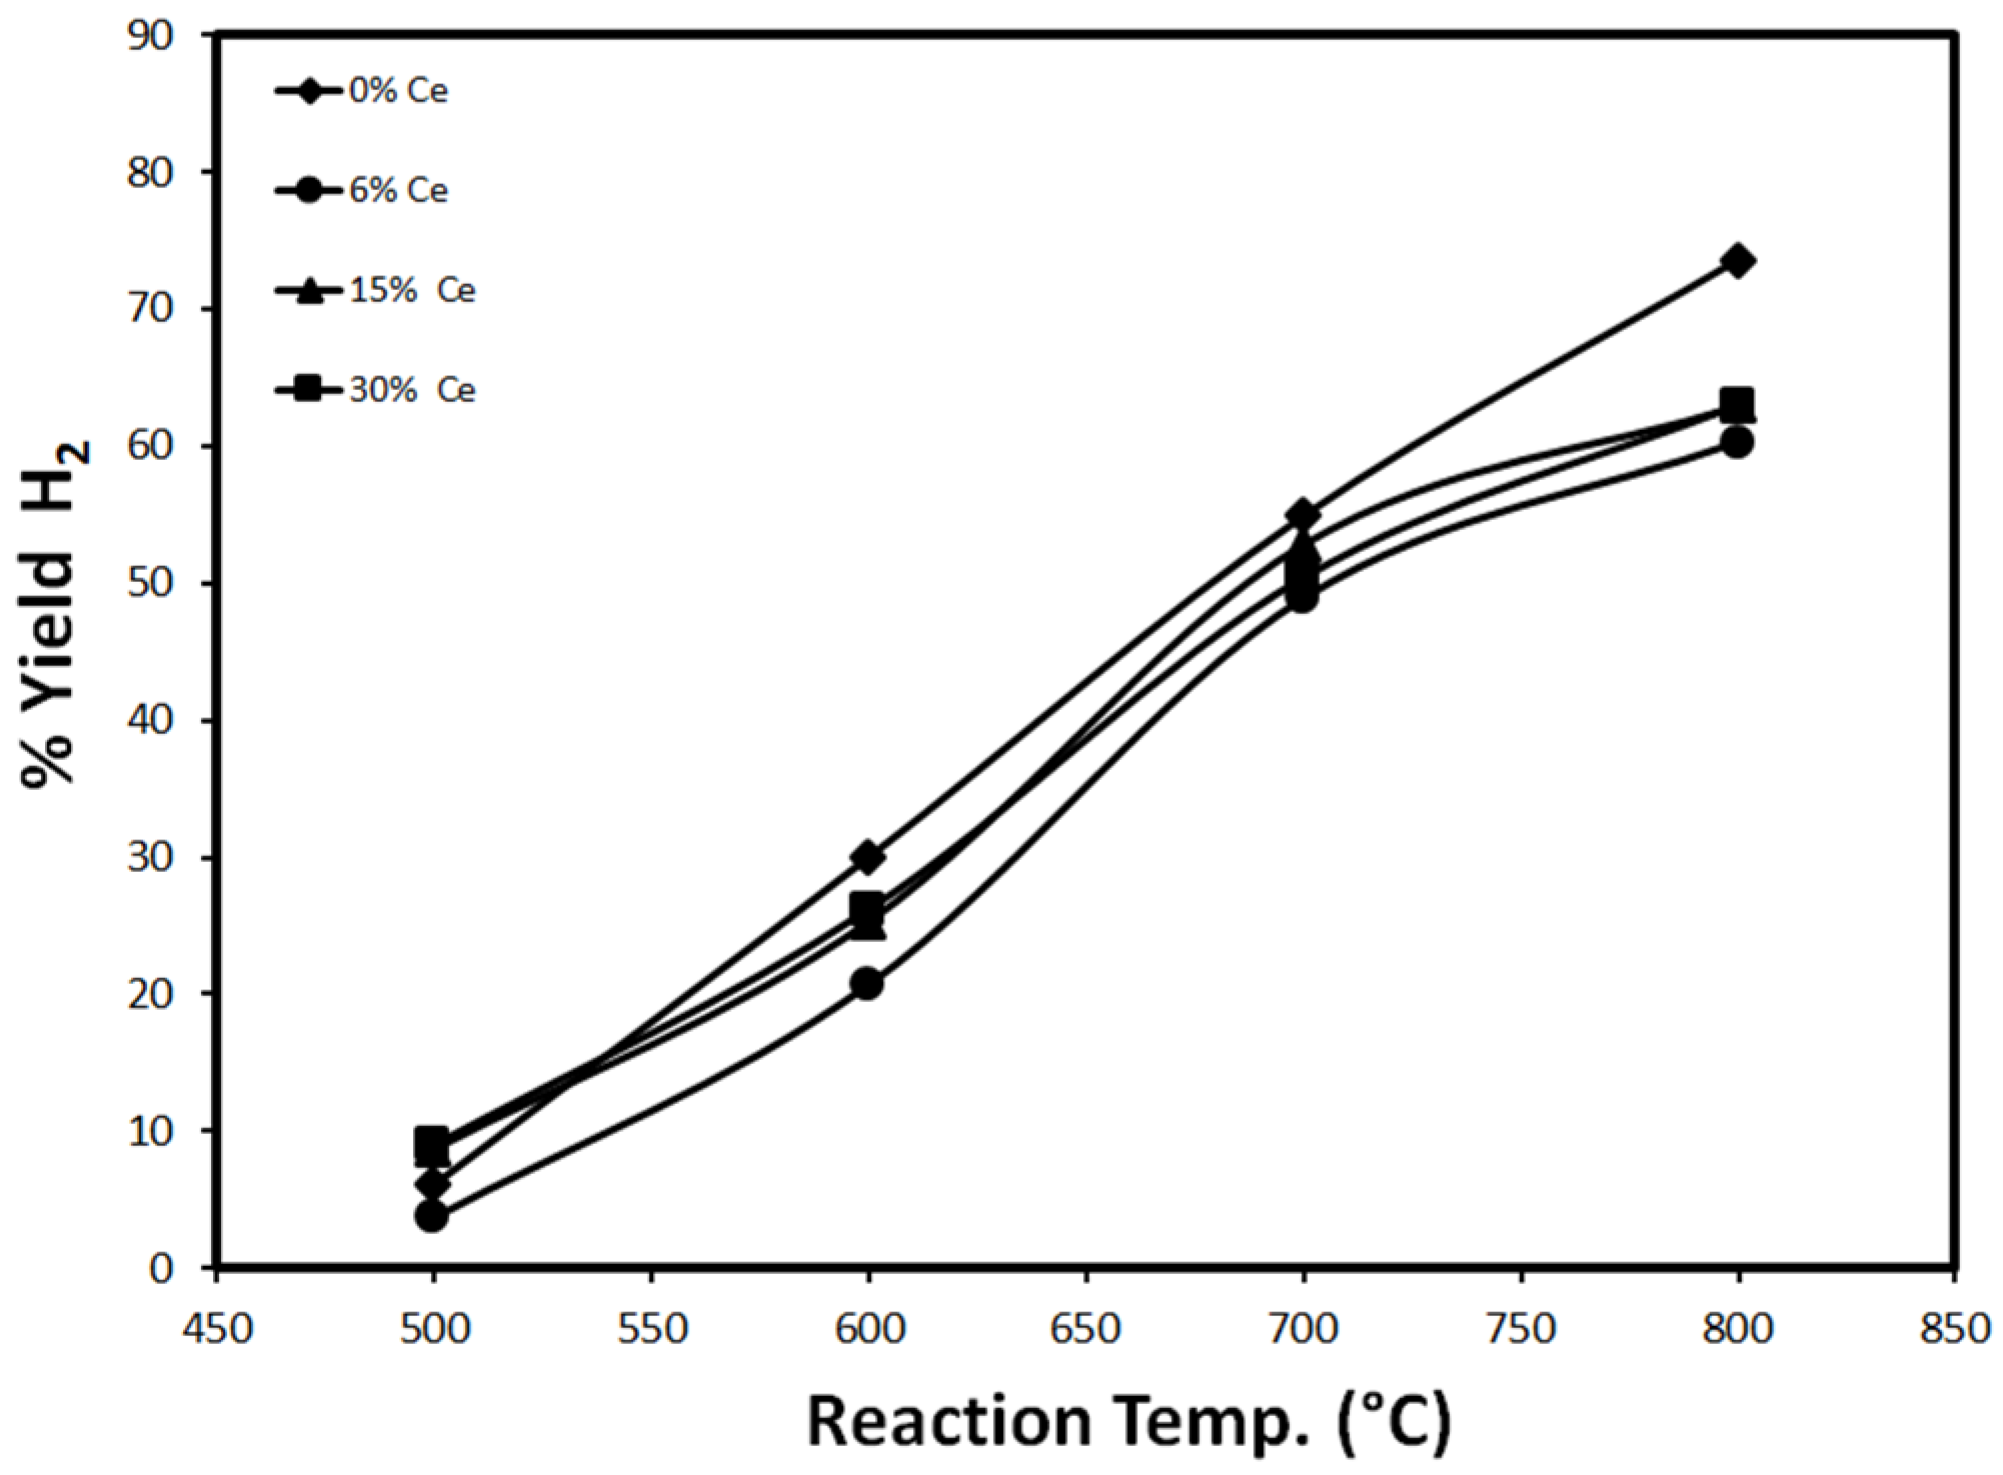
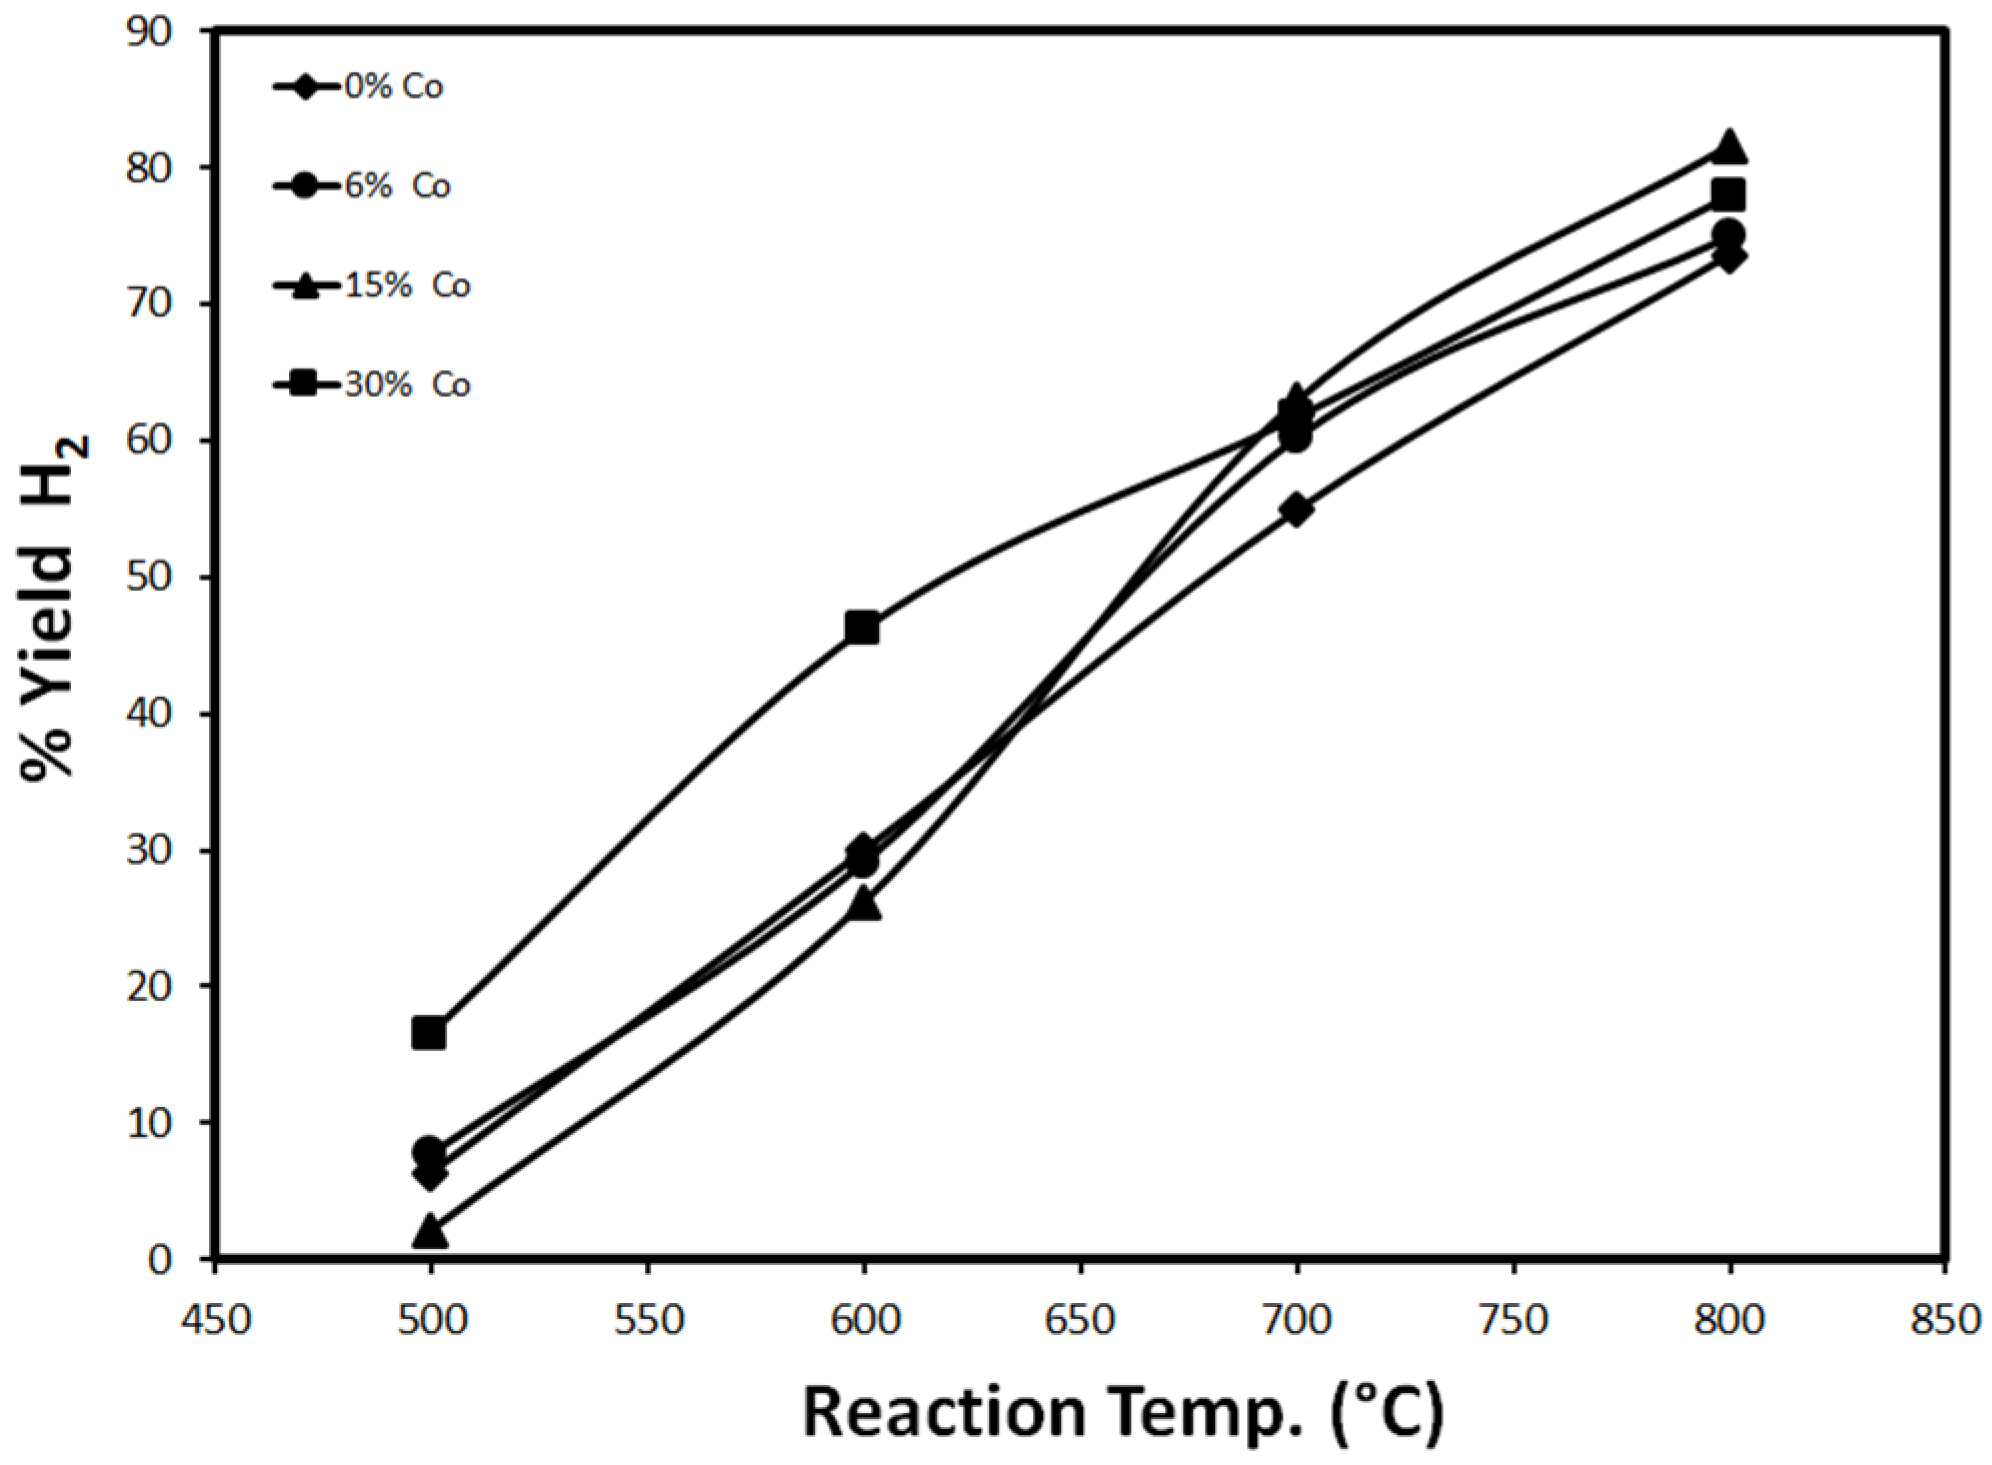
2.2.2. Effect of Reaction Temperature

The effect of temperature on the catalytic performance, represented in H2 yield after 20 min of TOS, is studied extensively. The results are shown below in Figure 10 and Figure 11.
Figure 10 shows the effect of temperature on H2 yield, using 30%Fe-X%Ce/Al2O3 catalysts 20 min after the onset of the reaction. H2 yield increases with temperature, which is expected since the reaction rate of CH4 decomposition increases with temperature [1,3,4,5,6]. H2 yield witnessed with monometallic catalyst 30%Fe/Al2O3 exhibits a linear dependency on temperature. Using bimetallic catalysts 30%Fe-X%Ce/Al2O3, H2 yield showed linear dependency on temperature between 500 and 700 °C. From 700 to 800 °C, H2 yield tends to approach a stable performance as temperature increases. As the reaction temperature increases, H2 yield is governed by different factors including reaction kinetics, change in Fe-Co phases, and sintering. As the temperature increases, the reaction kinetics will be faster but further increases in temperature will lead to faster sintering and active sites change until H2 yield is suppressed. Figure 10 confirms the negative effect of Ce addition to 30%Fe/Al2O3, 30%Fe/Al2O3 exhibits the highest H2 yield through the entire temperature range under study (500–800 °C). The suppression in H2 yield is attributed to active site sintering.
Figure 11 shows the effect of temperature on H2 yield, using 30%Fe-X%Co/Al2O3 catalysts 20 min after the onset of the reaction. For all loadings of 30%Fe-X%Co/Al2O3, H2 yield experienced almost a linear dependency on temperature. H2 yield increases with temperature since the reaction rate is expected to increase with temperature [1,3,4,5,6]. The highest H2 yield is observed with 30%Fe-30%Co/Al2O3 at 700 °C and below. Higher than 700 °C, H2 yield is slightly suppressed with 30%Fe-30%Co/Al2O3. For other 30%Fe-X%Co/Al2O3 catalysts, H2 yield exhibits a linear increase over the temperature range 500–800 °C. The results have shown that sintering does not play a major role at higher temperatures with 30%Fe-X%Co/Al2O3. The results reveal the positive contribution of Co for Fe catalyst due to the increased thermal stability of Fe/Al2O3 when Co is added.

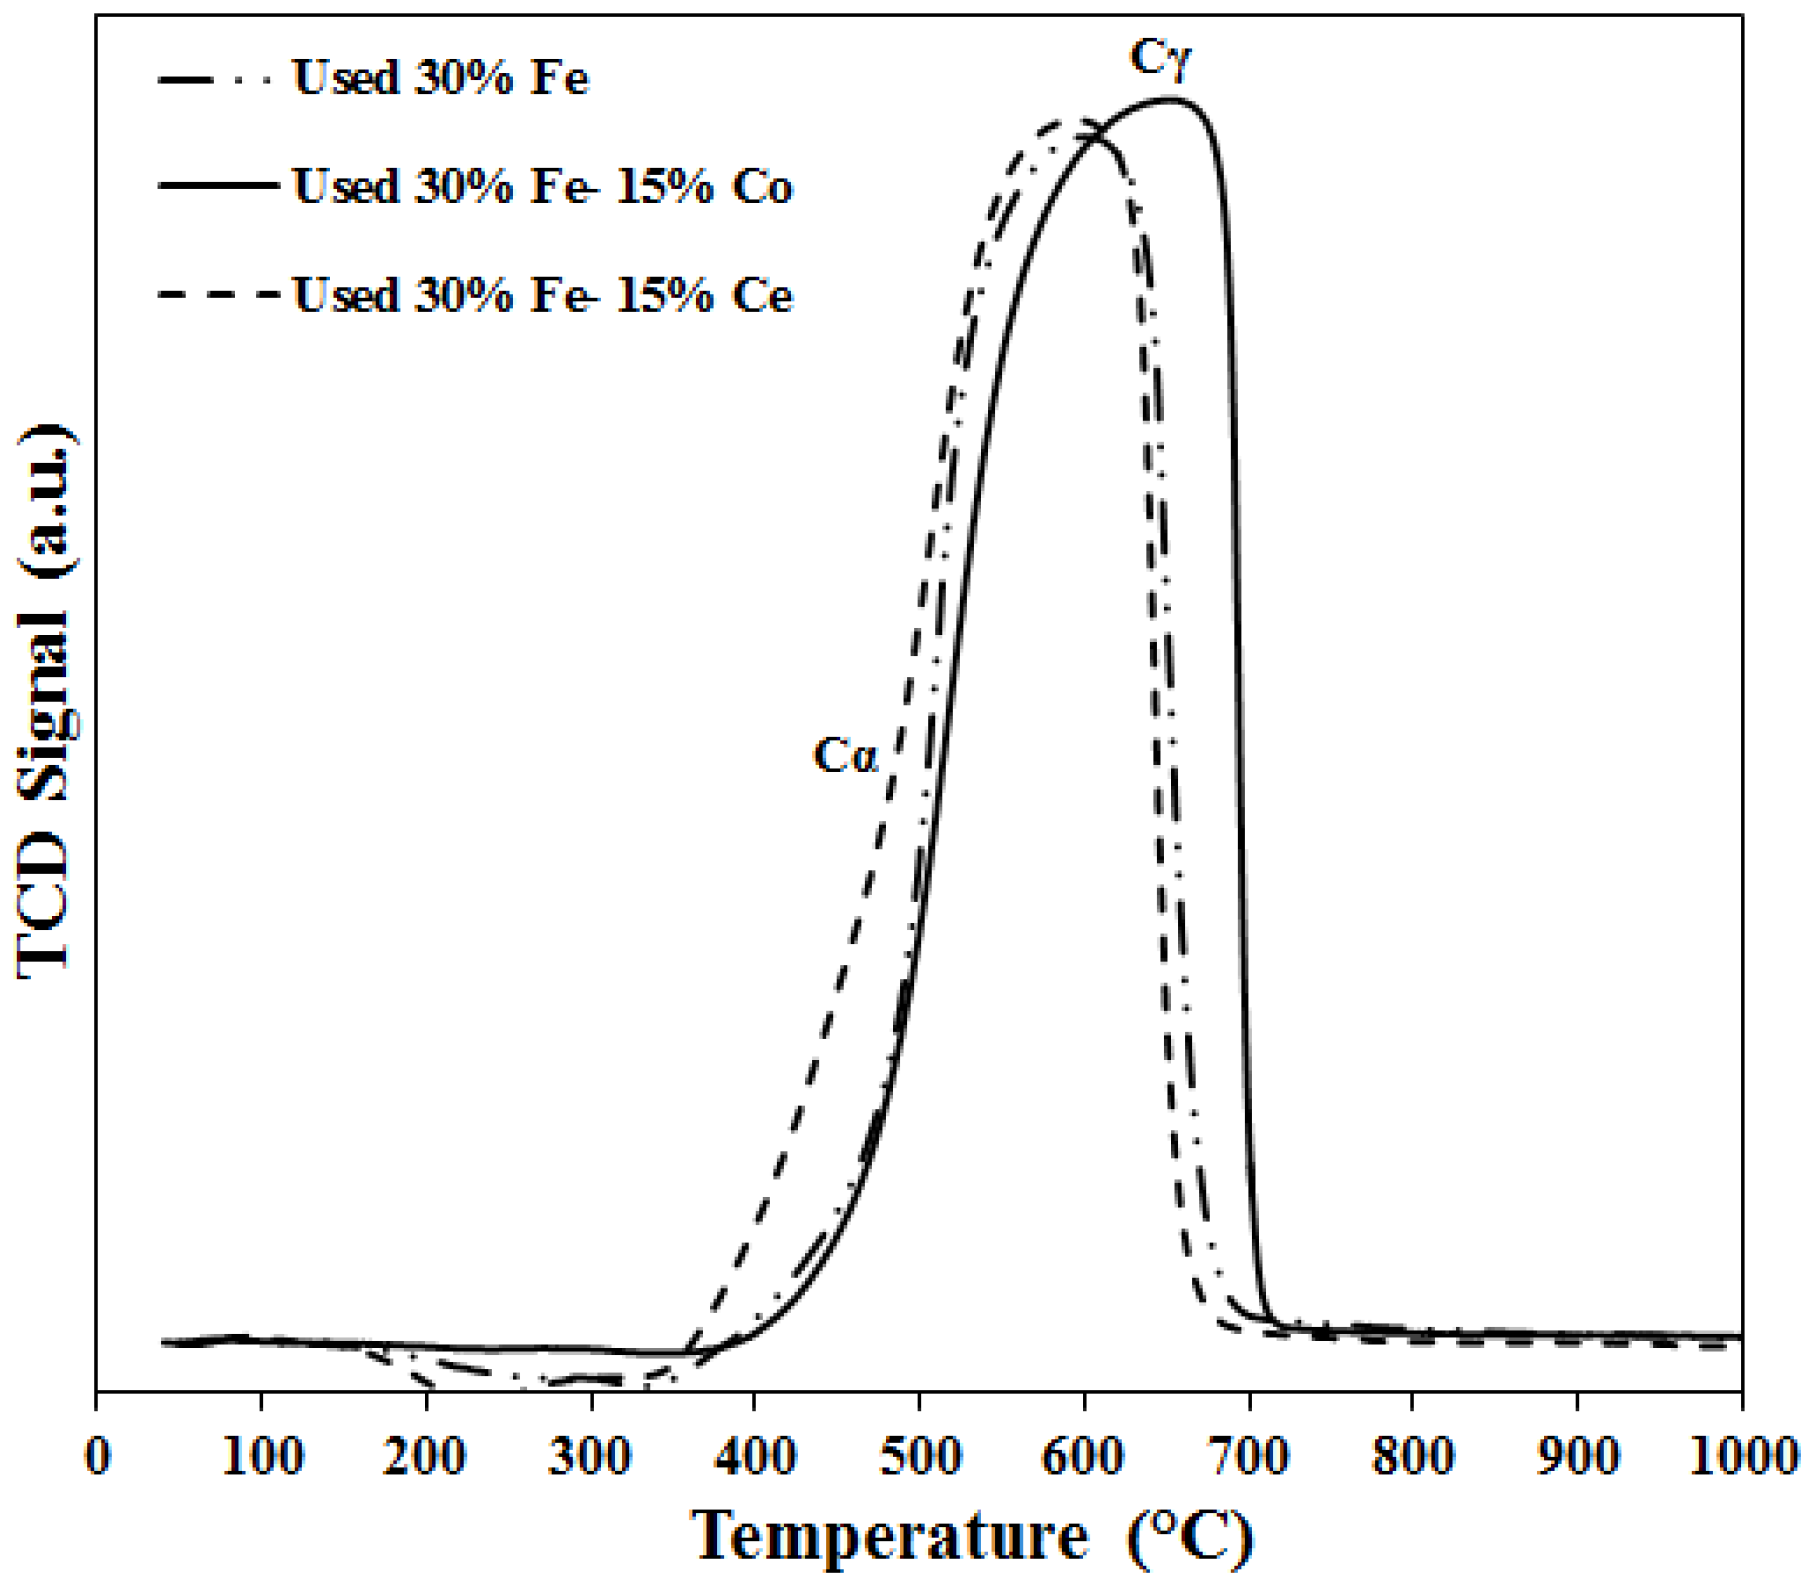
2.3. Characterization of Spent Catalyst

The deposited carbon on 30%Fe-15%Co/Al2O3 is studied using TEM, and the deposited carbon is found only as carbon nano-tubes as shown in Figure 12a,b. The TEM images (Figure 12a,b) have indicated that active sites are still on the tip of carbon nano-tubes without formation of encapsulating carbon. The carbon nano-tubes’ diameter varies from 14 to 73 nm, which may indicate the presence of single walled and multi-walled carbon nano-tubes. The inner diameter of carbon nanotubes varied along the nano-tube length from 13 to 26 nm.
The Raman spectra of the spent catalysts are shown in Figure 13. A similar spectrum has been observed for the three catalysts 30%Fe/Al2O3, 30%Fe-15%Co/Al2O3, 30%Fe-15%Ce/Al2O3, which supports our speculation based on XRD and TPR results since there is no evidence of formation of any chemical compounds between Fe and Co/Ce. The used catalyst samples were reduced at 500 °C and subjected to a reaction at 700 °C for 180 min. A weak Raman band is observed at 475 cm−1 corresponding to Fe2O3 [23,28,29,30]. The presence of such bands for Fe2O3 indicates the insufficient treatment during reduction. The observed Fe2O3 band showed lower intensity when Fe mixed with Co/Ce indicating the effect of promoting Fe/Al2O3 with Co/Ce.
Two types of carbon nanotubes are detected from the Raman spectroscopy. A band signal at 1354 cm−1 is corresponding to a polycrystalline and imperfect graphite structure [31,32]. While two Raman bands, at 1553 and 1652 cm−1, are corresponding for perfectly ordered graphitic structure [31,32].
The TPO patterns of carbon deposited during methane decomposition reaction are shown in Figure 14. The used catalyst is reduced at 500 °C then subjected to methane decomposition reaction at 700 °C for 180 min. The deposited carbon is burned and the produced gas is analyzed using a GC until no more CO or CO2 is detected. The results shown in Figure 14 represent the total carbon evolved including CO and CO2. Two peaks are detected one peak between 480 and 510 °C and another peak between 590 and 640 °C; corresponding to two types of carbon, namely: Cα and Cγ. Cα is easy to gasify while Cγ is harder [33].

3. Experimental Section

3.1. Catalyst Preparation

Supported Fe catalysts were prepared by the wet-impregnation method. Pellets of alumina (γ-Al2O3; SA6175) were supplied by Norton, Worcester, MA, USA. However, alumina pellets were crushed to a fine powder before being used as a final support material. Ferric nitrate [Fe(NO3)3·9H2O; 99%] (obtained from Sigma-Aldrich, St. Louis, MO, USA) was used as active metal precursor. Nickel nitrate [Ni(NO3)2·6H2O; 99%] and cobalt nitrate [Co(NO3)2·6H2O; 99%] were supplied by Riedel De Haen AG, Seelze, Hannover, 30926 Seelze, Germany and Sigma-Aldrich, St. Louis, MO, USA, respectively. 30 wt. % Fe/Al2O3 promoted catalysts with different loadings of Co or Ce (6, 15 and 30 wt. %) were prepared by co-impregnation of nitrate salts of Fe, Co, Ce using Al2O3 support as described below. The mixed catalysts will be designated throughout the article as: 30%Fe-X%Co/Al2O3, where X refers to the weight percentage of Co or Ce.
As in a typical wet-impregnation process, first the solution with a stoichiometric amount of [Fe(NO3)3·9H2O] was prepared in double distilled water, then the support (i.e., γ-Al2O3,) was impregnated in the prepared solution. The support was dried overnight at 150 °C. The impregnation mixture was stirred in a beaker at 80 °C for 3 h. After impregnation, the catalysts were dried overnight at 120 °C and followed by calcination at a temperature of 450 °C for 3 h in air. A calcination temperature of 450 °C has been used for iron-based catalysts for methane decomposition in several studies [18,33].

3.2. Catalytic Characterization

3.2.1. XRD Characterization

Rigaku (Miniflex, Tokyo, Japan) diffractometer was employed, with a Cu Kα radiation operated at 40 kV and 40 mA, to study the diffraction profiles of the calcined catalysts. The scanning range and step to be used for 2θ were taken as 10°–85° and 0.02° respectively. The raw data file of the instrument was analyzed by X’pert high score plus software developed by PANalytical B.V. (Almelo, Netherlands). The peak intensity was measured and ASCII file was generated at granularity 8, bending factor 5, minimum, peak significance 1, minimum, peak width 0.40, maximum tip width 1 and peak base width 2 by minimum second derivatives. Finally, XRD was plotted after 5 point smoothing in Origin 8.0 (developed by Originlab, Northampton, NC, USA).

3.2.2. Temperature Programmed Reduction/oxidation (TPR/TPO)

Micromeritics (Auto Chem II 2920 apparatus, Norcross, GA, USA) was used to study the TPR/TPO measurements using 70 mg for each sample. The pretreatment under high purity Argon flow was carried out at 150 °C for half an hour. Then, the samples were cooled down to room temperature. Finally, furnace temperature was raised at 10 °C/min to 1000 °C under 40 mL/min flow rate of H2/Ar mixture containing 10 vol. % of H2. The signals of H2 consumption were monitored by a thermal conductivity detector (TCD).
In order to find the nature of carbon deposition on spent catalysts, TPO experiments were performed. The catalyst samples under study were used previously in the catalytic methane decomposition reaction at 700 °C and 180 min. The samples were dried out at 150 °C for 30 min, under helium (He) flow (30 mL/min) and cooled down to room temperature, followed by an increase of temperature under O2/He (30 mL/min) flow with a temperature ramp of 10 °C/min to 1000 °C.

3.2.3. Hydrogen Chemisorption
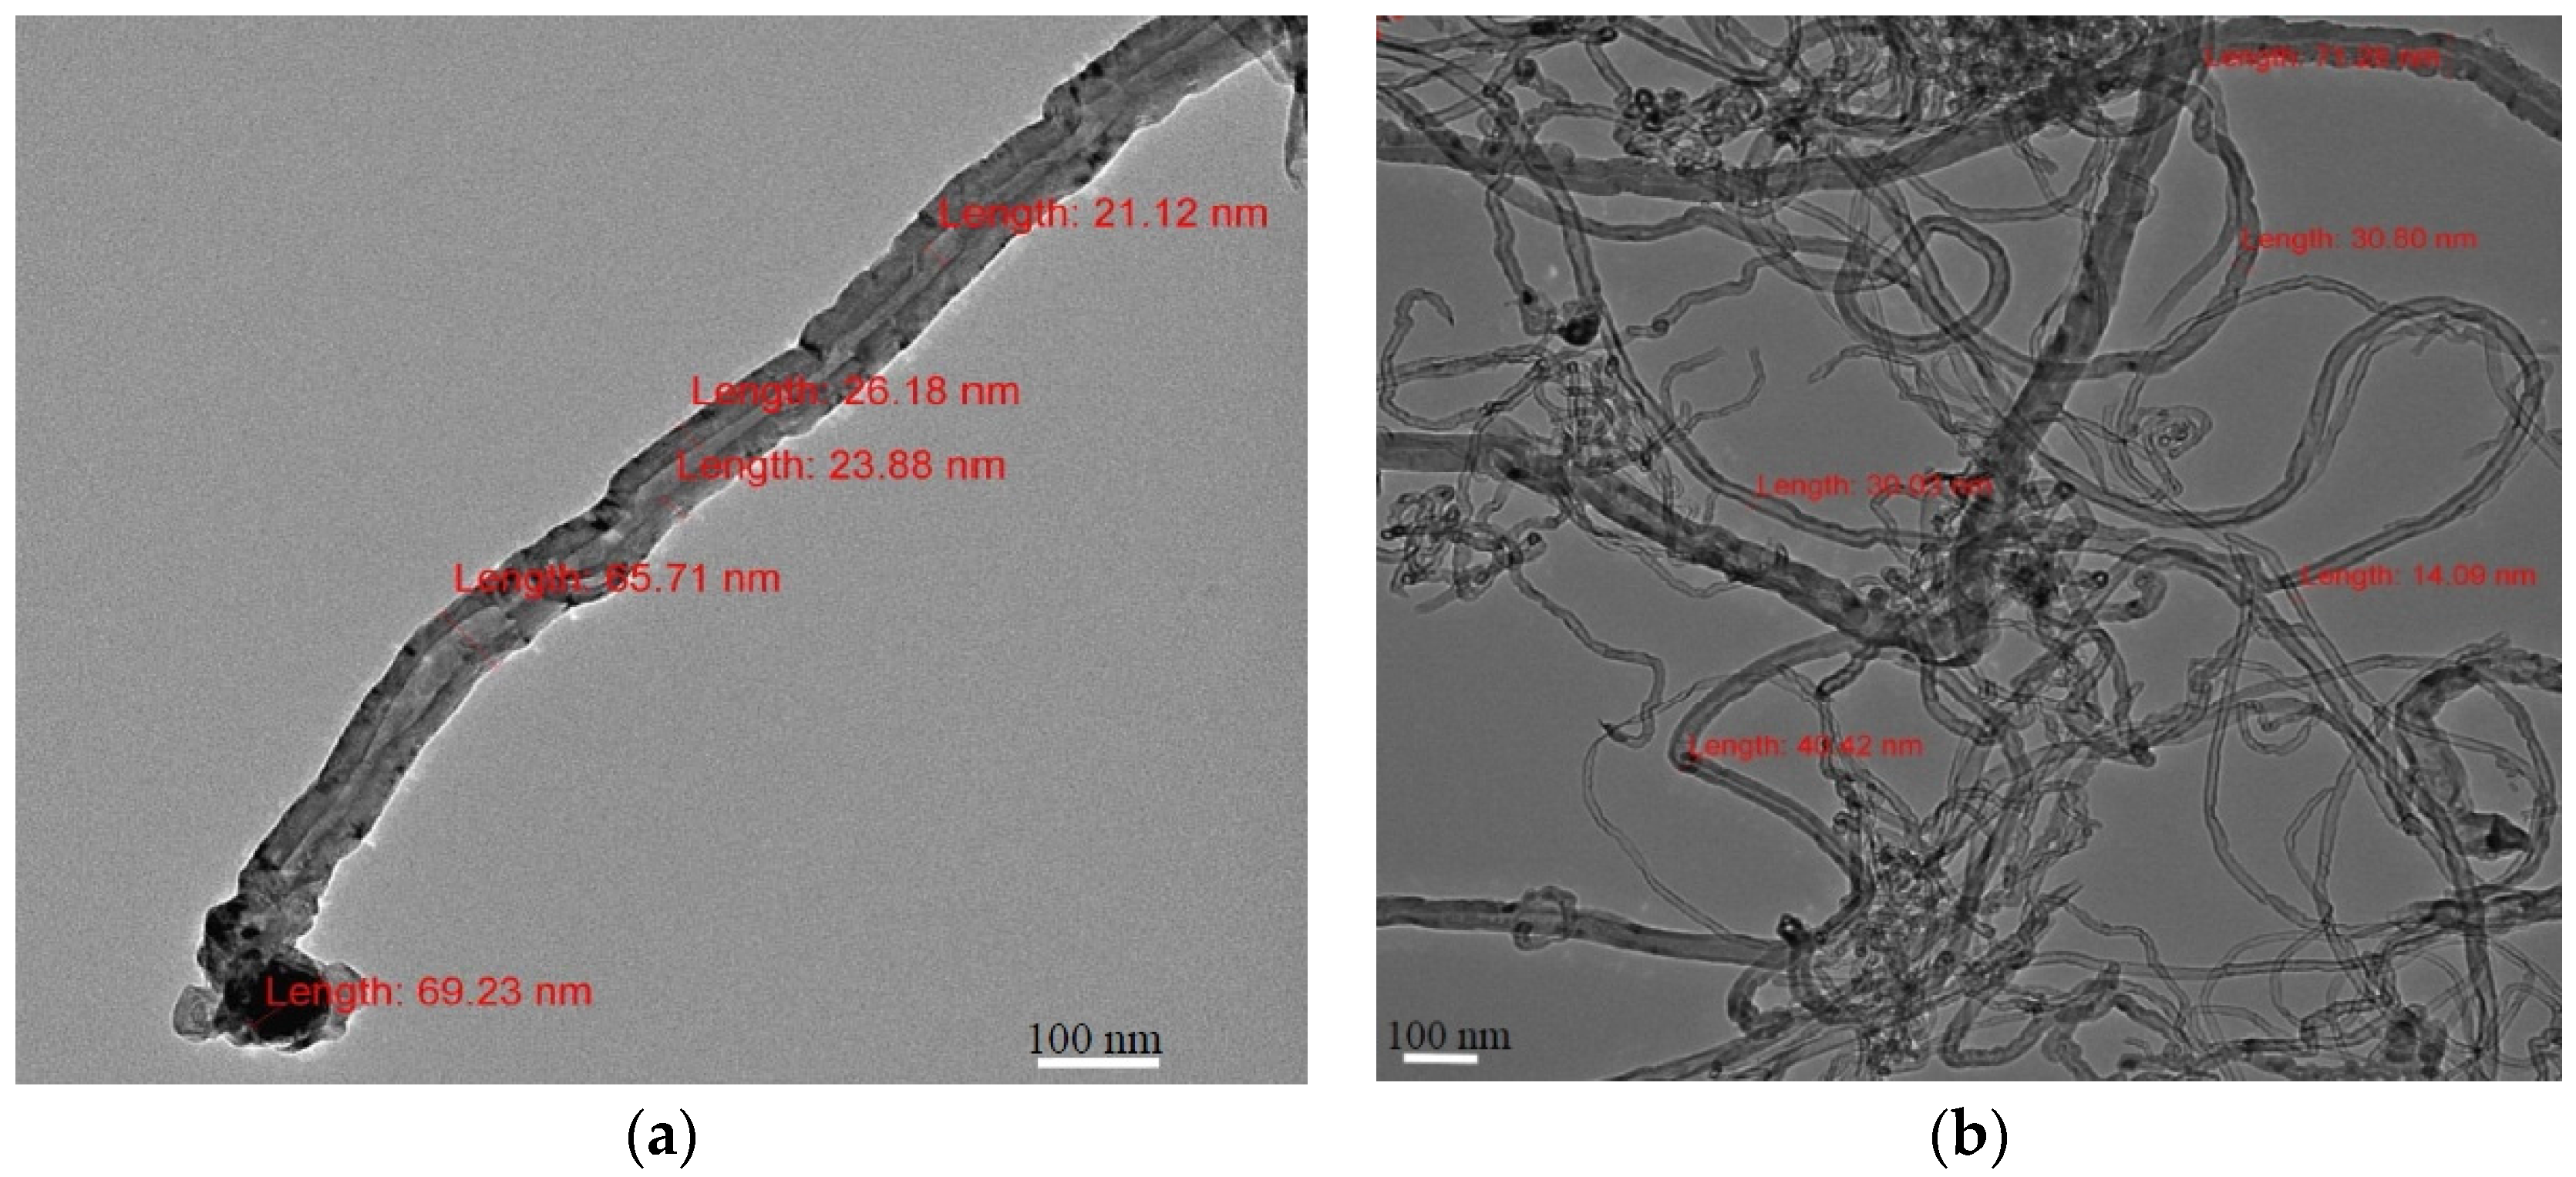
Catalyst dispersion was measured using H2 chemisorption in a Micromeritics (Auto Chem II 2920 apparatus, Norcross, GA, USA) using 74 mg of catalyst. The catalyst is reduced at 500 °C for 90 min. before hydrogen chemisorption measurements using 40 mL/min. of H2. Pulses of 1 vol. % H2 in Ar were then injected through the catalyst bed and H2 uptakes were measured. The dispersion is calculated using the instrument software assuming no interaction between mixed metals active sites. By considering the total number of moles of active metals, dispersion is calculated assuming a hydrogen adsorption stoichiometric factor equal to 1.

3.2.4. TEM

TEM measurements of spent samples were accomplished on a JEOL (JEM-2100F, JEOL Ltd, Tokyo, Japan) transmission electron microscope operated at 120 KV accelerating voltages to examine the morphology of the deposited carbon.

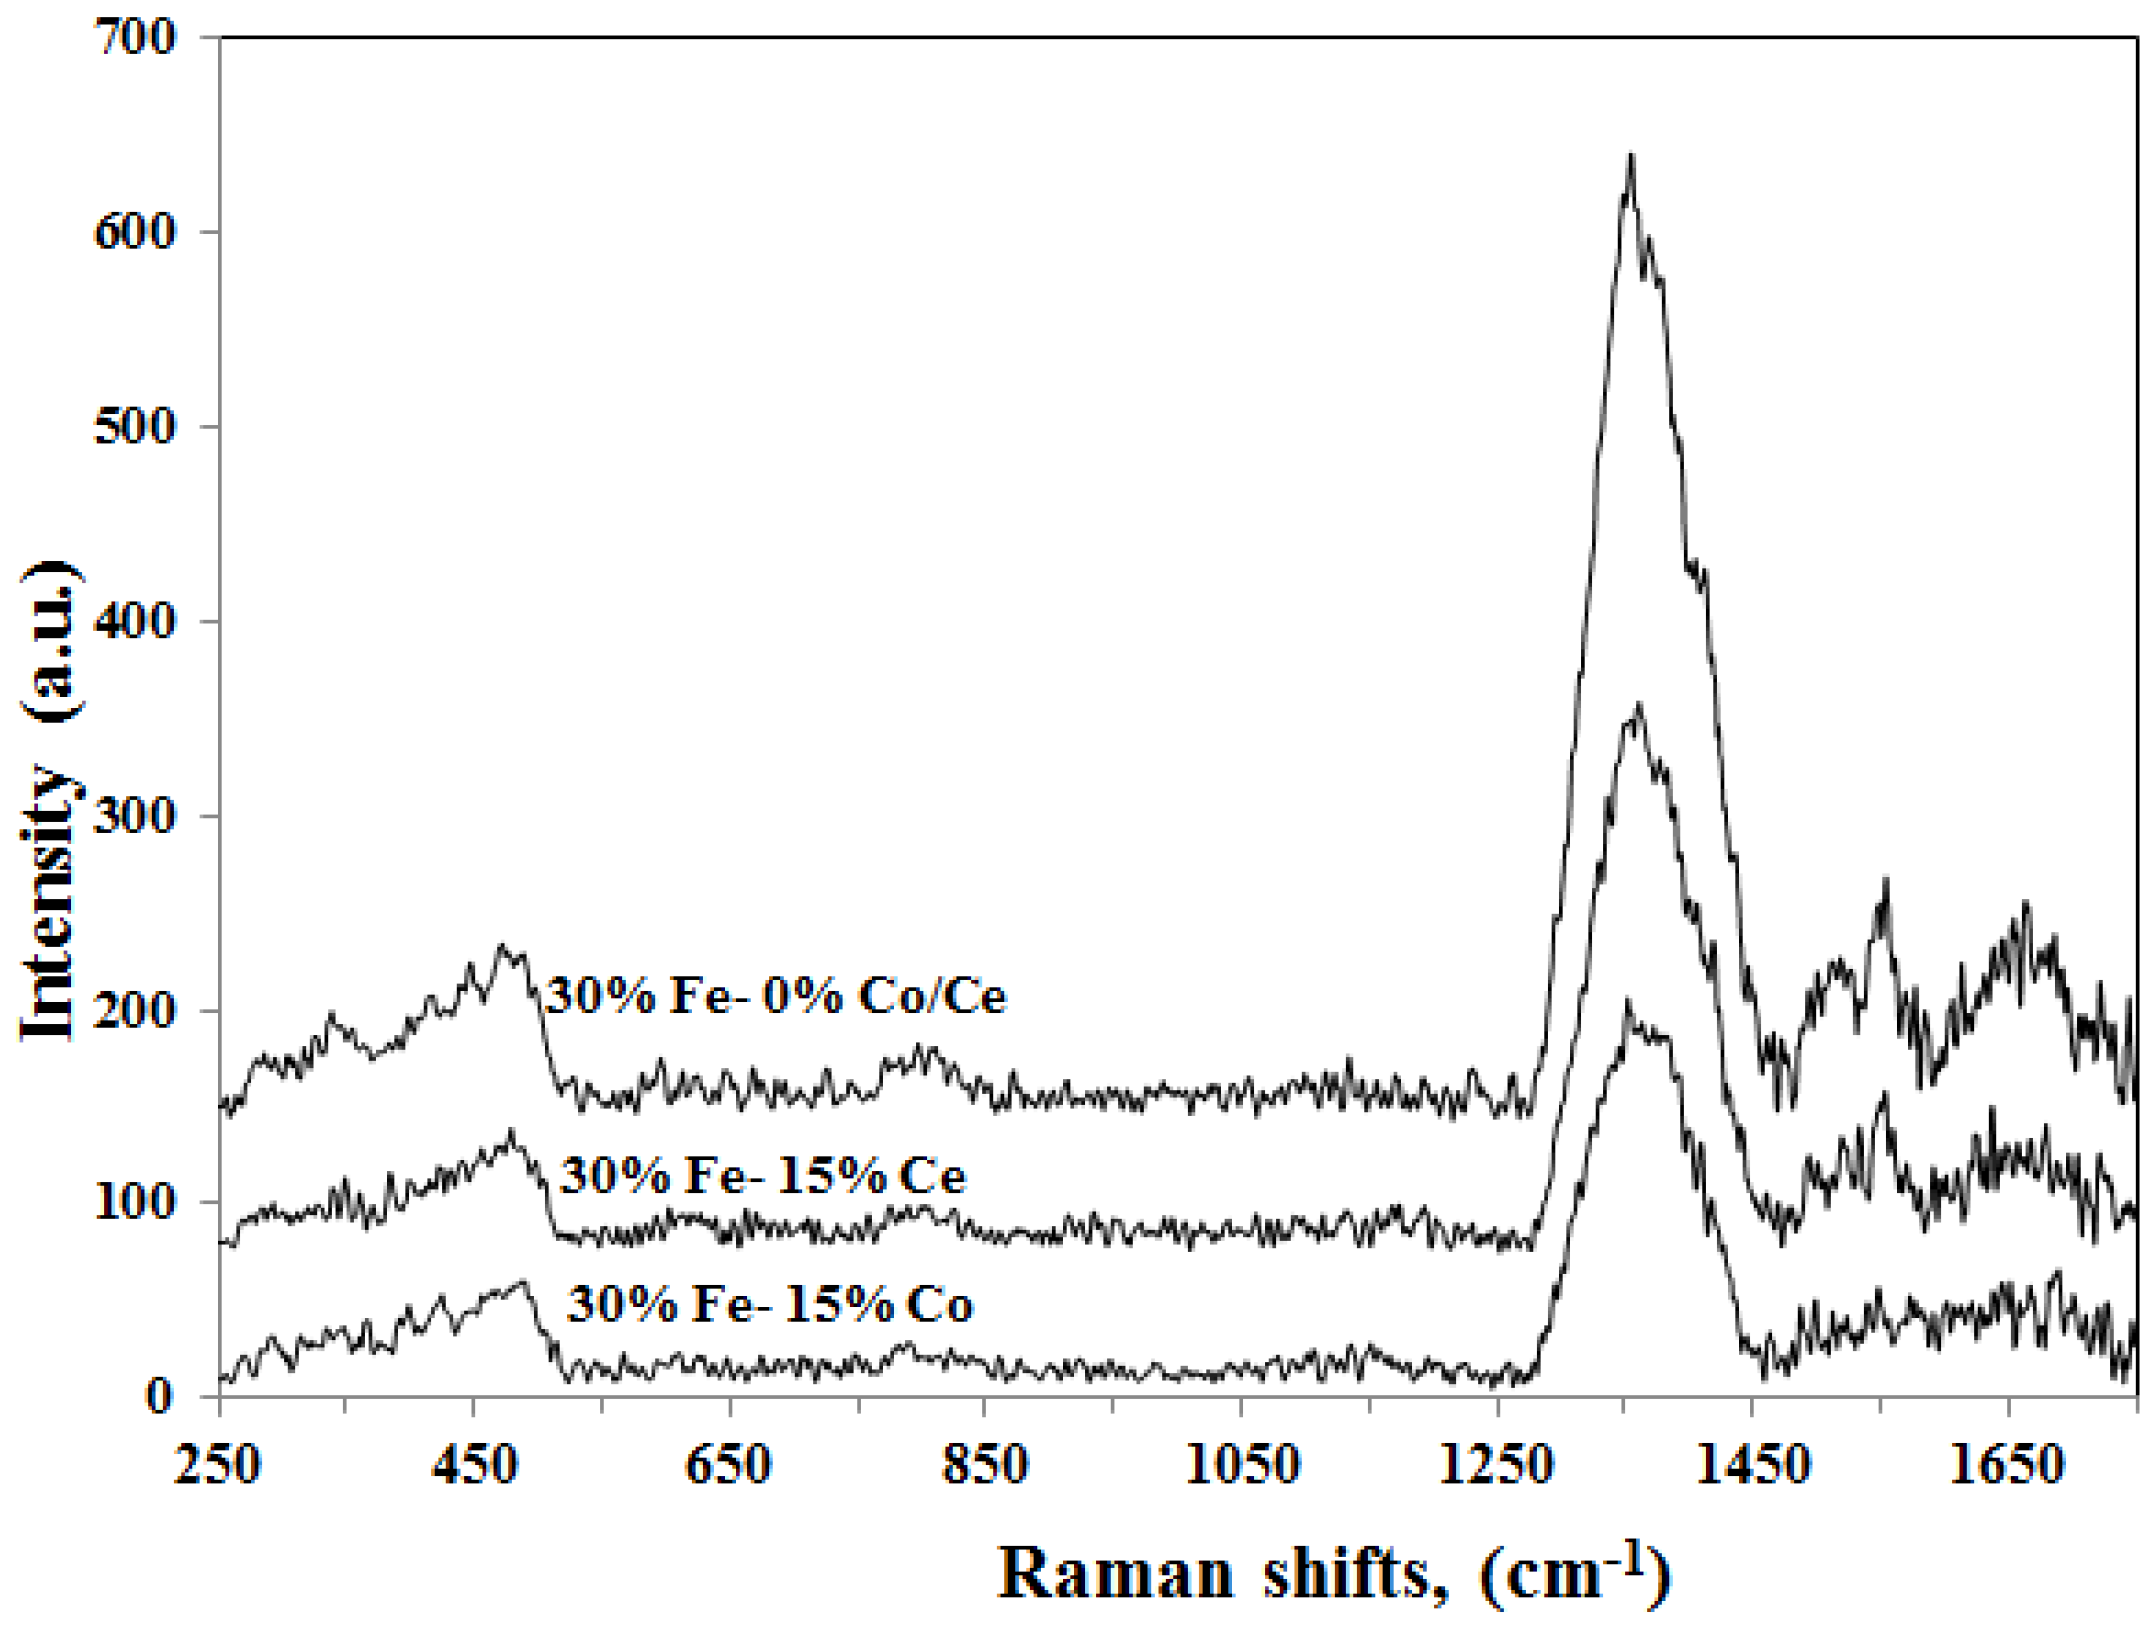
3.2.5. Raman Spectroscopy

Raman spectra were measured using TSI (ProRaman-L, Shoreview, MN, USA) for spent catalyst, the reaction conditions of the used samples at 700 °C for 180 min. The ProRaman-L is a high sensitivity CCD spectrograph CCD cooling temperature to −60 °C, and high throughput laboratory fiber optics probes. The excitation laser is available at 532 nm and 785 nm. The scanning was set between 250 and 1750 cm−1.

3.2.6. BET Surface Area Measurement

The BET surface area is measured using a Micromeritics (Tristar II 3020, Norcross, GA, USA) surface area and porosity analyzer. Nitrogen is used as the measuring gas at −196 °C. A 0.3 g of catalyst is pretreated at 300 °C for 180 min. under nitrogen atmosphere to remove moisture and adsorbed materials.

3.3. Catalyst Performance Evaluation

Catalytic methane decomposition (CMD) experiments over Fe based catalysts were performed under atmospheric pressure in a vertical stainless steel fixed-bed tubular (9.1 mm i.d. and 13 cm long) micro-reactor (PID Eng & Tech micro activity reference). The reaction setup used in this study is shown in detail elsewhere [19]. Overall, it consists of three main sections: gases delivery system, fixed bed reactor and products analysis section. A typical activity test is conducted over a fixed mass of catalyst (0.3 g) placed onto a quartz wool bed. In order to monitor the actual temperature in the reactor, a K-type stainless steel sheathed thermocouple is placed axially at the center of the catalyst bed. After loading the catalyst, a constant flow of N2 (20 mL/min) was introduced to the reactor, to purge the moisture, air and other gases from the reactor. Prior to activity tests, the catalysts were subjected to a reduction treatment under a continuous flow of H2 (40 mL/min) using two different temperatures to study the effect of reduction temperature on catalytic activity: 500 °C and 950 °C for 90 min. After reduction, the system was flushed with N2 for 15 min to purge any residual and physisorbed hydrogen from the reactor. Then the reactor temperature was increased to desired reaction temperature (i.e., 700 °C) in the presence of N2. Once the desired temperature was achieved, a feed mixture of pure methane and N2 gas was fed into the reactor. In a typical test, the volume ratio of the feed gas mixture, i.e., methane/nitrogen was 1.5/1, whereas the total flow rate was 25 mL/min with a space velocity of 5000 mL/h·gcat. The composition of the outlet gas was analyzed by online gas chromatography (Alpha M.O.S PR2100, Toulouse, France) equipped with a thermal conductivity detector. After the reaction, N2 gas was again introduced to replace the reactant gases at the reaction temperature. Then, the reactor was cooled to room temperature and subsequently the cooled catalyst was kept for characterization. The reproducibility of experimental runs was maintained and the reported results present the average of duplicate experimental runs.

4. Conclusions

Hydrogen is a very important raw material for many industries in addition to its importance as an energy carrier. Catalytic decomposition of methane can be employed to produce CO-free hydrogen. Fe in a bimetallic catalyst promoted with Co or Ce is studied using alumina as a support. The experimental results demonstrate a positive effect of Co addition to Fe, and a negative impact of the Ce addition to Fe on H2 yield.
Loading of Co and Ce is investigated in the range of 0–30 wt. %. The best performance is observed using 30%Fe-15%Co/Al2O3 at 700 °C, at which 71% H2 yield is achieved after 180 min on stream. Higher reduction temperature (950 °C) has a negative impact on catalytic activity, which is attributed to the sintering of active sites at such high reaction temperatures. The yield has shown an almost linear dependency on temperature. The observations are explained in terms of metal interactions. Fe and Ce are combined in a manner that will reduce the surface area of the active sites and will decrease the catalytic activity. Adding Co to Fe will add another active metal for methane cracking which will improve the catalytic activity and increase carbon capacity. Carbon nano-tubes are found in TEM images with active sites on the tip, while no encapsulating carbon is detected. Two types of carbon nanotubes are found: Cα is easy to gasify while Cγ is harder.

Acknowledgments

The authors thankfully acknowledge their appreciation to King Abdulaziz City for Science and Technology (KACST) for funding the work through the research project # AT-34-4.

Author Contributions

A.S.A., A.H.F., A.A.I. and W.U.K. performed all experiments and characterization tests as well as share in analysis of the data. R.L.A-O. performed hydrogen chemisorption as well as proofread the manuscript. Both A.A. and M.A.S. wrote the paper and share in data analysis.

Conflicts of Interest

The authors declare no conflict of interest.

References

  1. Amin, A.M.; Croiset, E.; Epling, W. Review of methane catalytic cracking for hydrogen production. Int. J. Hydrogen Energy 2011, 36, 2904–2935. [Google Scholar] [CrossRef]
  2. Abbas, H.F.; Wan Daud, W.M.A. Hydrogen production by methane decomposition: A review. Int. J. Hydrogen Energy 2010, 35, 1160–1190. [Google Scholar] [CrossRef]
  3. Amin, A.; Epling, W.; Croiset, E. Reaction and Deactivation Rates of Methane Catalytic Cracking over Nickel. Ind. Eng Chem. Res. 2011, 50, 12460–12470. [Google Scholar] [CrossRef]
  4. Huang, S.; Cai, Q.; Chen, J.; Qian, Y.; Zhang, L. Metal-Catalyst-Free Growth of Single-Walled Carbon Nanotubes on Substrates. J. Am. Chem. Soc. 2009, 131, 2094–2095. [Google Scholar] [CrossRef] [PubMed]
  5. Amin, A.M.; Croiset, E.; Constantinou, C.; Epling, W. Methane cracking using Ni supported on porous and non-porous alumina catalysts. Int. J. Hydrogen Energy 2012, 37, 9038–9048. [Google Scholar] [CrossRef]
  6. Amin, A.M.; Croiset, E.; Malaibari, Z.; Epling, W. Hydrogen production by methane cracking using Ni-supported catalysts in a fluidized bed. Int. J. Hydrogen Energy 2012, 37, 10690–10701. [Google Scholar] [CrossRef]
  7. Mubarak, N.M.; Abdullah, E.C.; Jayakumar, N.S.; Sahu, J.N. An overview on methods for the production of carbon nanotubes. Ind. Eng. Chem. 2014, 20, 1186–1197. [Google Scholar] [CrossRef]
  8. Muradov, N.Z. How to produce hydrogen from fossil fuels without CO2 emission. Int. J. Hydrogen Energy 1993, 18, 211–215. [Google Scholar] [CrossRef]
  9. Rodat, S.; Abanades, S.; Sans, J.-L.; Flamant, G. A pilot-scale solar reactor for the production of hydrogen and carbon black from methane splitting. Int. J. Hydrogen Energy 2010, 35, 7748–7758. [Google Scholar] [CrossRef]
  10. Karimi, E.Z.; Vahdati-Khaki, J.; Zebarjad, S.M.; Bataev, I.A.; Bannov, A.G. Nanocomposite Catalysts Obtaining by Mechanochemical Technique for Synthesizing Carbon Nanotubes. Synth. Reac. Inorg. Met. Org. Chem. 2013, 44, 212–221. [Google Scholar] [CrossRef]
  11. Jang, H.T.; Cha, W.S. Hydrogen production by the thermocatalytic decomposition of methane in a fluidized bed reactor. Korean J. Chem. Eng. 2007, 24, 374–377. [Google Scholar] [CrossRef]
  12. Brown, R.; Cooper, M.E.; Whan, D.A. Temperature programmed reduction of alumina-supported iron, cobalt and nickel bimetallic catalysts. Appl. Catal. 1982, 3, 177–186. [Google Scholar] [CrossRef]
  13. Manova, E.; Tsoncheva, T.; Paneva, D.; Mitov, I.; Tenchev, K.; Petrov, L. Mechanochemically synthesized nano-dimensional iron-cobalt spinel oxides as catalysts for methanol decomposition. Appl. Catal. A 2004, 277, 119–127. [Google Scholar] [CrossRef]
  14. Avdeeva, L.B.; Reshetenko, T.V.; Ismagilov, Z.R.; Likholobov, V.A. Iron-containing catalysts of methane decomposition: accumulation of filamentous carbon. Appl. Catal. A 2002, 228, 53–63. [Google Scholar] [CrossRef]
  15. Reshetenko, T.V.; Avdeeva, L.B.; Ushakov, V.A.; Moroz, E.M.; Shmakov, A.N.; Kriventsov, V.V.; Kochubey, D.I.; Pavlyukhin, Y.T.; Chuyilin, A.L.; Ismagilov, Z.R. Coprecipitated iron-containing catalysts (Fe-Al2O3, Fe-Co-Al2O3, Fe-Ni-Al2O3) for methane decomposition at moderate temperatures: Part II. Evolution of the catalysts in reaction. Appl. Catal. A 2004, 270, 87–99. [Google Scholar] [CrossRef]
  16. Tang, L.; Yamaguchi, D.; Burke, N.; Trimm, D.; Chiang, K. Methane decomposition over ceria modified iron catalysts. Catal. Commun. 2010, 11, 1215–1219. [Google Scholar] [CrossRef]
  17. Li, K.; Wang, H.; Wei, Y.; Yan, D. Transformation of methane into synthesis gas using the redox property of Ce-Fe mixed oxides: Effect of calcination temperature. Int. J. Hydrogen Energy 2011, 36, 3471–3482. [Google Scholar] [CrossRef]
  18. Bayat, N.; Rezaei, M.; Meshkani, F. Methane decomposition over Ni-Fe/Al2O3 catalysts for production of COx-free hydrogen and carbon nanofiber. Int. J. Hydrogen Energy 2015. [Google Scholar] [CrossRef]
  19. Ibrahim, A.A.; Fakeeha, A.H.; Al-Fatesh, A.S.; Abasaeed, A.E.; Khan, W.U. Methane decomposition over iron catalyst for hydrogen production. Int. J. Hydrogen Energy 2015, 40, 7593–7600. [Google Scholar] [CrossRef]
  20. Lohitharn, N.; Goodwin, J.G., Jr.; Lotero, E. Fe-based Fischer-Tropsch synthesis catalysts containing carbide-forming transition metal promoters. J. Catal. 2008, 255, 104–113. [Google Scholar] [CrossRef]
  21. Ali, S.; Mohd Zabidi, N.; Subbarao, D. Correlation between Fischer-Tropsch catalytic activity and composition of catalysts. Chem. Cent. J. 2011, 5, 68. [Google Scholar] [CrossRef] [PubMed]
  22. Yang, Q.; Choi, H.; Al-Abed, S.R.; Dionysiou, D.D. Iron-cobalt mixed oxide nanocatalysts: Heterogeneous peroxymonosulfate activation, cobalt leaching, and ferromagnetic properties for environmental applications. Appl. Catal. B 2009, 88, 462–469. [Google Scholar] [CrossRef]
  23. Liang, C.; Ma, Z.; Lin, H.; Ding, L.; Qiu, J.; Frandsen, W.; Su, D. Template preparation of nanoscale CexFe1−xO2 solid solutions and their catalytic properties for ethanol steam reforming. J. Mater. Chem. 2009, 19, 1417–1424. [Google Scholar] [CrossRef]
  24. Carja, G.; Delahay, G.; Signorile, C.; Coq, B. Fe-Ce-ZSM-5 a new catalyst of outstanding properties in the selective catalytic reduction of NO with NH3. Chem. Comm. 2004, 12, 1404–1405. [Google Scholar] [CrossRef] [PubMed]
  25. Reddy, G.K.; Gunasekara, K.; Boolchand, P.; Smirniotis, P.G. Cr- and Ce-Doped Ferrite Catalysts for the High Temperature Water-Gas Shift Reaction: TPR and Mossbauer Spectroscopic Study. J. Phys. Chem. C 2011, 115, 920–930. [Google Scholar] [CrossRef]
  26. Perez-Alonso, F.J.; Lopez Granados, M.; Ojeda, M.; Terreros, P.; Rojas, S.; Herranz, T.; Fierro, J.L.G. Chemical Structures of Coprecipitated Fe-Ce Mixed Oxides. Chem. Mater. 2005, 17, 2329–2339. [Google Scholar] [CrossRef]
  27. Shim, S.-H.; Duffy, T.S. Raman spectroscopy of Fe2O3 to 62 GPa. Am. Mineral. 2002, 87, 318–326. [Google Scholar] [CrossRef]
  28. El Mendili, Y.; Bardeau, J.-F.; Randrianantoandro, N.; Gourbil, A.; Greneche, J.-M.; Mercier, A.-M.; Grasset, F. New evidences of in situ laser irradiation effects on y-Fe2O3 nanoparticles: A Raman spectroscopic study. J. Raman Spectrosc. 2011, 42, 239–242. [Google Scholar] [CrossRef]
  29. Hu, Y.-S.; Kleiman-Shwarsctein, A.; Forman, A.J.; Hazen, D.; Park, J.-N.; McFarland, E.W. Pt-Doped alpha-Fe2O3 Thin Films Active for Photoelectrochemical Water Splitting. Chem. Mater. 2008, 20, 3803–3805. [Google Scholar] [CrossRef]
  30. Kataura, H.; Kumazawa, Y.; Maniwa, Y.; Umezu, I.; Suzuki, S.; Ohtsuka, Y.; Achiba, Y. Optical properties of single-wall carbon nanotubes. Synt. Met. 1999, 103, 2555–2558. [Google Scholar] [CrossRef]
  31. Maruyama, S.; Kojima, R.; Miyauchi, Y.; Chiashi, S.; Kohno, M. Low-temperature synthesis of high-purity single-walled carbon nanotubes from alcohol. Chem. Phys. Lett. 2002, 360, 229–234. [Google Scholar] [CrossRef]
  32. Guo, J.; Lou, H.; Zheng, X. The deposition of coke from methane on a Ni/MgAl2O4 catalyst. Carbon 2007, 45, 1314–1321. [Google Scholar] [CrossRef]
  33. Fakeeha, A.; Khan, W.; Ibrahim, A.; Al-Otaibi, R.; Al-Fatesh, A.; Soliman, M.; Abasaeed, A. Alumina Supported Iron Catalyst for Hydrogen Production: Calcination Study. IJACEBS 2015, 2, 139–141. [Google Scholar]
Figure 1. TPR profiles for Fe, Co, and Fe-Co catalysts.
Catalysts 06 00040 g001
Figure 2. TPR profiles for Fe and Fe-Ce catalysts.
Catalysts 06 00040 g002
Figure 3. XRD patterns for Fe and Fe-Co catalysts.
Catalysts 06 00040 g003
Figure 4. XRD patterns for Fe and Fe-Ce catalysts.
Catalysts 06 00040 g004
Figure 5. Effect of Ce content on H2 yield using 30%Fe-X%Ce/Al2O3at 700 °C (reduced at 500 °C, reaction at 700 °C).
Catalysts 06 00040 g005
Figure 6. Effect of Ce content on H2 yield using 30%Fe-X%Ce/Al2O3 at 700 °C (reduced at 950 °C, reaction at 700 °C).
Catalysts 06 00040 g006
Figure 7. Effect of Co content on H2 yield using 30%Fe-X%Co/Al2O3 at 700 °C (reduced at 500 °C, reaction at 700 °C).
Catalysts 06 00040 g007
Figure 8. Effect of Co content on H2 yield using 30%Fe-X%Co/Al2O3 at 700 °C (reduced at 950 °C, reaction at 700 °C).
Catalysts 06 00040 g008
Figure 9. Effect of Co content on H2 produced using 30%Fe-X%Co/Al2O3 at 700 °C (reduced at 500 °C, reaction at 700 °C).
Catalysts 06 00040 g009
Figure 10. H2 yield as a function of temperature for different loadings of Ce (reduced at 500 °C).
Catalysts 06 00040 g010
Figure 11. H2 yield as a function of temperature for different loadings of Co (reduced at 500 °C).
Catalysts 06 00040 g011
Figure 12. TEM images of carbon nano-tubes deposited on 30%Fe-15%Co/Al2O3 (reduced at 500 °C, reaction conditions: 700 °C, 180 min).
Catalysts 06 00040 g012
Figure 13. Raman spectra of spent catalysts (reduced at 500 °C, reaction at 700 °C for 180 min).
Catalysts 06 00040 g013
Figure 14. TPO patterns for carbon deposited on the used catalysts (reduced at 500 °C, carbon deposited at 700 °C for 180 min).
Catalysts 06 00040 g014
Table 1. BET surface area of reduced catalysts as measured using N2 physisorption.
SampleSurface Area m2/g
30%Fe/Al2O360.8
30%Fe-6%Co/Al2O343.4
30%Fe-15%Co/Al2O352.4
30%Fe-30%Co/Al2O372
30%Fe-6%Ce/Al2O356.25
30%Fe-15%Ce/Al2O352.1
30%Fe-30%Ce/Al2O395.3
Table 2. Dispersion of the prepared catalysts as estimated by H2 chemisorption.
SampleFresh Catalyst (Reduced at 500 °C)Fresh Catalyst (Reduced at 950 °C)
30%Fe/Al2O322.15%0.34%
30%Fe-15%Co/Al2O311.71%11.98%
30%Fe-15%Ce/Al2O313.36%15.28%

