Article

Pulsed Laser Deposition of Platinum Nanoparticles as a Catalyst for High-Performance PEM Fuel Cells

1
Institute of Atomic and Molecular Sciences, Academia Sinica, Taipei 106, Taiwan
2
Department of Physics, National Central University, Taoyuan 320, Taiwan
3
Molecular Science and Technology Program, Taiwan International Graduate Program, Academia Sinica, Taipei 115, Taiwan
4
Department of Mechanical Engineering, National Central University, Taoyuan 320, Taiwan
*
Author to whom correspondence should be addressed.
Catalysts 2016, 6(11), 180; https://doi.org/10.3390/catal6110180
Submission received: 29 September 2016 / Revised: 7 November 2016 / Accepted: 17 November 2016 / Published: 22 November 2016
(This article belongs to the Special Issue Catalysis for Low Temperature Fuel Cells)

Abstract

:
The catalyst layers for polymer-electrolyte-membrane (PEM) fuel cells were fabricated by deposition of platinum directly onto the gas diffusion layer using pulsed laser deposition (PLD). This technique reduced the number of steps required to synthesize the catalyst layers and the amount of Pt loading required. PEM fuel cells with various Pt loadings for the cathode were investigated. With a cathode Pt loading of 100 μ g·cm 2 , the current density of a single cell reached 1205 mA·cm 2 at 0.6 V, which was close to that of a single cell using an E-TEK (trademark) Pt/C electrode with a cathode Pt loading of 400 μ g·cm 2 . Furthermore, for a PEM fuel cell with both electrodes prepared by PLD and a total anode and cathode Pt loading of 117 μ g·cm 2 , the overall Pt mass-specific power density at 0.6 V reached 7.43 kW·g 1 , which was five times that of a fuel cell with E-TEK Pt/C electrodes. The high mass-specific power density was due to that a very thin nanoporous Pt layer was deposited directly onto the gas diffusion layer, which made good contact with the Nafion membrane and thus resulted in a low-resistance membrane electrode assembly.

1. Introduction

Recently, fuel cell technologies have received much attention due to growing concerns regarding the depletion of fossil fuels and climate change. The polymer-electrolyte-membrane (PEM) fuel cell is one of the most promising technologies. However, the high cost of PEM fuel cells has hindered its commercialization. The cost of a PEM fuel cell depends largely on the amount of Pt catalyst used. Therefore, the development of new methods to reduce Pt loading and achieve a higher Pt mass-specific power density (MSPD) is an active research area [1].
The preparation of membrane electrode assemblies (MEA) by directly depositing Pt onto a gas diffusion layer (GDL) is an efficient way because it results in a thin catalyst layer and good dispersion of Pt nanoparticles which translates into high Pt utilization. Various physical vapor deposition techniques such as high-power impulse magnetron sputtering [2], sputtering [3,4], e-beam evaporation [5], dual ion-beam assisted deposition [6] and pulsed laser deposition (PLD) [7,8] have been pursued to achieve high power density with lower Pt loading. Physical vapor deposition techniques offer benefits over chemical techniques of being a one-step process that leads to the formation of a thin film of nanoparticles. Some researchers have also deposited Pt onto the Nafion [9] or polytetrafluoroethylene (PTFE) sheets [10], but the overall cell performance was not as high as when Pt was deposited on GDL.
PLD has developed into an important deposition technique in the past few decades. One of the major advantages of PLD over other deposition techniques is its capability to generate high kinetic energy ions and atoms. It is also straightforward in generating nanoparticles by performing pulsed laser deposition in an ambient gas atmosphere, as a result of cooling of the ablation plume by the ambient gas [11]. By controlling the pressure of the ambient gas, one can control the size of deposited particles and the porosity of the grown film [12]. Cunningham et al. [7] reported that by using PLD in He atmosphere to deposit Pt onto GDL, with a very low Pt loading of 17 μ g·cm 2 , the catalyst-loaded GDL could achieve a current density of 780 mA·cm 2 when used at the anode. In our earlier work [11], we had achieved a high current density of 1032 mA·cm 2 with an anode Pt loading of 13 μ g·cm 2 by using PLD in Ar atmosphere. The better performance compared to the previous work could be ascribed to the smaller Pt nanoparticle size. Since the oxygen reduction reaction (ORR) at the cathode is very sluggish in nature compared to hydrogen oxidation reaction (HOR) at the anode, the cathode requires a much larger amount of catalyst compared to the anode. Therefore, it is generally recognized that the ORR at the cathode is the bottleneck and the reduction of Pt usage at the cathode holds the key to lowering the overall MSPD. Previously, only Mròz et al. [8] have reported using PLD to deposit Pt for the cathode of PEM fuel cell. They used PLD in vacuum to deposit Pt at a loading of 7 μ g·cm 2 to achieve a maximum power density of 188 mW·cm 2 and a current density of 100 mA·cm 2 at 0.6 V. Although the Pt loading used was low, the power and current densities were too low to be practically useful. For instance, it is required that for vehicle operation a fuel cell should produce at least 1500 mA·cm 2 at 0.6 V [13]. The low power and current density values of Mròz et al. resulted from the use of PLD in vacuum. It led to the formation of a dense, low-porosity Pt layer instead of a nanoporous structure that ensures a high electrochemical surface area (ECSA) and good charge transfer and gas transport. For fabricating a high-performance MEA, it is paramount to control the size of nanoparticles and the porosity and thickness of the catalyst layer.
In this work, PLD in Ar atmosphere was used to deposit Pt nanoparticles onto GDL with a microporous layer for the cathode first and then for both electrodes for developing high-performance PEM fuel cells. Fuel cells using pulsed laser deposited Pt nanoparticles with four different Pt loadings (50, 75, 100 and 125 μ g·cm 2 ) as the cathode catalyst, and commercial E-TEK (trademark) Pt/C with a Pt loading of 200 μ g·cm 2 as the anode catalyst, were characterized. The dependence of fuel cell performance on the cell outlet pressure was also investigated. The cells were also characterized by using electrochemical impedance spectroscopy. Finally, the fuel cell with the catalysts of both the anode and the cathode prepared by using PLD was characterized. With a low total Pt loading of 117 μ g·cm 2 , the current density at 0.6 V reached 1450 mA·cm 2 , corresponding to a power density of 870 mW·cm 2 . This work demonstrated that PLD could be used to reduce the amount of Pt used while maintaining high current and power densities in PEM fuel cells for practical applications.

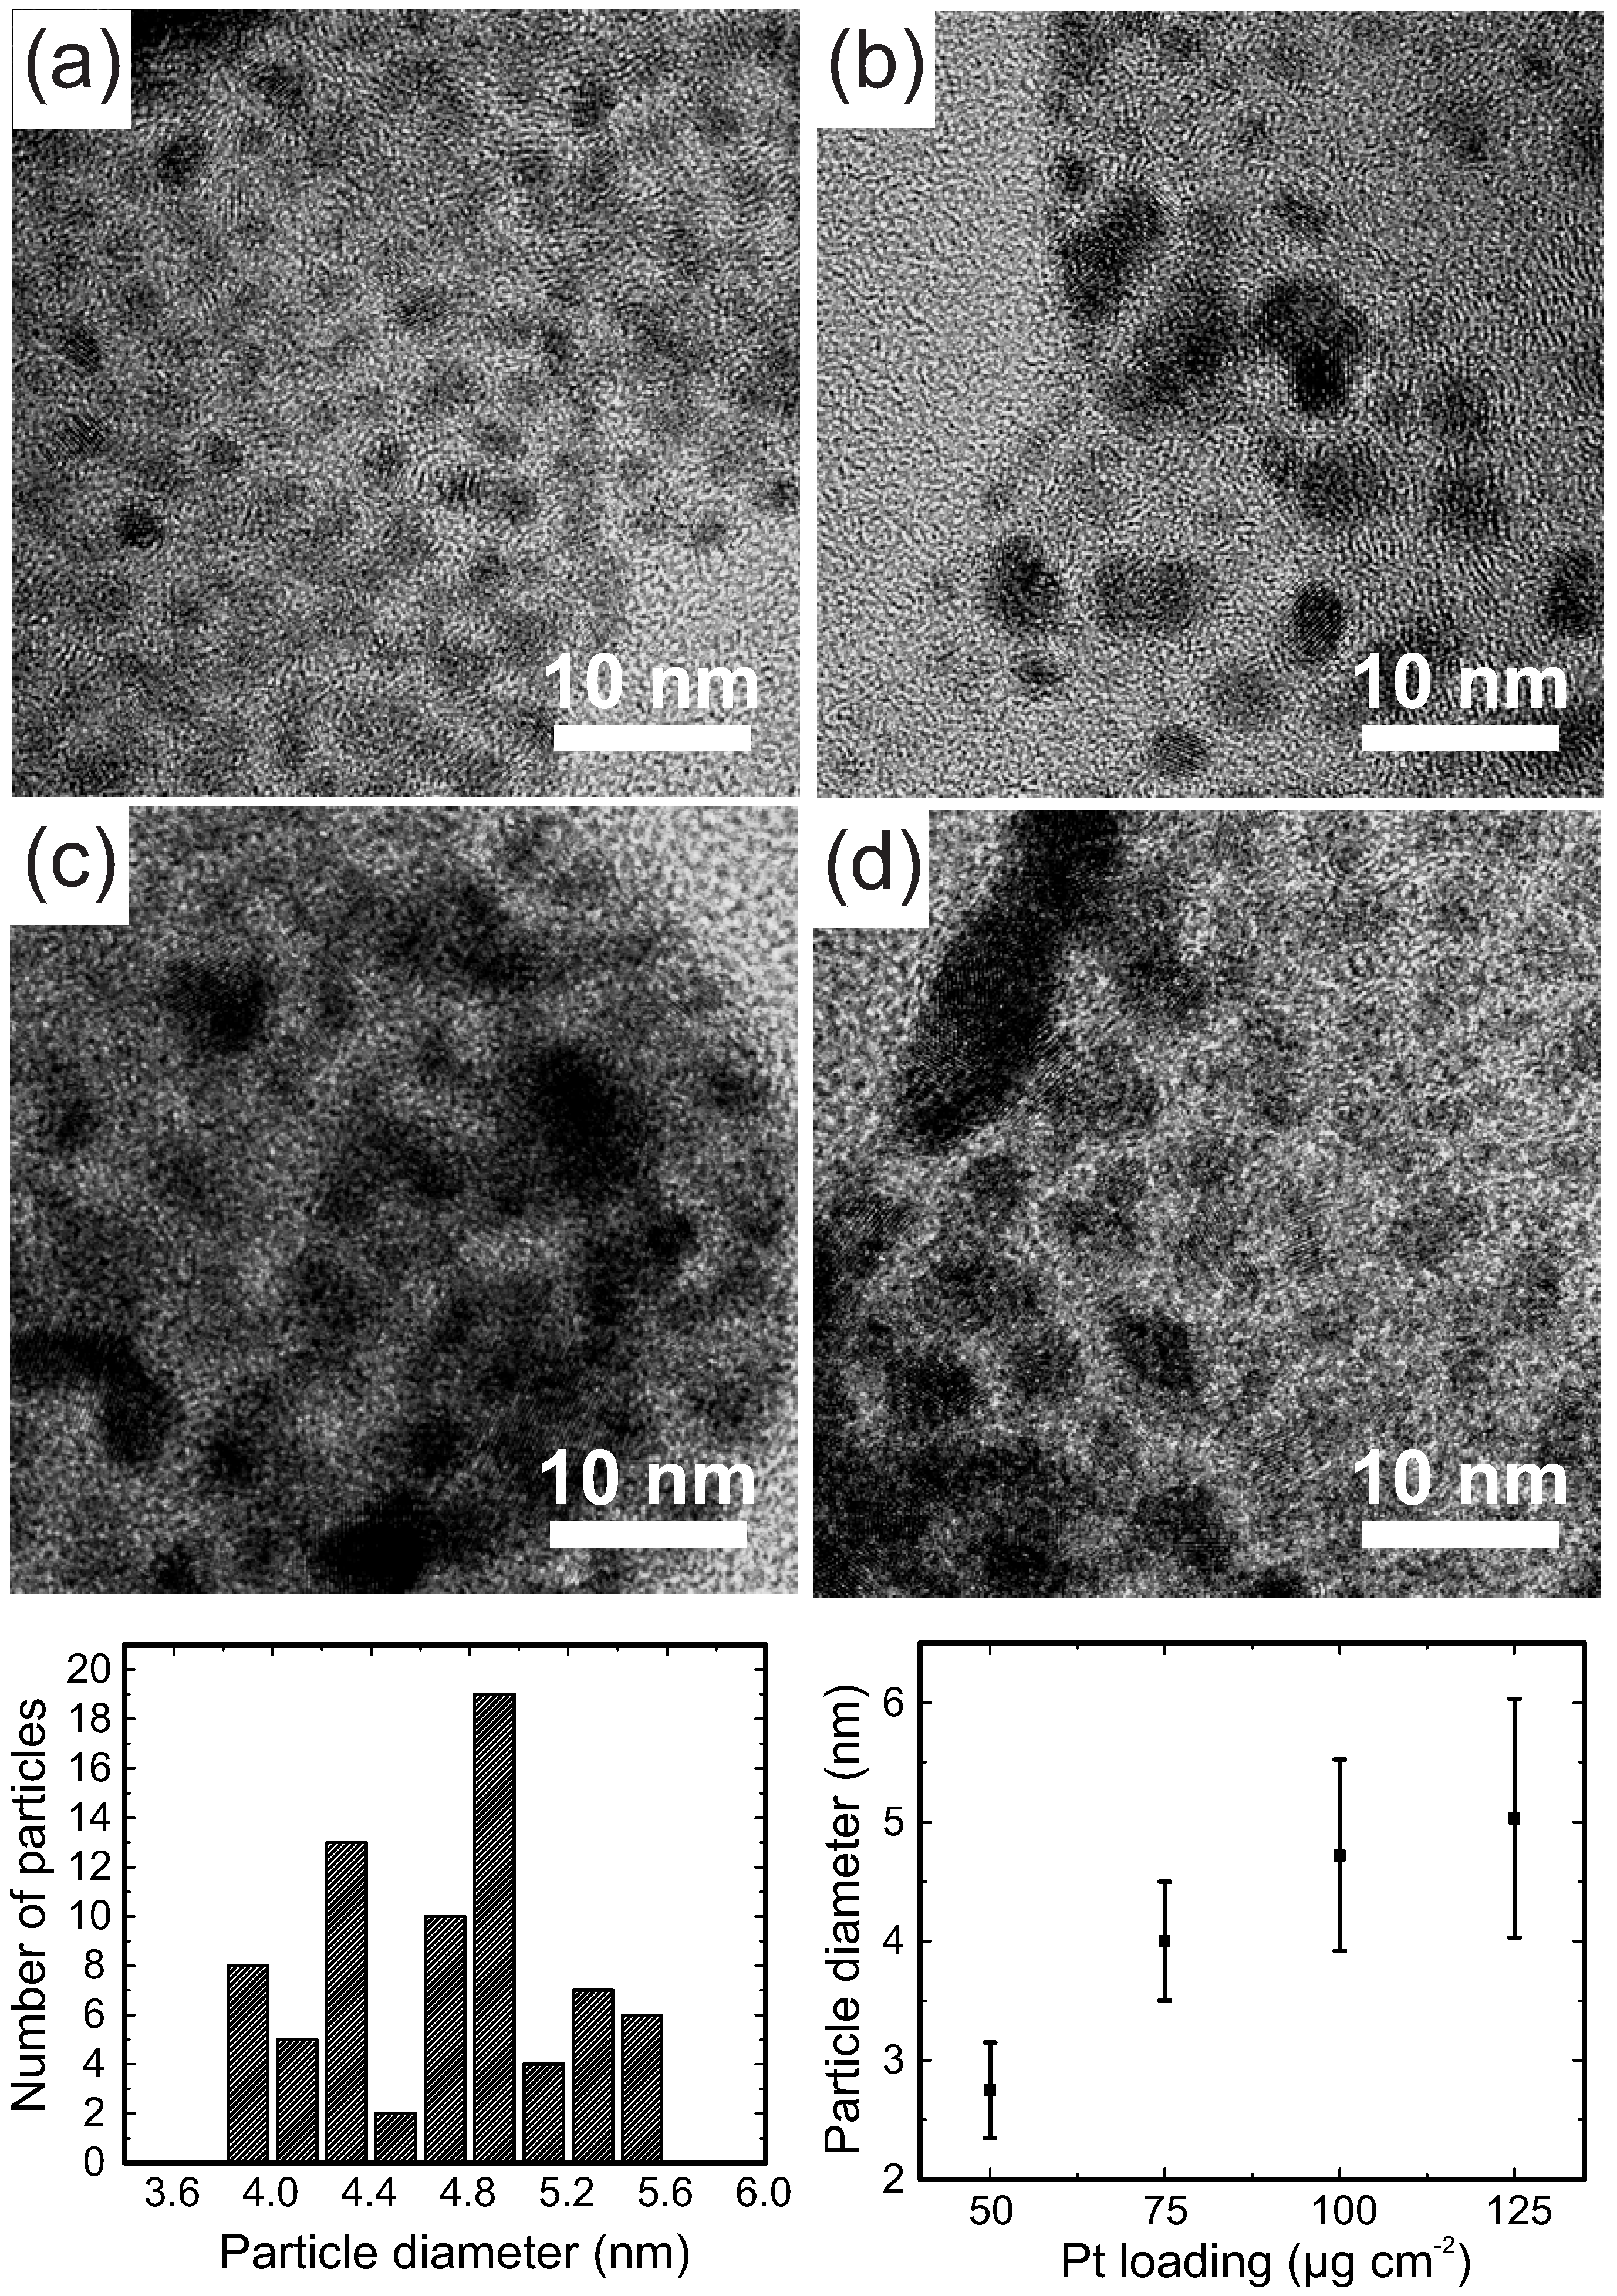
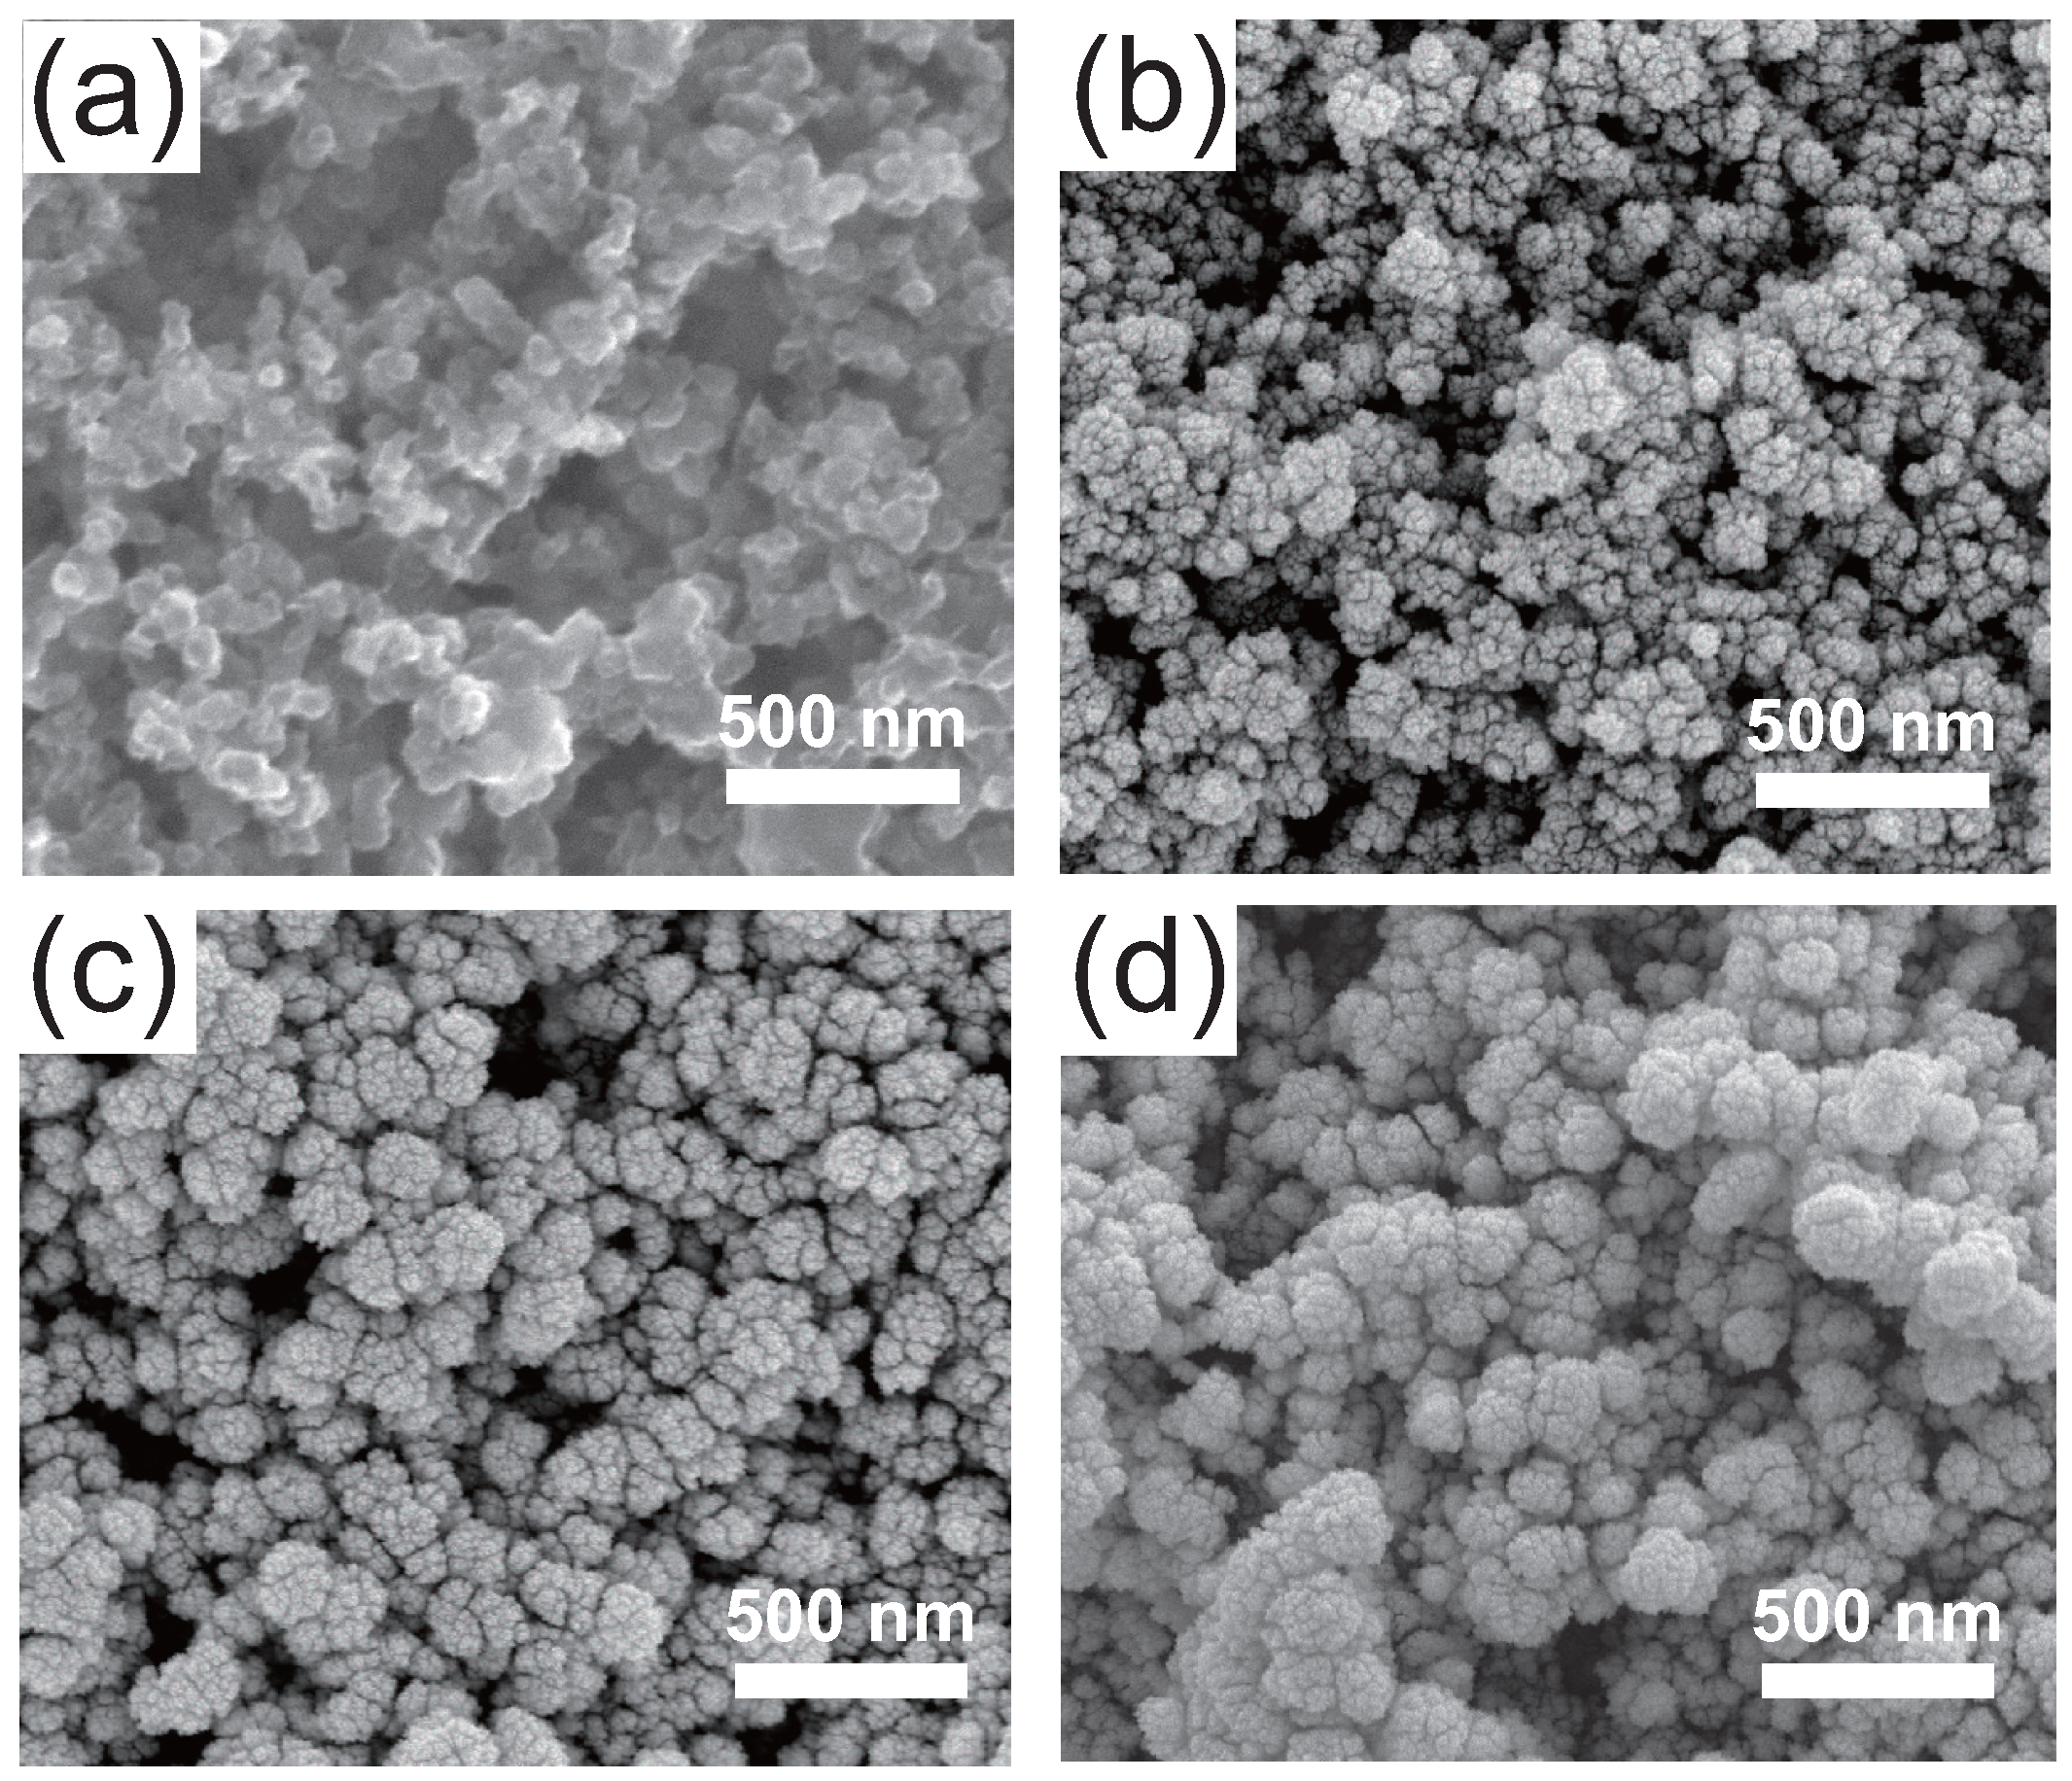
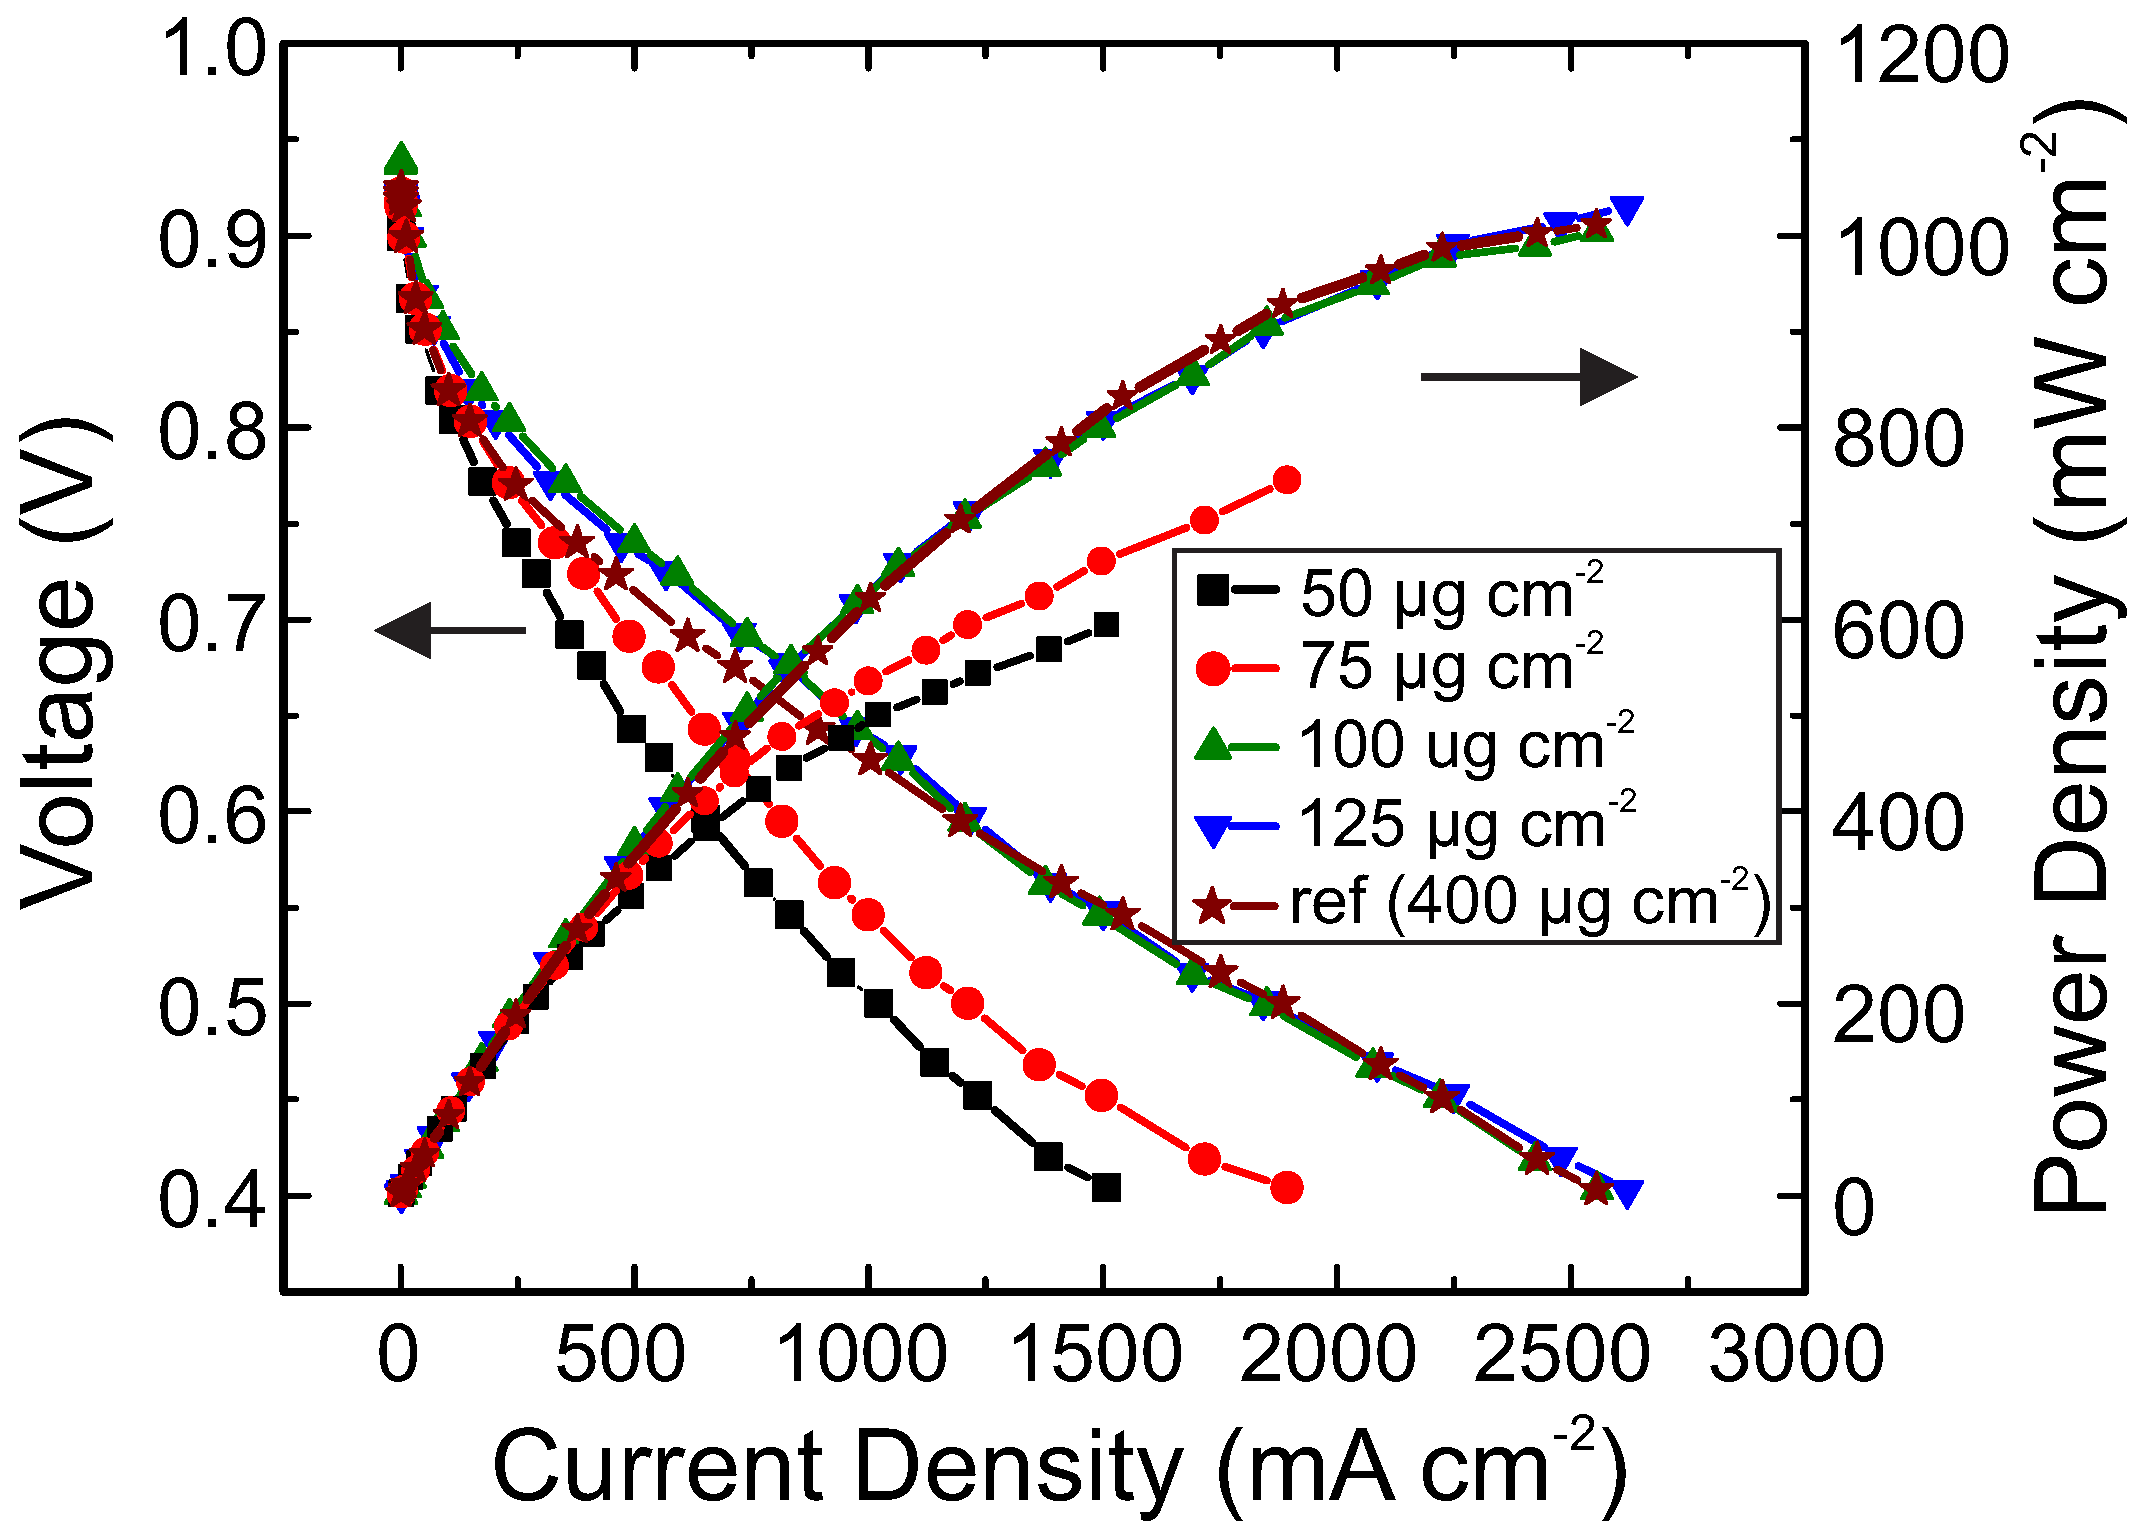
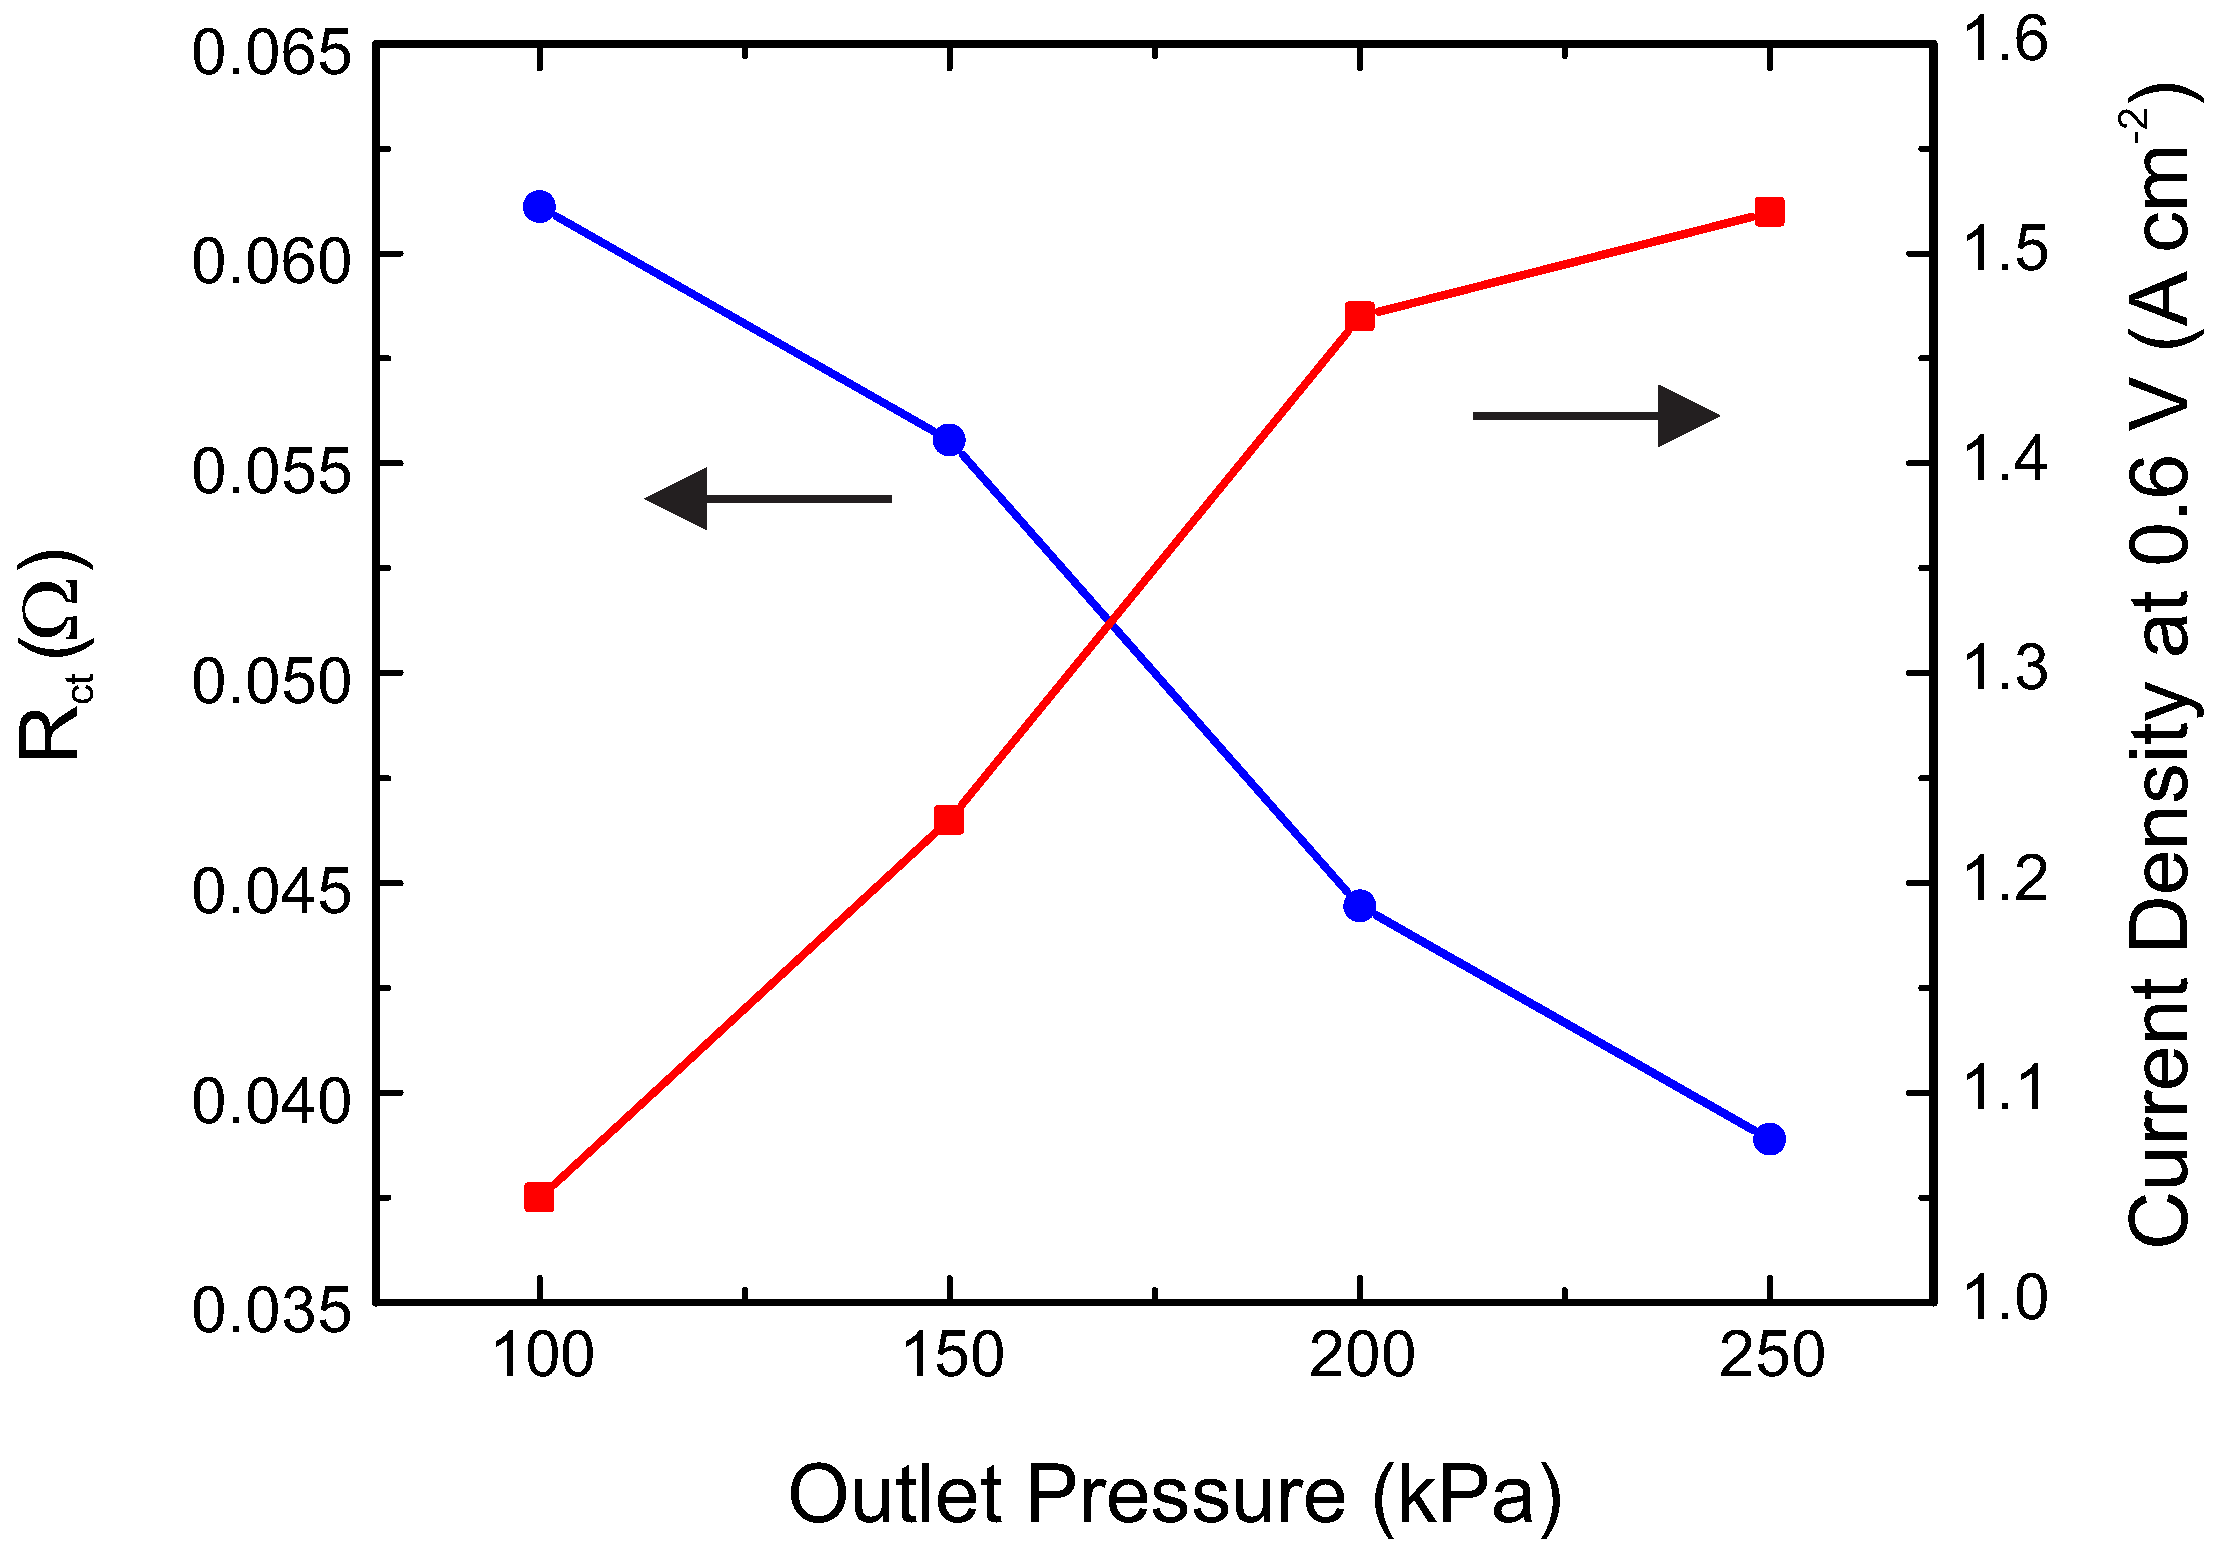
2. Results and Discussion

Figure 1 shows the transmission electron microscopy (TEM) images of Pt catalyst deposited on GDL with various Pt loadings. It was found that the average particle diameter increased from 2.7 nm to 5.0 nm with increasing Pt loading from 50 μ g·cm 2 to 125 μ g·cm 2 . This could be ascribed to the presence of free Pt atoms remaining when the ablation plume reaches the substrate. The free atoms in later laser shots could attach to the Pt nanoparticles deposited by earlier laser shots, thereby increasing the average particle size. This effect could also contribute to the reduction of mass-specific electrochemical surface area (MSECSA) with increasing Pt loading shown later. For the case of 100 μ g·cm 2 , the particle diameter was 4.9 ± 0.4 nm. This number obtained from TEM measurement was consistent with that retrieved from X-ray diffraction measurement as reported previously [11].
Figure 2 shows the scanning electron microscopy (SEM) images of the surface of the GDLs with various Pt loadings. The deposited Pt did not form a flat film because of the high porosity of the GDL. With a Pt loading of 75 μ g·cm 2 , the deposited nanoparticles were uniformly dispersed on the surface of the underlying nanoporous support. With a Pt loading of 100 μ g·cm 2 , Pt nanoparticles aggregated to form small clusters, leading to decreased porosity as compared with the 75 μ g·cm 2 sample. With a Pt loading of 125 μ g·cm 2 , aggregation was even more severe, resulting in large clusters. In addition, the voids between Pt nanoparticles became smaller, presumably due to the deposition of free atoms in the ablation plume [11]. The formation of large clusters and the decrease in porosity at higher Pt loadings resulted in reduction of specific surface area, which had a negative effect on fuel cell performance.
Figure 3 shows the cyclic voltammograms (CV) recorded for PLD samples with various Pt loadings. The peaks of hydrogen adsorption/desorption in the potential region of 0 to 0.4 V vs. normal hydrogen electrode (NHE) can be seen clearly. The hydrogen desorption region was integrated to calculate ECSA. It was found that the ECSA increased from 1.118 to 1.631 m 2 when the Pt loading was increased from 50 to 125 μ g·cm 2 , but with a trend of saturation. To relate the surface area of the catalyst with the mass-specific power density of the fuel cell, MSECSA was calculated as the ECSA divided by the Pt loading. The MSECSA was found to be 22.37, 17.32, 16.25, and 13.05 m 2 ·g 1 for 50, 75, 100, and 125 μ g·cm 2 Pt loadings, respectively. A decrease in MSECSA with increasing loading was observed. In an ideal case when the Pt particles are distributed in single layer and their sizes are independent of Pt loading, the MSECSA should be constant for all Pt loadings. However, due to the increase of the degree of Pt particle aggregation and the decrease in porosity as shown in Figure 2, MSECSA decreased with increasing Pt loading. This result is consistent with the findings of Fabbri et al. [14]. They attributed the decrease in MSECSA to a transition of dispersed nanoparticles into aggregates and then to an extended layer with increasing Pt loading.
Figure 4 shows the J-V and power density curves of PEM fuel cells with various Pt loadings on the cathode prepared using PLD. The anode was E-TEK Pt/C with a Pt loading of 200 μ g·cm 2 . The fuel cells with Pt loadings of 50 and 75 μ g·cm 2 showed poor performance compared to the cell with commercial E-TEK Pt/C. This can be ascribed to insufficient Pt available for electrochemical reactions. Since the oxygen reduction reaction is sluggish in nature, the cathode requires a higher Pt content to attain a high reaction rate. With a Pt loading of 100 μ g·cm 2 the current density at 0.6 V reached 1205 mA·cm 2 , corresponding to a power density of 723 mW·cm 2 and a cathode MSPD of 7.3 kW·g 1 . The cathode MSPD of the reference E-TEK sample at 0.6 V was 1.7 kW·g 1 . The cathode MSPD at 0.6 V was by a factor of four higher than that of the reference sample using E-TEK Pt/C with a Pt loading of 400 μ g·cm 2 . The power densities at 0.6 V for various cases are shown in Table 1. The cathode prepared by PLD with a Pt loading of 100 μ g·cm 2 had only one fourth of the Pt loading of the commercial E-TEK sample but showed similar power generation. The power density for the fuel cell with a cathode loading of 125 μ g·cm 2 was close to that of the fuel cell with a cathode loading of 100 μ g·cm 2 . The saturation in power density with increasing Pt loading can be attributed to the saturation in ECSA (as discussed earlier in CV results). It may also result from mass transport limitation occurring in the catalyst layer due to the increased degree of aggregation of nanoparticles and the reduced porosity with increasing Pt loading (see Figure 2).
The resistance of a fuel cell is one of the key parameters that significantly affect the cell performance. To determine the magnitudes of the resistances, electrochemical impedance spectroscopy was used to measure the ohmic resistance (R Ω ) and charge transfer resistance (R c t ) of the cells with different Pt loadings. Figure 5 shows the in situ impedance response of the fuel cells in the form of Nyquist plots at 0.8 V for various Pt loadings. Only one semi-circle is observed in the Nyquist plot as the electrode process is dominated by the ORR at low current densities [15]. The high-frequency intercept on the real axis indicates the total ohmic resistance (R Ω ) of the fuel cell. The diameter of the arc is a measure of the charge transfer resistance of the ORR (R c t ) [15]. It can be seen that all samples had very similar ohmic resistance, which was expected since the deposition condition, membrane, GDL, and fuel cell hardware were the same in all of these cases. In contrast, the charge transfer resistance decreased with increasing Pt loading. This can be expected from the increase of ECSA with increasing Pt loading, which should result in larger total charge transfer rate and thus lower charge transfer resistance. The dependence of R c t on Pt loading is consistent with that of fuel cell performance shown in Figure 4: the lower the resistance, the higher the fuel cell performance.
The cell outlet pressure is also an important parameter in the operation of a PEM fuel cell. Increasing the outlet pressure can positively affect the fuel cell performance by enhancing the ORR kinetics through increasing gas concentration and mass transport rate in the catalyst layer [16,17]. Figure 6 shows the J-V and power density curves of a PEM fuel cell with various outlet pressures. The cathode with a Pt loading of 100 μ g·cm 2 was prepared by using PLD, and commercial E-TEK Pt/C electrode with a Pt loading of 200 μ g·cm 2 was used for the anode. As can be seen, increasing outlet pressure raised the fuel cell performance. Figure 7 shows the current density at 0.6 V as a function of outlet pressure. The current density at 0.6 V increased with increasing outlet pressure. Figure 7 also shows R c t measured with electrochemical impedance spectroscopy at various outlet pressures. R c t decreased with increasing outlet pressure, indicating that an increase in outlet pressure can speed up the ORR kinetics and thus effectively enhance fuel cell performance.
Figure 8 shows the J-V and power density curves of a PEM fuel cell having both electrodes prepared by PLD with an anode Pt loading of 17 μ g·cm 2 and a cathode Pt loading of 100 μ g·cm 2 . The results for a cell using E-TEK Pt/C at an anode Pt loading of 200 μ g·cm 2 and a cathode Pt loading of 400 μ g·cm 2 under the same operating conditions are also shown for comparison. The current density at 0.6 V of the PLD-prepared fuel cell with an outlet pressure of 100 kPa was 1092 mA·cm 2 , which was about the same as that of a cell using E-TEK Pt/C with a total Pt loading of 600 μ g·cm 2 . This shows that electrodes fabricated by using PLD can achieve higher Pt utilization. The beneficial effect of increasing outlet pressure on fuel cell performance is also shown in Figure 8. At an outlet pressure of 200 kPa, the current density at 0.6 V was increased to 1450 mA·cm 2 . This corresponds to an overall MSPD at 0.6 V of 7.43 kW·g 1 , which is higher than that of a cell using E-TEK Pt/C by a factor of five.
For comparison, Table 2 provides a partial summary of mass-specific power densities reported previously. Some previous works achieved high cathode mass-specific power density by using sputtering or PLD, corresponding to high Pt utilization [2,8], but their current density and power density are too low to be practically useful. The need to use a fuel cell with a larger area in order to attain the required current and power for practical application will raise the cost of other parts of fuel cells, occupy a larger space, and consume more power when installed on an automotive. To the best of our knowledge, the mass-specific power density obtained in the present work, using PLD, is the highest among all works that used pure Pt catalyst on this sort of carbon support with practically useful current density.
Besides the significant enhancement in the MSPD of the MEAs prepared by using PLD as compared to E-TEK Pt/C, from the prospective of mass production, the use of PLD to produce the catalyst layers is a single-step dry process in which Pt from its simplest form as a metal block is directly transferred onto GDL to form the end catalyst/support film. In contrast, the conventional ink process requires several wet chemical synthesis steps to reach the end product. In addition to being more tedious, a significant amount of Pt could be lost in these processes. Contrarily, with PLD, there is practically no loss of Pt [11]. In addition, the use of PLD allows for precise control over the size of Pt particles and the thickness of the deposited film, which is important in good manufacturing quality control for achieving high catalytic activity [24]. However, PLD has some potential drawbacks such as the requirement of a vacuum system and a longer process time, which have to be circumvented for mass production.
From a structural viewpoint, the catalyst layers prepared using PLD are at least 10 times thinner than that produced using the conventional ink process. The sub-micrometer thickness of the catalyst layer translates to a short ionic resistive path length because it takes a very short distance for protons to traverse between the Nafion membrane and the catalyst surface sites. In contrast, the thick catalyst layer produced with the conventional ink process requires the application of a substantial amount of ionomer to facilitate proton transport. It has been shown that the application of Nafion in the catalyst layer has a negative effect on the fuel cell performance due to an increase in the oxygen transport resistance. Since the oxygen transport resistance increases with increasing thickness of the catalyst layer and thus the Pt loading used [25,26,27], it becomes a significant limiting factor in the case of E-TEK Pt/C slurry. On the contrary, the small thickness of the catalyst layer prepared by PLD eliminates the need of applying an ionomer solution for improving proton conduction. This is because Pt particles deposited using PLD are all on the surface of the support and thus are all close to the Nafion membrane when assembled into an MEA. The polymer electrolyte could have good contact with the deposited Pt particles. The swelling of the Nafion membrane due to the humidified environment during the operation of fuel cell [28,29] may further enhance the contact between the Pt particles and the Nafion membrane. These lead to the high Pt utilization efficiency compared with that using E-TEK Pt/C slurry. A similar phenomenon was also observed for 3M nanostructured thin film catalyst [27].
Another critical issue for the catalyst of a fuel cell is its stability. In our earlier work, it was found that the PLD-produced catalyst with a low Pt loading of 17 μ g·cm 2 exhibits much higher durability than E-TEK Pt/C. However, this characteristic may not be translatable to the case of high Pt loading such as 100 μ g·cm 2 used in this work because, in the case of high Pt loading, the Pt nanoparticles form a porous Pt film on top of the carbon support, whereas in the case of low Pt loading, the Pt nanoparticles are dispersed on the carbon support as a very thin overlayer. To investigate the electrochemical stability of the catalyst with high Pt loading, an accelerated degradation test (ADT) was performed. Figure 9 shows the cyclic voltammograms of the PLD sample with 100 μ g·cm 2 Pt loading before and after 5000 potential cycles. The inset shows the MSECSA as a function of cycling number. An MSECSA retention of 72% was observed after 5000 potential cycles, much better than the mere 11% MSECSA retention for the case of E-TEK Pt/C (shown in Ref. [11]). This indicates that the PLD-prepared electrode exhibits a much higher durability than E-TEK Pt/C for both the cases of high Pt loading and low Pt loading. The higher durability could be ascribed to the much higher degree of graphitization of the GDL used than the carbon black in E-TEK Pt/C [11].

3. Materials and Methods

3.1. Catalyst Preparation

Pulsed laser deposition in Ar atmosphere was used to deposit Pt catalyst onto GDLs [30]. The PLD target used was a Pt disk (purity > 99.99%) with 10-mm diameter and 5-mm thickness. An Nd:YAG laser beam of 355-nm wavelength, 8-ns pulse duration, p-polarization, and 10-Hz repetition rate (PRO-350, Spectra-Physics, Santa Clara, CA, USA) was focused on the target with an incidence angle of 45 . The on-target beam size was 500 μ m in clear aperture, and the peak laser fluence was 230 J·cm 2 . The substrate for coating was a 4 cm × 4 cm carbon GDL. It was a hydrophobized gas diffusion layer (5 wt. % PTFE) with a microporous layer on the top (SIGRACET GDL24BC, SGL CARBON GmbH, Meitingen, Germany). The substrate was located in the normal direction of the target, and the target-to-substrate distance was set at 4 cm. The target and the substrate was installed in a vacuum chamber. The chamber was pumped down and then backfilled with Ar gas before deposition. The Ar pressure was fixed at 107 Pa. A calibrated quartz microbalance (SQM-160, Sigma Instruments, Cranberry Township, PA, USA) was used to measure the deposition rate. The Pt loading on a GDL was varied by changing the number of laser shots fired. It was also confirmed by weighing the GDL before and after the deposition of Pt.

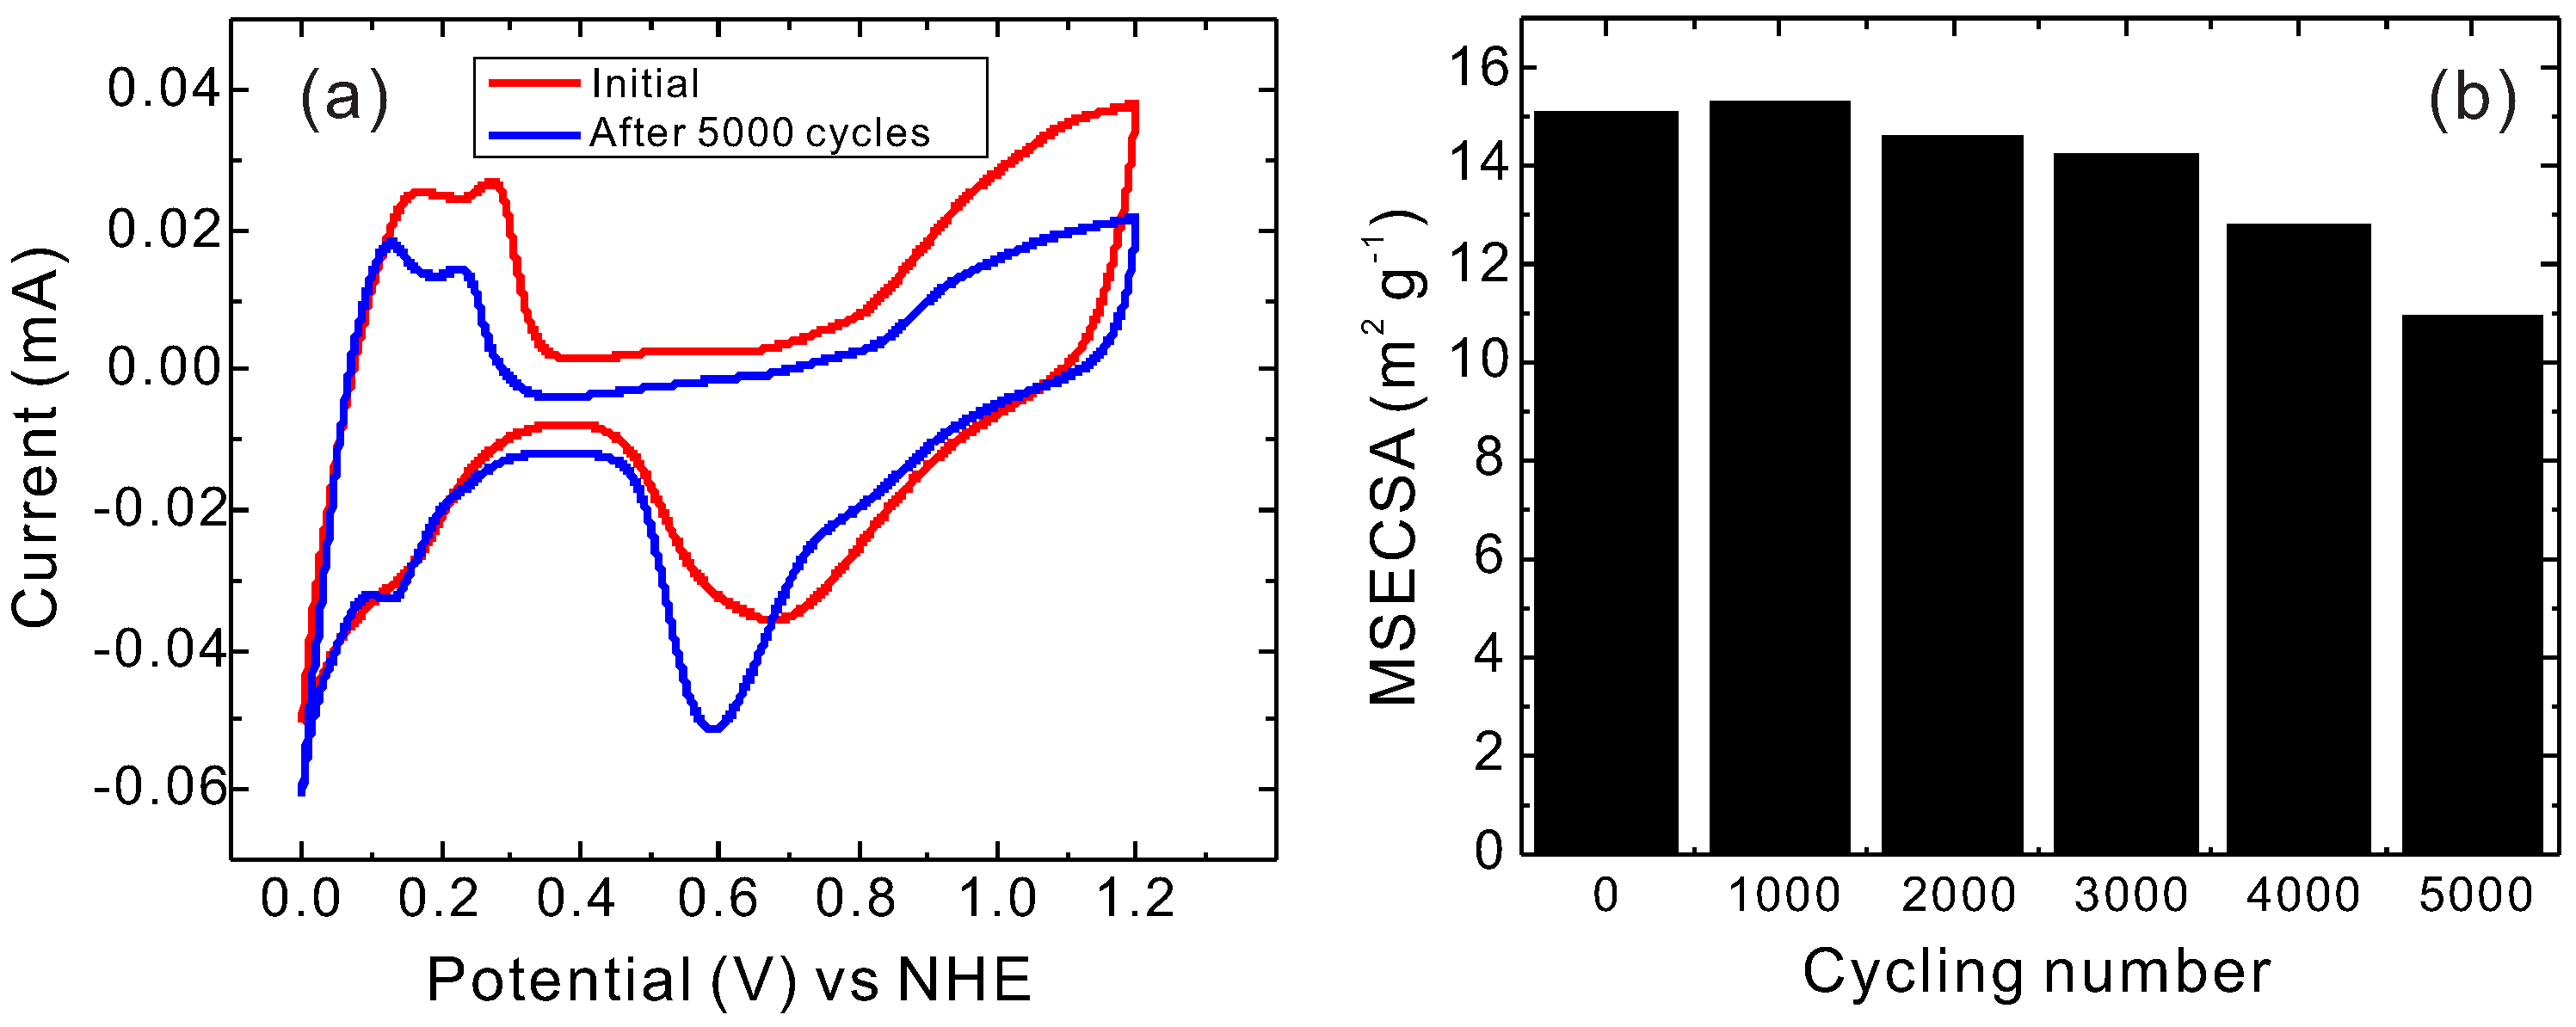
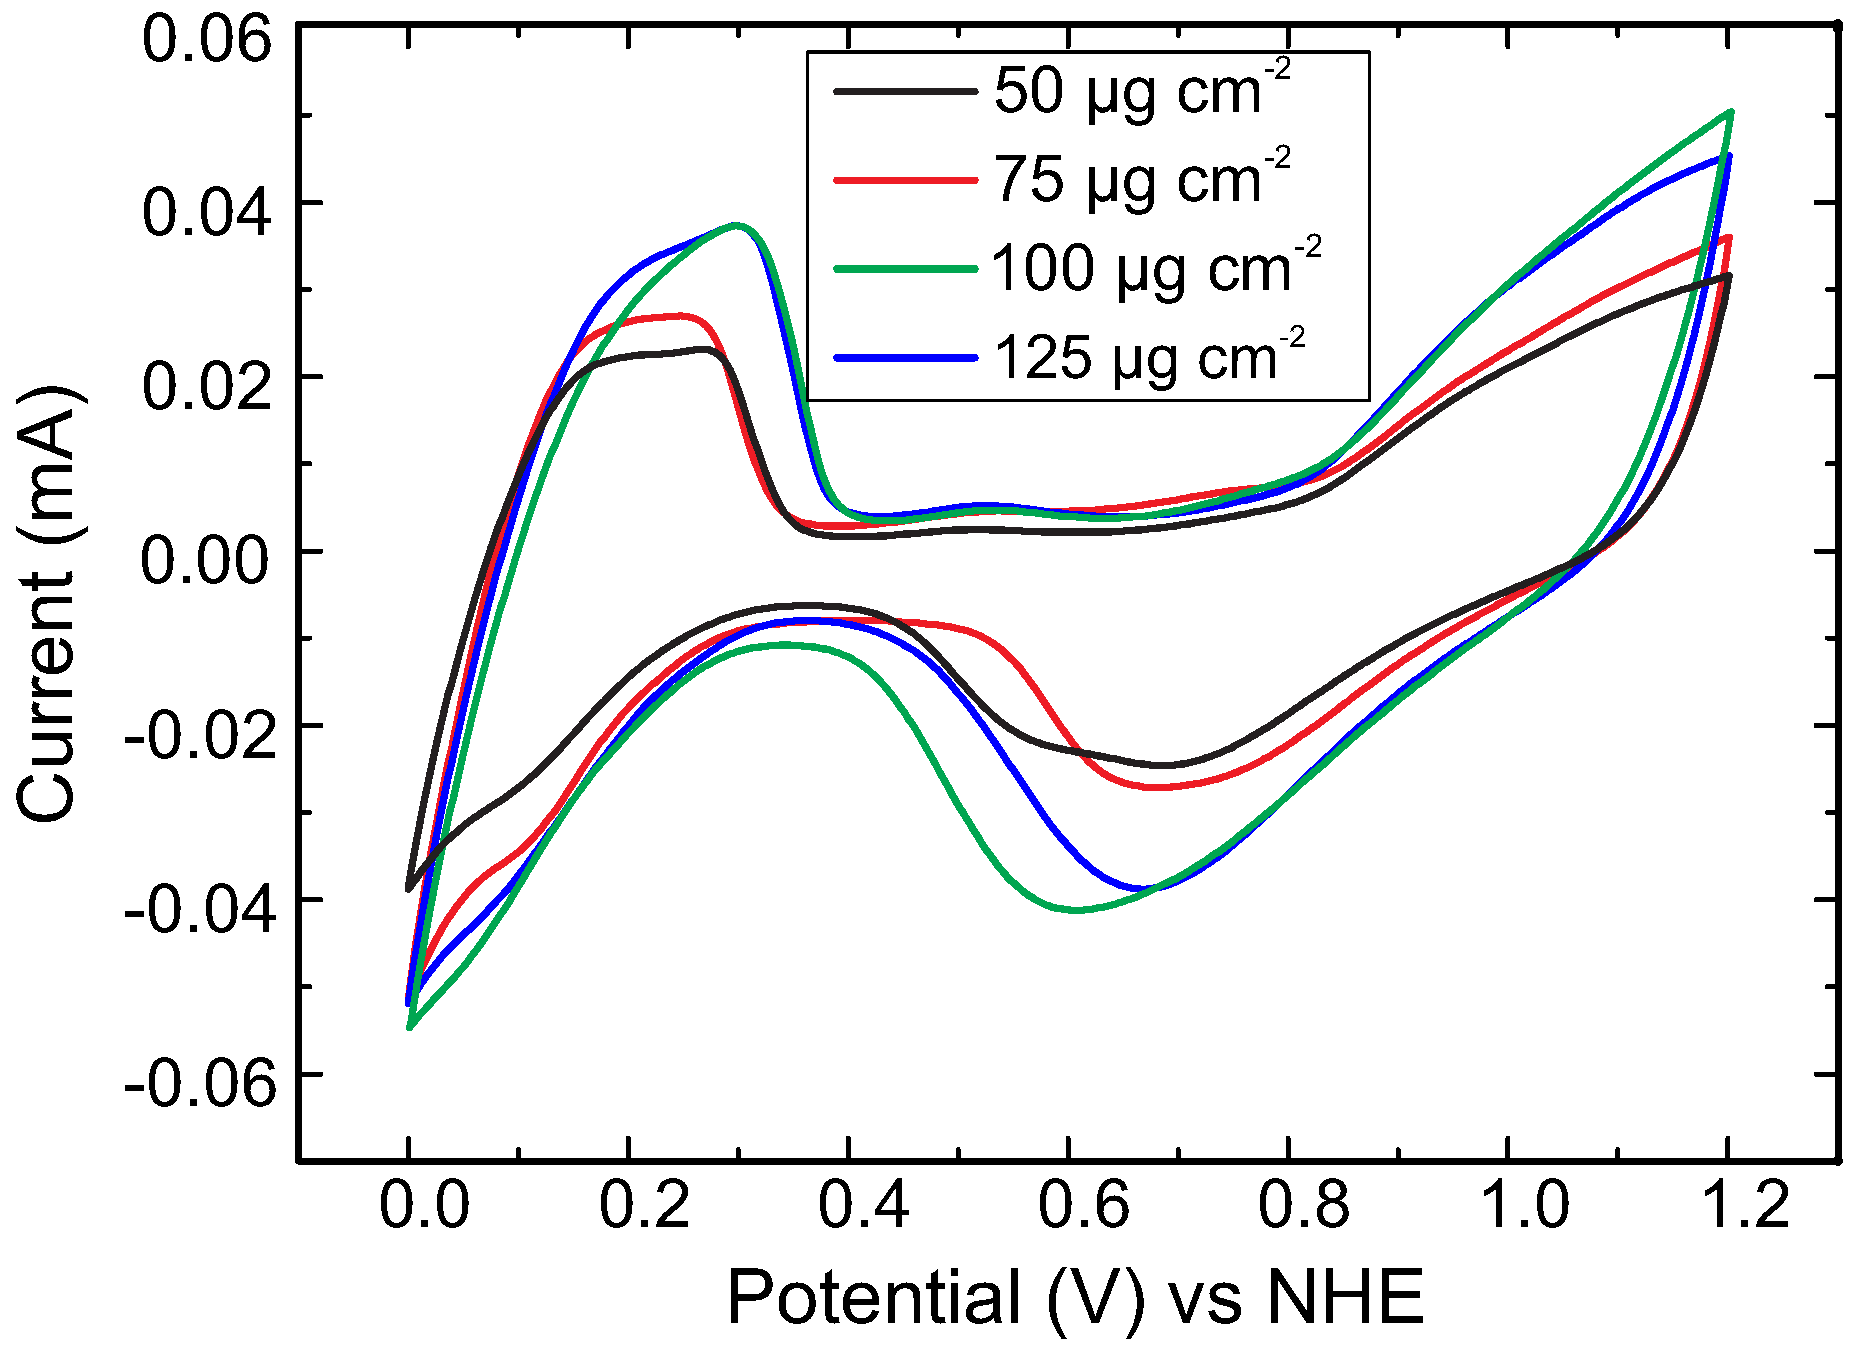
3.2. Electrochemical Measurements

For measuring the ECSA of the Pt catalyst, cyclic voltammetry was performed with a potentiostat (PGSTAT302, Metrohm Autolab, Utrecht, Netherlands) and then the hydrogen desorption region was integrated [31]. The ECSA was determined by using the formula:
E C S A = Q H Q d m ,
where Q H (in unit of mC) is the total charge obtained from the time integration of the hydrogen desorption peak in the CV curve, and Qd m , which is 0.21 mC·cm 2 , is the areal density of electron charge in the hydrogen layer when a clean Pt surface is covered by a monolayer of hydrogen atoms with 100% surface coverage. A three-electrode setup using Ag/AgCl (saturated KCl) as the reference electrode and Pt wire as the counter electrode in 0.5 M H 2 SO 4 solution was used. For this measurement, the PLD sample cut into 3 mm × 3 mm area was adhered to a glassy carbon electrode by using a carbon tape. The cyclic potentials were scanned between −0.2 and 1.0 V (vs. Ag/AgCl) at a rate of 20 mV·s 1 at room temperature. The electrolyte was purged with N 2 for 10 min before CV measurement. For investigating the electrochemical stability of the Pt-catalyst/support, an accelerated degradation test was performed by potential cycling in the potential region between the oxidation and reduction of Pt (0.5 V and 1.0 V versus Ag/AgCl, respectively) at a scan rate of 100 mV·s 1 [32].

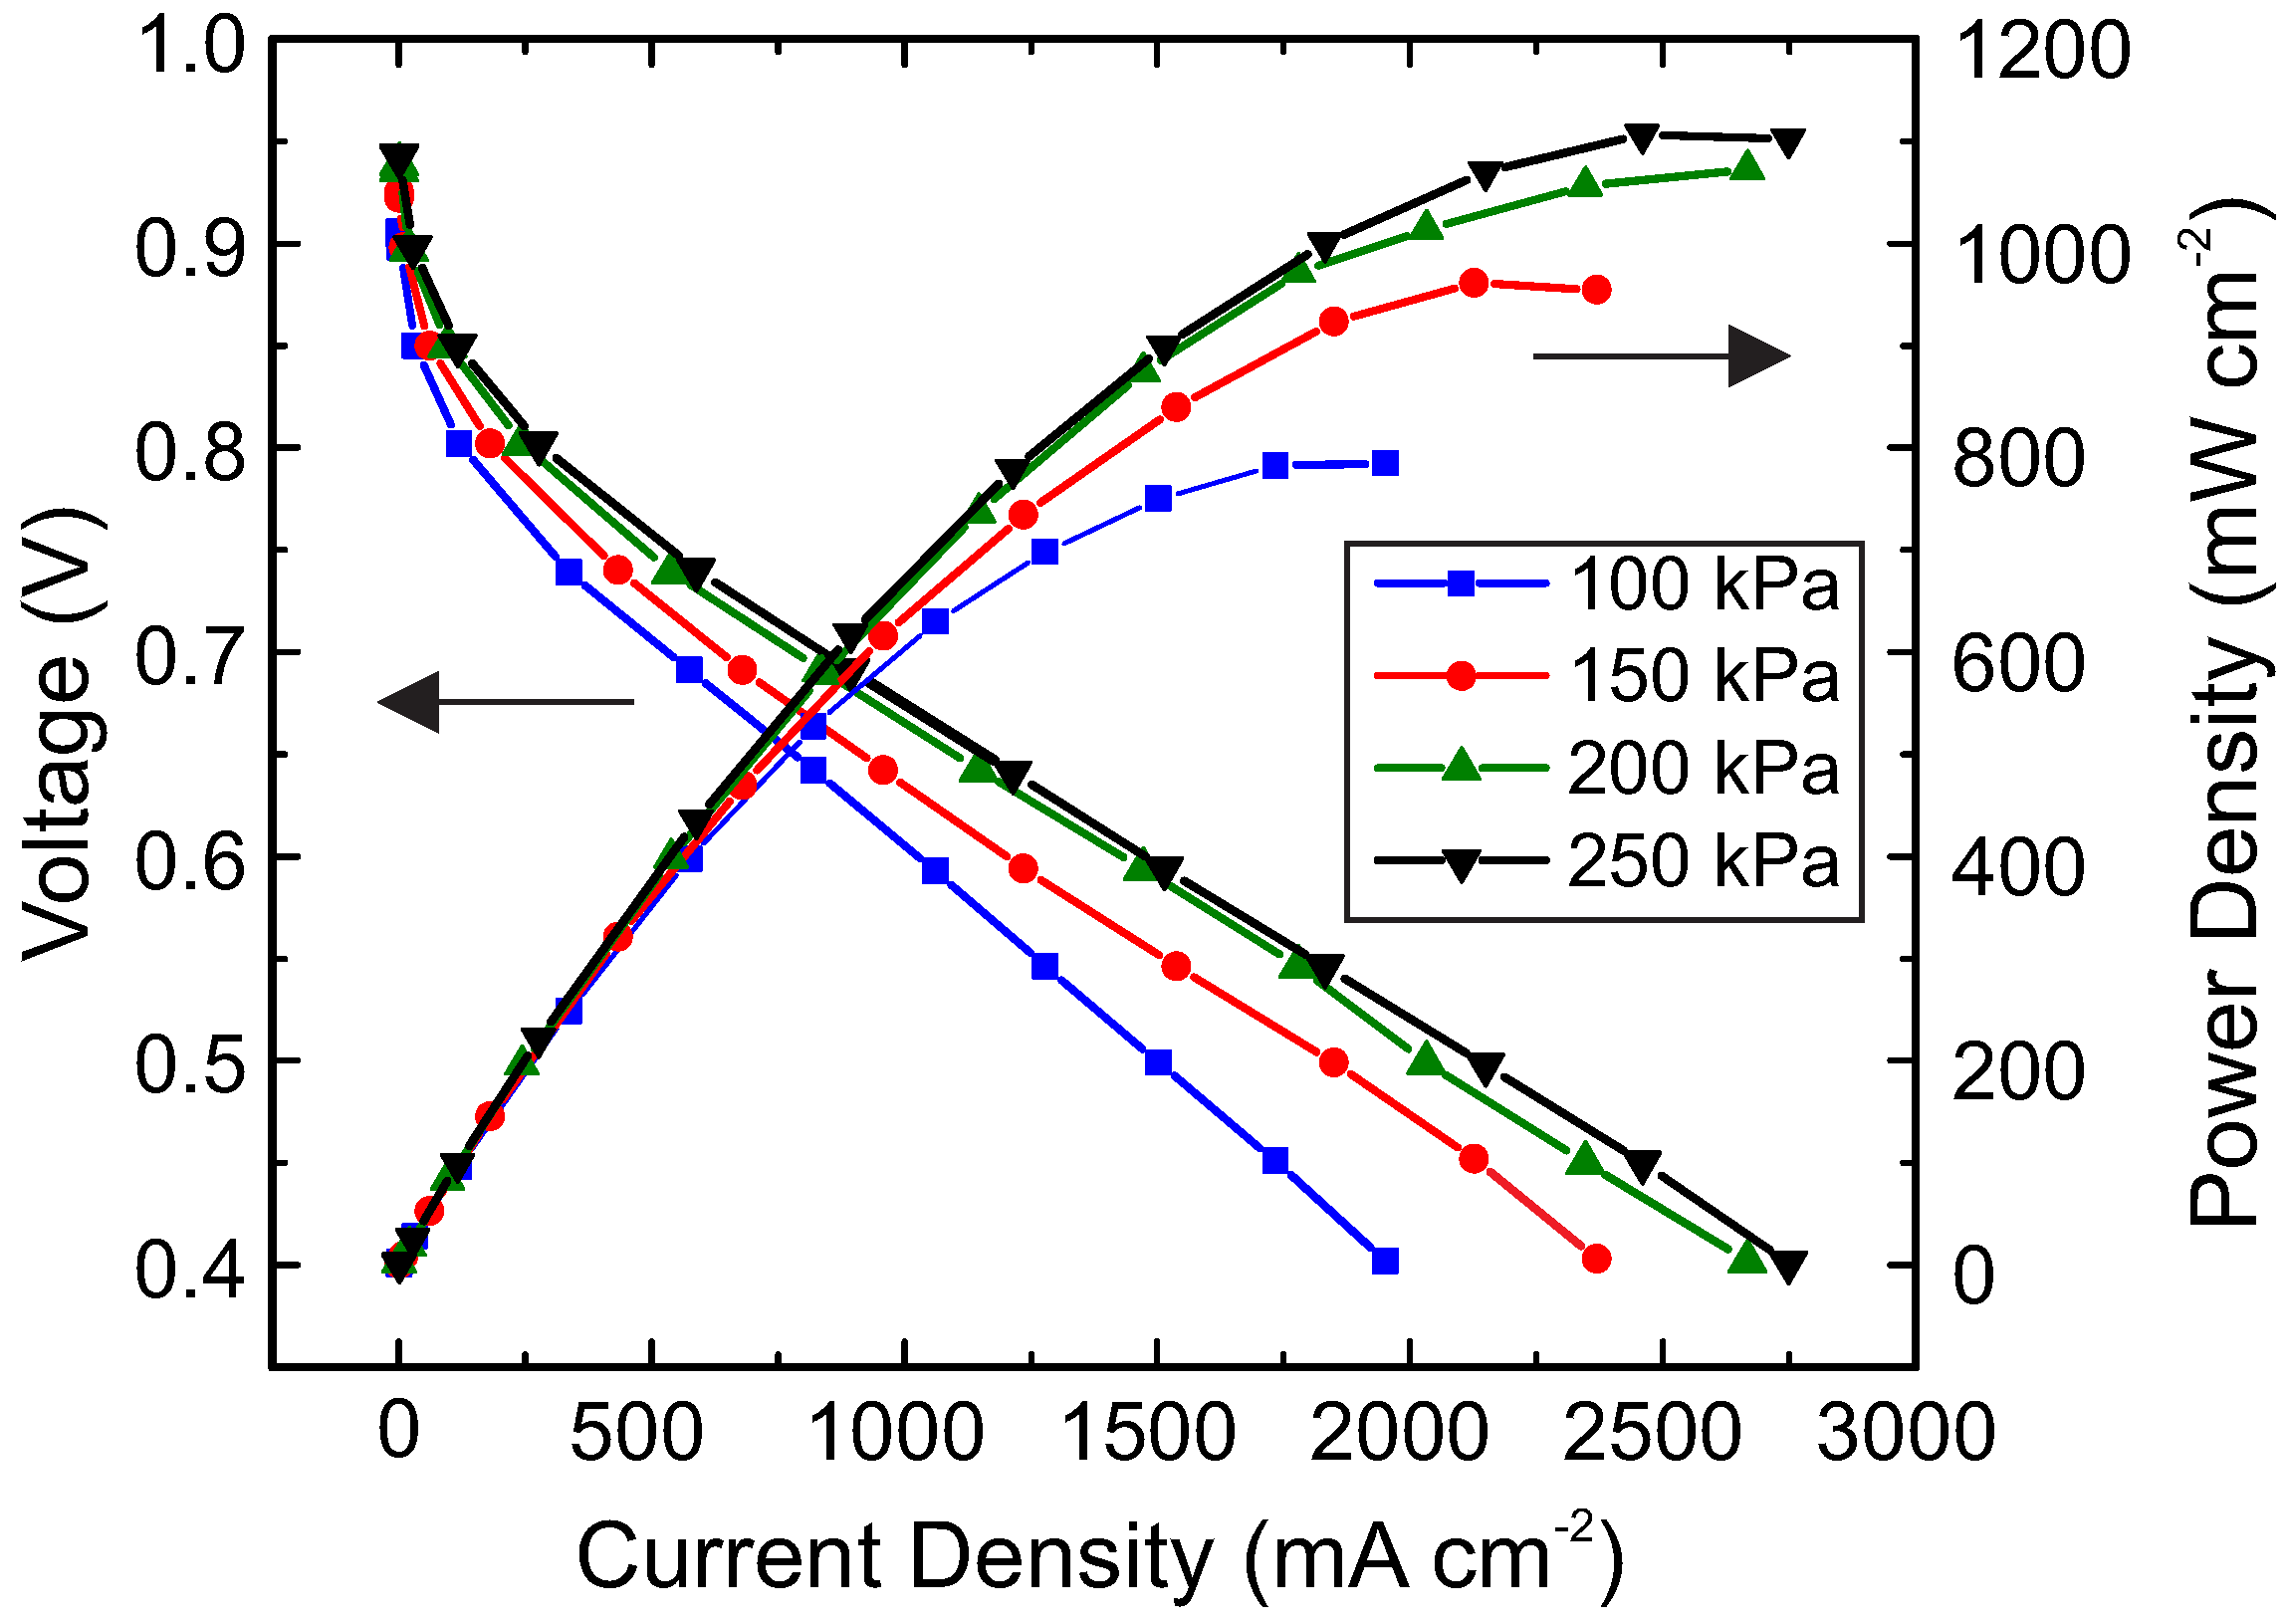
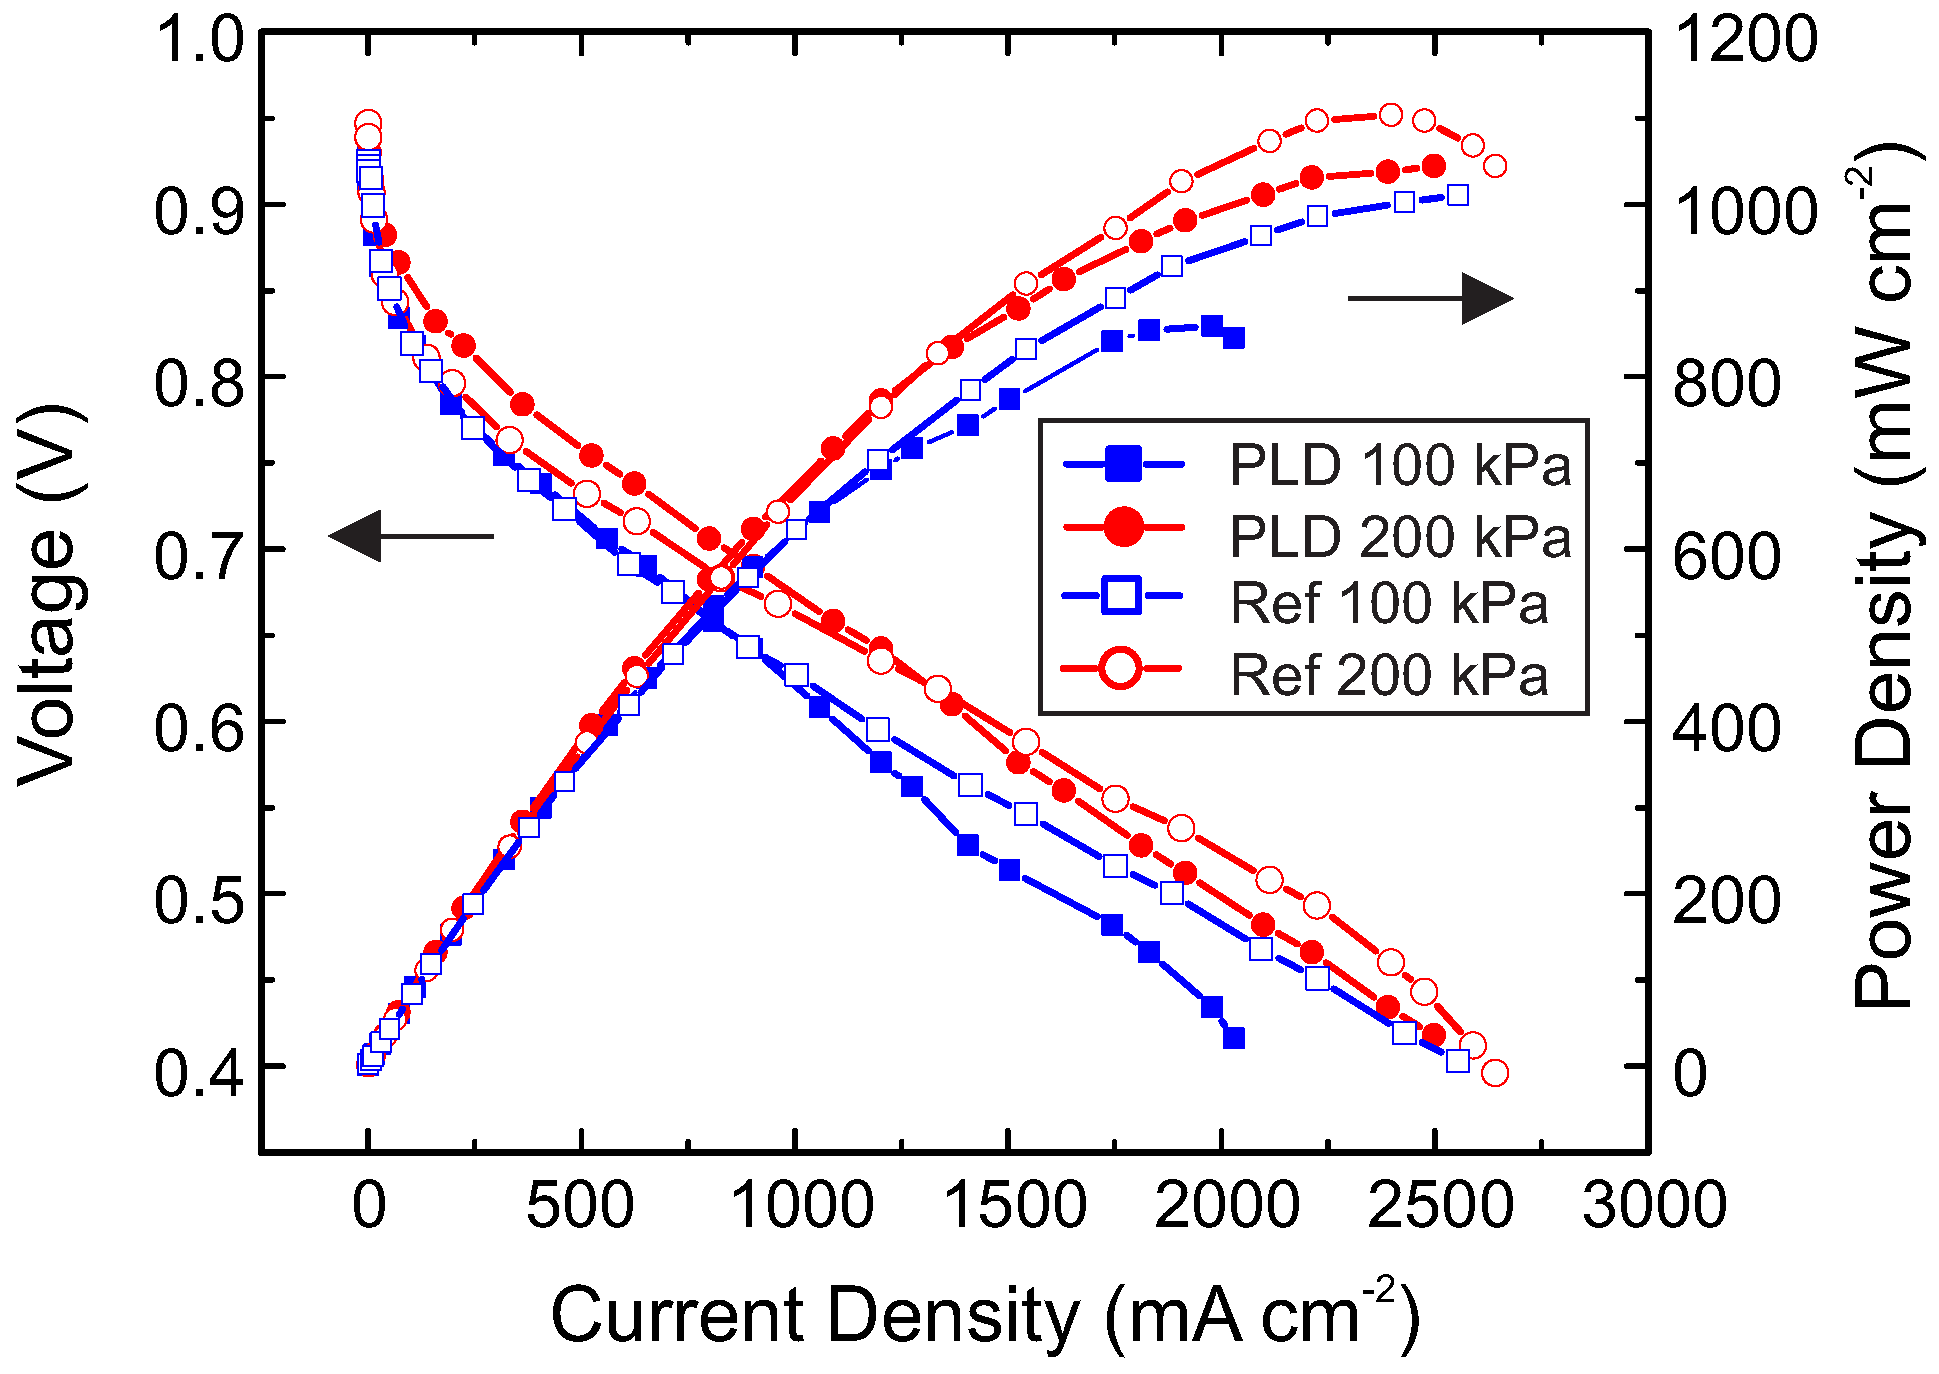
3.3. Fabrication of MEAs and Measurement of Polarization Curves

In the first part of the experiment, electrodes made by using PLD were tested on the cathode of a single PEM fuel cell, while standard E-TEK Pt/C electrode of 200 μ g·cm 2 Pt loading was used for the anode. The MEA with an active area of 3 cm × 3 cm was made by hot-pressing a GDL loaded with PLD Pt catalyst for the cathode, a Nafion XL membrane coated with E-TEK Pt/C on one side with a Pt loading of 200 μ g·cm 2 , and an unloaded GDL at 1150 kg and 135 C for 120 s. A PEM fuel cell was assembled by sandwiching the MEA with two flow-field plates which use metal foams coated with PTFE as flow distributors [33,34]. A standard fuel cell testing system was used for measuring the J-V curves of the PEM fuel cells [33]. In all fuel cell tests, pure H 2 and O 2 were used as fuel and oxidant, respectively, and they were both humidified to 100% relative humidity by using inline humidifers. The hydrogen (anode) flow rate and the oxygen (cathode) flow rate were both 450 sccm. The outlet pressures of the anode and the cathode were set to be the same and varied together. The temperatures of the cell and the humidifiers were all set to 70 C for all of the measurements done in this work. In the second part of the experiment, two different fuel cells were compared. The first one had both electrodes made by PLD with Pt loadings of 17 μ g·cm 2 and 100 μ g·cm 2 for the anode and the cathode, respectively. The second one had both electrodes using E-TEK Pt/C with Pt loadings of 200 μ g·cm 2 and 400 μg·cm 2 for the anode and the cathode, respectively. Electrochemical impedance spectroscopy was carried out in situ with a potentiostat (PGSTAT 302) installed in the fuel cell testing system at a cell potential of 0.6 V with a modulation amplitude of 5 mV and a modulation frequency of 0.1–10,000 Hz.

3.4. Morphology Characterizations

The dispersion (spatial distribution) of Pt particles on GDL was investigated with scanning electron microscopy (SEM) (Nova NanoSEM 230, FEI, Hillsboro, OR, USA). The size distribution of Pt particles was characterized with transmission electron microscopy (TEM) (JEM-2100, JEOL, Peabody, MA, USA).

4. Conclusions

In summary, production of high-performance catalyst layer with low Pt loading was achieved by using PLD. The performance of fuel cells with PLD-prepared cathodes of various Pt loadings was investigated. The fuel cell with the highest MSPD was obtained with an anode Pt loading of 17 μ g·cm 2 and a cathode Pt loading of 100 μ g·cm 2 . At an outlet pressure of 100 kPa and a cell temperature of 70 C, the PEM fuel cell was able to deliver a power density of 674 mW·cm 2 at 0.6 V, which is comparable to that of a cell using commercial E-TEK Pt/C electrodes with a total Pt loading of 600 μ g·cm 2 . Moreover, at an outlet pressure of 200 kPa, the power density reached 870 mW·cm 2 at 0.6 V, corresponding to an overall MSPD of 7.43 kW·g 1 . Such a high MSPD achieved with PLD-prepared catalyst could be ascribed to three factors: (1) the small size of the Pt nanoparticles provides a large mass-specific electrochemical surface area; (2) the very thin catalyst layer could provide shorter pathways for electron and proton transport; and (3) the good porosity of the catalyst layer could facilitate proton and gas transport.
The results reported here indicate that PLD could be a practically useful technique to deposit catalyst for PEM fuel cells. The performance of PEM fuel cells could be further raised by using other kinds of carbon support such as carbon nanotubes [35]. In addition, further reduction of Pt loading could be attained using an alloy of Pt [36,37], and the advantage offered by PLD should still hold for this case. Furthermore, the flow distributors used in this experiment were not optimised for this particular fuel cell active area yet, and thinner PEM can be used to reduce the proton transport resistance [33,34]. With the combination of pulsed laser deposition of Pt alloy, optimal carbon support, and optimal flow distributor and PEM, higher current density and power density could be achieved. Experiments are being conducted to implement these configurations.

Acknowledgments

The financial support from the Ministry of Science and Technology of Taiwan under contracts MOST-104-2112-M-001-003, MOST-104-2221-E-008-118-MY3, MOST-105-3113-F-008-003, and NSC-102-2923-E-008-002-MY3 are acknowledged.

Author Contributions

Szu-yuan Chen and Chung-Jen Tseng led the project together and contributed to this work equally. They conceived and designed the experiments. Hamza Qayyum and Ting-Wei Huang performed the experiments.

Conflicts of Interest

The authors declare no conflict of interest.

References

  1. Brouzgou, A.; Song, S.Q.; Tsiakaras, P. Low and non-platinum electrocatalysts for PEMFCs: Current status, challenges and prospects. Appl. Catal. B Environ. 2012, 127, 371–388. [Google Scholar] [CrossRef]
  2. Cuynet, S.; Caillard, A.; Lecas, T.; Bigarrè, J.; Buvat, P.; Brault, P. Deposition of Pt inside fuel cell electrodes using high power impulse magnetron sputtering. J. Phys. D Appl. Phys. 2014, 47, 272001. [Google Scholar] [CrossRef]
  3. Cavarroc, M.; Ennadjaoui, A.; Mougenot, M.; Brault, P.; Escalier, R.; Tessier, Y.; Durand, J.; Roualdès, S.; Sauvage, T.; Coutanceau, C. Performance of plasma sputtered fuel cell electrodes with ultra-low Pt loadings. Electrochem. Commun. 2009, 11, 859–861. [Google Scholar] [CrossRef]
  4. Cogenli, M.S.; Mukerjee, S.; Yurtcan, A.B. Membrane electrode assembly with ultra low platinum loading for cathode electrode of PEM fuel cell by using sputter deposition. Fuel Cells 2015, 15, 288–297. [Google Scholar] [CrossRef]
  5. Raso, M.A.; Carrillo, I.; Mora, E.; Navarro, E.; Garcia, M.A.; Leo, T.J. Electrochemical study of platinum deposited by electron beam evaporation for application as fuel cell electrodes. Int. J. Hydrog. Energy 2014, 39, 5301–5308. [Google Scholar] [CrossRef]
  6. Saha, M.S.; Gullà, A.F.; Allen, R.J.; Mukerjee, S. High performance polymer electrolyte fuel cells with ultra-low Pt loading electrodes prepared by dual ion-beam assisted deposition. Electrochim. Acta 2006, 51, 4680–4692. [Google Scholar] [CrossRef]
  7. Cunningham, N.; Irissou, E.; Lefèvre, M.; Denis, M.C.; Guay, D.; Dodelet, J.P. PEMFC anode with very low Pt loadings using pulsed laser deposition. Electrochem. Solid-State Lett. 2003, 6, A125–A128. [Google Scholar] [CrossRef]
  8. Mròz, W.; Budner, B.; Tokarz, W.; Piela, P.; Pawlowski, M.L.K. Ultra-low-loading pulsed-laser-deposited platinum catalyst films for polymer electrolyte membrane fuel cells. J. Power Sources 2015, 273, 885–893. [Google Scholar] [CrossRef]
  9. Hayre, R.O.; Lee, S.J.; Cha, S.W.; Prinz, F.B. A sharp peak in the performance of sputtered platinum fuel cells at ultra-low platinum loading. J. Power Sources 2002, 109, 483–493. [Google Scholar]
  10. Nakakubo, T.; Shibata, M.; Yasuda, K. Membrane electrode assembly for proton exchange membrane fuel cells prepared by sputter deposition in air and transfer method. J. Electrochem. Soc. 2005, 152, A2316–A2322. [Google Scholar] [CrossRef]
  11. Huang, T.W.; Qayyum, H.; Lin, G.R.; Chen, S.Y.; Tseng, C.J. Production of high-performance and improved-durability Pt-catalyst/support for proton-exchange-membrane fuel cells with pulsed laser deposition. J. Phys. D Appl. Phys. 2016, 49, 255601. [Google Scholar] [CrossRef]
  12. Riabinina, D.; Irissou, E.; Drogoff, B.L.; Chaker, M.; Guay, D. Influence of pressure on the Pt nanoparticle growth modes during pulsed laser ablation. J. Appl. Phys. 2010, 108, 034322-1–034322-6. [Google Scholar] [CrossRef]
  13. Debe, M.K. Electrocatalyst approaches and challenges for automotive fuel cells. Nature 2012, 486, 43–51. [Google Scholar] [CrossRef] [PubMed]
  14. Fabbri, E.; Taylor, S.; Rabis, A.; Levecque, P.; Conrad, O.; Kotz, R.; Schmidt, T.J. The effect of platinum nanoparticle distribution on oxygen electroreduction activity and selectivity. ChemCatChem 2014, 6, 1410–1418. [Google Scholar] [CrossRef]
  15. Yuan, X.; Wang, H.; Sun, J.C.; Zhang, J. AC impedance technique in PEM fuel cell diagnosis-A review. Int. J. Hydrog. Energy 2007, 32, 4365–4380. [Google Scholar] [CrossRef]
  16. Zhang, J.; Song, C.; Zhang, J.; Baker, R.; Zhang, L. Understanding the effects of backpressure on PEM fuel cell reactions and performance. J. Electroanal. Chem. 2013, 688, 130–136. [Google Scholar] [CrossRef]
  17. Zhang, J.; Li, H.; Zhang, J. Effect of operating backpressure on PEM fuel cell performance. ECS Trans. 2009, 19, 65–76. [Google Scholar]
  18. Onana, F.F.; Guillet, N.; AlMayouf, A.M. Modified pulse electrodeposition of Pt nanocatalyst as high-performance electrode for PEMFC. J. Power Sources 2014, 271, 401–405. [Google Scholar] [CrossRef]
  19. Yu, H.; Roller, J.M.; Mustain, W.E.; Maric, R. Influence of the ionomer/carbon ratio for low-Pt loading catalyst layer prepared by reactive spray deposition technology. J. Power Sources 2015, 283, 84–94. [Google Scholar] [CrossRef]
  20. Khan, A.; Nath, B.K.; Chutia, J. Nanopillar structured platinum with enhanced catalytic utilization for electrochemical reactions in PEMFC. Electrochim. Acta 2014, 146, 171–177. [Google Scholar] [CrossRef]
  21. Su, H.N.; Liao, S.J.; Shu, T.; Gao, H.L. Performance of an ultra-low platinum loading membrane electrode assembly prepared by a novel catalyst-sprayed membrane technique. J. Power Sources 2010, 195, 756–761. [Google Scholar] [CrossRef]
  22. Shu, T.; Dang, D.; Xu, D.W.; Chen, R.; Liao, S.J.; Hsieh, C.T.; Su, A.; Song, H.Y.; Du, L. High-performance MEA prepared by direct deposition of platinum on the gas diffusion layer using an atomic layer deposition technique. Electrochim. Acta 2015, 177, 168–173. [Google Scholar] [CrossRef]
  23. Yuan, Y.; Smith, J.A.; Goenaga, G.; Liu, D.J.; Luo, Z.; Liu, J. Platinum decorated aligned carbon nanotubes: electrocatalyst for improved performance of proton exchange membrane fuel cells. J. Power Sources 2011, 196, 6160–6167. [Google Scholar] [CrossRef]
  24. Hamel, C.; Garbarino, S.; Irissou, E.; Laplante, F.; Chaker, M.; Guay, D. Influence of the velocity of Pt ablated species on the structural and electrocatalytic properties of Pt thin films. Int. J. Hydrog. Energy 2010, 35, 8486–8493. [Google Scholar] [CrossRef]
  25. Greszler, T.A.; Caulk, D.; Sinha, P. The impact of platinum loading on oxygen transport resistance. J. Electrochem. Soc. 2012, 159, F831–F840. [Google Scholar] [CrossRef]
  26. Weber, A.Z.; Kusoglu, A. Unexplained transport resistances for low-loaded fuel-cell catalyst layers. J. Mater. Chem. A 2014, 2, 17207–17211. [Google Scholar] [CrossRef]
  27. Kongkanand, A.; Mathias, M.F. The priority and challenge of high-power performance of low-platinum proton-exchange membrane fuel cells. J. Phys. Chem. Lett. 2016, 7, 1127–1137. [Google Scholar] [CrossRef] [PubMed]
  28. Zhou, Y.; Lin, G.; Shih, A.J.; Hu, S.J. Assembly pressure and membrane swelling in PEM fuel cells. J. Power Sources 2009, 192, 544–551. [Google Scholar] [CrossRef]
  29. Bauer, F.; Denneler, S.; Willert-Porada, M. Influence of temperature and humidity on the mechanical properties of Nafion 117 polymer electrolyte membrane. J. Polym. Sci. B Polym. Phys. 2005, 43, 786–795. [Google Scholar] [CrossRef]
  30. Eason, R. Pulsed Laser Deposition of Thin Films: Applications-Led Growth of Functional Materials, 1st ed.; John Wiley and Sons, Inc.: Hoboken, NJ, USA, 2006. [Google Scholar]
  31. Rodrìguez, J.M.D.; Meliàn, J.A.H.; Peña, J.P. Determination of the real surface area of Pt electrodes by hydrogen adsorption using cyclic voltammetry. J. Chem. Educ. 2000, 77, 1195–1197. [Google Scholar] [CrossRef]
  32. Wang, X.X.; Tan, Z.H.; Zeng, M.; Wang, J.N. Carbon nanocages: A new support material for Pt catalyst with remarkably high durability. Sci. Rep. 2014, 4, 4437. [Google Scholar] [CrossRef] [PubMed]
  33. Tsai, B.T.; Tseng, C.J.; Liu, Z.S.; Wang, C.H.; Lee, C.I.; Yang, C.C.; Lo, S.K. Effects of flow field design on the performance of a PEM fuel cell with metal foam as the flow distributor. Int. J. Hydrog. Energy 2012, 37, I3060–I3066. [Google Scholar] [CrossRef]
  34. Tseng, C.J.; Tsai, B.T.; Liu, Z.S.; Cheng, T.C.; Chang, W.C.; Lo, S.K. A PEM fuel cell with metal foam as flow distributor. Energy Convers. Manag. 2012, 62, 14–21. [Google Scholar] [CrossRef]
  35. Murata, S.; Imanishi, M.; Hasegawa, S.; Namba, R. Vertically aligned carbon nanotube electrodes for high current density operating proton exchange membrane fuel cells. J. Power Sources 2014, 253, 104–113. [Google Scholar] [CrossRef]
  36. Tseng, C.J.; Lo, S.T.; Lo, S.C.; Chu, P.P. Characterization of Pt-Cu binary catalysts for oxygen reduction for fuel cell applications. Mater. Chem. Phys. 2006, 100, 385–390. [Google Scholar] [CrossRef]
  37. Su, B.J.; Wang, K.W.; Cheng, T.C.; Tseng, C.J. Preparation of PtSn/C electrocatalysts with improved activity and durability toward oxygen reduction reaction by alcohol-reduction process. Mater. Chem. Phys. 2012, 135, 395–400. [Google Scholar] [CrossRef]
Figure 1. TEM images of Pt particles deposited by PLD at 107-Pa Ar pressure on a GDL with various Pt loadings: (a) 50 μ g·cm 2 ; (b) 75 μ g·cm 2 ; (c) 100 μ g·cm 2 and (d) 125 μ g·cm 2 . The size distribution for 100 μ g·cm 2 and the dependence of particle diameter on Pt loading are shown in the bottom panels. The error bar for each case indicates the standard deviation of particle size distribution.
Catalysts 06 00180 g001
Figure 2. SEM images of Pt particles deposited by PLD at 107-Pa Ar pressure on a GDL with various Pt loadings: (a) GDL only; (b) 75 μ g·cm 2 ; (c) 100 μ g·cm 2 ; and (d) 125 μ g·cm 2 .
Catalysts 06 00180 g002
Figure 3. Cyclic voltammograms of PLD samples with various Pt loadings recorded in 0.5 M H 2 SO 4 solution at a scan rate of 20 mV·s 1 .
Catalysts 06 00180 g003
Figure 4. J-V and power density curves of PEM fuel cells having the cathode deposited by PLD with various Pt loadings. The performance of a PEM fuel cell using E-TEK Pt/C for the cathode with a Pt loading of 400 μ g·cm 2 is shown for comparison. All data were measured at an outlet pressure of 100 kPa.
Catalysts 06 00180 g004
Figure 5. Electrochemical impedance spectroscopy curves of PEM fuel cells with various Pt loadings at the cathode at a cell voltage of 0.8 V. The inset shows the charge-transfer resistance and ohmic resistance as functions of Pt loading.
Catalysts 06 00180 g005
Figure 6. J-V and power density curves of a PEM fuel cell with various outlet pressures. The cathode was deposited by using PLD with a Pt loading of 100 μ g·cm 2 .
Catalysts 06 00180 g006
Figure 7. Current density at a cell voltage of 0.6 V and charge transfer resistance at a cell voltage of 0.8 V as functions of outlet pressure.
Catalysts 06 00180 g007
Figure 8. J-V and power density curves of a PEM fuel cell having both electrodes prepared by PLD with an anode Pt loading of 17 μ g·cm 2 and a cathode Pt loading of 100 μ g·cm 2 for various outlet pressures. The results using E-TEK Pt/C electrodes with an anode Pt loading of 200 μ g·cm 2 and a cathode Pt loading of 400 μ g·cm 2 under the same operating conditions are shown for comparison.
Catalysts 06 00180 g008
Figure 9. (a) cyclic voltammograms of PLD sample with 100 μ g·cm 2 Pt loading before and after 5000 potential cycles; (b) MSECSA as a function of cycling number.
Catalysts 06 00180 g009
Table 1. Performance of PEM fuel cells using cathode catalyst prepared by PLD with various Pt loadings in comparison to that using E-TEK Pt/C with a Pt loading of 400 μ g·cm 2 .
Cathode Catalyst Deposition MethodAnode Pt Loading * ( μ g·cm 2 )Cathode Pt Loading ( μ g·cm 2 )Current Density at 0.6 V (mA·cm 2 )Power Density at 0.6 V (mW·cm 2 )Cathode MSPD (kW·g 1 )
PLD200506503907.8
200758204906.5
20010012057237.3
20012512167295.8
E-TEK20040011907101.7
* The anodes of all samples use E-TEK Pt/C.
Table 2. Comparison of PEM fuel cells with catalyst fabricated by various deposition techniques. O 2 was used for the cathode in all cases.
Deposition TechniquePt Loading Anode/Cathode ( μ g·cm 2 )Operating Condition ( C/kPa)Current Density at 0.6 V (mA·cm 2 )Overall MSPD at 0.6 V (kW·g 1 )Reference
Pulsed electrodeposition400/12080/25014001.61[18]
Reactive spray deposition75/7580/18014006.00[19]
DC magnetron sputtering50/10070/1008003.28[20]
Electrospray40/12070/20012004.50[21]
Sputtering100/6080/1004901.83[4]
Impulse sputtering20/2070/3004006.00[2]
Atomic layer deposition180/50080/10014001.20[22]
Pulsed laser deposition-/780/240100-[8]
Chemical vapor deposition200/20080/10011001.65[23]
This work17/10070/20014507.43

