
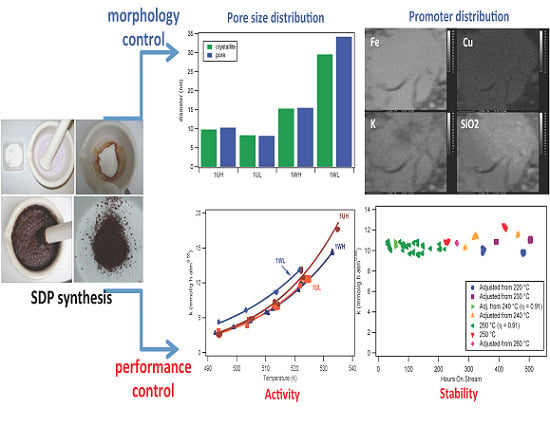
Iron Fischer-Tropsch Catalysts Prepared by Solvent-Deficient Precipitation (SDP): Effects of Washing, Promoter Addition Step, and Drying Temperature

Abstract
:
1. Introduction
2. Results and Discussion
2.1. Catalyst Characterizations
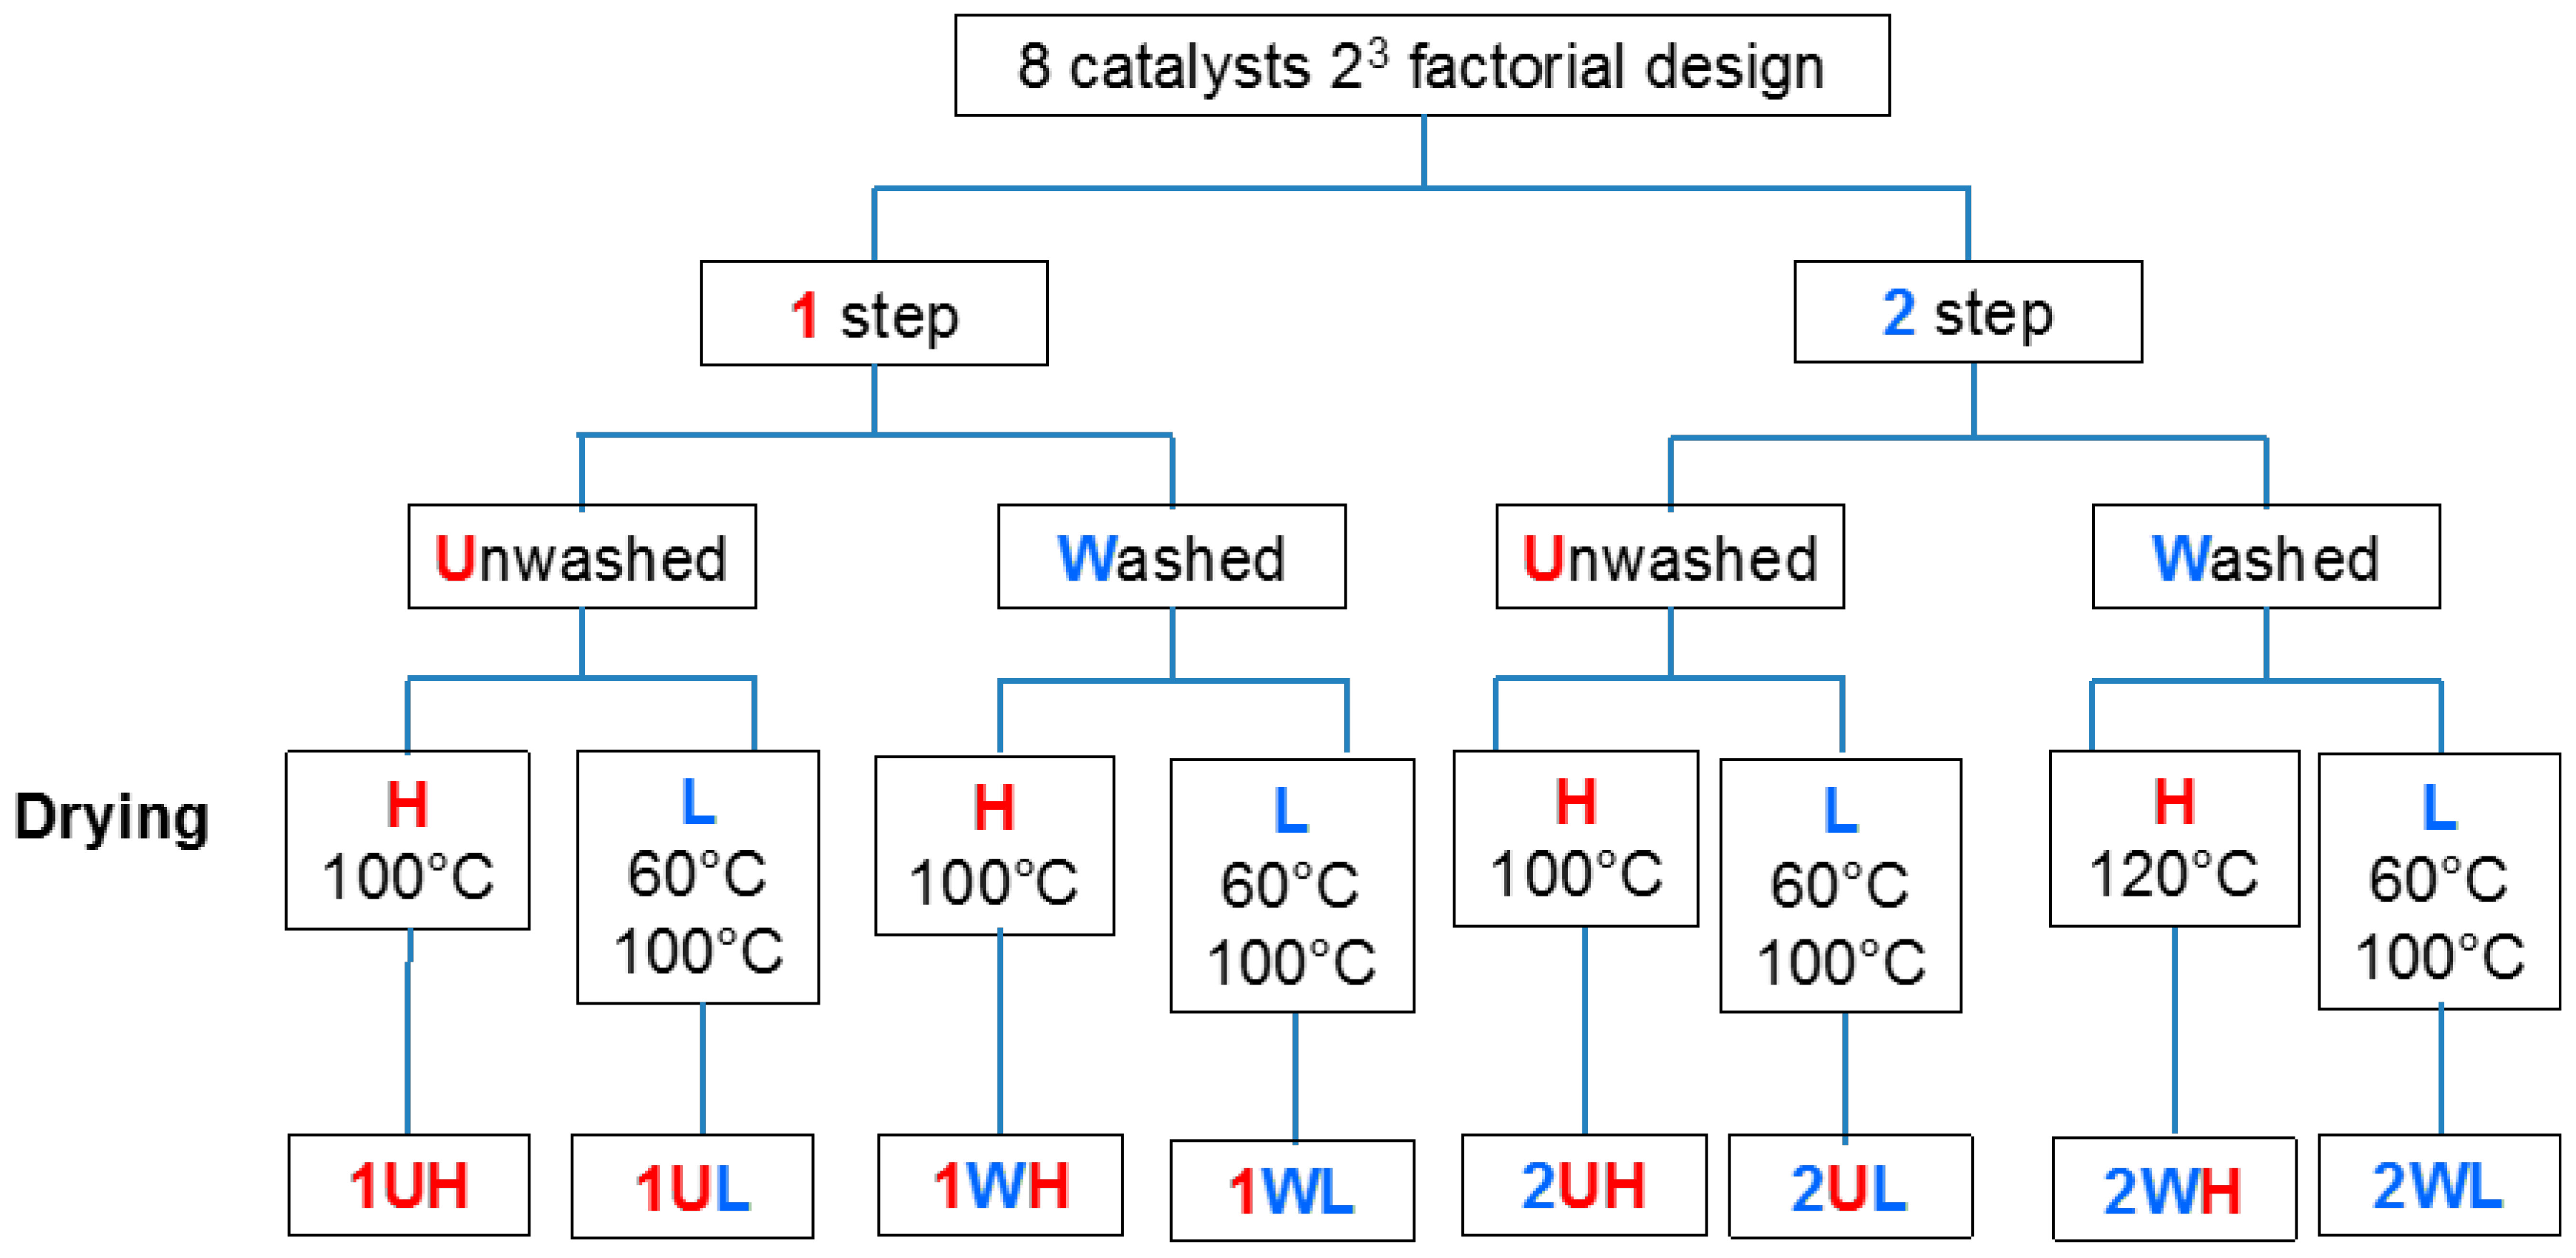
2.1.1. Catalyst Nomenclature Description

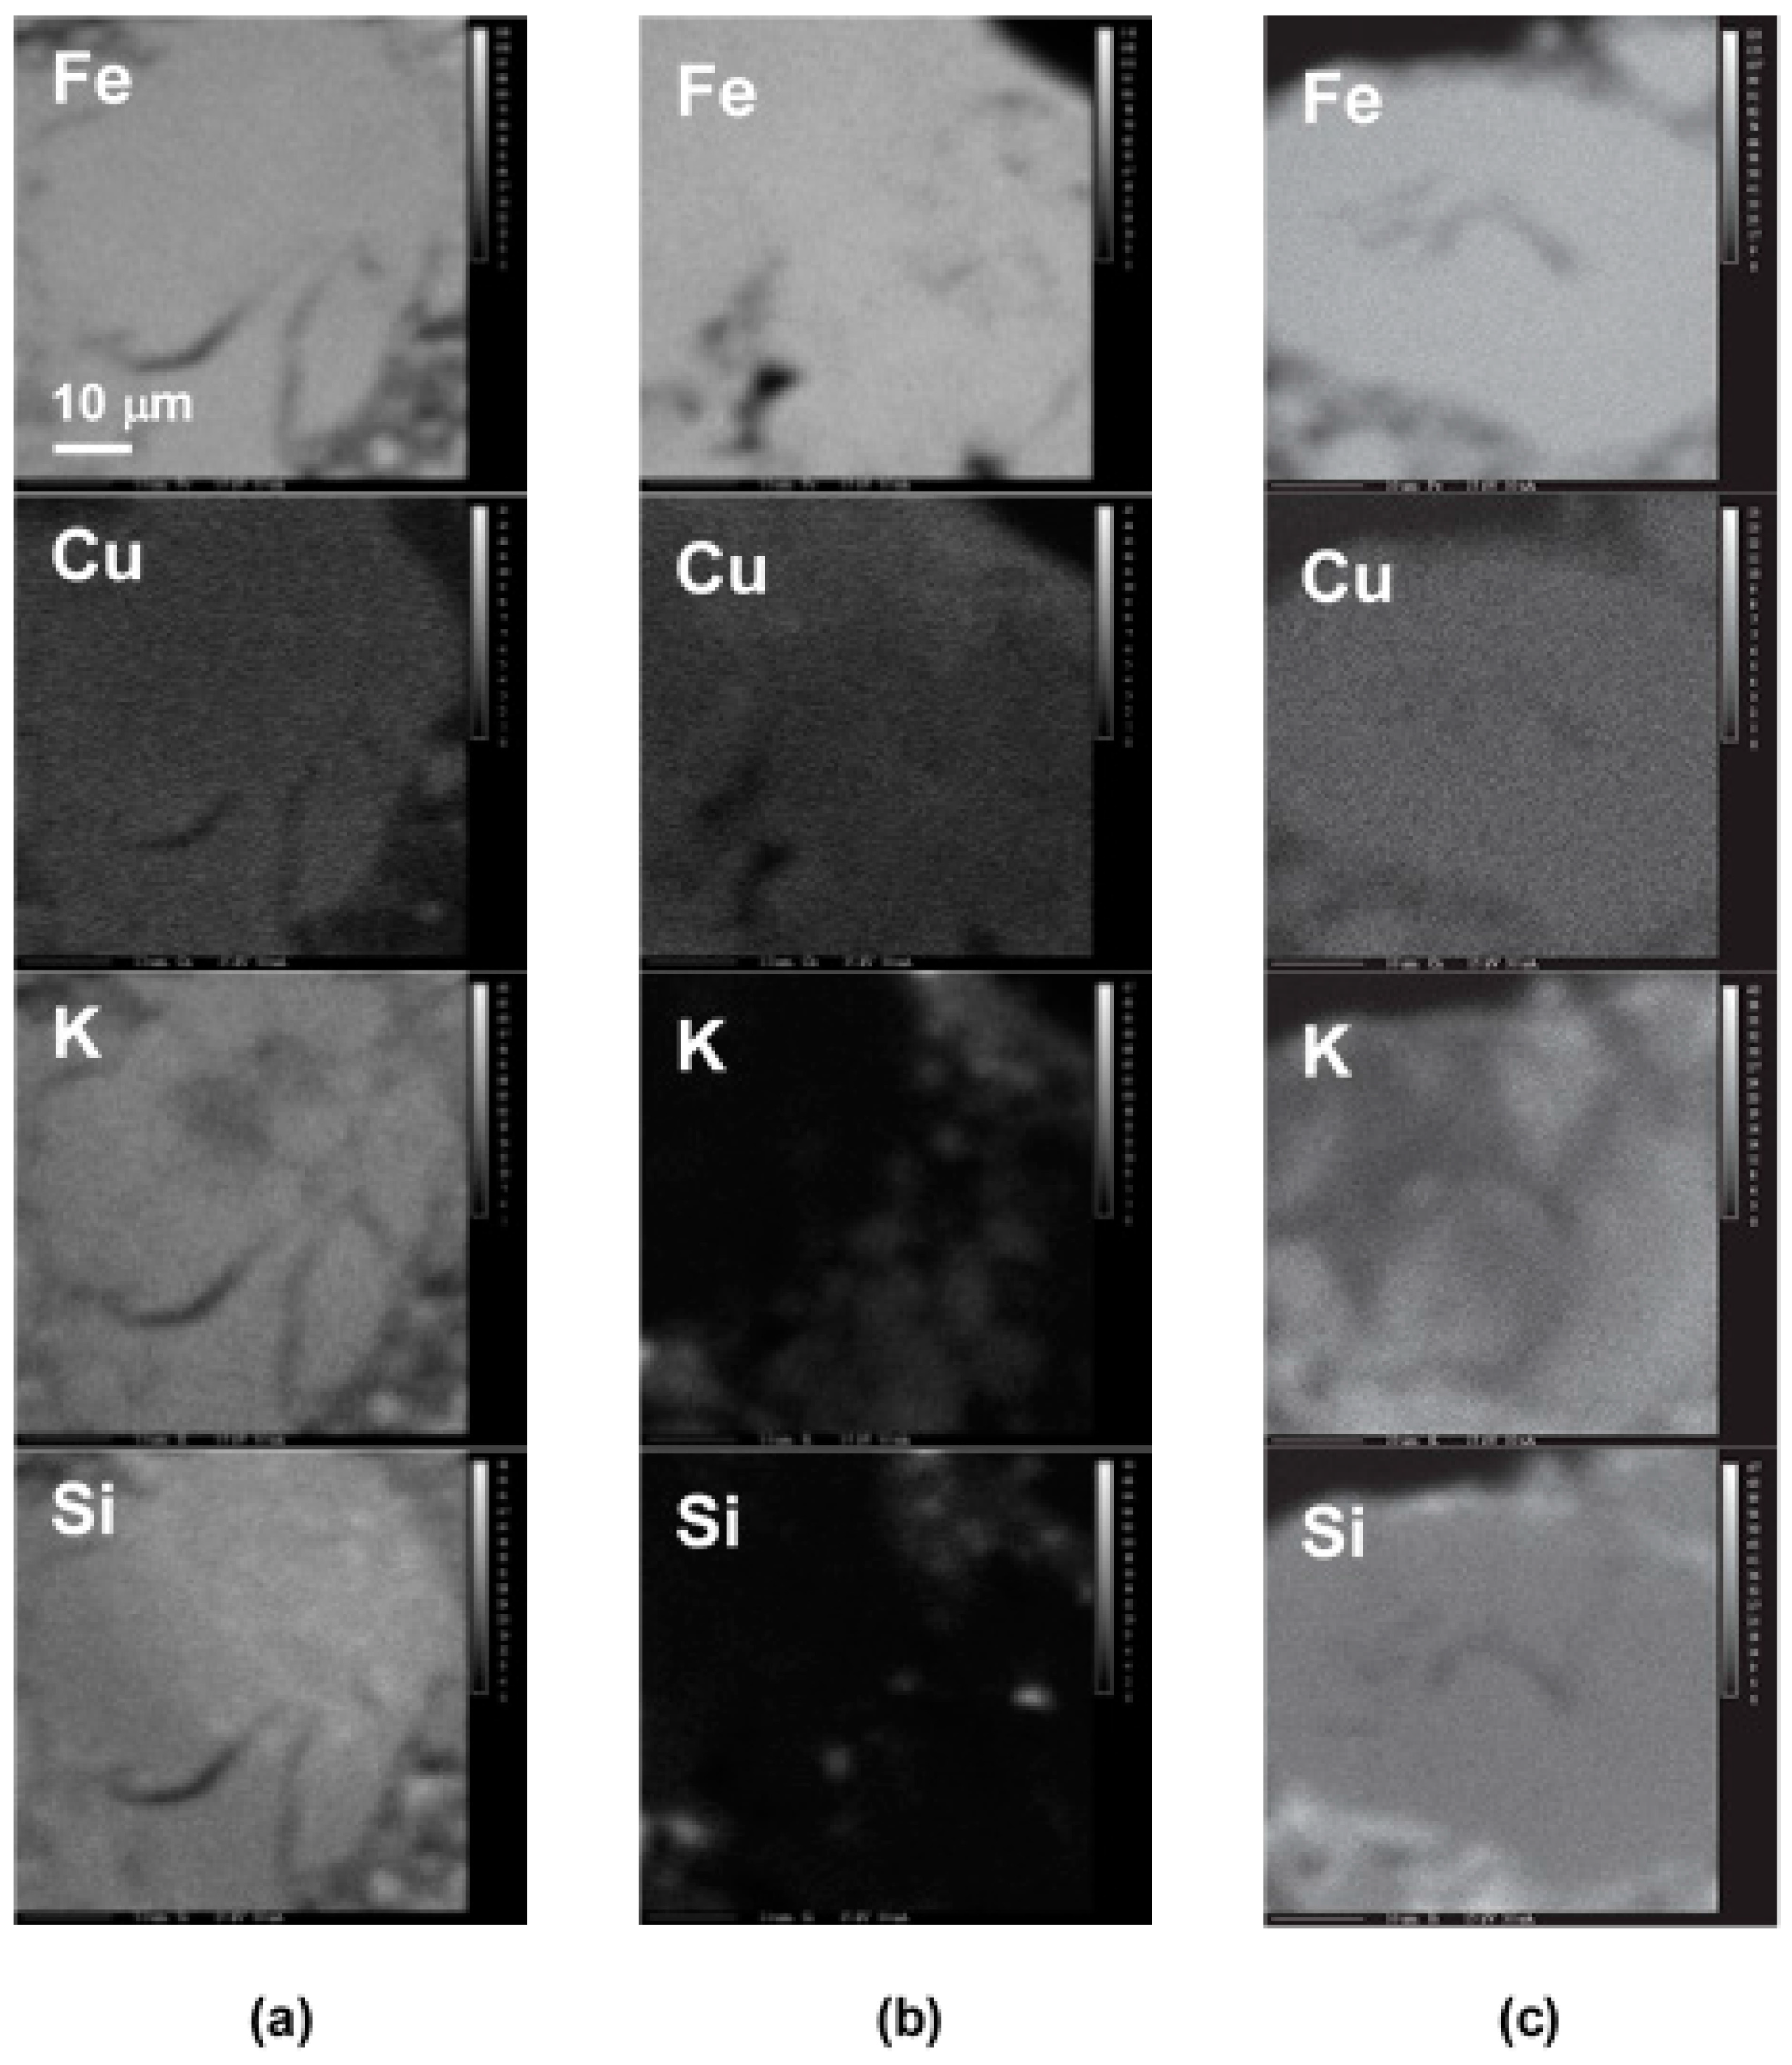
2.1.2. Catalyst Compositions and Metal Distributions

| Catalyst | Nominal Composition (pbm) a | ICP composition b (pbm) | Fe Content c (Mass%) | Surface Area d (m2/g) | Pore Volume e (cm3/g) | Pore diameter (nm) | Pore Range f (nm) |
|---|---|---|---|---|---|---|---|
| 1UH | 100Fe/5.0Cu/4.0K/16.0SiO2 | 100Fe/5.1Cu/3.6K | 66.3 | 45.6 | 0.14 | 10.3 | 6.3–17.4 |
| 1UL | 100Fe/5.0Cu/4.0K/16.0SiO2 | 100Fe/4.8Cu/3.7K | 72.1 | 51.7 | 0.13 | 8.1 | 4.2–15.5 |
| 1WH | 100Fe/5.0Cu/4.0K/16.0SiO2 | 100Fe/4.9Cu/0.3K | 62.1 | 55.6 | 0.24 | 15.5 | 8.7–28.0 |
| 1WL | 100Fe/5.0Cu/4.0K/16.0SiO2 | 100Fe/5.1Cu/0.3K | 70.2 | 37.2 | 0.24 | 34.2 | 16.1-70.7 |
| 2UH | 100Fe/5.0Cu/4.0K/16.0SiO2 | 100Fe/4.1Cu/3.6K | 68.0 | 36.8 | 0.14 | 8.7 | 5.0–15.3 |
| 2UL | 100Fe/5.0Cu/4.0K/16.0SiO2 | 100Fe/5.5Cu/4.2K | 62.8 | 54.7 | 0.15 | 13.1 | 4.0–43.0 |
| 2WH | 100Fe/5.0Cu/4.0K/16.0SiO2 | 100Fe/5.3Cu/5.2K | 65.1 | 65.7 | 0.13 | 5.5 | 1.2–12.8 |
| 2WL | 100Fe/5.0Cu/4.2K/16.0SiO2 | 100Fe/5.1Cu/5.0K | 72.8 | 23.6 | 0.20 | 46.1 | 16.6–127.8 |
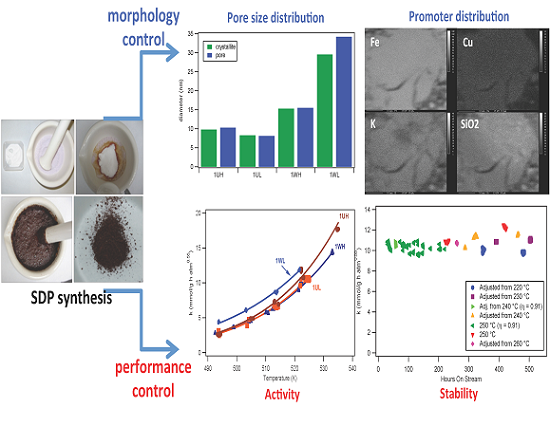
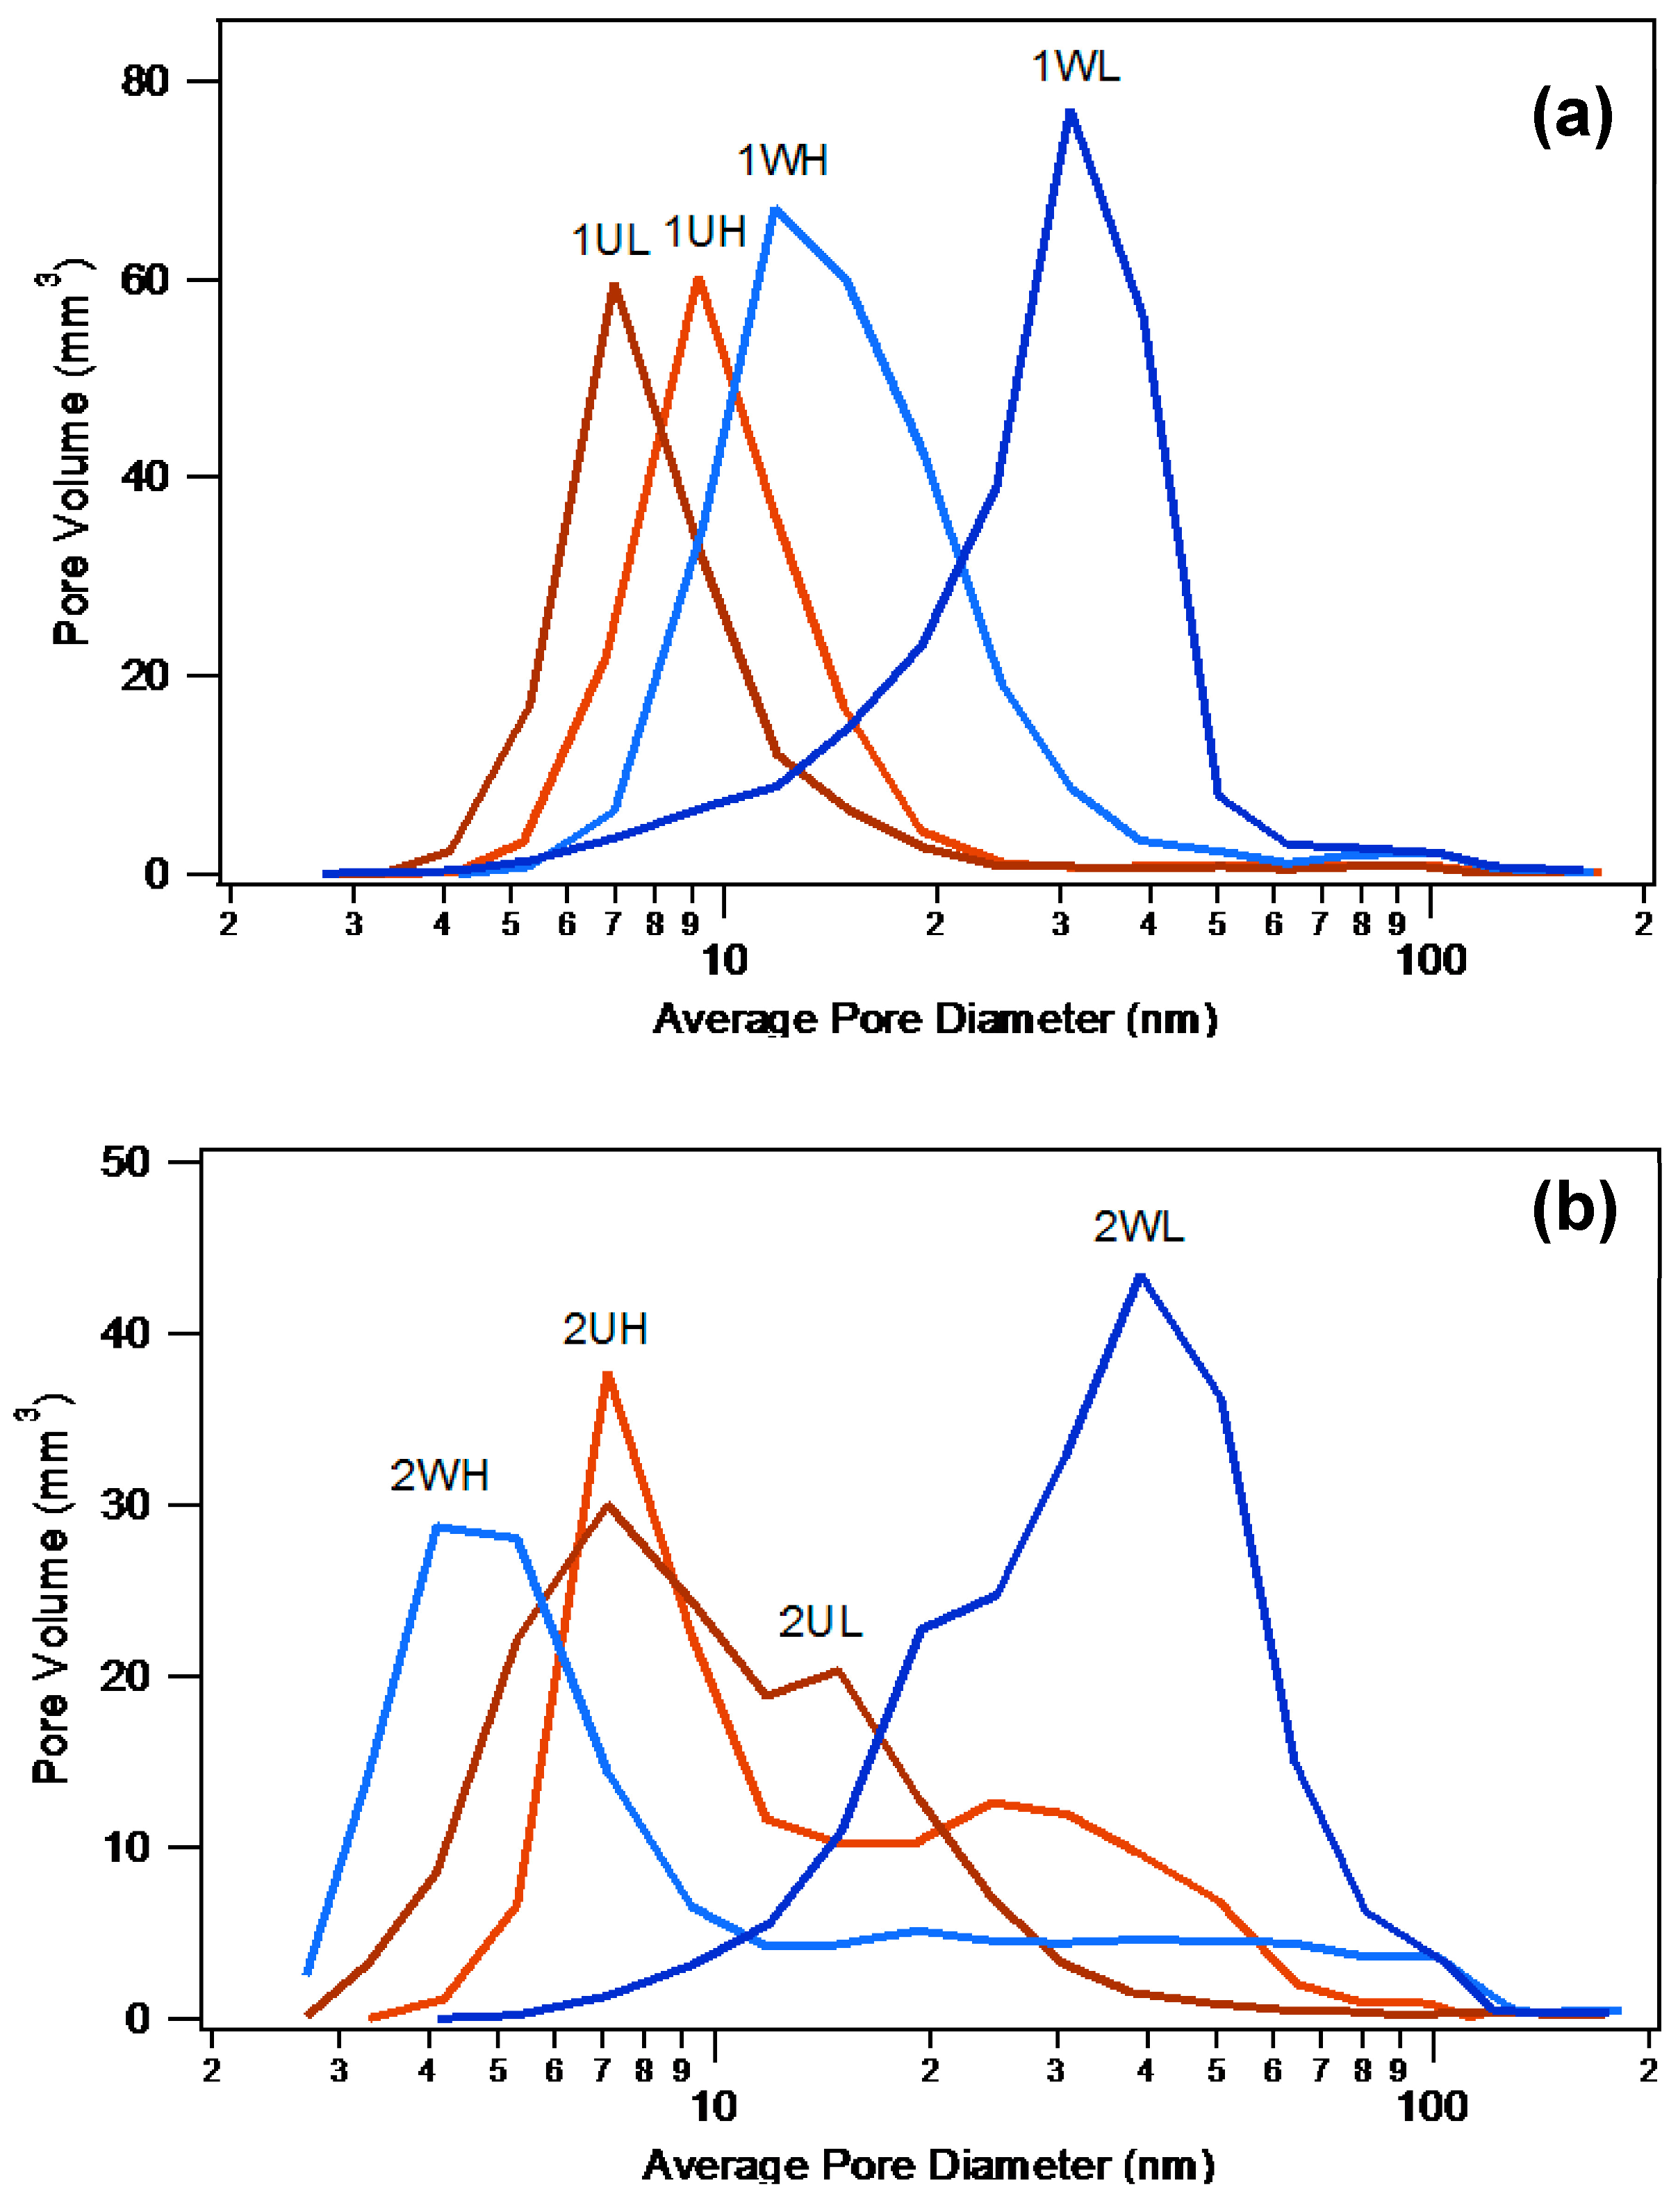
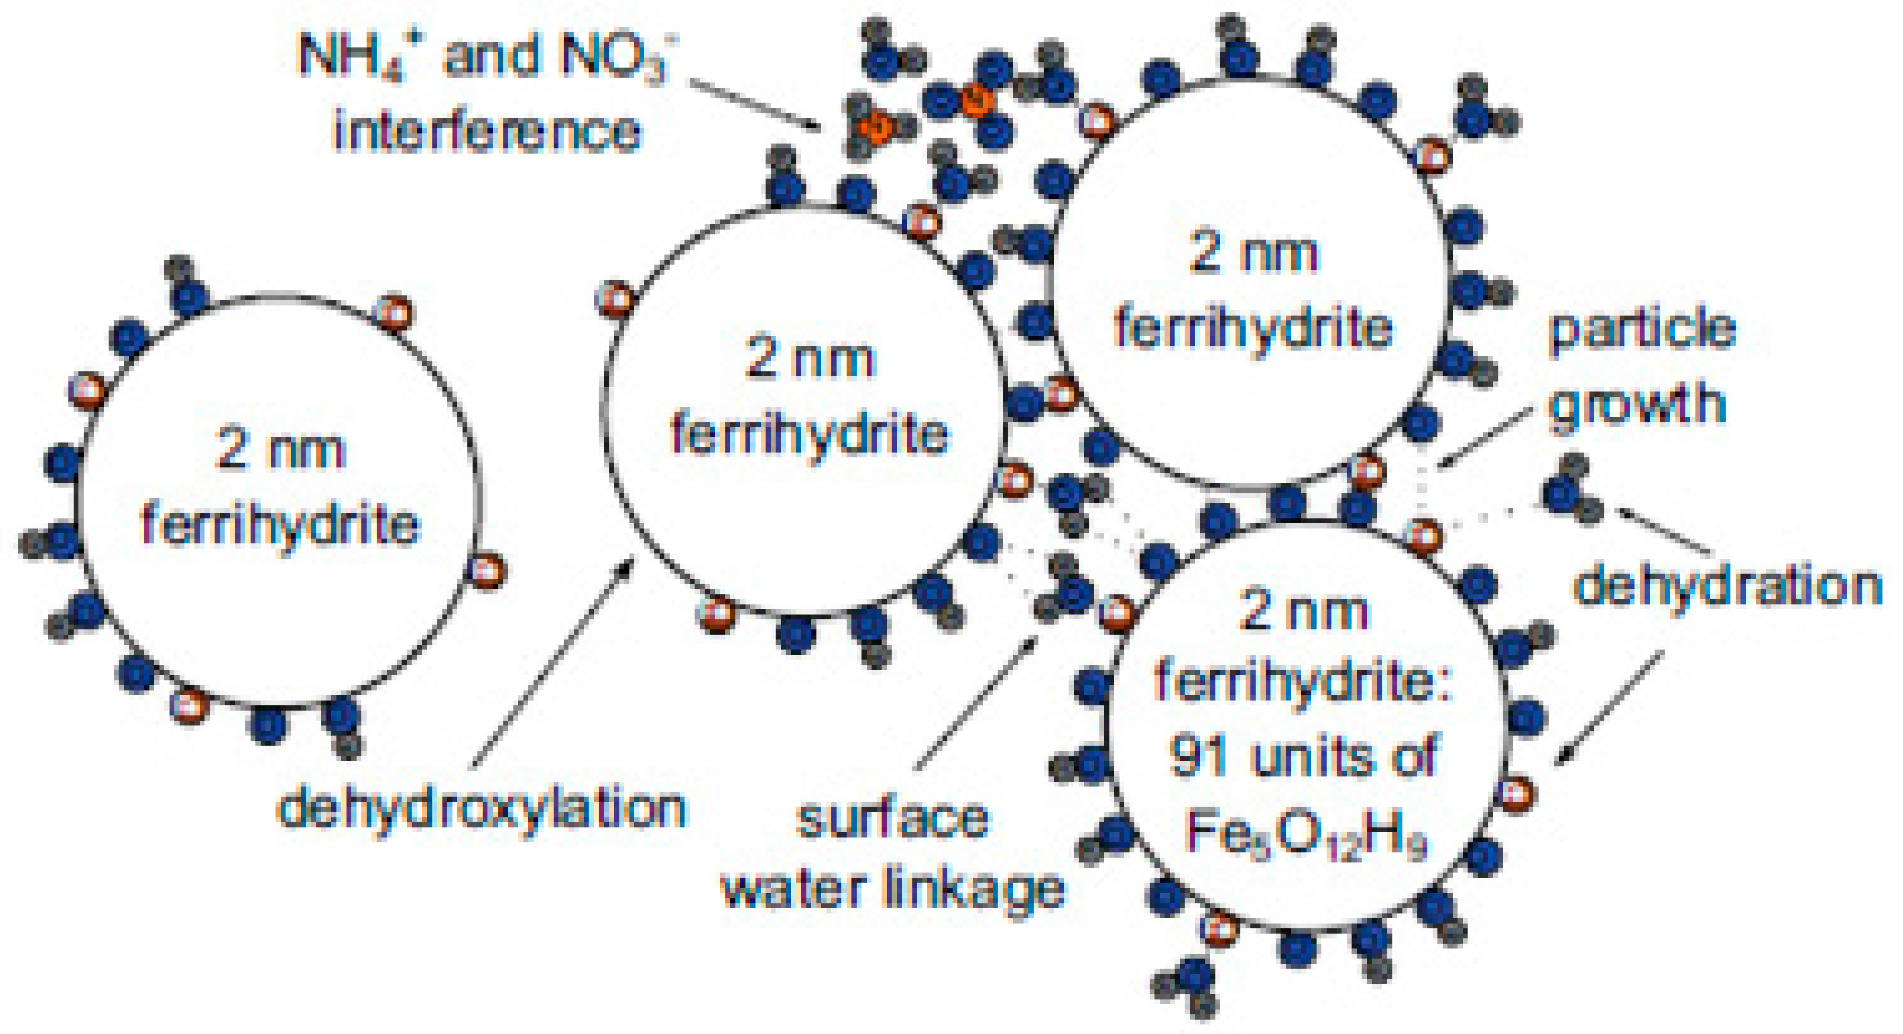
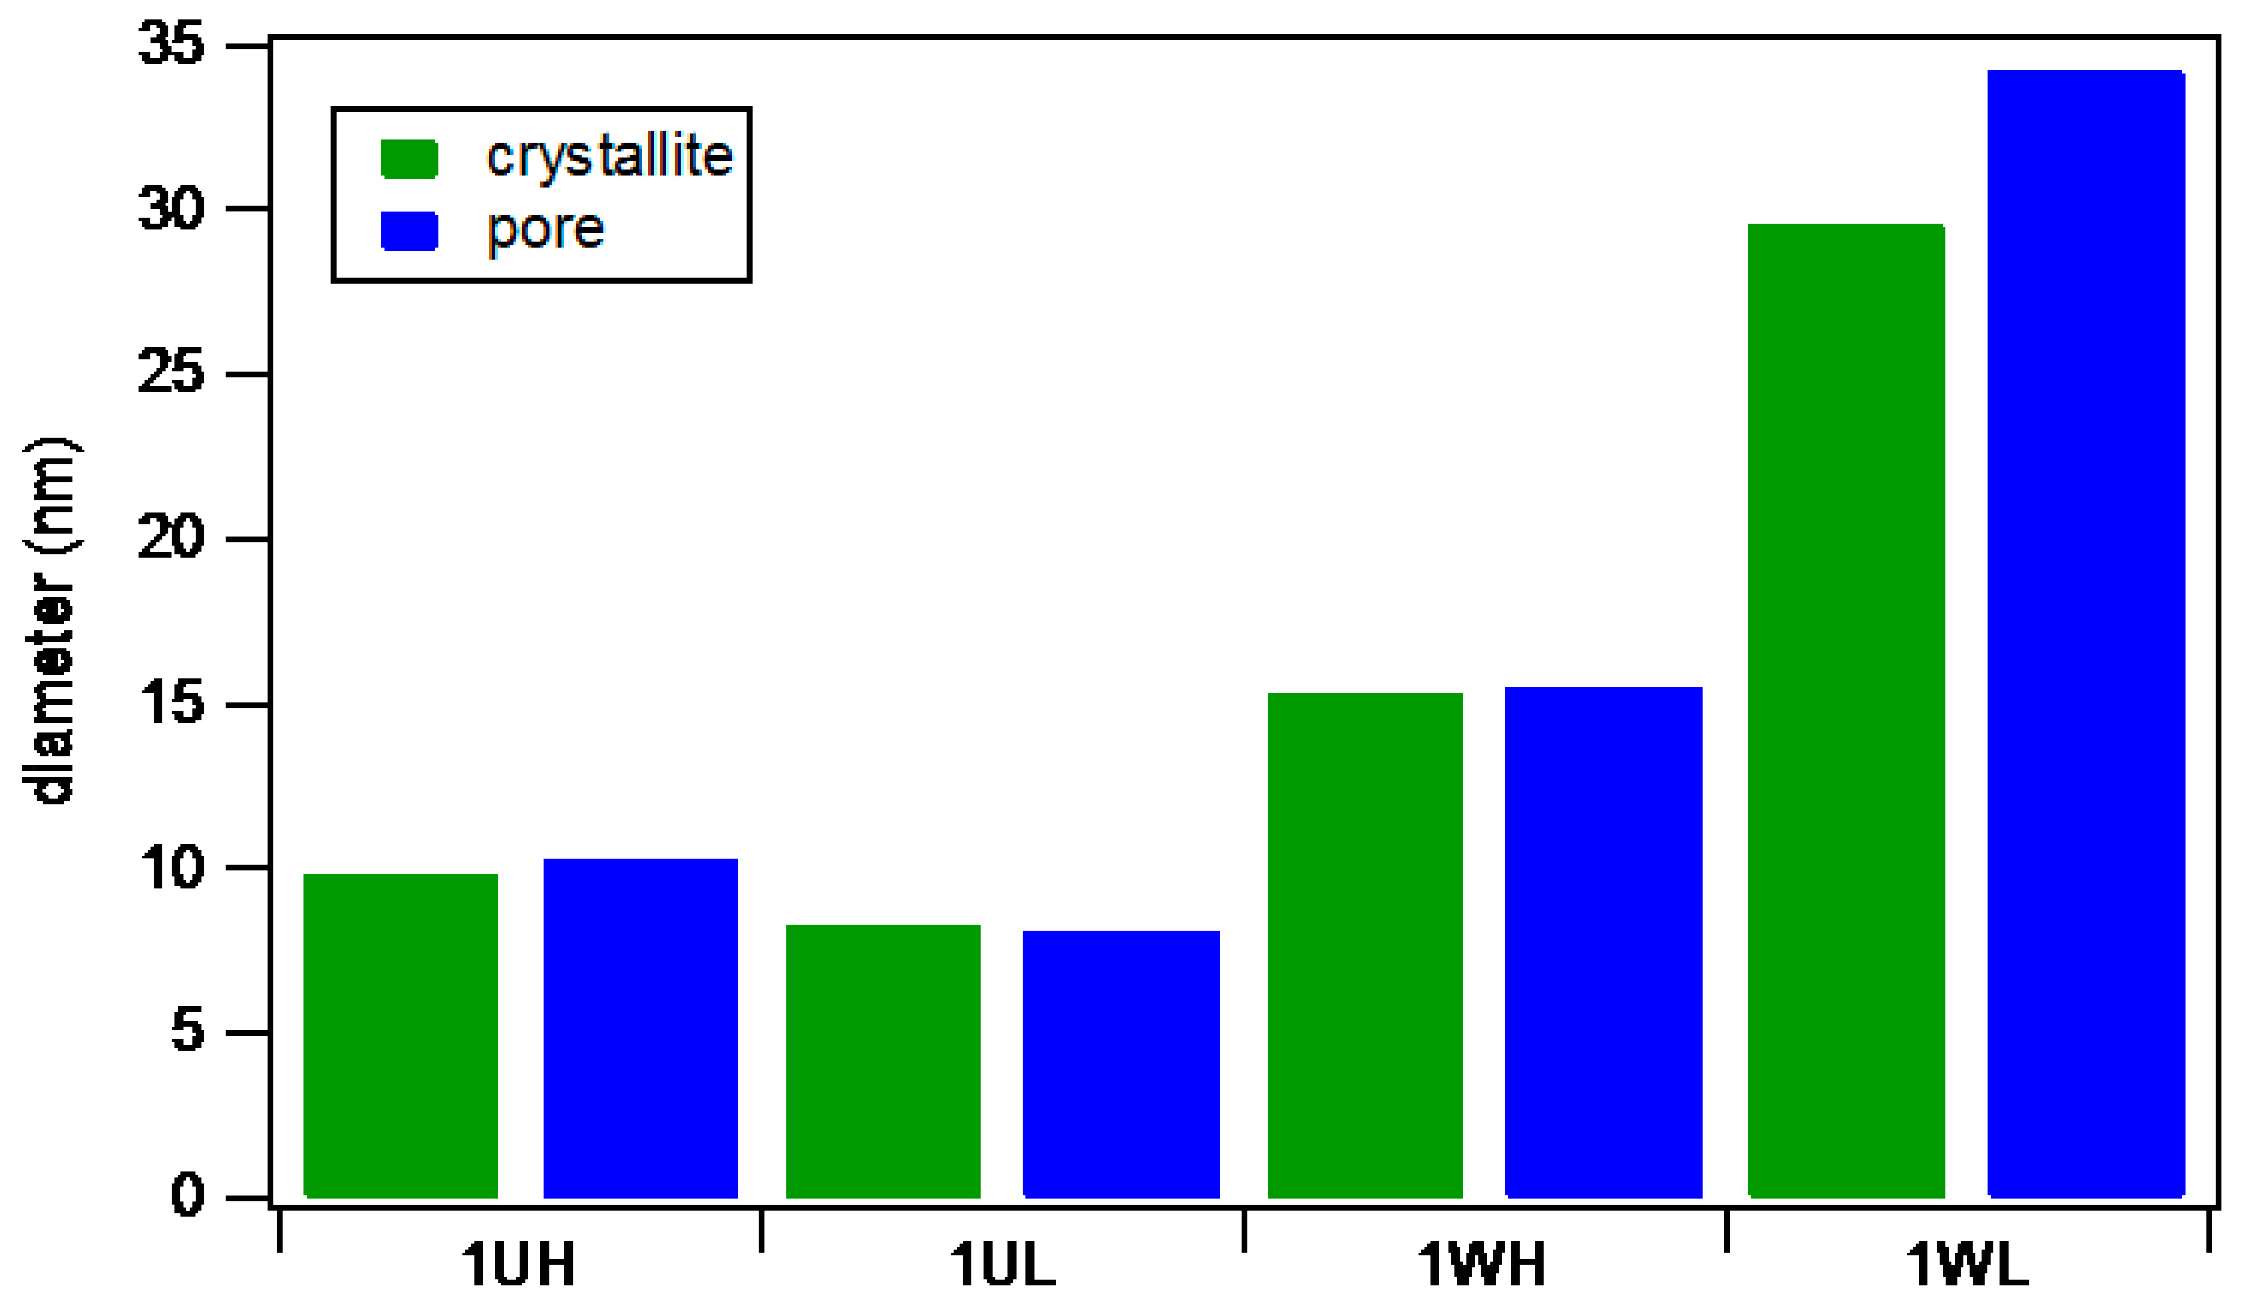
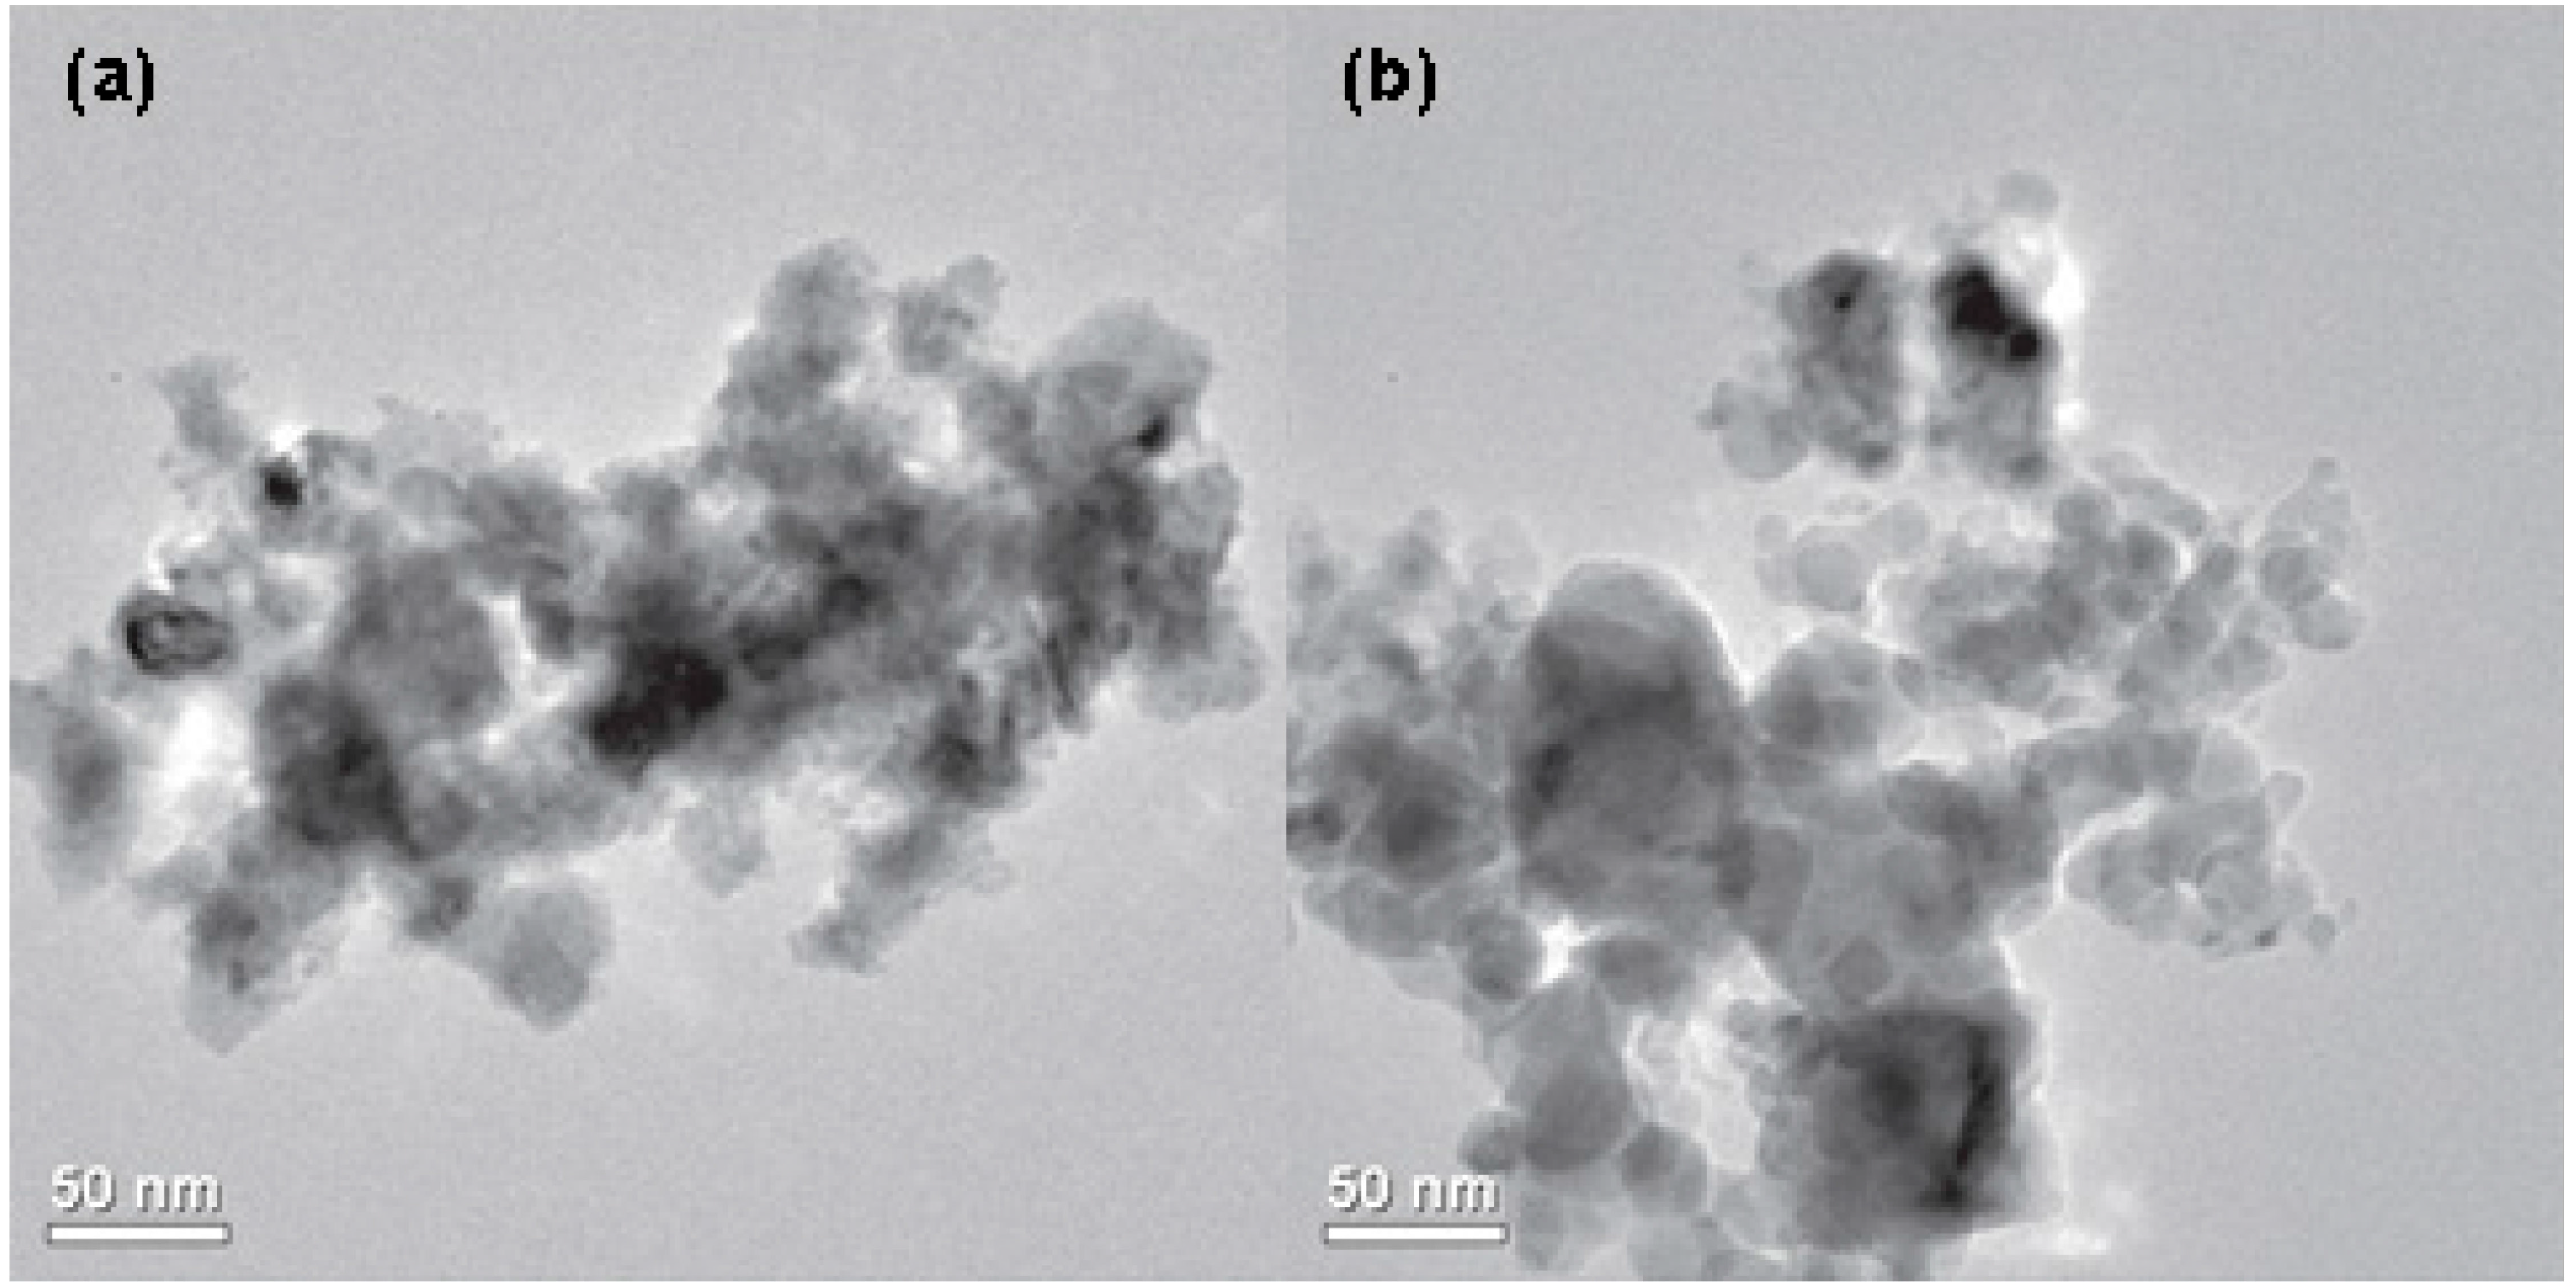
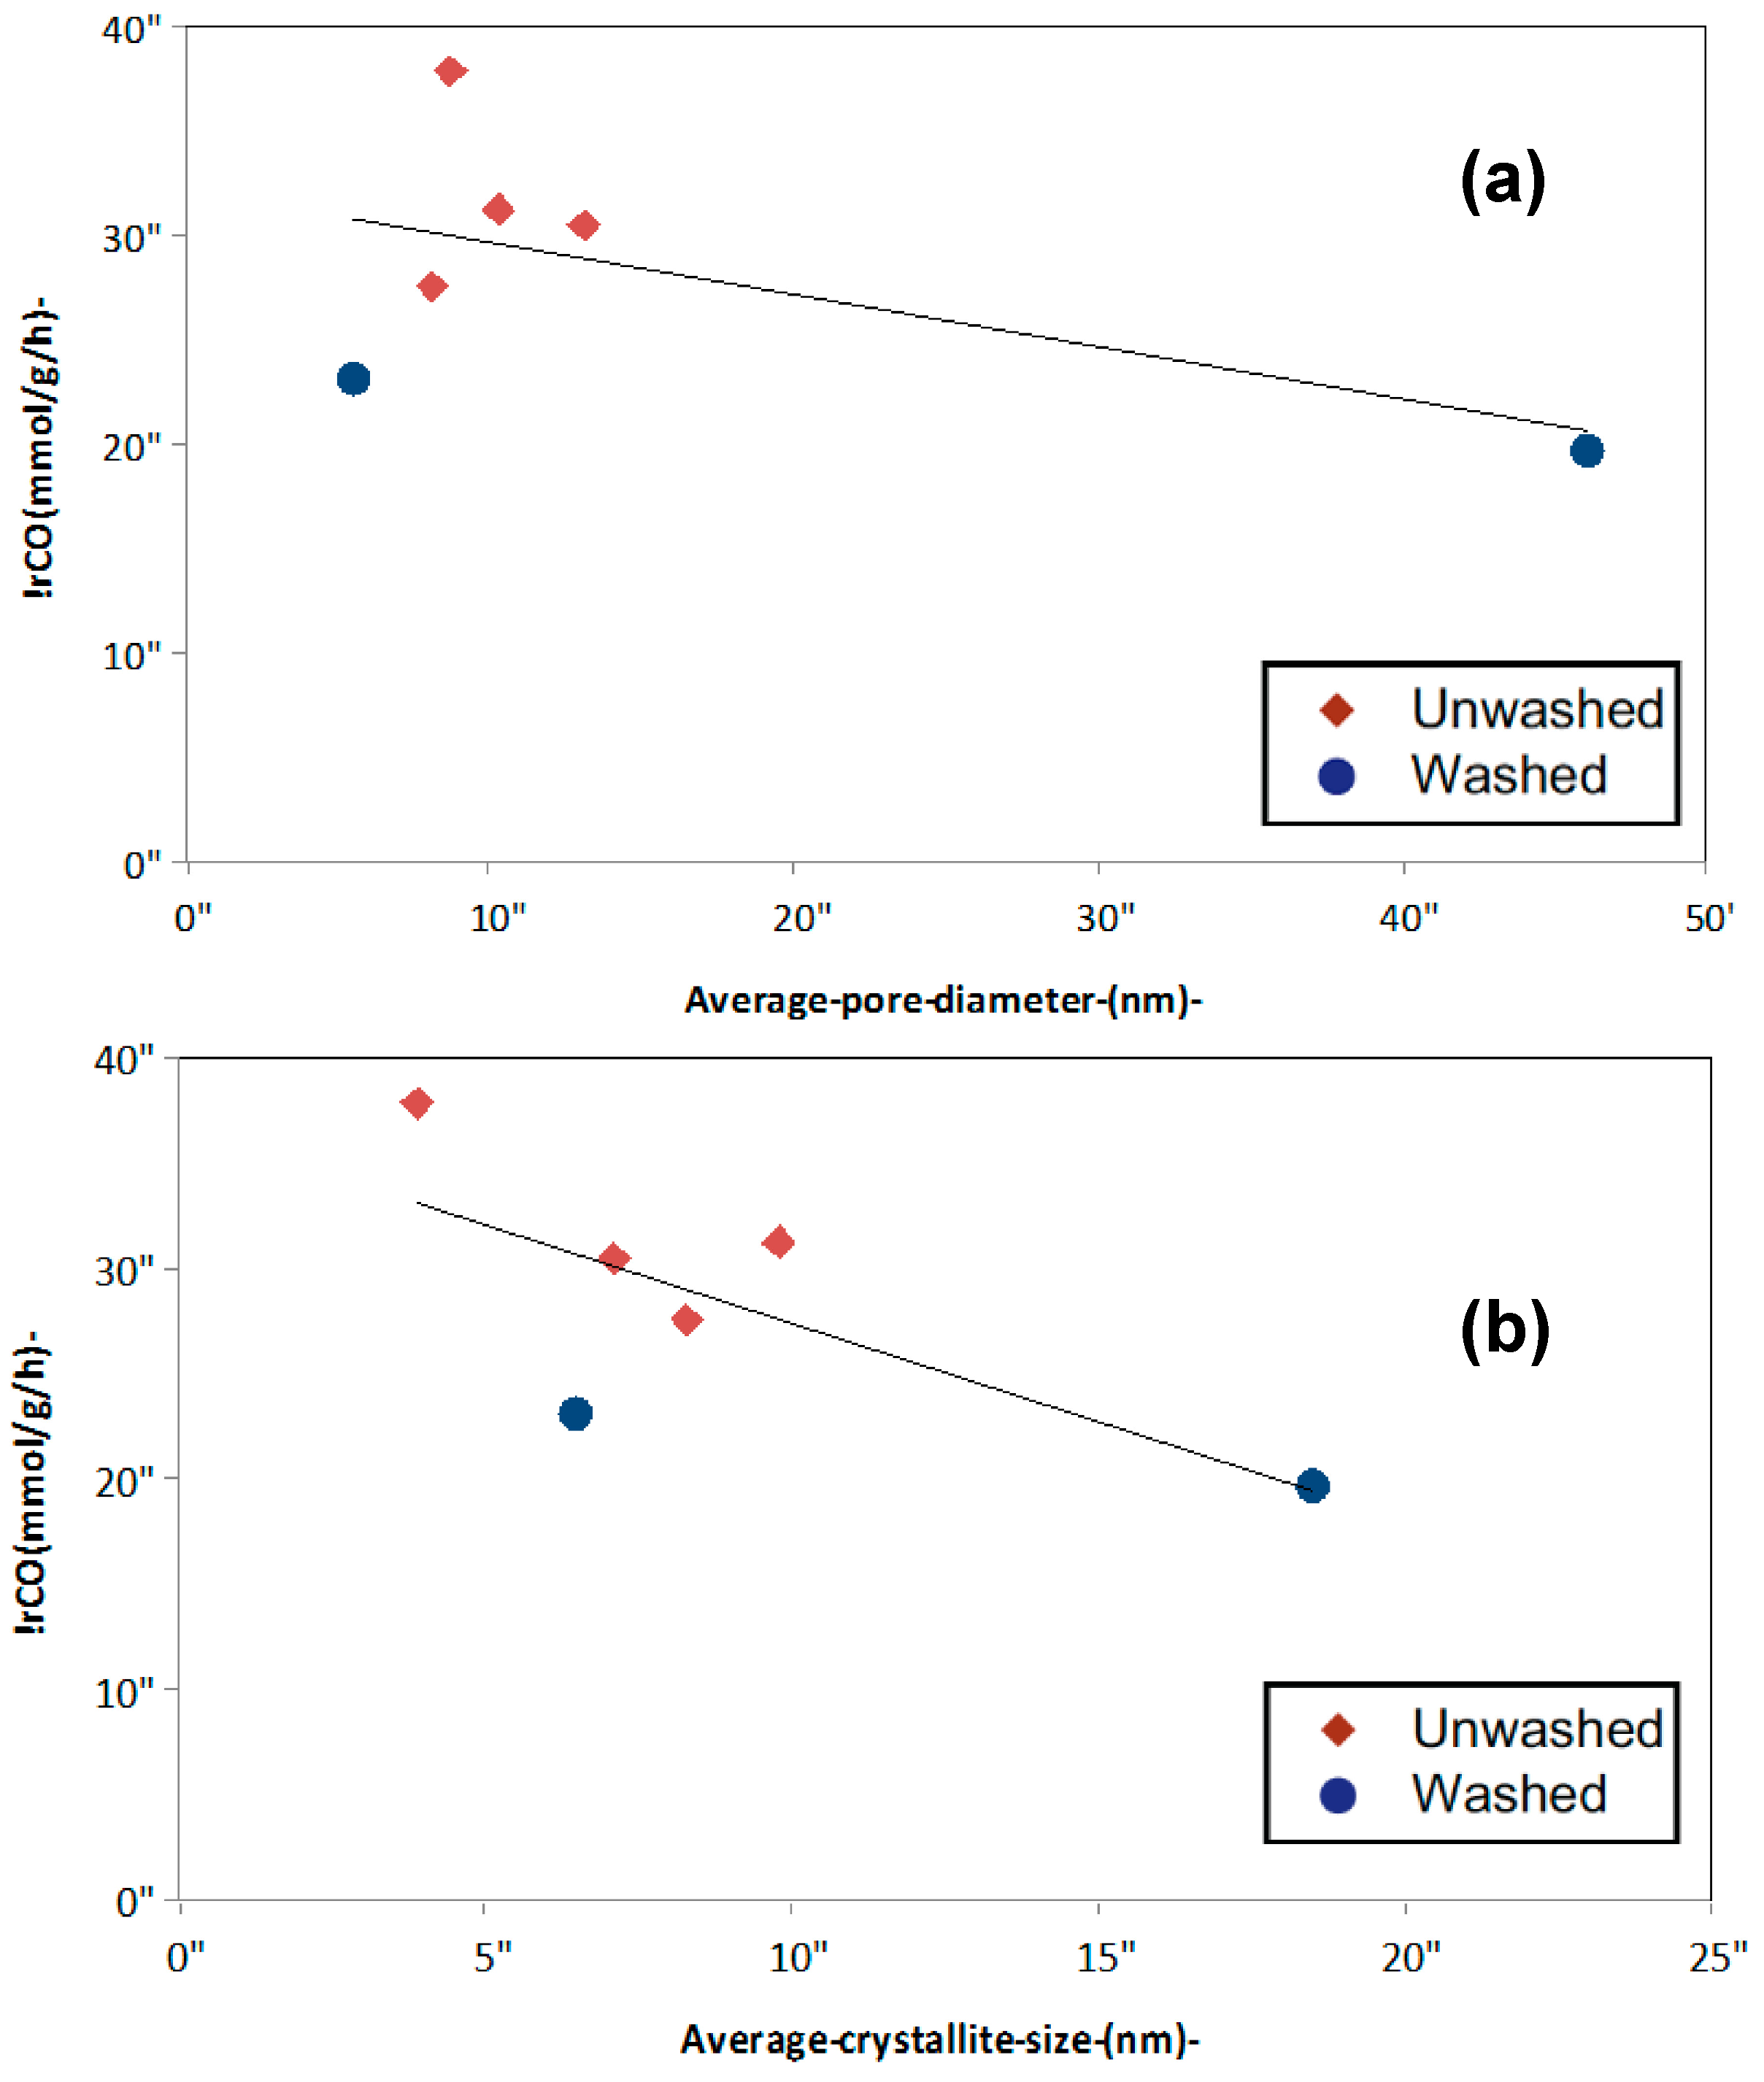
2.1.3. Catalyst Pore Structure and Crystallite Size


| Catalyst | Uptake a | Crystallite diameter | ||||||
|---|---|---|---|---|---|---|---|---|
| H2 b μmol/g | CO c μmol/g | CO/H d % | EOR % | Disp nm | H2 a nm | Fe e nm | Fe3O4 e,f nm | |
| 1UH | 159 | 583 | 1.85 | 21.5 | 12.5 | 9.8 | 19.7 | 20.5 |
| 1UL | 146 | 893 | 3.05 | 15.5 | 14.8 | 8.3 | 19.8 | 22.6 |
| 1WH | 203 | 746 | 1.85 | 46.1 | 8.0 | 15.3 | 26.3 | 15.2 |
| 1WL | 131 | 675 | 2.60 | 50.6 | 4.2 | 29.5 | 36.4 | 21.2 |
| 2UH g | 158 | 145 | 0.46 | 9.3 | 31.1 | 3.9 | - | 24.5 |
| 2UL | 118 | 264 | 1.10 | 12.1 | 17.4 | 7.1 | 17.8 | 6.6 |
| 2WH | 164 | 242 | 0.75 | 14.8 | 19.0 | 6.5 | 18.3 | 16.4 |
| 2WL | 61 | 166 | 1.35 | 14.2 | 6.7 | 18.5 | 35.0 | 16.2 |

2.2. Catalytic Performance
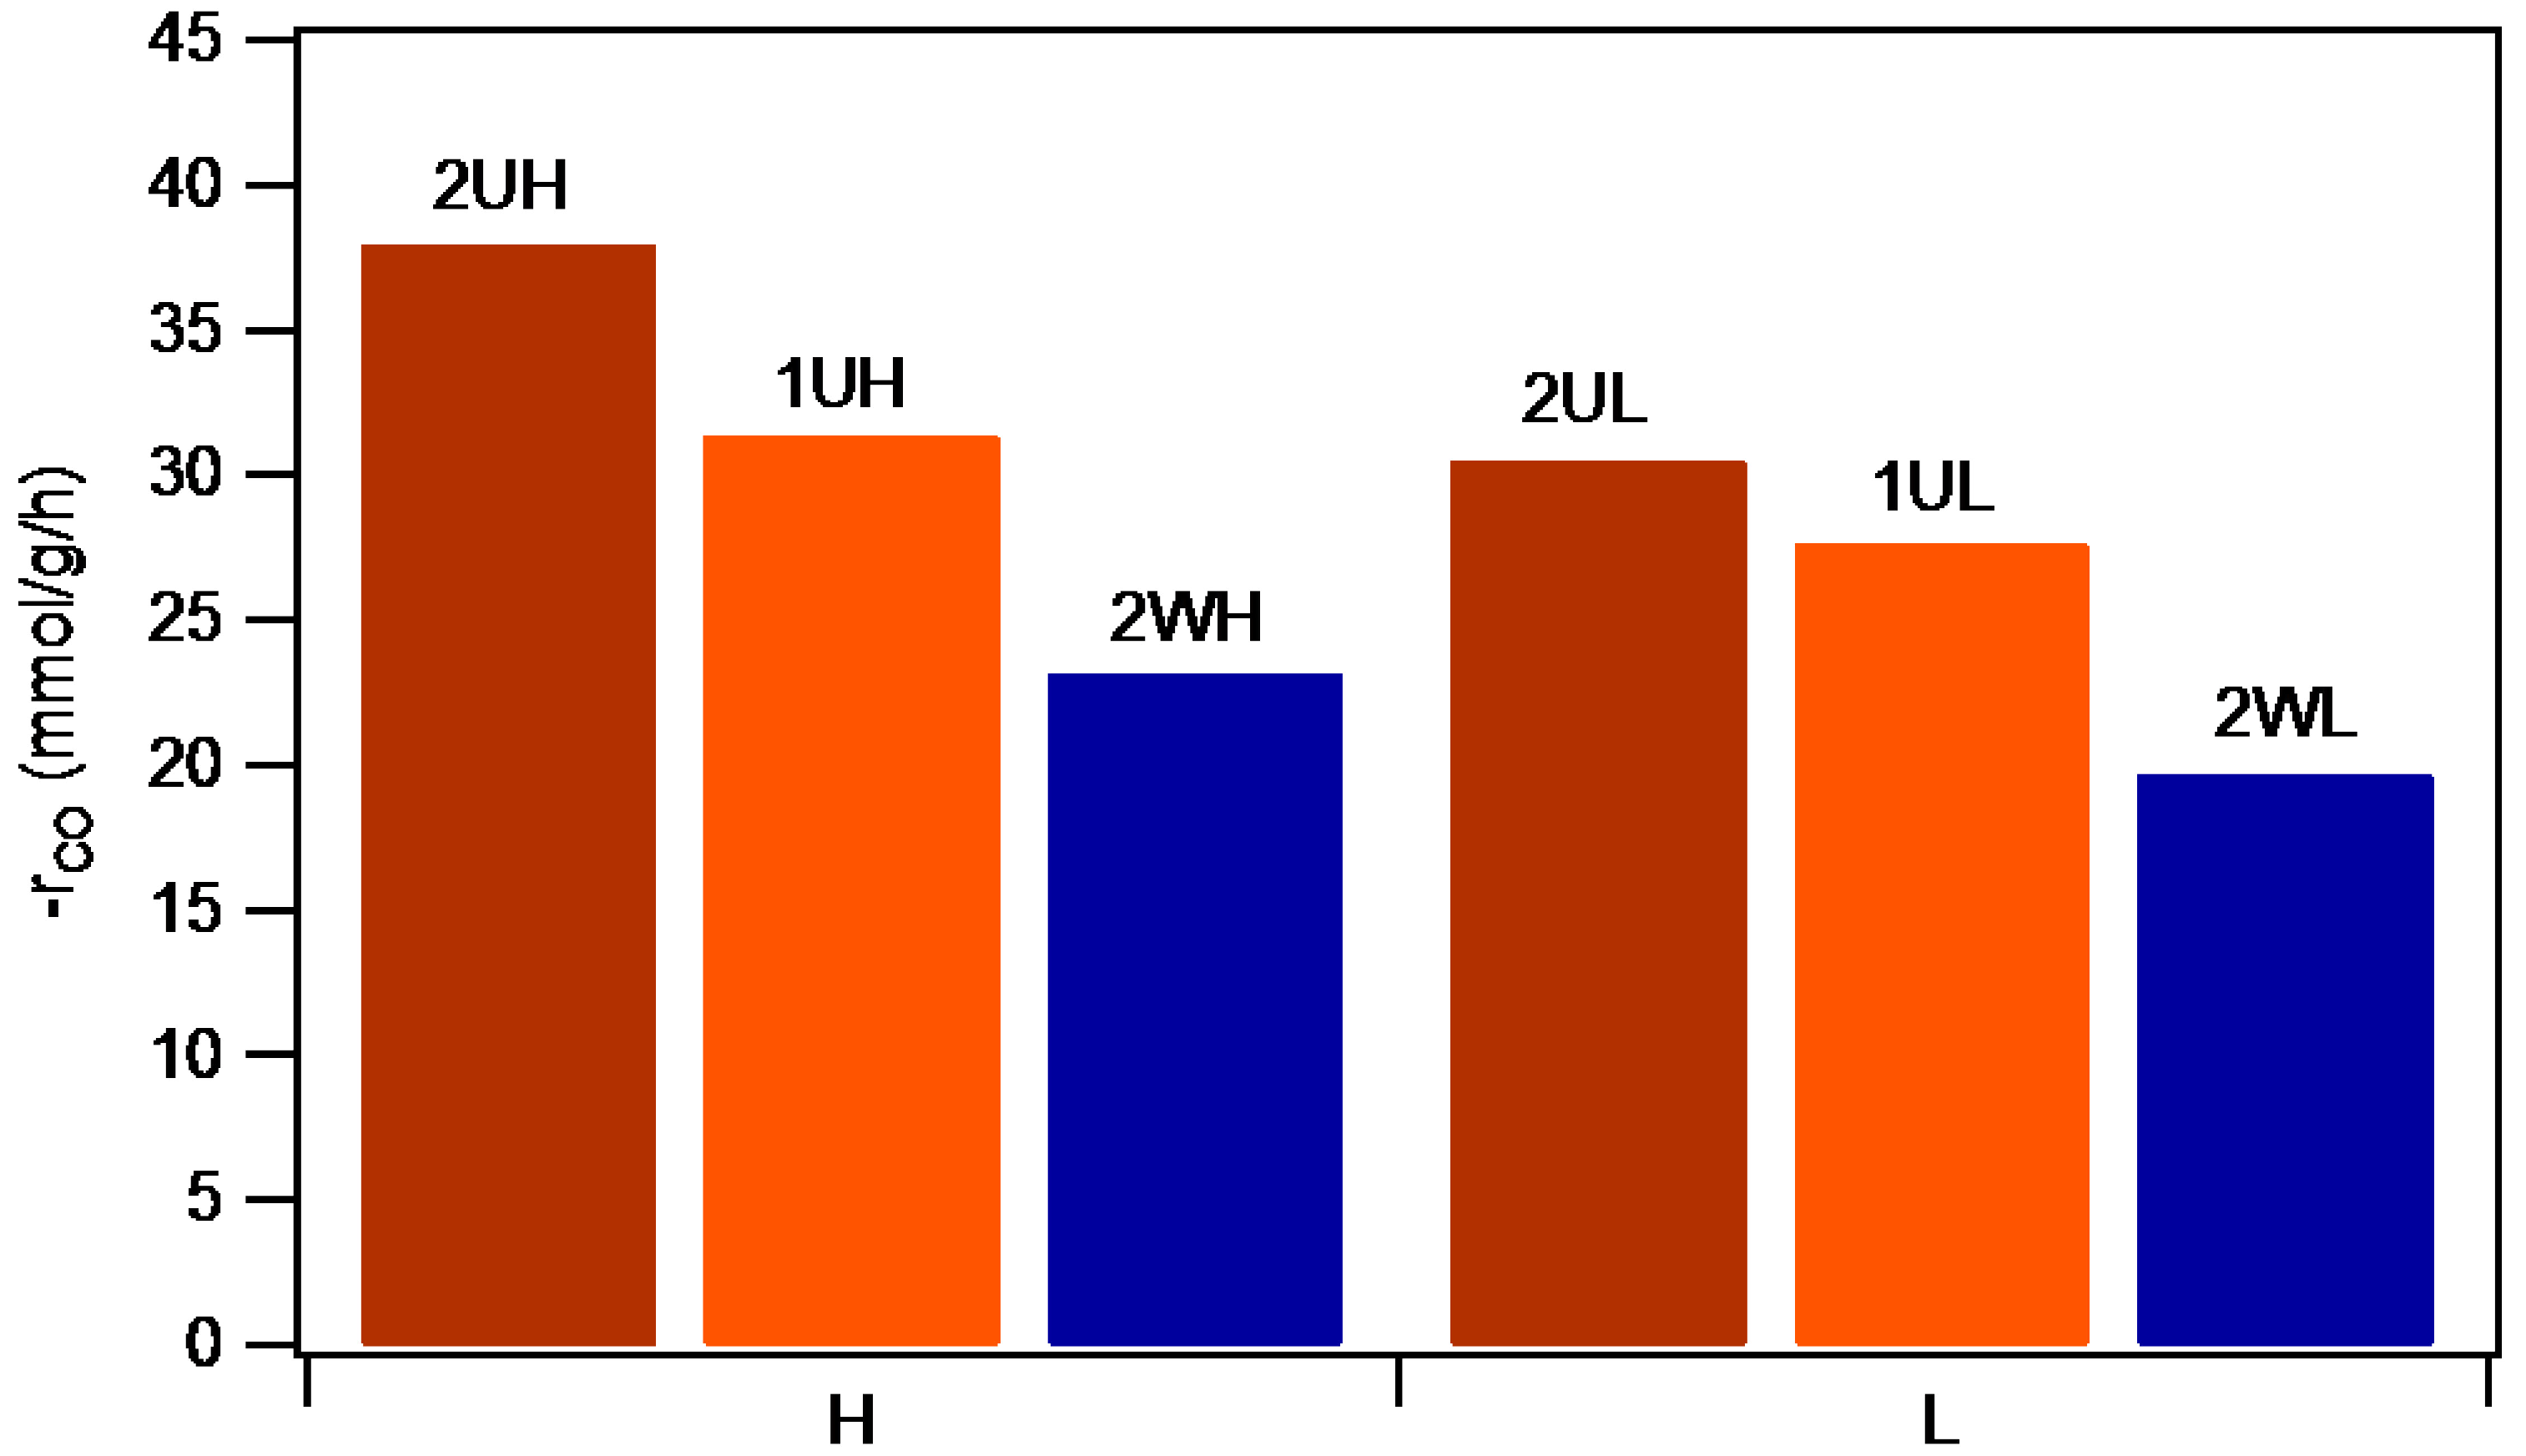
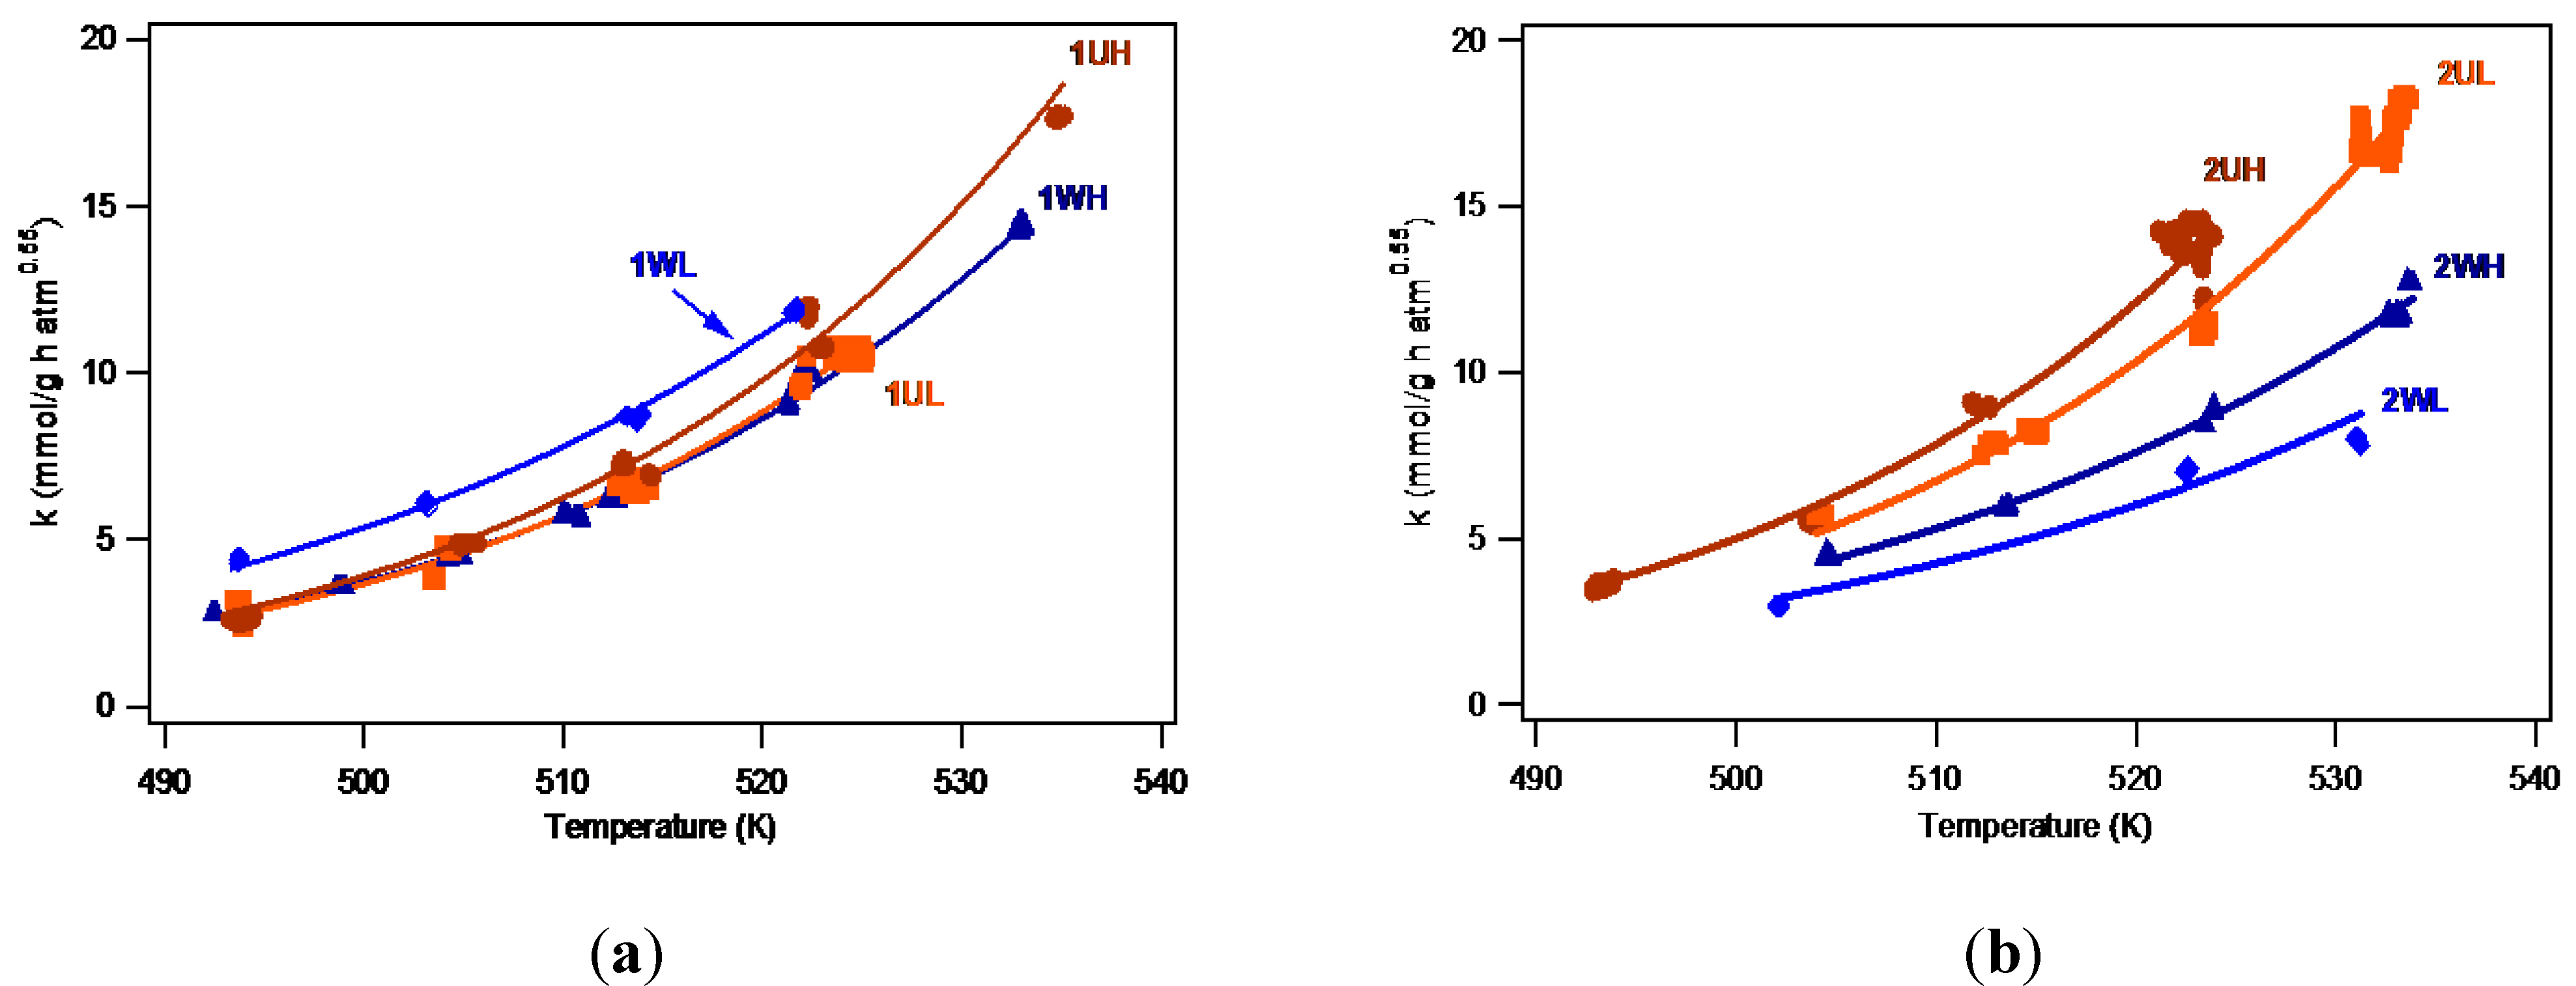
2.2.1 Catalyst Activity


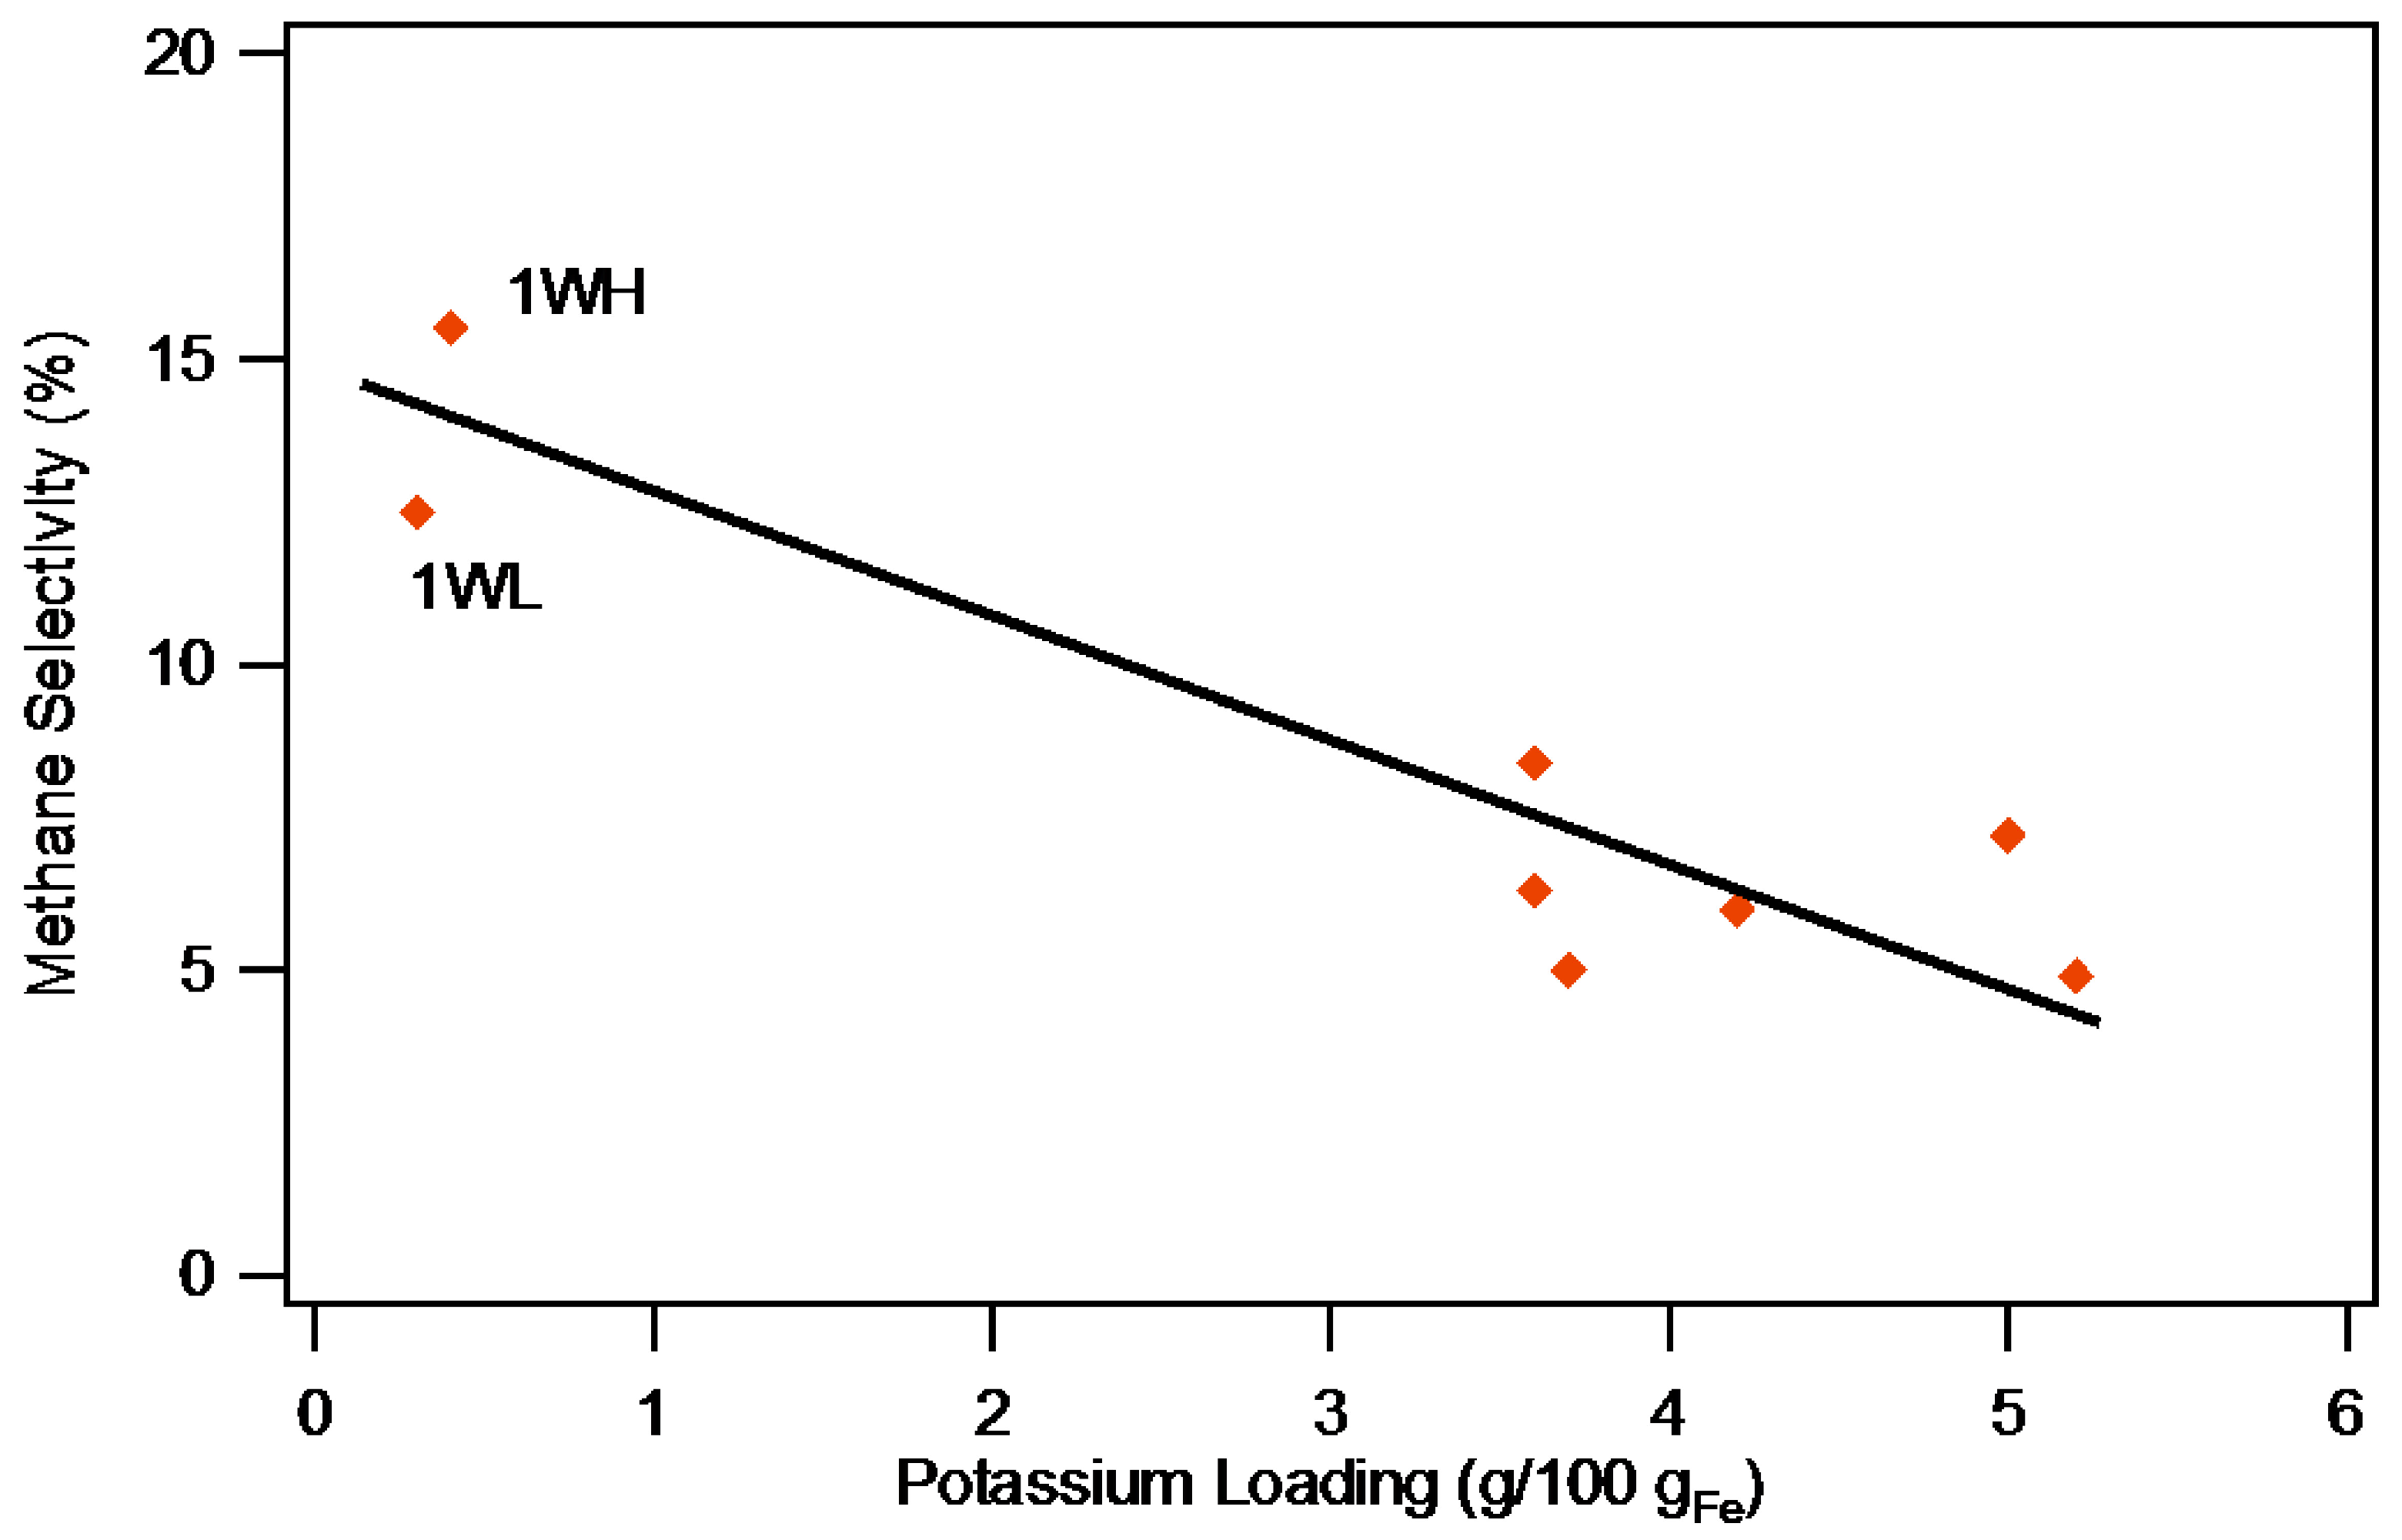
2.2.2. Selectivity
| Catalyst | CO to CH4 (mole%) a,b | CO to CO2 (mole%) c | ||||
|---|---|---|---|---|---|---|
| 230 °C | 240 °C | 250 °C | 230 °C | 240 °C | 250 °C | |
| 1UH | 4.7 | 5.3 | 6.3 | 41.7 | 43.1 | 45.2 |
| 1UL | 4.0 | 4.6 | 5.0 | 38.2 | 43.3 | 45.5 |
| 1WH | 14.8 | 15.5 | 15.1 | 10.7 | 14.4 | 18.9 |
| 1WL | 10.8 | 12.0 | 12.5 | 9.8 | 14.2 | 18.0 |
| 2UH | 6.9 | 7.2 | 8.4 | 30.5 | 31.2 | 32.6 |
| 2UL | 3.6 | 4.9 | 6.0 | 23.2 | 29.5 | 34.0 |
| 2WH | 3.1 | 3.8 | 4.9 | 24.0 | 28.7 | 33.9 |
| 2WL | 5.1 | 5.5 | 7.2 | 31.2 | 32.5 | 37.1 |

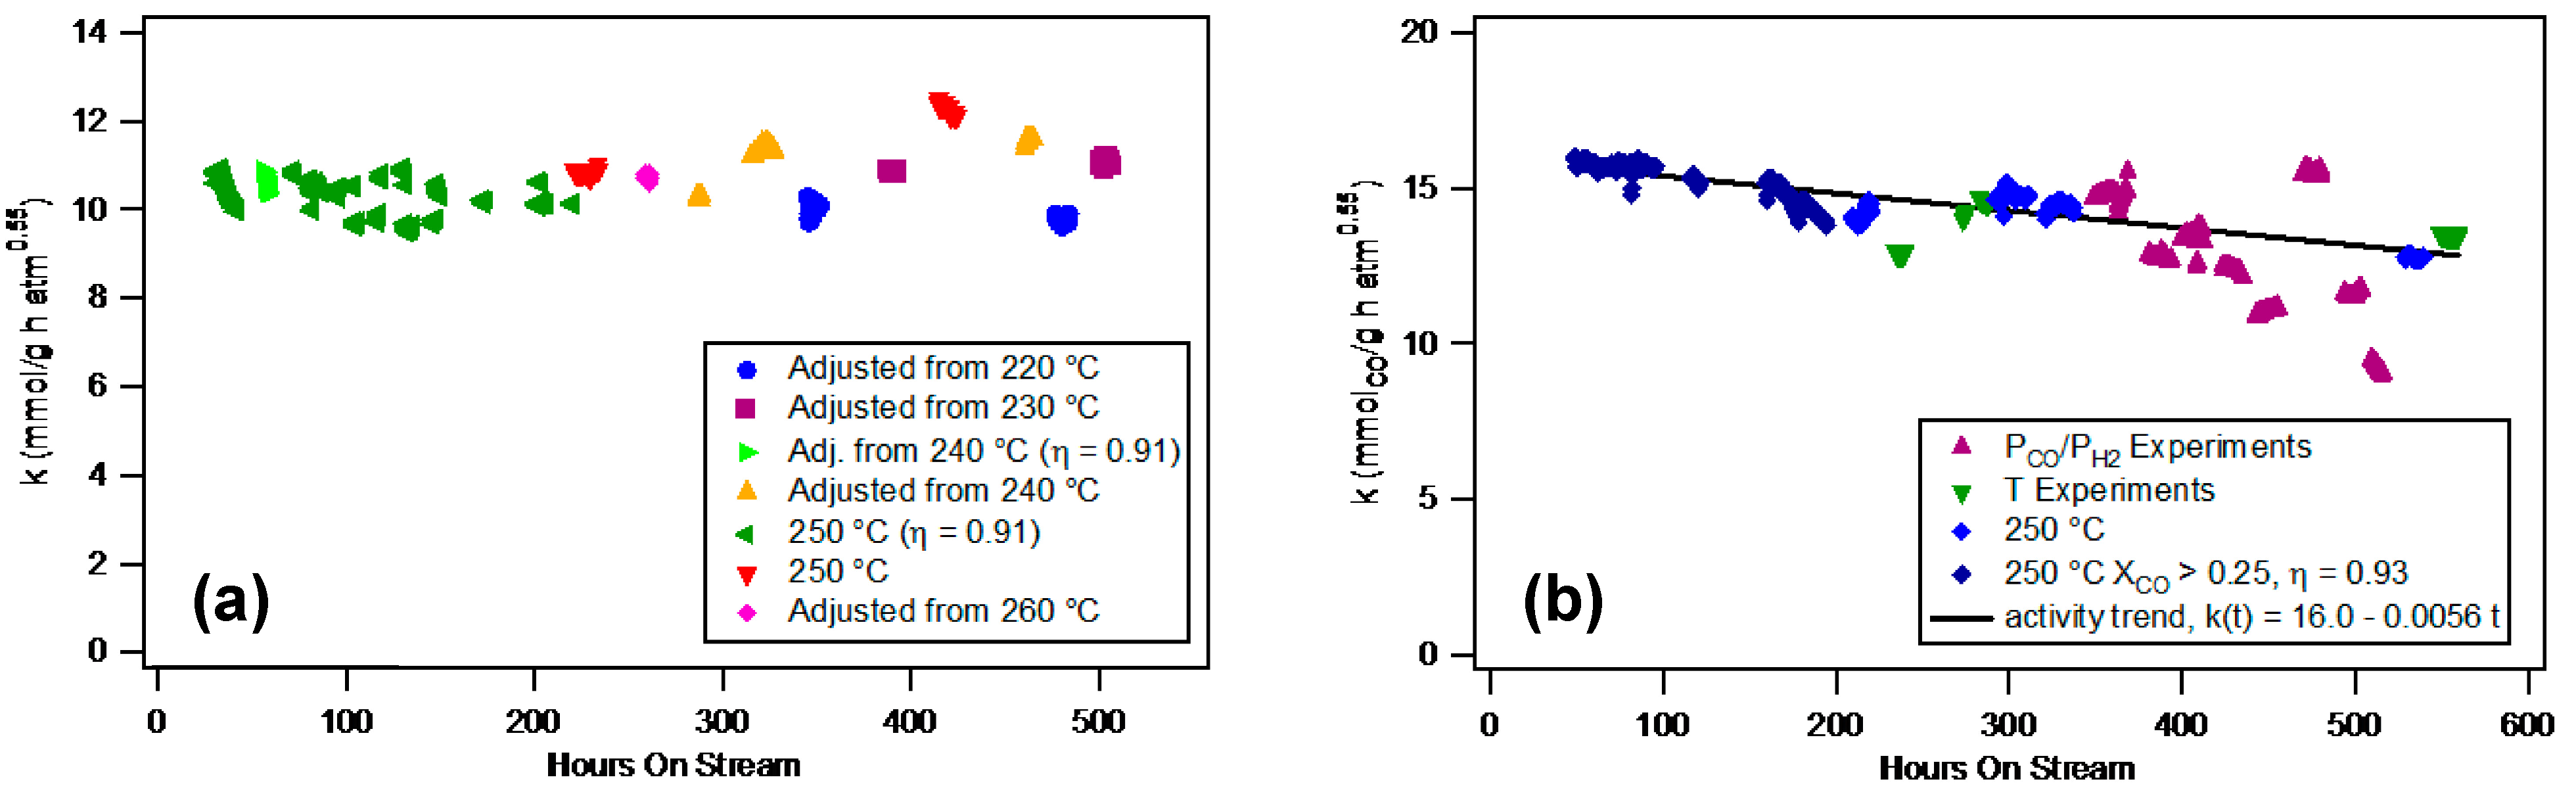
2.2.3 Stability
2.2.4 Comparison to Published Catalysts
| Catalyst | Activity (mmol/g h MPa) | Productivity (gHC/gFe h) | Selectivity | |||
|---|---|---|---|---|---|---|
| H2/CO | CH4 | C2+ | CO2 | |||
| 1UH | 125 | 0.55 | 1.0 | 0.040 | 0.49 | 0.47 |
| 2UH | 134 | 0.71 | 1.0 | 0.063 | 0.61 | 0.34 |
| TAMU b | 102-180 | 0.5-0.8 | 0.67 | 0.014 | 0.50 | 0.48 |
| Mobil b | 102 | 0.39 | 0.73 | 0.012 | 0.49 | 0.50 |
3. Experimental Section
3.1 Catalyst Preparation
3.2 Characterization Techniques
3.2.1. N2 Adsorption
3.2.2. Thermal Gravimetric Analysis (TGA)
3.2.3. Hydrogen Chemisorption
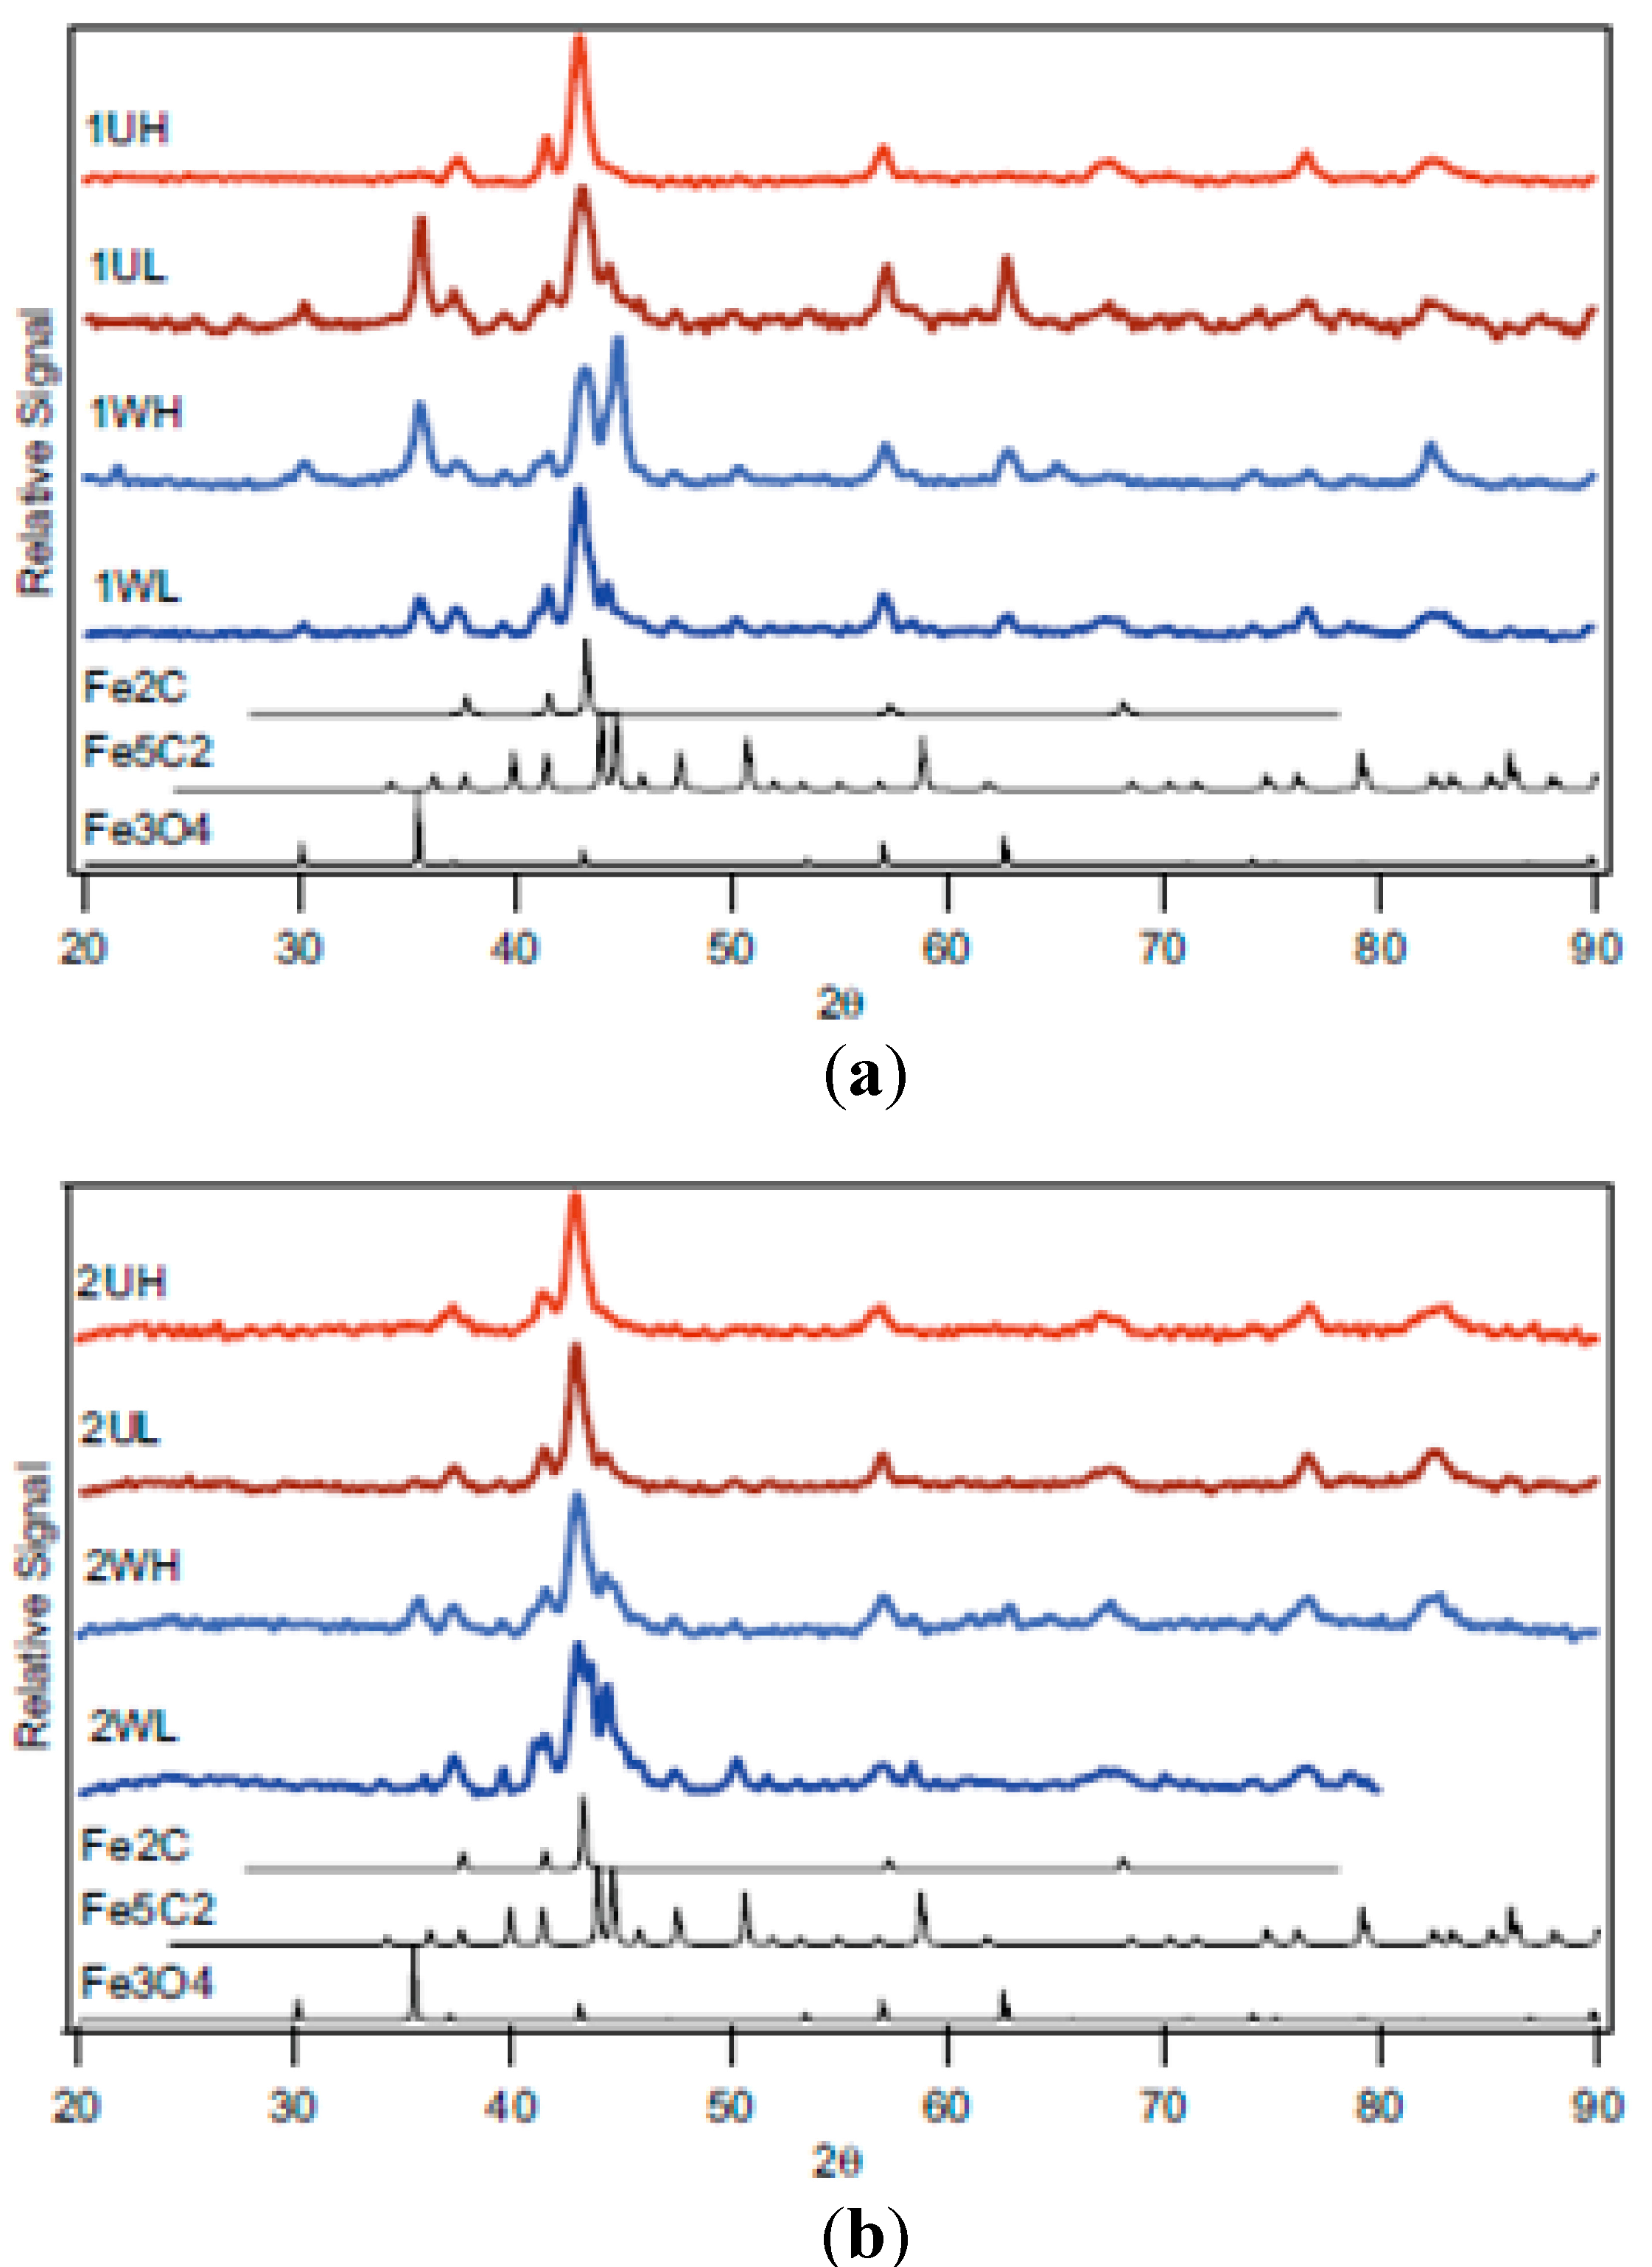
3.2.4. X-ray Diffraction (XRD)
3.2.5 Electron Microscope Analysis
3.2.6 Inductively Coupled Plasma (ICP) Analysis
3.3 Activity Tests
4. Conclusions
Acknowledgements
Author Contributions
Conflicts of Interest
References
- Schulz, H. Fischer-Tropsch Synthesis in a Modern Perspective; Wiley-VCH Verlag GmbH & Co. KGaA: WeinHeim, Germany, 2012; pp. 301–324. [Google Scholar]
- Bartholomew, C.H.; Farrauto, R.J. Fundamentals of Industrial Catalytic Processes; Wiley: Hoboken, U.S.A., 2011. [Google Scholar]
- Steynberg, A.P. Introduction to Fischer-Tropsch technology. Fischer-Tropsch Technol. 2004, 152, 1–63. [Google Scholar]
- Dry, M.E. Chapter 4; The Fischer-Tropsch Synthesis; Springer: Berlin, Germany, 1981; pp. 159–255. [Google Scholar]
- Bukur, D.B.; Lang, X.; Mukesh, D.; Zimmerman, W.H.; Rosynek, M.P.; Li, C.P. Binder Support Effects on the Activity and Selectivity of Iron Catalysts in the Fischer-Tropsch Synthesis. Ind. Eng. Chem. Res. 1990, 29, 1588–1599. [Google Scholar] [CrossRef]
- Bukur, D.B.; Koranne, M.; Lang, X.S.; Roa, K.R.P.M.; Huffman, G.P. Pretreatment Effect Studies with a Precipitated Iron Fischer-Tropsch Catalyst. Appl. Catal. A 1995, 126, 85–113. [Google Scholar] [CrossRef]
- Bukur, D.B.; Lang, X.S. A precipitated iron Fischer-Tropsch catalyst for synthesis gas conversion to liquid fuels. Natural Gas Convers. V 1998, 119, 113–118. [Google Scholar]
- Bukur, D.B.; Lang, X.S. Highly active and stable iron Fischer-Tropsch catalyst for synthesis gas conversion to liquid fuels. Ind. Eng. Chem. Res. 1999, 38, 3270–3275. [Google Scholar] [CrossRef]
- Li, S.Z.; Krishnamoorthy, S.; Li, A.W.; Meitzner, G.D.; Iglesia, E. Promoted iron-based catalysts for the Fischer-Tropsch synthesis: Design, synthesis, site densities, and catalytic properties. J. Catal. 2002, 206, 202–217. [Google Scholar] [CrossRef]
- Wu, B.; Bai, L.; Xiang, H.; Li, Y.-W.; Zhang, Z.; Zhong, B. An active iron catalyst containing sulfur for Fischer–Tropsch synthesis. Fuel 2004, 83, 205–212. [Google Scholar] [CrossRef]
- Yang, Y.; Xiang, H.W.; Zhang, R.L.; Zhong, B.; Li, Y.W. A highly active and stable Fe-Mn catalyst for slurry Fischer-Tropsch synthesis. Catal. Today 2005, 106, 170–175. [Google Scholar] [CrossRef]
- Ma, W.; Jacobs, G.; Graham, U.M.; Davis, B.H. Fischer-Tropsch Synthesis: Effect of K Loading on the Water-Gas Shift Reaction and Liquid Hydrocarbon Formation Rate over Precipitated Iron Catalysts. Top. Catal. 2014, 57, 561–571. [Google Scholar] [CrossRef]
- Park, J.-Y.; Lee, Y.-J.; Jun, K.-W.; Bae, J.W.; Viswanadham, N.; Kim, Y.H. Direct conversion of synthesis gas to light olefins using dual bed reactor. J. Ind. Eng. Chem. 2009, 15, 847–853. [Google Scholar] [CrossRef]
- Liu, S.F.; Liu, Q.Y.; Boerio-Goates, J.; Woodfield, B.F. Preparation of a wide array of ultra-high purity metals, metal oxides, and mixed metal oxides with uniform particle sizes from 1 nm to bulk. J. Adv. Mater. 2007, 39, 18–23. [Google Scholar] [CrossRef]
- Bartholomew, C.H.; Woodfield, B.F.; Huang, B.; Olsen, R.E.; Astle, L. Method for making highly porous, stable metal oxide with a controlled pore structure. WO2011119638A2, March 2011. [Google Scholar]
- Huang, B.; Bartholomew, C.H.; Smith, S.J.; Woodfield, B.F. Facile solvent-deficient synthesis of mesoporous γ-alumina with controlled pore structures. Microporous Mesoporous Mater. 2013, 165, 70–78. [Google Scholar] [CrossRef]
- Huang, B.; Bartholomew, C.H.; Woodfield, B.F. Facile structure-controlled synthesis of mesoporous γ-alumina: Effects of alcohols in precursor formation and calcination. Microporous Mesoporous Mater. 2013, 177, 37–46. [Google Scholar] [CrossRef]
- Huang, B.; Bartholomew, C.H.; Woodfield, B.F. Facile synthesis of mesoporous γ-alumina with tunable pore size: The effects of water to aluminum molar ratio in hydrolysis of aluminum alkoxides. Microporous Mesoporous Mater. 2014, 183, 37–47. [Google Scholar] [CrossRef]
- Khosravi Mardkhe, M.; Woodfield, B.; Bartholomew, C. Facile one-pot synthesis of a thermally stable silica-doped alumina having a large pore volume and large bimodal pores. In Proceedings of 247th ACS National Meeting, Dallas, TX, USA, 16–20 March 2014.
- Olsen, R.E.; Bartholomew, C.H.; Huang, B.Y.; Simmons, C.; Woodfield, B.F. Synthesis and characterization of pure and stabilized mesoporous anatase titanias. Microporous Mesoporous Mater 2014, 184, 7–14. [Google Scholar] [CrossRef]
- Smith, S.J.; Page, K.; Kim, H.; Campbell, B.J.; Boerio-Goates, J.; Woodfield, B.F. Novel synthesis and structural analysis of ferrihydrite. Inorg. Chem. 2012, 51, 6421–6424. [Google Scholar] [CrossRef] [PubMed]
- Brunner, K.M.; Harper, G.E.; Keyvanloo, K.; Woodfield, B.F.; Bartholomew, C.H.; Hecker, W.C. Preparation of Unsupported Iron Fischer-Tropsch Catalyst by Simple, Novel, Solvent Deficient Precipitation (SDP) Method. Energy Fuels 2015, 29, 1972–1977. [Google Scholar] [CrossRef]
- Brunner, K.M. Novel Iron Catalyst and Fixed-Bed Reactor Model for the Fischer-Tropsch Synthesis. Ph.D. Thesis, Brigham Young University, August 2012. [Google Scholar]
- Bukur, D.B.; Mukesh, D.; Patel, S.A.; Rosynek, M.P.; Zimmerman, W.H. Development and Process Evaluation of Improved Fischer-Tropsch Slurry Catalysts. Available online: http://www.fischer-tropsch.org/DOE/DOE_reports/80011/80011-1/80011-1_toc.htm (accessed on 23 July 2015).
- Ristić, M.; De Grave, E.; Musić, S.; Popović, S.; Orehovec, Z. Transformation of low crystalline ferrihydrite to α-Fe2O3 in the solid state. J. Mol. Struct. 2007, 834–836, 454–460. [Google Scholar] [CrossRef]
- Feng, Z.; Zhao, J.; Huggins, F.E.; Huffman, G.P. Agglomeration and Phase-Transition of a Nanophase Iron-Oxide Catalyst. J. Catal. 1993, 143, 510–519. [Google Scholar] [CrossRef]
- Eggleton, R.A.; Fitzpatrick, R.W. New Data and a Revised Structural Model for Ferrihydrite. Clays Clay Miner. 1988, 36, 111–124. [Google Scholar] [CrossRef]
- Zhao, J.M.; Huggins, F.E.; Feng, Z.; Huffman, G.P. Ferrihydrite - Surface-Structure and Its Effects on Phase-Transformation. Clays Clay Miner. 1994, 42, 737–746. [Google Scholar]
- Arakawa, H.; Bell, A.T. Effects of Potassium Promotion on the Activity and Selectivity of Iron Fischer-Tropsch Catalysts. Ind. Eng. Chem. Process Des. Dev. 1983, 22, 97–103. [Google Scholar] [CrossRef]
- Gregg, S.J.; Sing, K.S.W. Adsorption, Surface Area, and Porosity; Academic Press: San Diego, USA, 1991. [Google Scholar]
- Huang, B.; Bartholomew, C.H.; Woodfield, B.F. Improved calculations of pore size distribution for relatively large, irregular slit-shaped mesopore structure. Microporous Mesoporous Mater. 2014, 184, 112–121. [Google Scholar] [CrossRef]
- Jones, R.D.; Bartholomew, C.H. Improved Flow Technique for Measurement of Hydrogen Chemisorption on Metal-Catalysts. Appl. Catal. 1988, 39, 77–88. [Google Scholar] [CrossRef]
- Bukur, D.B.; Nowicki, Z.; Manne, R.K.; Lang, X. Activation studies with a precipitated iron catalysts for Fischer-Tropsch synthesis. II. Reaction studies. J. Catal. 1995, 155, 366–375. [Google Scholar] [CrossRef]
- Bukur, D.B.; Okabe, K.; Rosynek, M.P.; Li, C.; Wang, D.; Rao, K.R.P.M.; Huffman, G.P. Activation studies with a precipitated iron catalyst for Fischer-Tropsch synthesis. I. Characterization studies. J. Catal. 1995, 155, 353–365. [Google Scholar] [CrossRef]
- Eliason, S.A.; Bartholomew, C.H. Kinetics and Deactivation of Unpromoted and Potassium-Promoted Iron Fischer-Tropsch Catalysts at Low Pressure (1 Atm). Stud. Surf. Sci. Catal. 1991, 68, 211–218. [Google Scholar]
© 2015 by the authors; licensee MDPI, Basel, Switzerland. This article is an open access article distributed under the terms and conditions of the Creative Commons Attribution license (http://creativecommons.org/licenses/by/4.0/).
Share and Cite
Brunner, K.M.; Huang, B.; Woodfield, B.F.; Hecker, W.C. Iron Fischer-Tropsch Catalysts Prepared by Solvent-Deficient Precipitation (SDP): Effects of Washing, Promoter Addition Step, and Drying Temperature. Catalysts 2015, 5, 1352-1374. https://doi.org/10.3390/catal5031352
Brunner KM, Huang B, Woodfield BF, Hecker WC. Iron Fischer-Tropsch Catalysts Prepared by Solvent-Deficient Precipitation (SDP): Effects of Washing, Promoter Addition Step, and Drying Temperature. Catalysts. 2015; 5(3):1352-1374. https://doi.org/10.3390/catal5031352
Chicago/Turabian StyleBrunner, Kyle M., Baiyu Huang, Brian F. Woodfield, and William C. Hecker. 2015. "Iron Fischer-Tropsch Catalysts Prepared by Solvent-Deficient Precipitation (SDP): Effects of Washing, Promoter Addition Step, and Drying Temperature" Catalysts 5, no. 3: 1352-1374. https://doi.org/10.3390/catal5031352