Article

Non-Calorimetric Determination of the Adsorption Heat of Volatile Organic Compounds under Dynamic Conditions

Laboratory LGCVR, UAE/L01FST, Faculty of Sciences and Techniques, University Abdelmalek Essaadi, B.P. 416 Tangier, Morocco
*
Author to whom correspondence should be addressed.
Catalysts 2015, 5(2), 653-670; https://doi.org/10.3390/catal5020653
Submission received: 23 January 2015 / Revised: 9 April 2015 / Accepted: 14 April 2015 / Published: 22 April 2015
(This article belongs to the Special Issue Catalytic Removal of Volatile Organic Compounds)

Abstract

:
Avoiding strong chemical bonding, as indicated by lower heat of adsorption value, is among the selection criteria for Volatile Organic Compounds adsorbents. In this work, we highlight a non-calorimetric approach to estimating the energy of adsorption and desorption based on measurement of involved amounts, under dynamic conditions, with gaseous Fourier Transform Infrared spectroscopy. The collected data were used for obtaining adsorption heat values through the application of three different methods, namely, isosteric, temperature programmed desorption (TPD), and temperature-programmed adsorption equilibrium (TPAE). The resulting values were compared and discussed with the scope of turning determination of the heat of adsorption with non-calorimetric methods into a relevant decision making tool for designing cost-effective and safe operating of adsorption facilities.

1. Introduction

In the context of current interest in developing low cost and efficient adsorbents for Volatile Organic Compounds (VOCs)-contaminated effluent treatment, avoiding strong chemical bonding as indicated by lower heat of adsorption value is of interest with respect to adsorbent and/or adsorbate recycling [1,2,3]. This is also of importance for separation processes such as thermal swing adsorption (TSA) [4] or pressure swing adsorption (PSA) [5]. The involved physical adsorptions are mainly of a dispersive or electrostatic nature, depending on adsorbate molecules as well as on adsorbent surface functions and porosity [6]. For such adsorption process, the removal of VOCs-contaminated flow is usually achieved with adsorbent packed in a fixed bed. Thus, investigating the heat effects evolved during VOCs’ adsorption/desorption processes under dynamic conditions closer to real situations is of great importance. Micro-calorimetry, coupled with complementary techniques such as volumetry, IR spectroscopy, or chromatography, is reported to enable simultaneous determination of adsorbed/desorbed amounts as well as the evolved heat of adsorption [7]. The latter parameter can be determined, also, with non-calorimetric procedures through the application of the isosteric method and the Clausius–Clapeyron equation [8] or temperature-programmed desorption (TPD) [7]. It is worth noting that different heat values might be found according to calculation methods [1] and/or whether the experiments were carried out under static or dynamic conditions [9]. The application of the isosteric method based on the Clausius–Clapeyron equation using adsorption isotherms is known to be convenient for the assessment of the strength of physical bonding during adsorption [10], whereas for adsorption involving a significant irreversible fraction, the TPD method was found to be more appropriate [11]. However, attention has to be paid regarding experimental conditions that ensure minimal influence of diffusion and readsorption [12].
The aim of this work is to highlight an experimental approach based on measuring adsorbed and desorbed VOC amounts onto natural clay under dynamic conditions using Fourier transform infrared spectroscopy (FTIR). The collected data have been used to determine the heat effects during the adsorption process using isosteric and TPD methods. However, it should be pointed out that a lot of data need to be acquired in order to extract adsorption heat values. This drawback can be alleviated using the so-called temperature-programmed adsorption equilibrium (TPAE) method, as reported in [13]. The heat values are extracted by fitting the experimental curves corresponding to the variation of the equilibrium coverage with theoretical curves using an appropriate model. The values obtained with these three methods have been discussed in the case of o-xylene adsorption and desorption onto bentonite clay in comparison with commercial silica chosen as the reference material. The choice of these materials rather than activated carbon is mainly due to the exothermic phenomenon associated with values of VOC adsorption enthalpy, usually ranging between 40 and 90 kJ.mol−1 [4,14]. This can yield to high temperature increases depending on levels of treated VOC concentration and may induce significant local warming to start combustion of either the adsorbate or the adsorbent itself, particularly if activated carbon is used [15,16]. Thus additional consideration of safety conditions is required for appropriate engineering and safe operating of adsorption facilities, which in turn needs accurate knowledge of the evolved heat effect values. Therefore, the choice of mineral adsorbent such as clays might be of interest not only with respect to efficiency/cost ratio but also for safety reasons.

2. Results and Discussion

2.1. Materials

The natural material (bentonite) tested in the present work was extracted from deposits located in the north of Morocco (Nador region). It was used with minimal processing and compared to a commercial material (SiO2 aerosil-200 from Degussa Corp., Düsseldorf, Germany)

2.2. Textural and Chemical Characterization

The textural properties (surface areas and pore volumes) were measured with a Micromeritics ASAP 2020 apparatus using nitrogen adsorption and desorption isotherms at 77 K.
The chemical composition analysis has been carried out with an X-ray fluorescence spectrometer (Brucker S4 Pionner).

2.3. Measurement of Dynamical Adsorption and Desorption Amounts

Dynamic adsorption/desorption experiments have been carried out under atmospheric pressure using the experimental apparatus as reported elsewhere [17,18]. Prior to adsorption, a model gaseous mixture with a given concentration of o-xylene vapor has been prepared by injection, using a syringe pump, into a controlled nitrogen flow. All lines and valves of the experimental devices have been permanently heated. The resulting o-xylene concentration is expressed as molar fraction Cin, corresponding to P/Patm, where P is the vapor pressure of o-xylene and Patm the atmospheric pressure with Patm = 760 torr. Note that in order to avoid vapor condensation, o-xylene partial pressure has been always maintained lower than its vapor pressure value at adsorption temperature. The studied sample (1g of bentonite or 0.3 g of silica) contained in quartz micro-reactor (U-type) was first pre-treated under 100 cm3.min-1 of pure nitrogen at atmospheric pressure and 473 K for 2 h, then cooled to adsorption temperature Ta. The same samples have been used for several experiments and pretreated before each testing. Adsorption has been carried out under o-xylene/N2 mixture until saturation, followed by isothermal desorption under pure N2 flow until o-xylene concentration in N2 flow at the reactor outlet reached zero. Subsequent linear heating has been carried out under nitrogen flow in order to achieve complete desorption of the remaining adsorbed species according to the temperature-programmed desorption (TPD) method.
Another type of experiment, the so-called temperature-programmed adsorption equilibrium (TPAE) method, has been carried out following the procedure reported in details in previous work [13]. It should be pointed out that TPAE experiments were performed using the above operating procedure and conditions to reach adsorption equilibrium. Afterwards, the samples were subjected to heating with different rate (0.5 K/min) under an o-xylene/N2 mixture, which is different from TPD protocol. This approach allows us to maintain quasi-constant adsorption pressure during desorption o-xylene while yielding to progressive lowering of adsorption equilibrium coverage. Finally, total removal of o-xylene adsorbed species is completed at higher temperature by switching o-xylene/N2 to pure N2 flow.
During all these experiments, the o-xylene concentration in the gas stream at the reactor outlet has been monitored by FTIR Jasco 410 spectrometer (resolution of 4 cm−1) using a homemade Pyrex gas cell equipped with CaF2 windows. This technique conveys multiple advantages offered by FTIR instrumentation, such as rapid spectra acquisition and easy quantitative analysis, especially when there are no IR bands overlapping [19,20]. The molar fraction of o-xylene has been obtained by integration of its IR bands located between 2700 and 3200 cm−1, according to the Beer–Lambert law relating IR bands area to concentration [21,22]. Preliminary calibration with o-xylene/N2 mixtures of known composition has been carried out using reactor bypass. The FTIR detector response has been found to produce a linear plot in the studied concentration range, permitting correlation of IR bands area with o-xylene concentration. On the other hand, the use of FTIR has an additional advantage associated with eventual detection of new IR bands, corresponding to the formation of eventual new species in the gas stream indicating adsorbate degradation during the adsorption or desorption steps.

3. Results and Discussion

3.1. Textural and Chemical Characterization

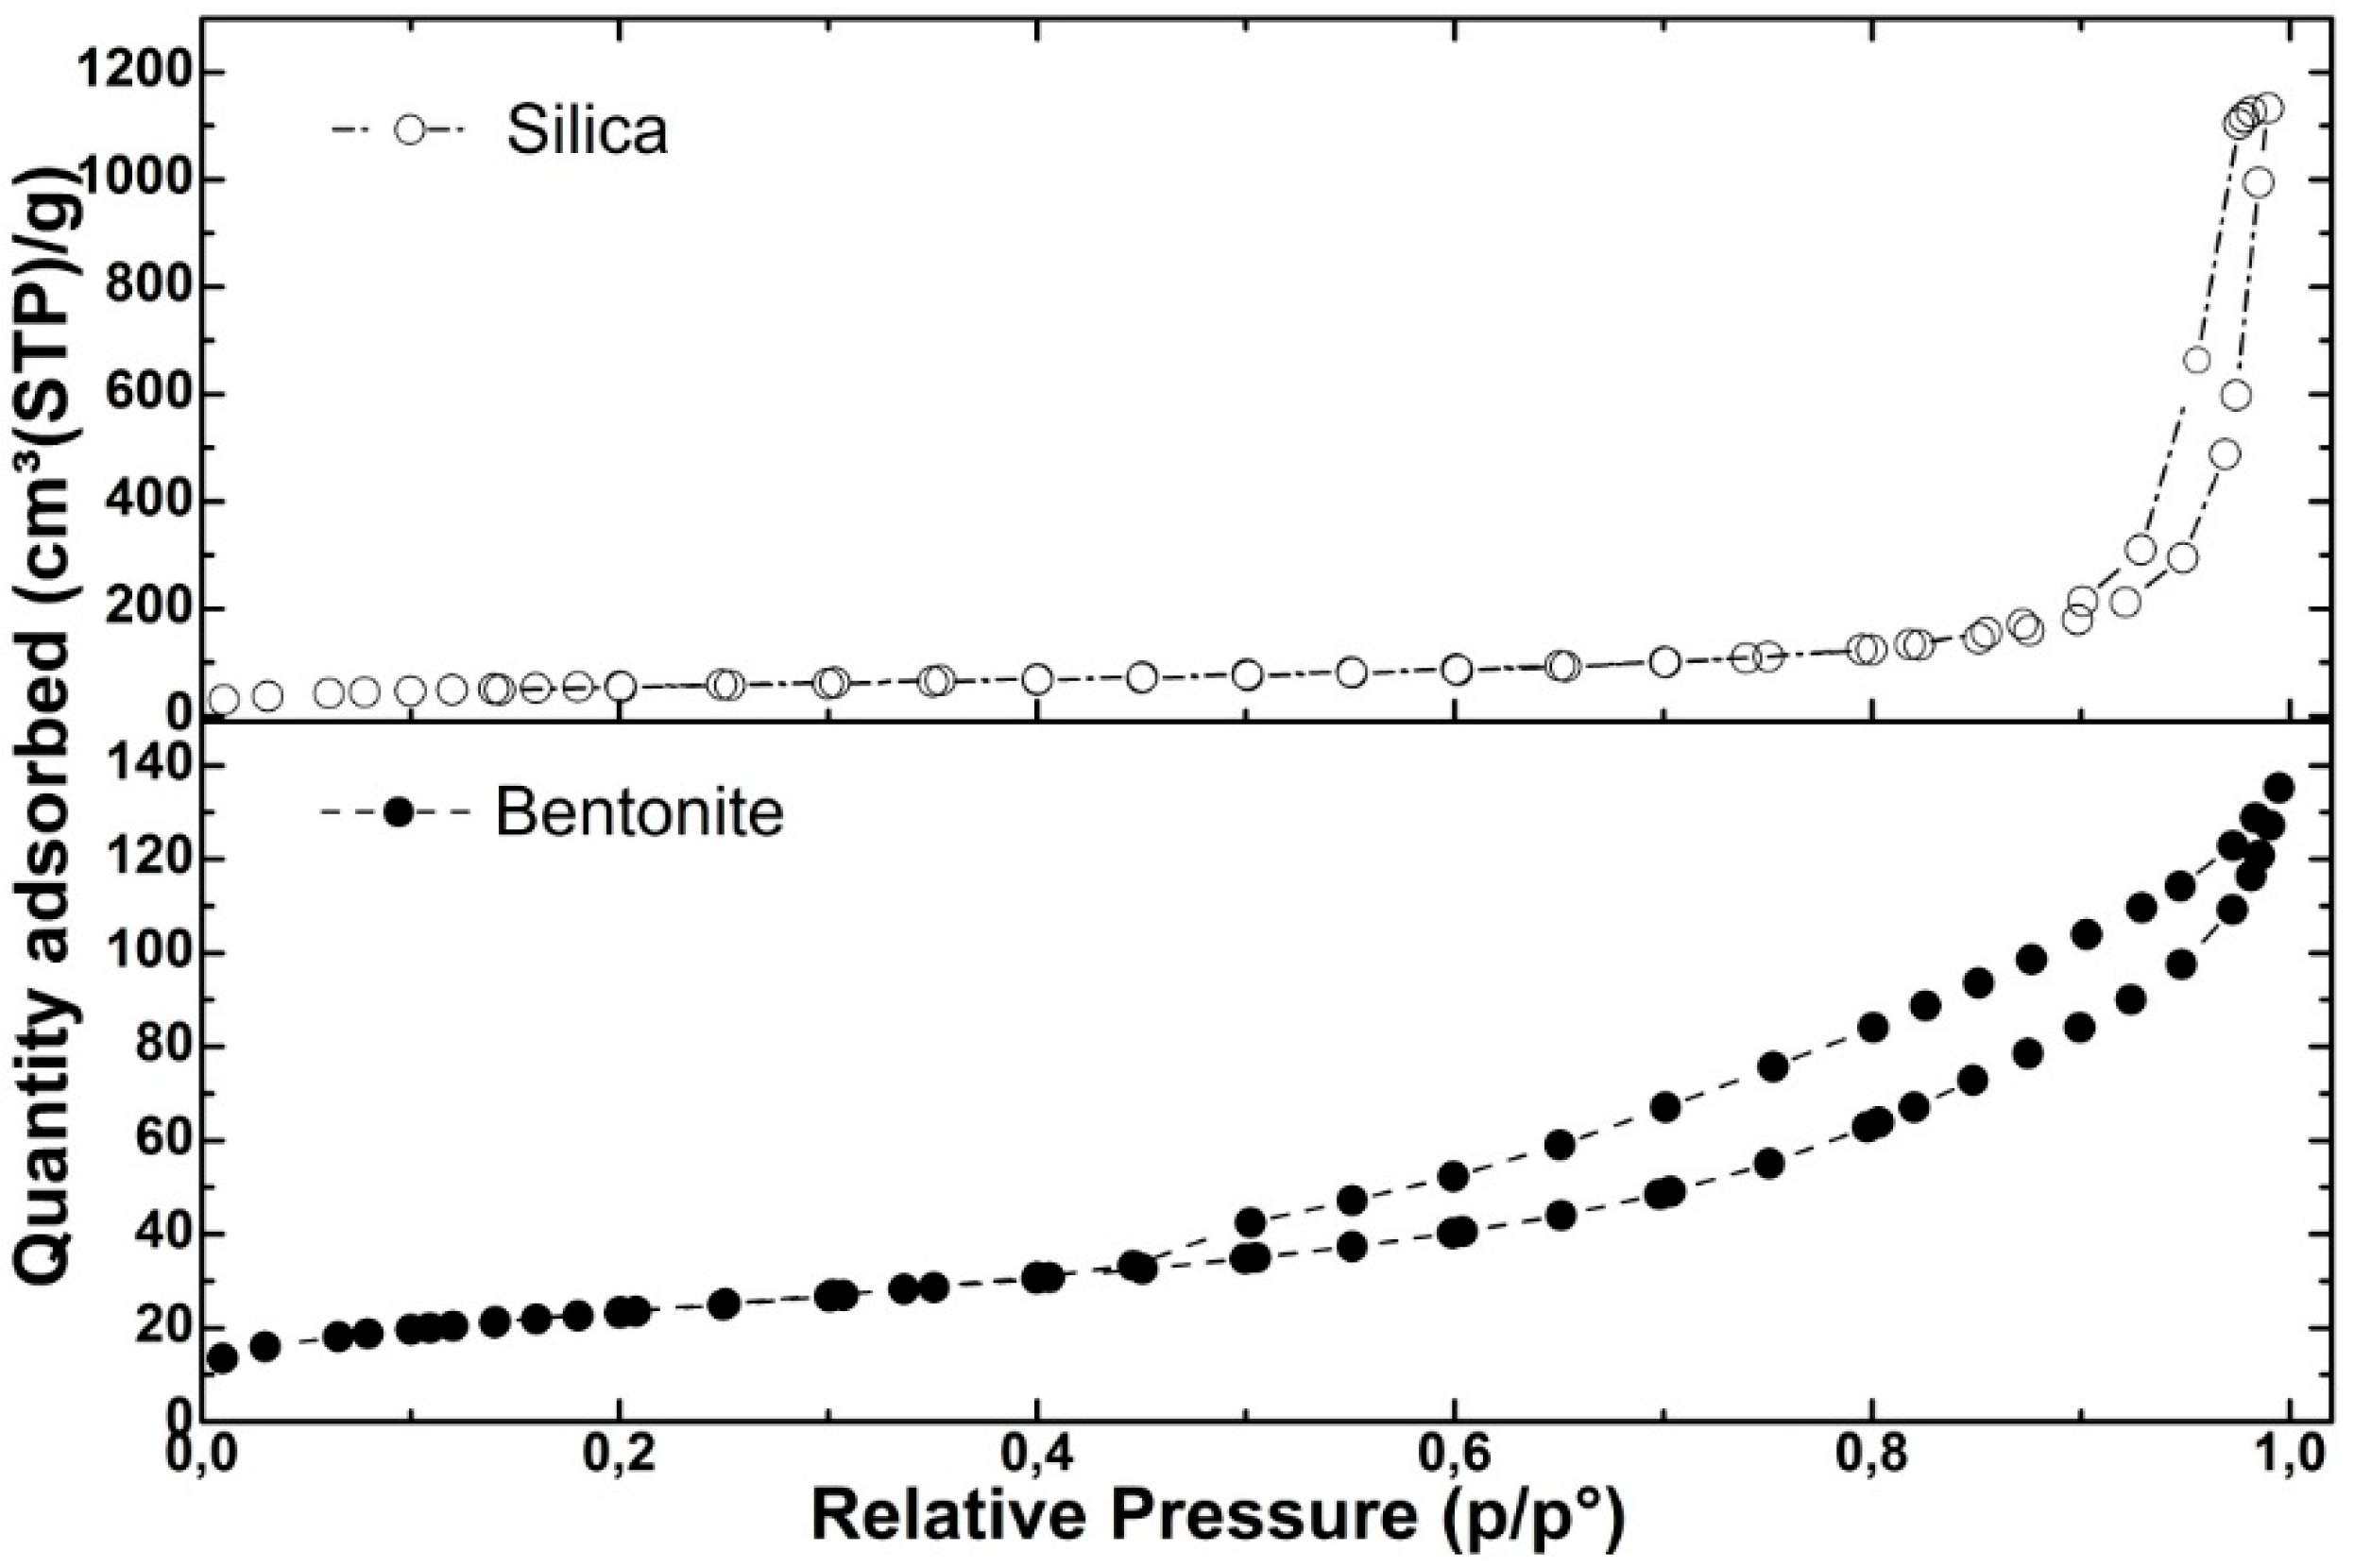
3.1.1. BET Surface Area and Porosity

The N2 adsorption/desorption isotherms obtained at 77 K with bentonite and silica samples (Figure 1) can be considered as type II according to Rouquerol et al. [23]. In the case of silica the Type II character seems to be associated with adsorption on both external surface as well as some interparticles capillary condensation [24]. As for bentonite clay, the displayed hysteresis loop is characteristic of the mesopore network, corresponding more likely to pseudo-Type II (Type IIb), according to Gregg and Sing [25], rather than Type IV, as also reported in the literature [26,27,28]. The specific surface area SBET has been calculated according to the BET equation using the linear part in the range of 0.05 < P/Patm < 0.3, while the total porous volume Vt has been estimated from the adsorption at P/Patm = 0.98. The resulting BET surface area has been found to be 201.7 cm2/g and 83.5 cm2/g, respectively, for silica and bentonite. The microporous volume Vmic values have been extracted from the interception of t-plot line and the mesopore volume (Vmeso) value has been obtained by subtracting the microporous volume from the total porous volume (Vt). The obtained values, as summarized in Table 1, are consistent with aforementioned features confirming the presence of negligible microporosity and hysteresis loop associated with some interparticles’ capillary condensation. Note that in the case of isotherms obtained with bentonite, the Type IIb is characteristic of platy particles assemblage such as that usually present in clay mineral.
Table 1. Textural parameters of bentonite and silica adsorbents.
SolidsSBET(m2/g)Vt a(cm3(STP)/g)Vmeso b(cm3(STP)/g)Vmic c(cm3(STP)/g)Sext d(m2/g)Smic e(m2/g)
Bentonite83.50.2130.21130.001781.022.469
SiO2201.70.4300.42980.0002198.531.47
a Total pore volume; b Mesoporous volume; c Microporous volume; d External specific surface and e Specific micropore surface area.
Figure 1. Nitrogen adsorption/desorption isotherms obtained with bentonite and silica at 77 K.
Catalysts 05 00653 g001

3.1.2. Chemical Composition

The chemical composition of studied bentonite clay as revealed by X-ray fluorescence (Brucker S4 Piooner spectrometer) indicated a higher content of SiO2 in bentonite (about 74%) in addition to the presence of magnesium oxide with traces of sodium, copper, titanium, and zinc oxides (in Table 2). This justifies the choice of silica as a reference material for comparison with natural clay in the context of investigating a VOC adsorbent associating lower cost and efficiency, which is a challenging issue for Volatile Organic Compounds (VOCs) removal by adsorption.
Table 2. Chemical composition (wt. %) of bentonite and commercial silica samples
SolidsSiO2Al2O3CaOMgOFe2O3Na2OK2OSO3ClCuOTiO2ZnO
Bentonite7413.15.362.91.881.10.520.380.320.130.120.1
SiO299.40.0530.025-0.017-0.0230.20.059---

3.2. Dynamic Adsorption/Desorption

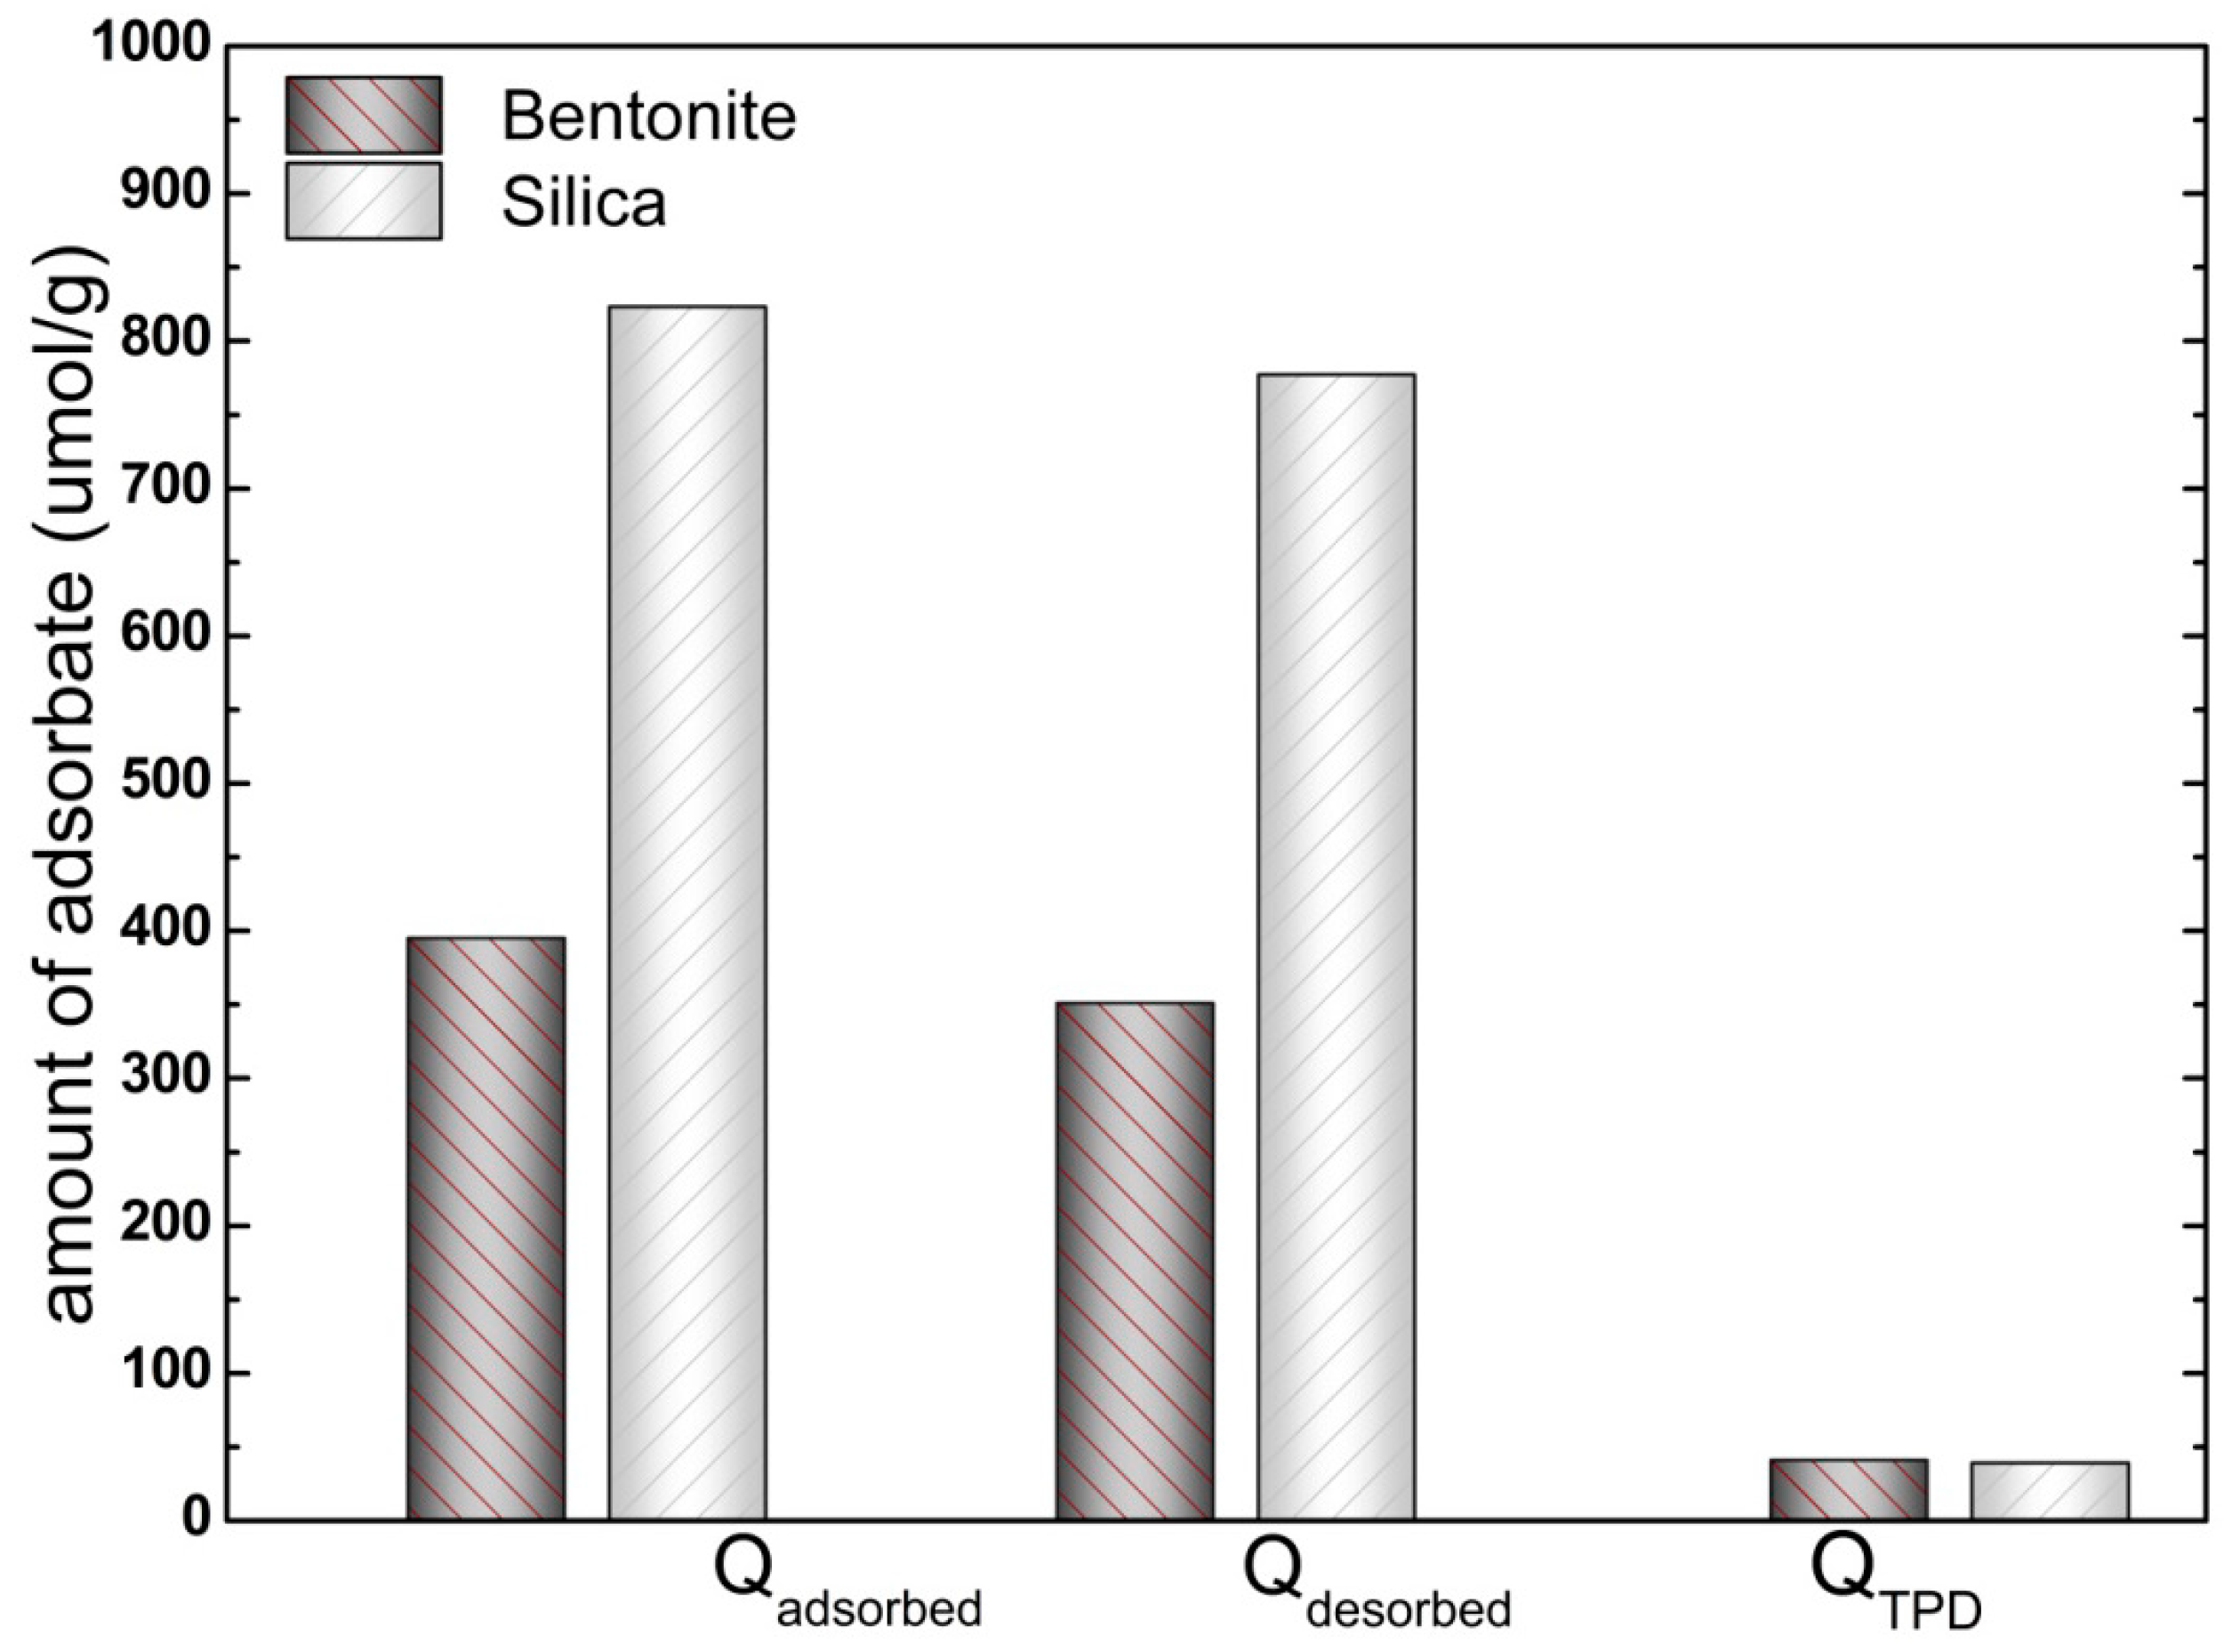
3.2.1. Determination of Adsorbed and Desorbed Amounts

The evolution of o-xylene concentration at the reactor outlet (Cout) obtained from FTIR spectra enabled the monitoring of adsorbent loading as function of time during adsorption (i.e., breakthrough curve) and desorption. Figure 2 shows the variation profile of the of o-xylene concentration in the gas flow at the reactor outlet, represented as relative values (Cout/Cin) during the aforementioned cycle (adsorption at 300K until saturation (A), followed by isothermal desorption (B) then TPD (C)). The adsorbed amounts corresponding to saturation have been determined by the numerical integration of the breakthrough curve area (part A of Figure 2) according to Equation (1), where F is the gas flow rate (cm3.min−1), Cin and Cout correspond to the inlet and outlet concentrations of VOC in flow gas, Vm is the molar volume, m is the weight of solid in the reactor (g), and ta is the time at adsorption saturation:
Q a d s = F × C i n V m × m 0 t a ( 1 C o u t C i n ) d t
Accordingly, the studied concentration of o-xylene in N2 corresponding to 0.395% yields to Qads values of 395 and 823 μmol/g, respectively, for bentonite and silica. Note that the bentonite loading capacity was lower than that of silica due to its lower BET surface area and total pore volume. These values are therefore higher than those reported in the literature for adsorbents of silicate type; e.g., 111, 61, 80, and 165μmol/g obtained for the adsorption of 3 torr of o-xylene (corresponds to 0.395% o-xylene/N2) at 298 K respectively for zeolite of MCM-22 type [29], Webster soil (2.6 m2/g) [30], the kaolinite (13.6 m2/g) [30] and Webster HP (33 m2/g) [30]. In the case of higher surface area adsorbents such as activated carbons—AC40 (1300 m2/g) [31] and CA (990 m2/g) [32]—and zeolite types—Al-Meso 100 (915 m2/g) [33], UL-ZSM5-100-2 (840 m2/g) [33], and AlPO4-5 [34]—, the reported o-xylene loading capacities are 4666, 1000, 2800, 1800, and 1166 μmol/g, respectively, which are higher than those obtained with bentonite and silica. Nevertheless, the expression of these values in μmol/m2, considering their higher specific surface areas, yields to 3.5, 1, 3, and 2.6 μmol/m2 for AC40, CA, zeolite types Al-Meso 100, UL-ZSM5-100-2, and AlPO4-5, respectively, which are lower when compared to the adsorption capacities obtained for bentonite (4.7 μmol/m2) and silica (4.1 μmol/m2). Furthermore, taking into account the apparent density values of 550 and 50 kg/m3, respectively, for bentonite and silica [3], the expression of adsorptive capacity values in μmol/m3 becomes even better by a factor of 7 in favor of bentonite as compared to silica, which permits significant reduction in terms of adsorbent bed volume.
On the other hand, the amount involved in desorption were determined first during the isothermal desorption step conducted following the sorbent saturation by switching the o-xylene/N2 mixture to pure nitrogen flow. This led to a gradual decrease of the o-xylene IR bands as a result of its concentration decrease at the reactor outlet, following the profile showed in part B of Figure 2. The application of Equation (2) determined Qdes values of 351 and 777 μmol/g, respectively, for bentonite and silica, corresponding to the weakly adsorbed fraction released during isothermal desorption:
Q d e s = F V m × m ( t a t b C O u t d t )
Here, ta and tb correspond to the starting and ending times of isothermal desorption. It is to be noted that although the o-xylene concentration reached zero, the calculated desorbed fraction represents only 88% and 94% of the total adsorbed amount, respectively, for bentonite and silica. The remaining adsorbed o-xylene is likely more strongly retained and requires subsequent heating under N2 flow according to TPD method. The integration of the resulting TPD curve area (part C in Figure 2) using Equation (3) permits us to obtain QDTP values of 50 and 39 μmol/g, respectively, for bentonite silica:
Q D T P = F V m × m ( t b t c C O u t d t )
These adsorbed amounts are apparently associated with slow diffusion; the o-xylene fraction was adsorbed in the less accessible porosity of the inner interparticle space, as discussed in our previous work [9]. Therefore, the data corresponding to the total adsorbed amount (Qads) have been found to fit the mass balance equation (QadsQdes + QDTP) with a precision around 2% (Figure 3). On the other hand, it should be pointed out that the repetition of the cycles of adsorption/desorption under N2 flow, at least during three successive regeneration cycles, yields to reproducible results without significant alteration of the adsorptive properties.
Figure 2. Profile of o-xylene concentration variation at reactor outlet obtained with bentonite clay during the different experiment steps: isothermal adsorption then desorption followed by DTP.
Catalysts 05 00653 g002
Figure 3. Amount of o-xylene adsorbed and desorbed obtained with bentonite and silica adsorbents using a 0.395% o-xylene/N2 mixture.
Catalysts 05 00653 g003
The same experimental device has been used to determine the adsorbed and desorbed amounts following the TPAE methodology previously reported [12,29]. Note that the design of the TPAE experiments is simpler than TPD, particularly in terms of the required number of experiments [35]. Furthermore, there is no need for perquisite of assumption concerning the validity of experimental conditions with minimal contribution of diffusion and readsorption. The TPAE experiments were conducted with a mixture of 0.395% o-xylene/N2 at 300 K until reaching adsorption equilibrium, then the adsorption temperature (Ta) was slightly increased, with a ramp of 0.5 K/min with bentonite and 1 K/min in the case of silica, in order to allow a quasi-constant partial pressure of o-xylene (Pa). Finally, isothermal desorption is carried out under nitrogen flow to ensure whether o-xylene is fully desorbed. Figure 4 shows the o-xylene evolution profile at the reactor outlet during different steps of the TPAE experiment conducted with bentonite (a similar profile was obtained with silica and not shown here). The desorbed amount as indicated by a positive peak is determined using Equation (4):
Q T P A E = F V m × m t a t b ( C t 0 C t e q ) d t
Accordingly, the numerical integration of the peak area indicated in part B of Figure 4 yields QTPAE values of 358.81 μmol/g and 705.75 μmol/g, respectively, for bentonite and silica.
Figure 4. Evolution of o-xylene concentration at the reactor outlet obtained with bentonite clay during TPAE experiments using a 0.395% o-xylene/N2 mixture.
Catalysts 05 00653 g004

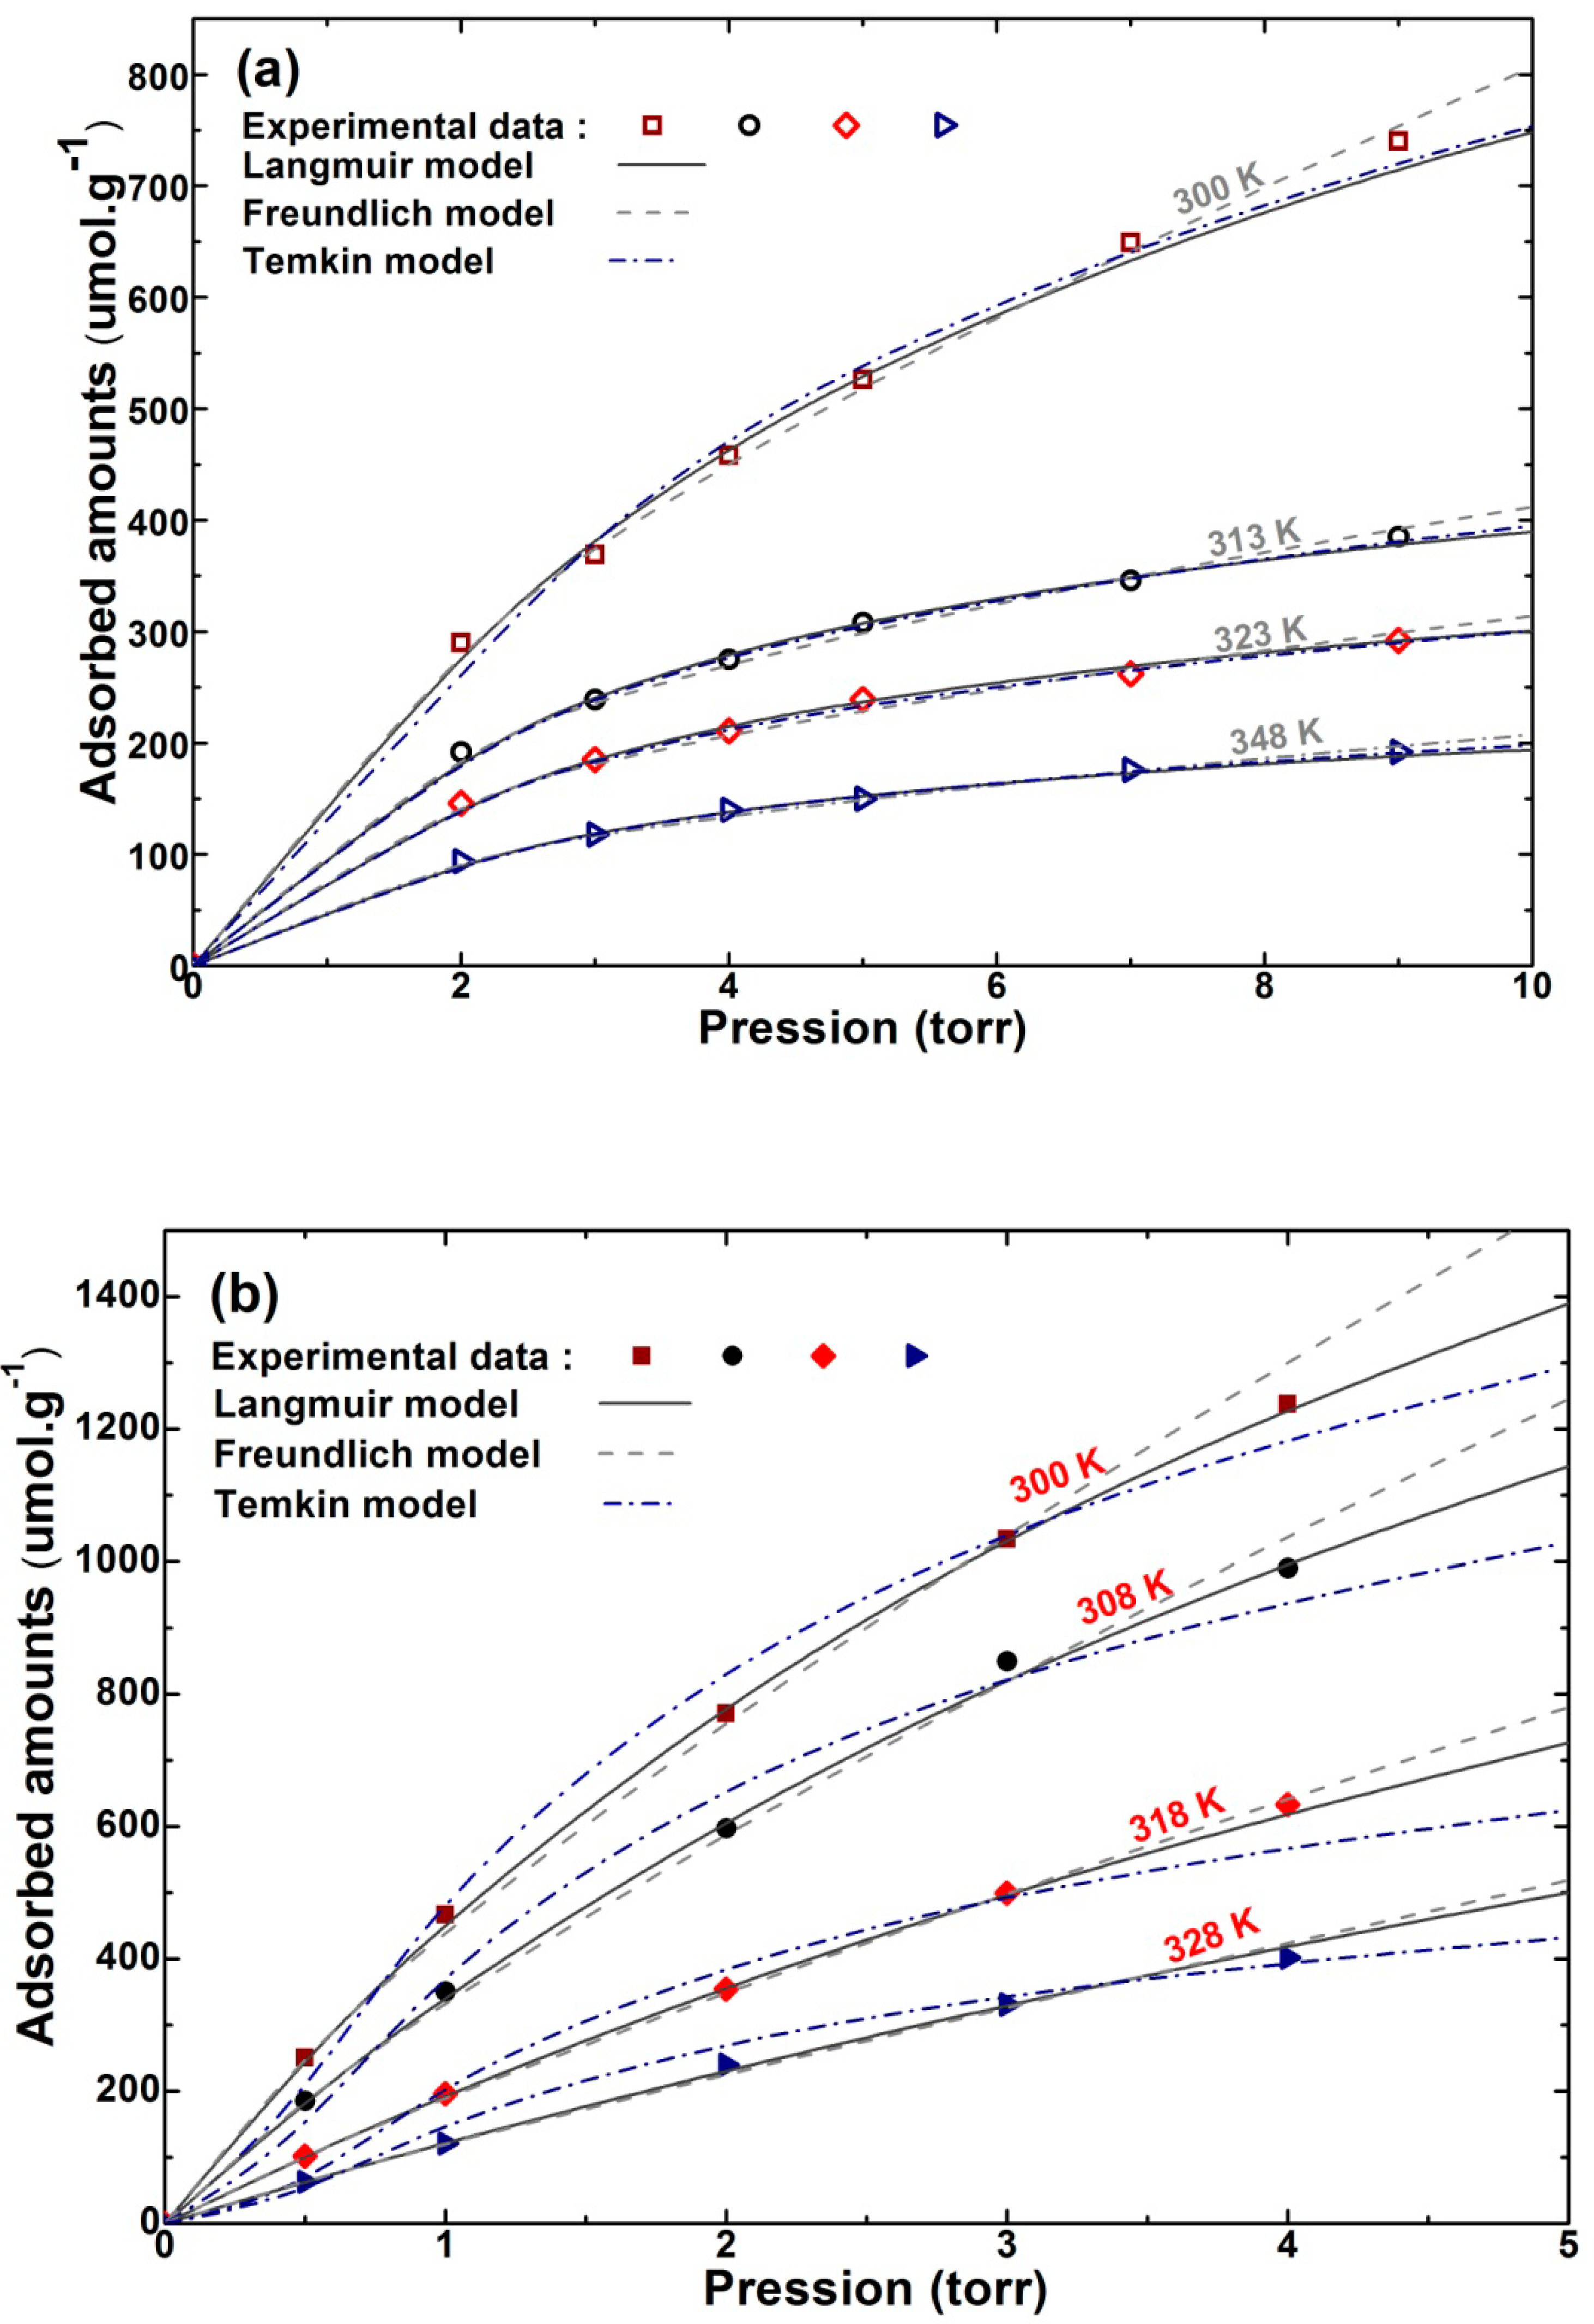
3.2.2. Adsorption Isotherms

This section is devoted to the investigation of isotherms obtained at temperatures ranging between 300 and 348 K using data corresponding to the adsorption equilibrium loading data obtained as described in Section 3.2.1. The used data has been collected under partial pressures of o-xylene ranging between 0.5 and 9 torr permitted by the available instrumentation used to generate partial pressure of o-xylene vapor in the N2 flow. Note that considerable experimental effort has been devoted in order to collect the saturation capacity data needed for the adsorption isotherms shown in Figure 5, which constitutes the major drawback of the adopted approach. The resulting isotherms have been fitted by Langmuir, Freundlich, and Temkin models according to the nonlinear regression method using Mathcad software. In the case of the Langmuir model [36], two parameters have been used as expressed by Equation (5):
Q = Q m b P 1 + b P
where Q is the adsorbed loading (μmol/g), Qm is the adsorbed amount corresponding to monolayer(μmol/g), P is the adsorbate pressure (torr), and b is the empirical isotherm parameter (torr−1). The values of the constant b and Qm have been obtained, respectively, from the intercepts and the slopes.
Figure 5. (a) Experimental and modeled adsorption isotherms obtained with bentonite clay at different temperatures. (b) Experimental and Modeled adsorption isotherms obtained with silica at different temperatures.
Catalysts 05 00653 g005
Concerning the Freundlich model [37], the empirical expression (Equation 6) has been used:
Q = k P 1 n
where Q is the adsorbed amount, k is the equilibrium constant ,and n is an empirical constant (with n > 1).Whereas for the Temkin model [38], the following equation has been used:
Q = a . L n P + c
where a is a constant depending on Temperature T and b is a constant related to the heat of adsorption.
Table 3. Langmuir, Freundlich, and Temkin parameters for adsorption of natural and commercial adsorbents.
SolidsAdsorption TemperaturesAdsorption amountsLangmuir parametersFreundlich parametersTemkin parameters
T(K)Qm expQmbR2kNR2acR2
Bentonite30083112610.290.9992560.550.9972961670.991
3133855260.2850.9981430.4590.9931281000.998
3232924080.2810.9981100.4530.98595800.997
3481922640.2760.998700.4740.9965470.998
SiO2300129828070.310.990851.500.7130.978857.6610440.996
30897123870.290.997500.700.6940.986493.71581.10.993
31863311320.280.994230.900.6900.986225.80267.420.990
3284026310.2670.994130.450.6790.991127.491490.986
Qexp(μmol/g); Qm(μmol/g); b (torr−1); k (torr.μmol/g); n (torr−1.μmol.g−1), a (torr−1. µmol. g−1), and c in µmol/g.
Table 3 summaries the fitted parameter b at different T as well as Qm and Qmexp values corresponding to adsorbent loading at monolayer and at saturation measured using an experimental break-through curve. Qm has been determined using the linearzed form of the Langmuir equation and values of adsorbed o-xylene monolayer has been extracted using the best fitted experimental data. As shown, the resulting values remain lower than those corresponding to the measured maximal adsorption capacity, meaning that the monolayer is not reached at the studied experimental conditions. On the other hand, the fittings parameters reported in Table 3 show relative deviations less than 3%, suggesting that the Langmuir model yields a better fit of o-xylene adsorption on bentonite and silica [36].

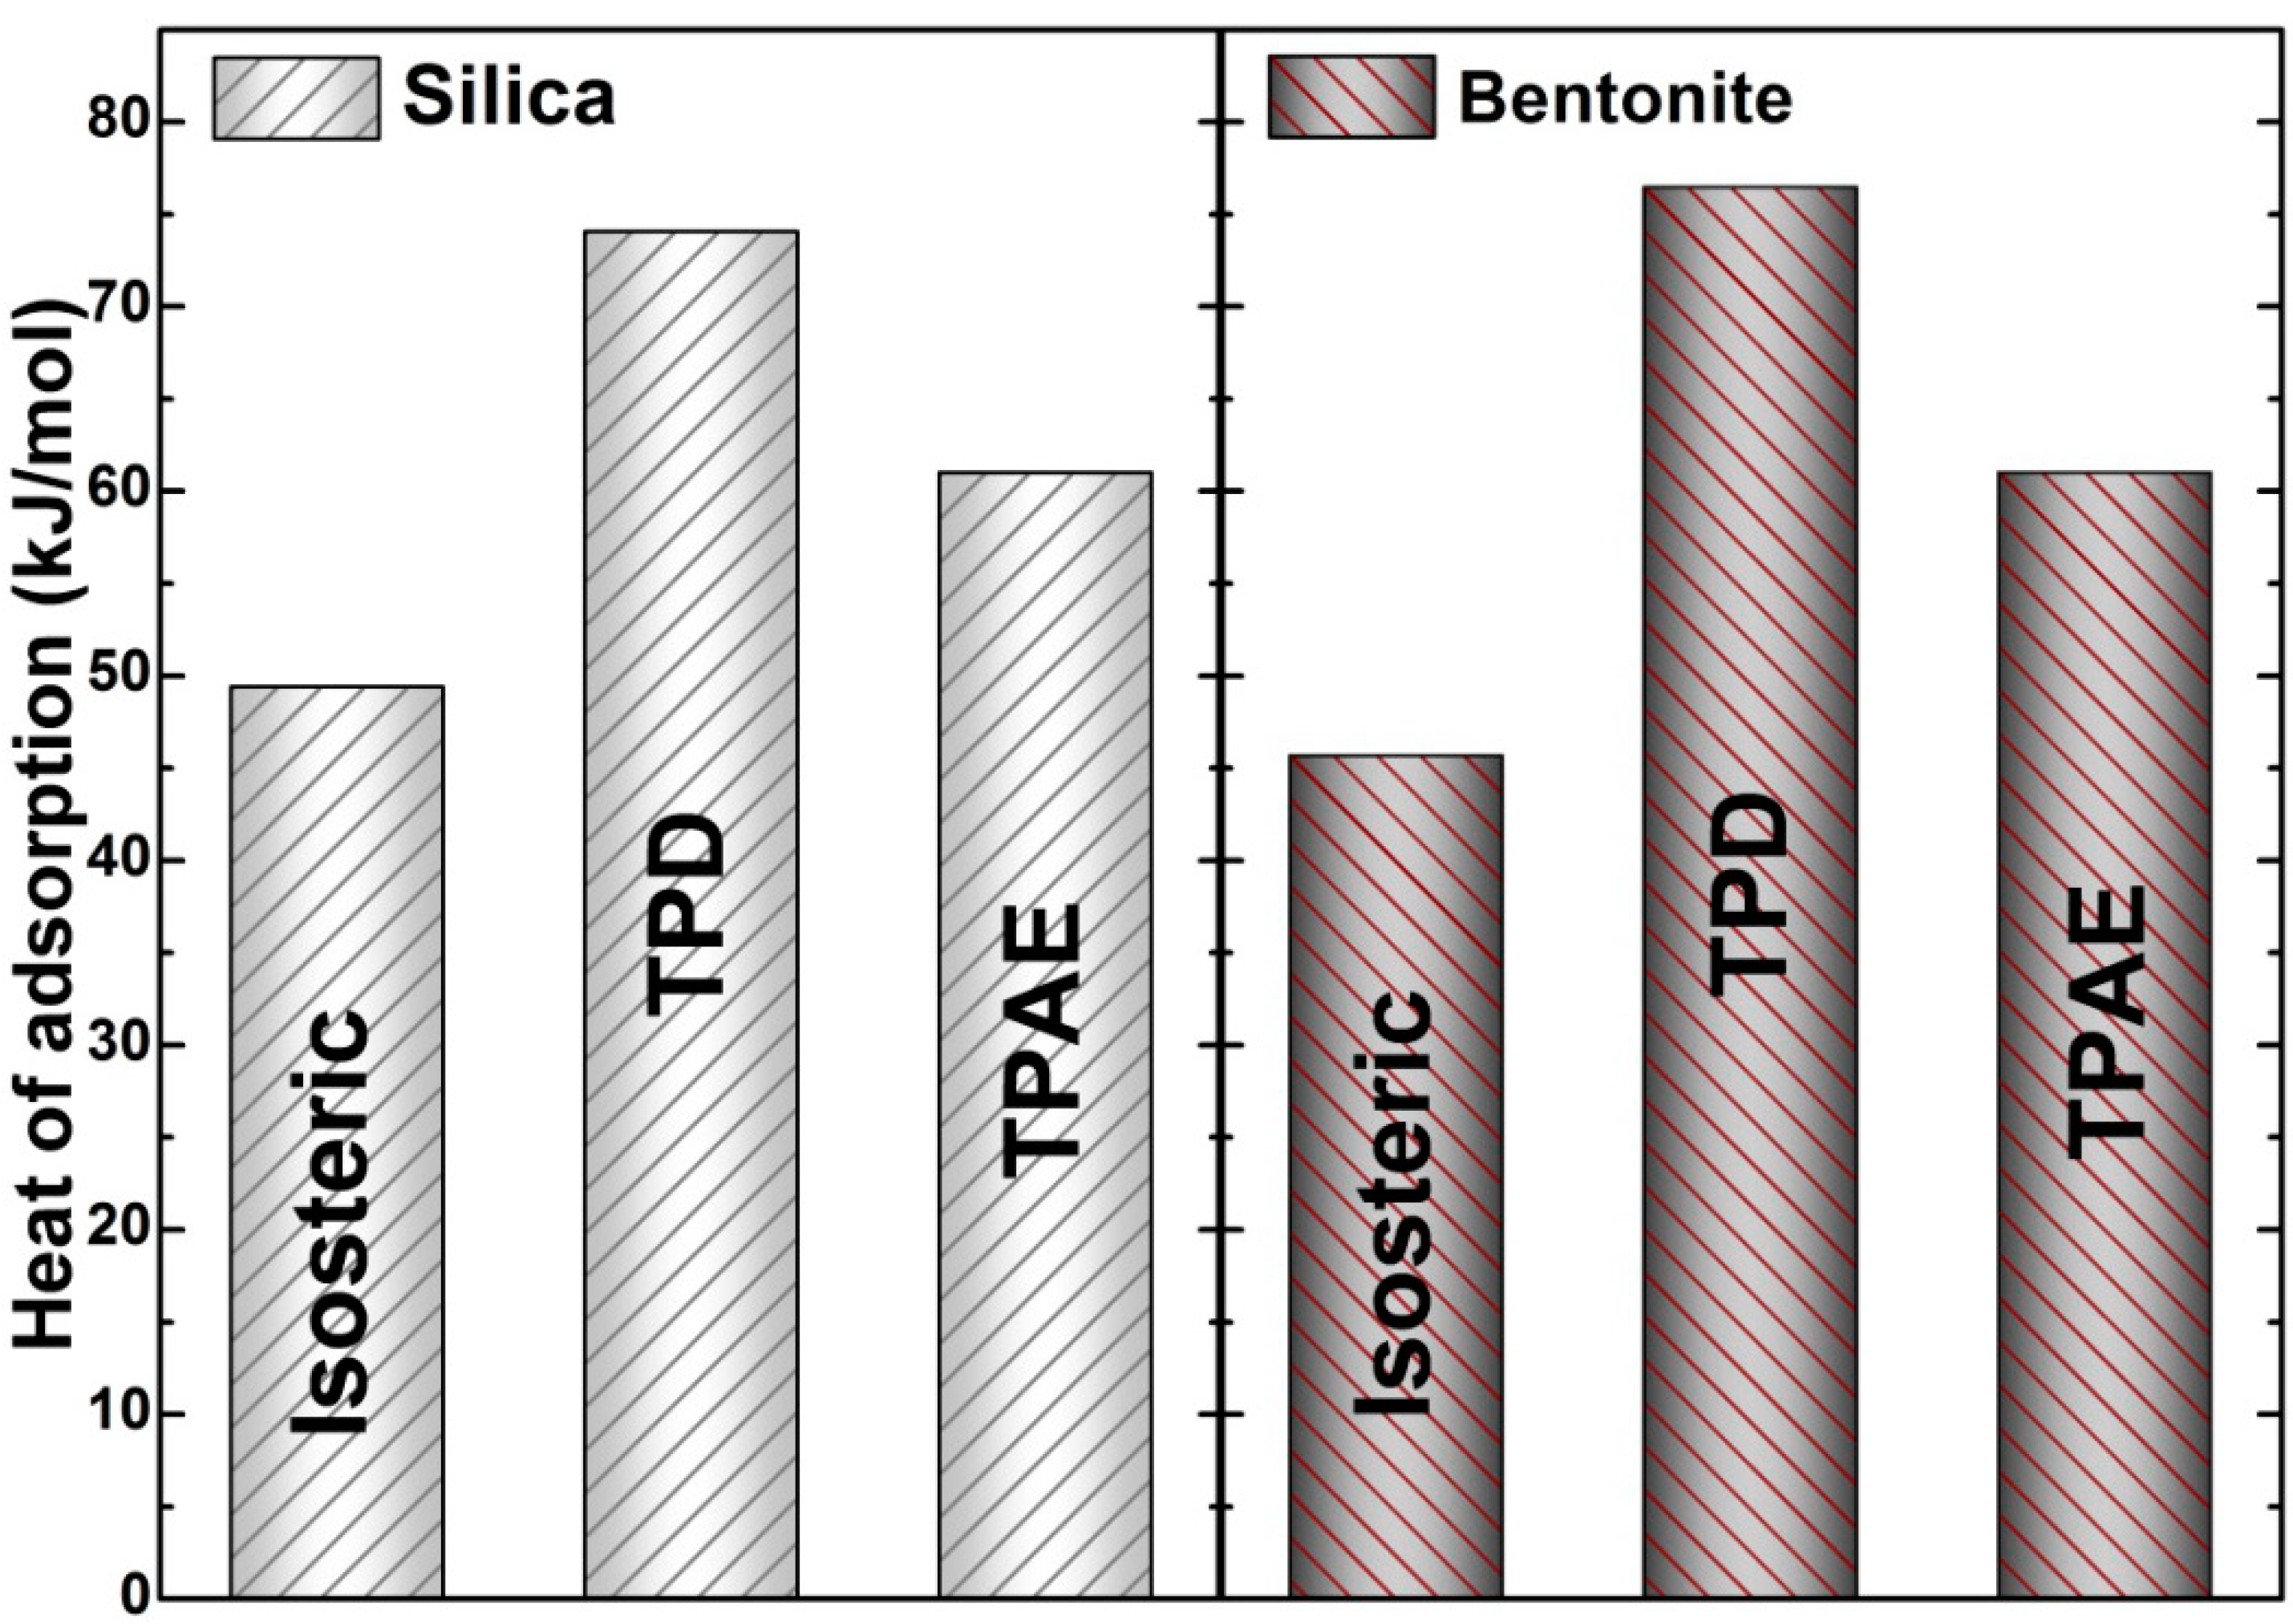
3.3. Heat of Adsorption Determination

3.3.1. Application of the Isosteric Heat Method

One of the classical non-calorimetric methods for determining the adsorption heat (ΔHads) is based on the application of Clausius–Clapeyron equation, seen here as Equation (8):
Δ H ads = R ( ln P ( 1 T ) )
where R is the perfect gas constant and P and T correspond to the partial pressure and temperature at equilibrium, respectively.
The method consists of converting isotherm data (Figure 5) into isosteres by plotting ln P = f(1/T) at constant loading and the value of isosteric heat ΔHads is extracted from the slope of the obtained straight line. This approach does not require assumptions concerning fitting the experimental data with any model. However, it is necessary to observe very cautiously whether the resulting isosteres match with straight lines, which relies strongly on the experimental conditions’ accuracy. As reported, an error of ± 2K on temperature measurement may result in incertitude of ± 8 kJ/mol for isosteric heat value [39]. On the other hand, the application of this procedure for different coverage permits us to follow the o-xylene isosteric heat variation adsorption as a function of θ (θ = Qads/Qm), where Qads is the adsorbed amount for a given adsorption pressure and Qm is the loading capacity at monolayer calculated as previously indicated. Thus, heat of adsorption values ranging from 45.67 to 41.57 kJ/mol and 49.39 to 47.97 kJ/mol have been found for bentonite and silica, respectively, for the corresponding surface coverage indicated in Table 4. These values are slightly higher than the heat of vaporization for o-xylene (43.43 kJ/mol) [9] and characteristic of weaker bonding, which is considered as an important advantage in terms of easier regeneration. Note that the small decrease observed for increased adsorbate coverage, illustrated in Table 4, is usually attributed to the effect of repulsive interactions between the adsorbed molecules, so-called “adsorbat–adsorbate interaction” [3].
Table 4. Isosteric heats of adsorption at different recovery rates of bentonite and silica.
Surface coverageBentoniteSilica
Recovery rateIsosteric heat (kJ/mol)Isosteric heat (kJ/mol)
θ = 0.1545.67249.395
θ = 0.1743.47548.572
θ = 0.2242.7348.057
θ = 0.2741.56747.974

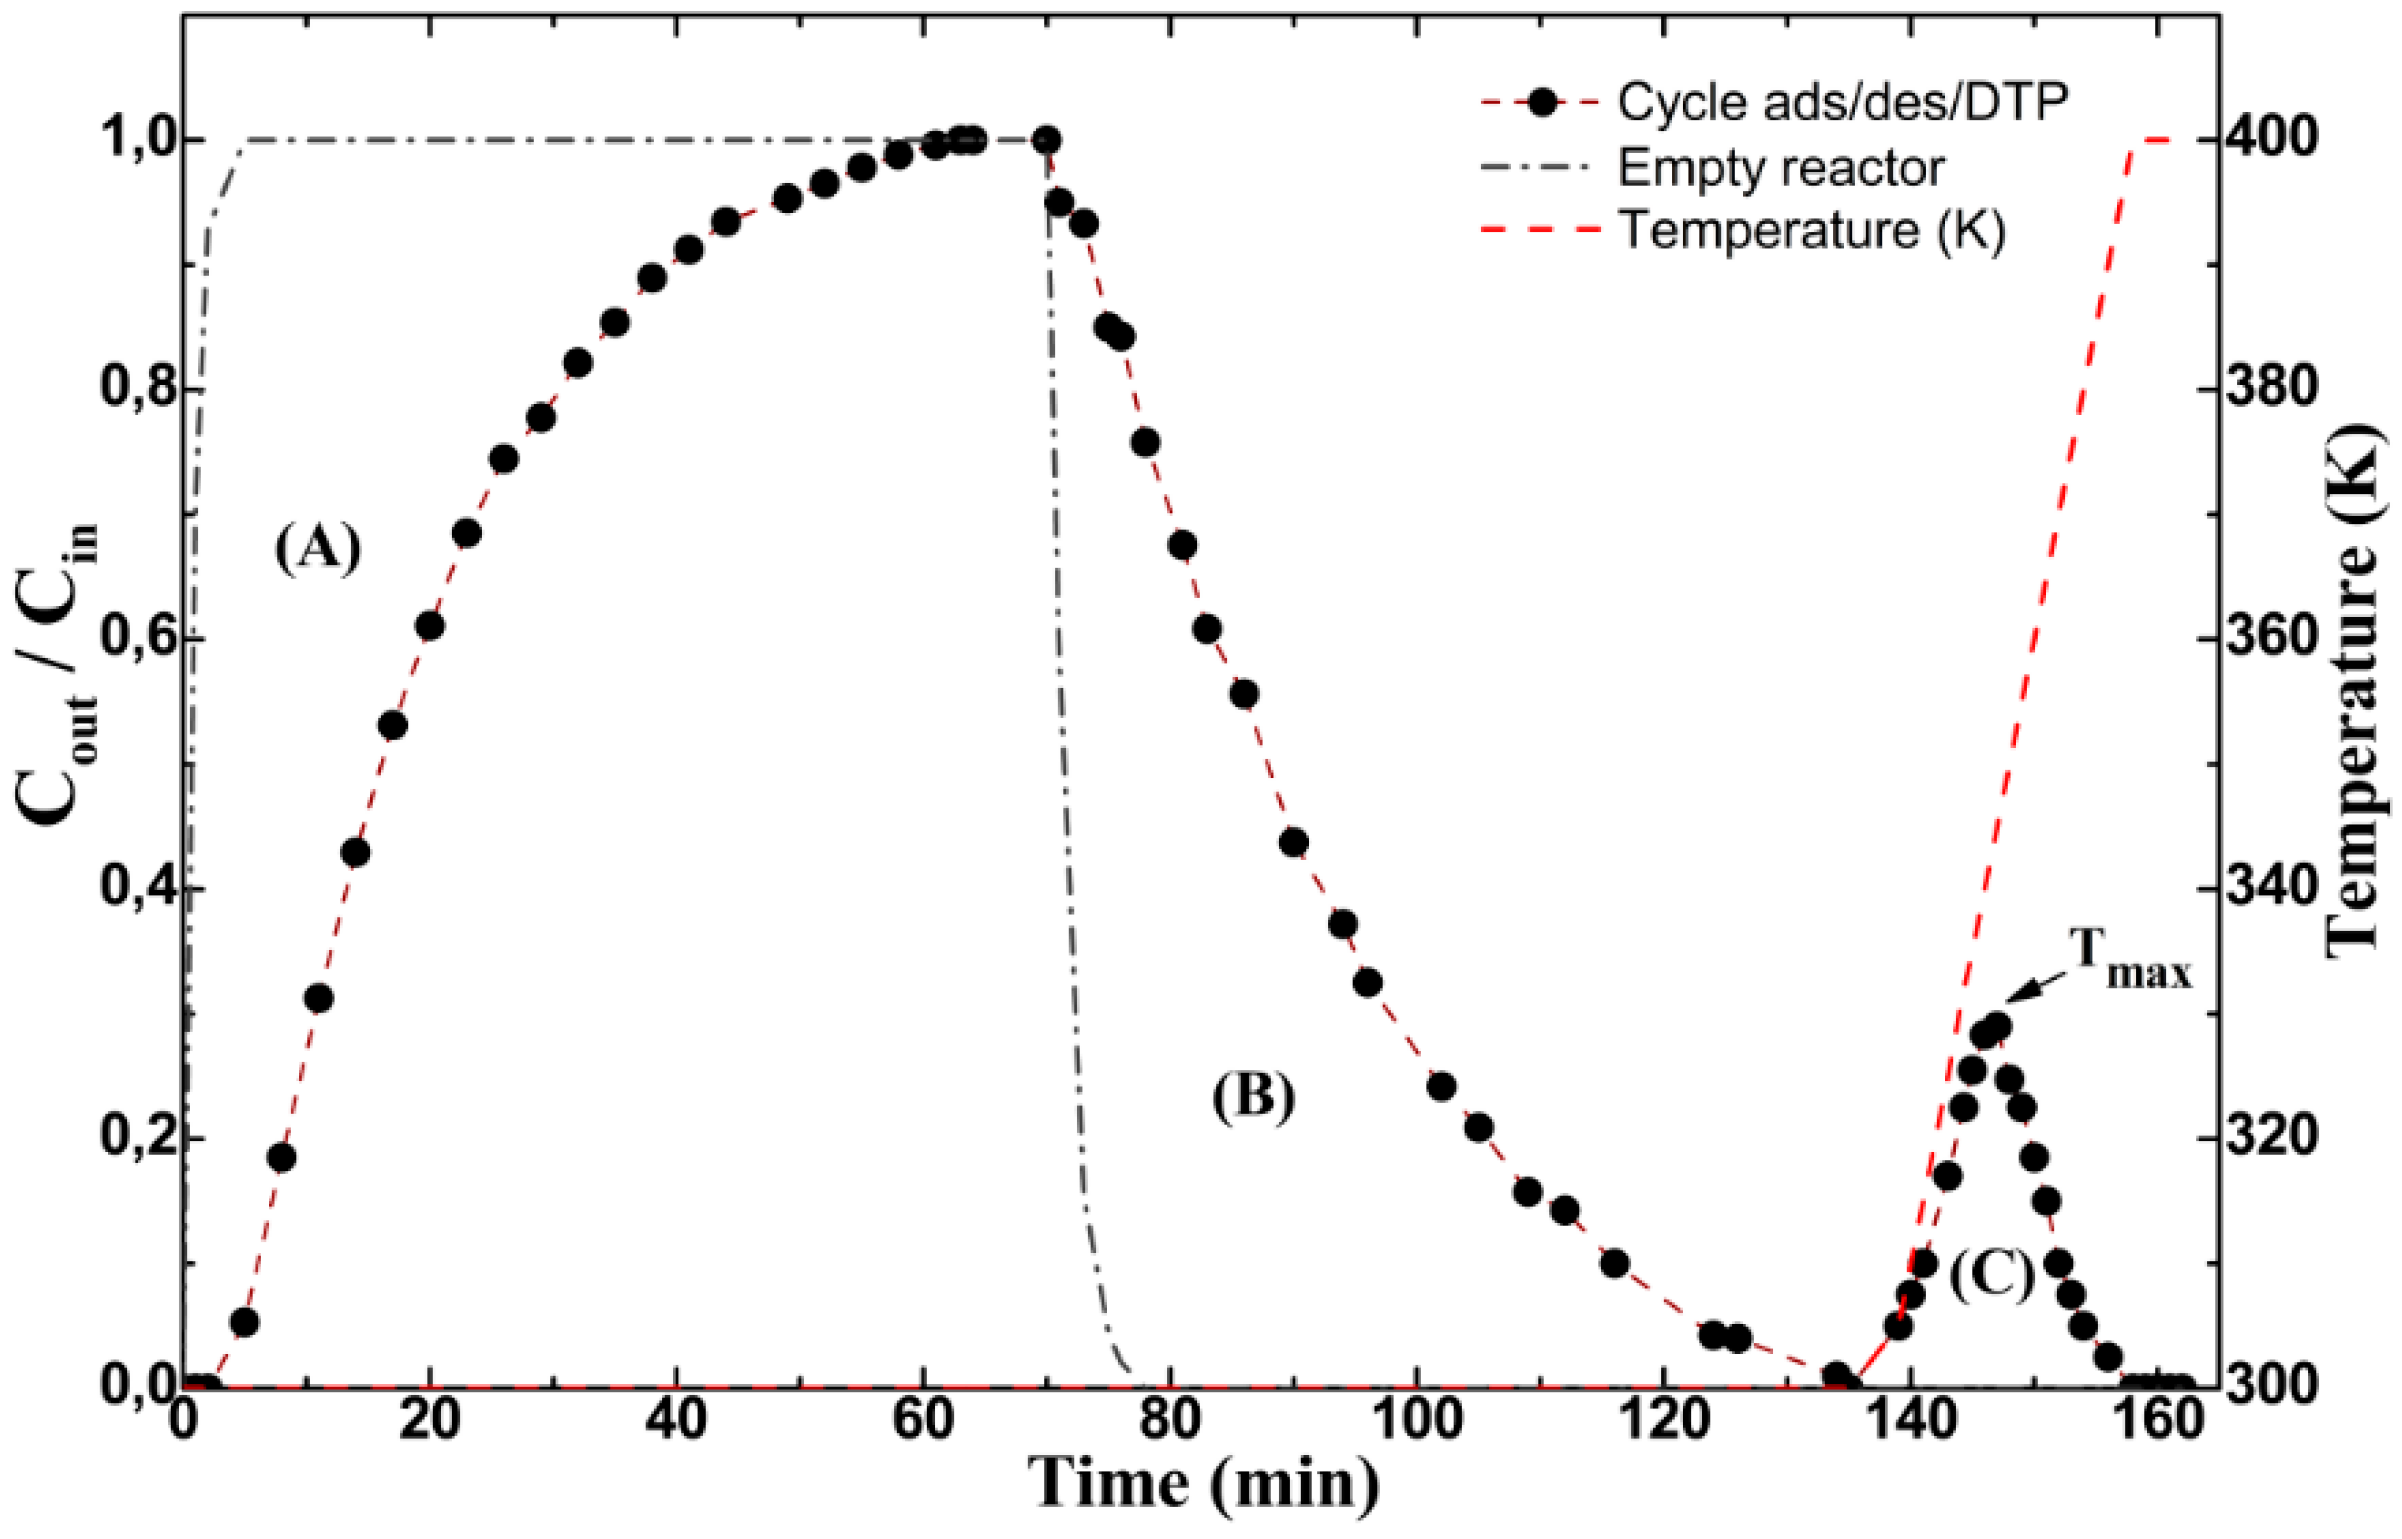
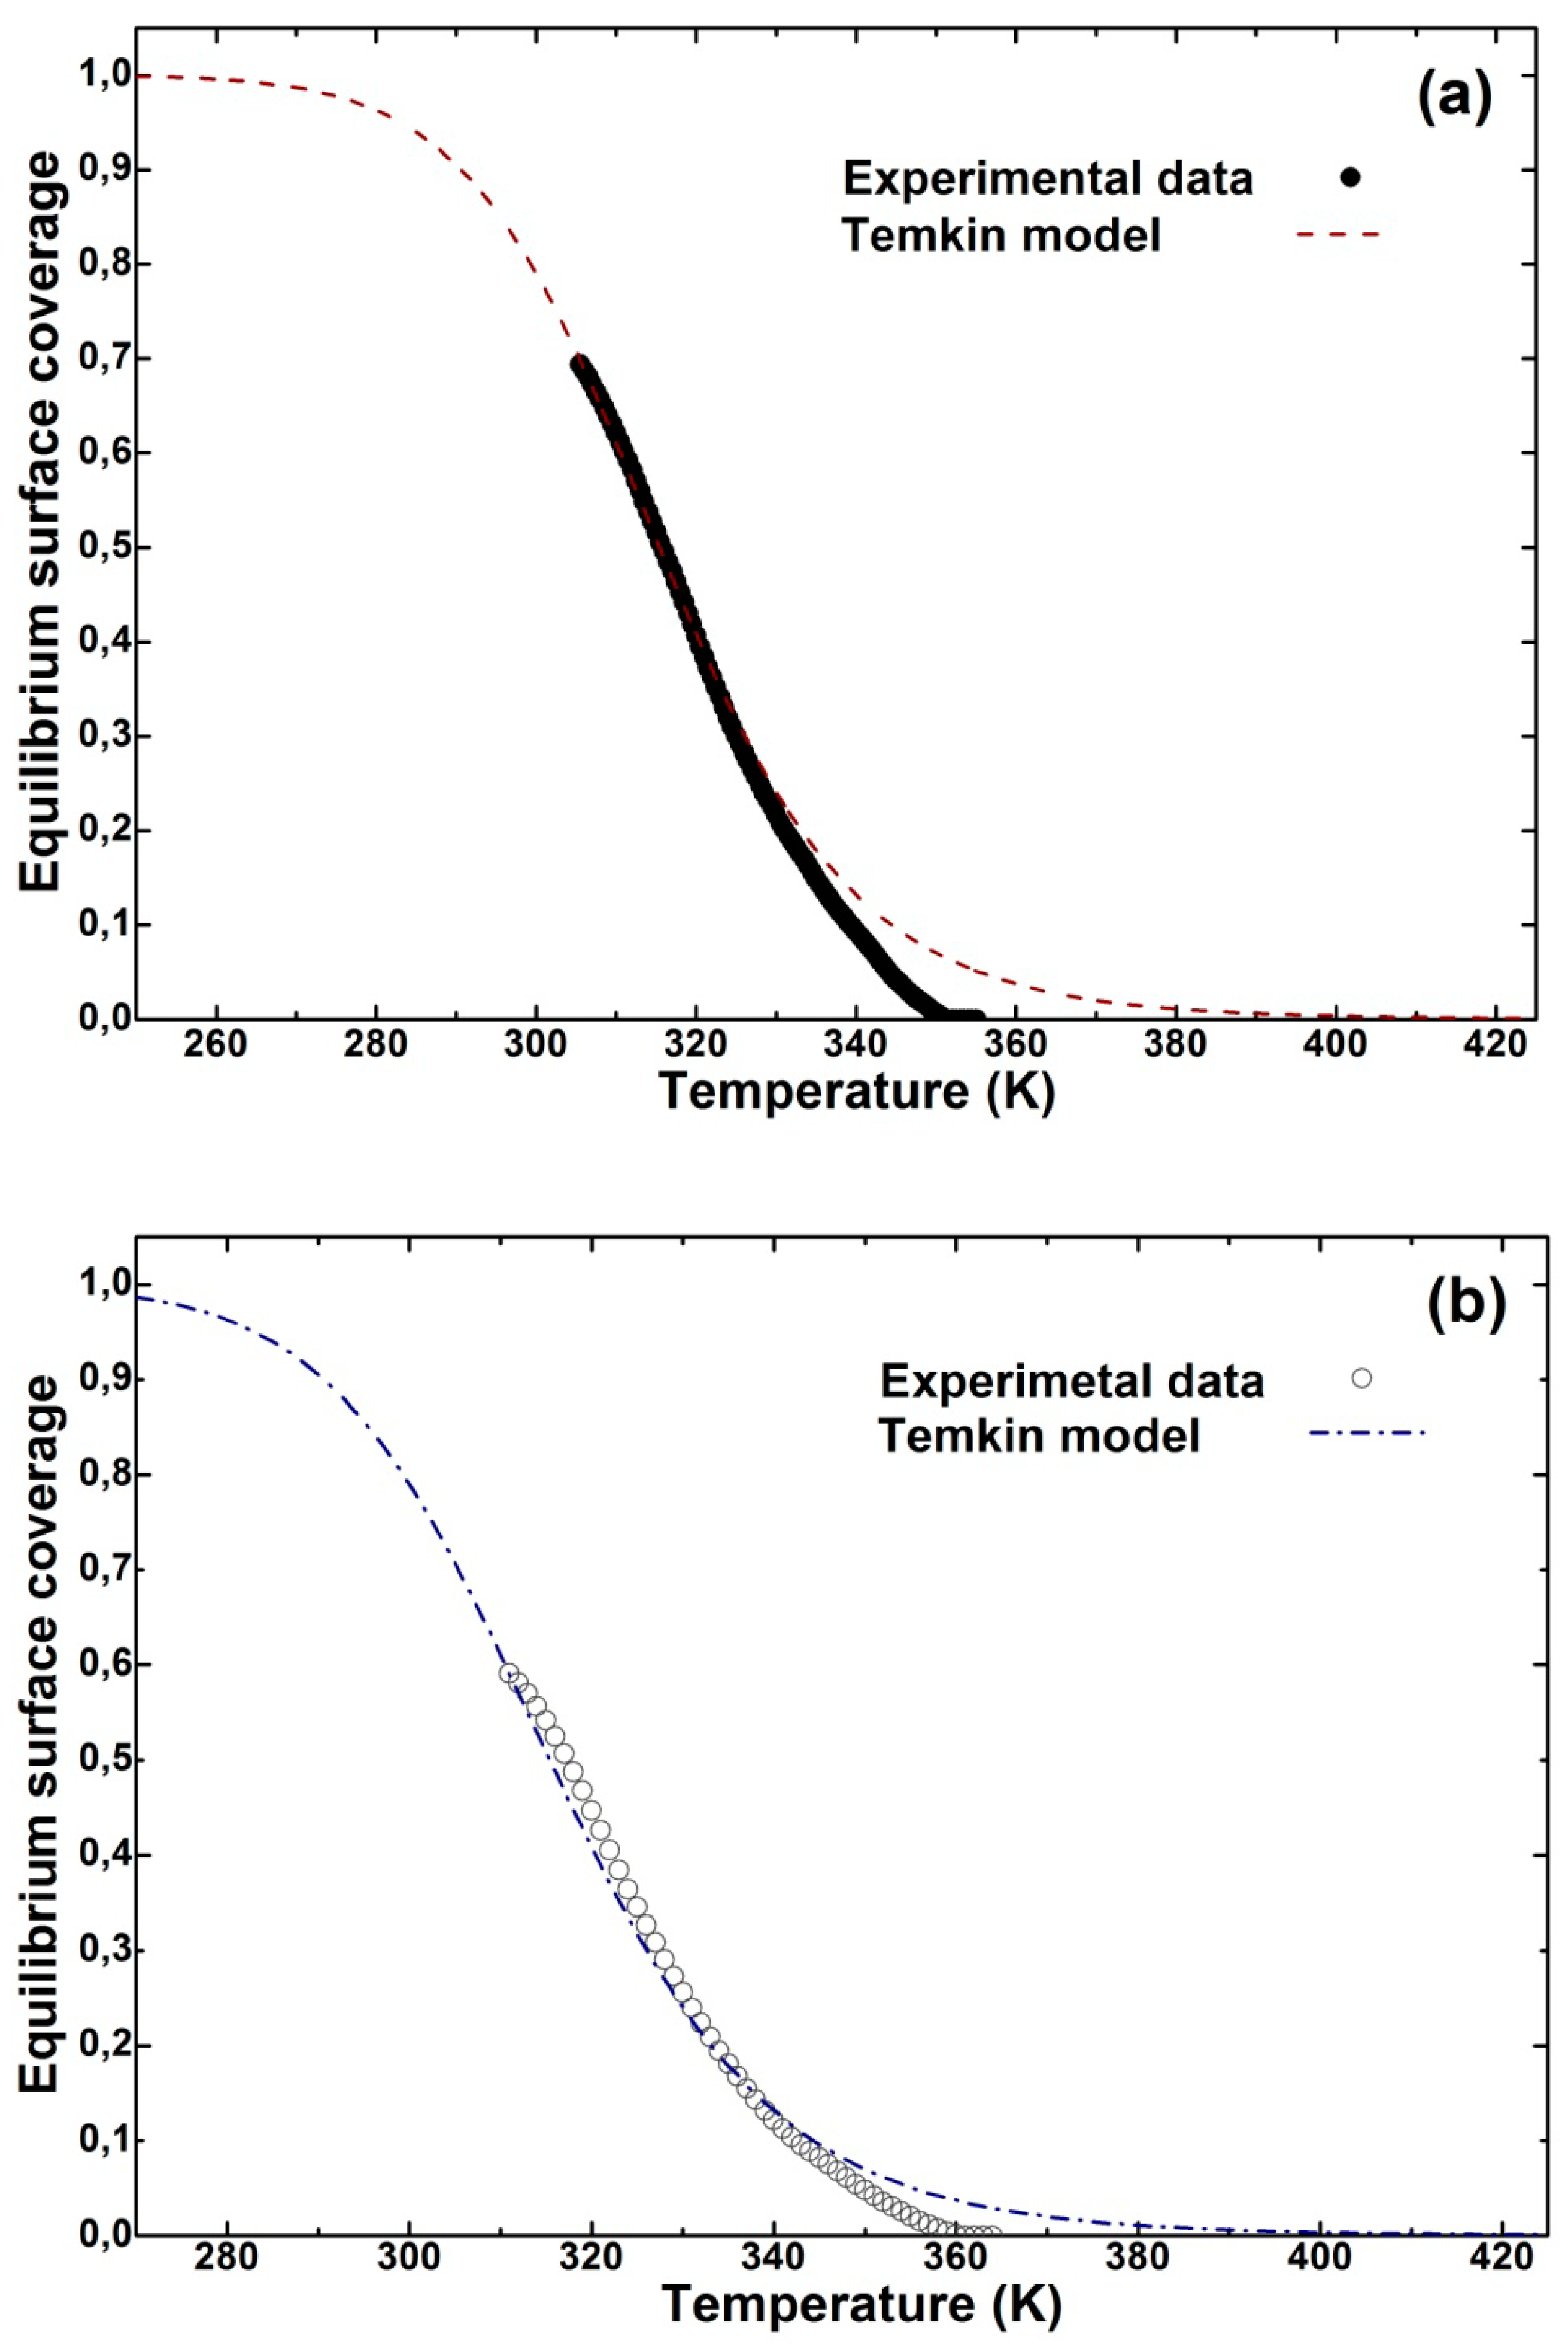
3.3.2. Application of the Temperature-Programmed Desorption (TPD) Method

In the present work, it has been found that about 12% and 6% of o-xylene, on bentonite and silica, respectively, remained adsorbed although the isothermal desorption curve reached zero. This adsorptive behavior suggests the use of the Temperature-Programmed Desorption (TPD) method for determination of desorption energy Ed value, as firstly reported by Cvetanovic, then by several authors [1,9,40,41,42]. The method is based on measuring the desorption profile with temperature increase, which goes through a maximum and finally back to zero, indicating that the surface is cleared of adsorbate. Thus, the energy of desorption Ed value is derived from the line slope obtained from Cvetanovic Equation (9) by following the shift of temperature at desorption peak maximum Tm as a function of linear heating rate (β):
2 L n T m L n β = E d R T m + C o n s t
where Tm is the desorption temperature at peak maximum (K), β is the linear rate of temperature rise (K/min), Ed is the desorption energy (kJ/mol), and R is the perfect gas constant (kJ/mol.K−1).
Note that in order to obtain exploitable data, the TPD curves need to show clearly detectable Tm positions. This was the case in our experiments; the profile displayed in part C of Figure 2 was reproducible for all the sets of adsorption/desorption cycles using different linear heating rates β. The plot slope representing 2lnTm − lnβ as a function of 1/Tm yielded Ed values of 76.46 kJ/mol and 74.01 kJ/mol for bentonite and silica, respectively. Nevertheless, diffusion and re-adsorption phenomena need to be taken into account, particularly for a microporous adsorbent. Otherwise, the resulting apparent energy values might not be able to be systematically correlated with the heat of adsorption, which is a thermodynamic parameter relevant to the adsorption equilibrium. Therefore, if correctly reliable, these data are of interest from the viewpoint of adsorbent and adsorbat regeneration.

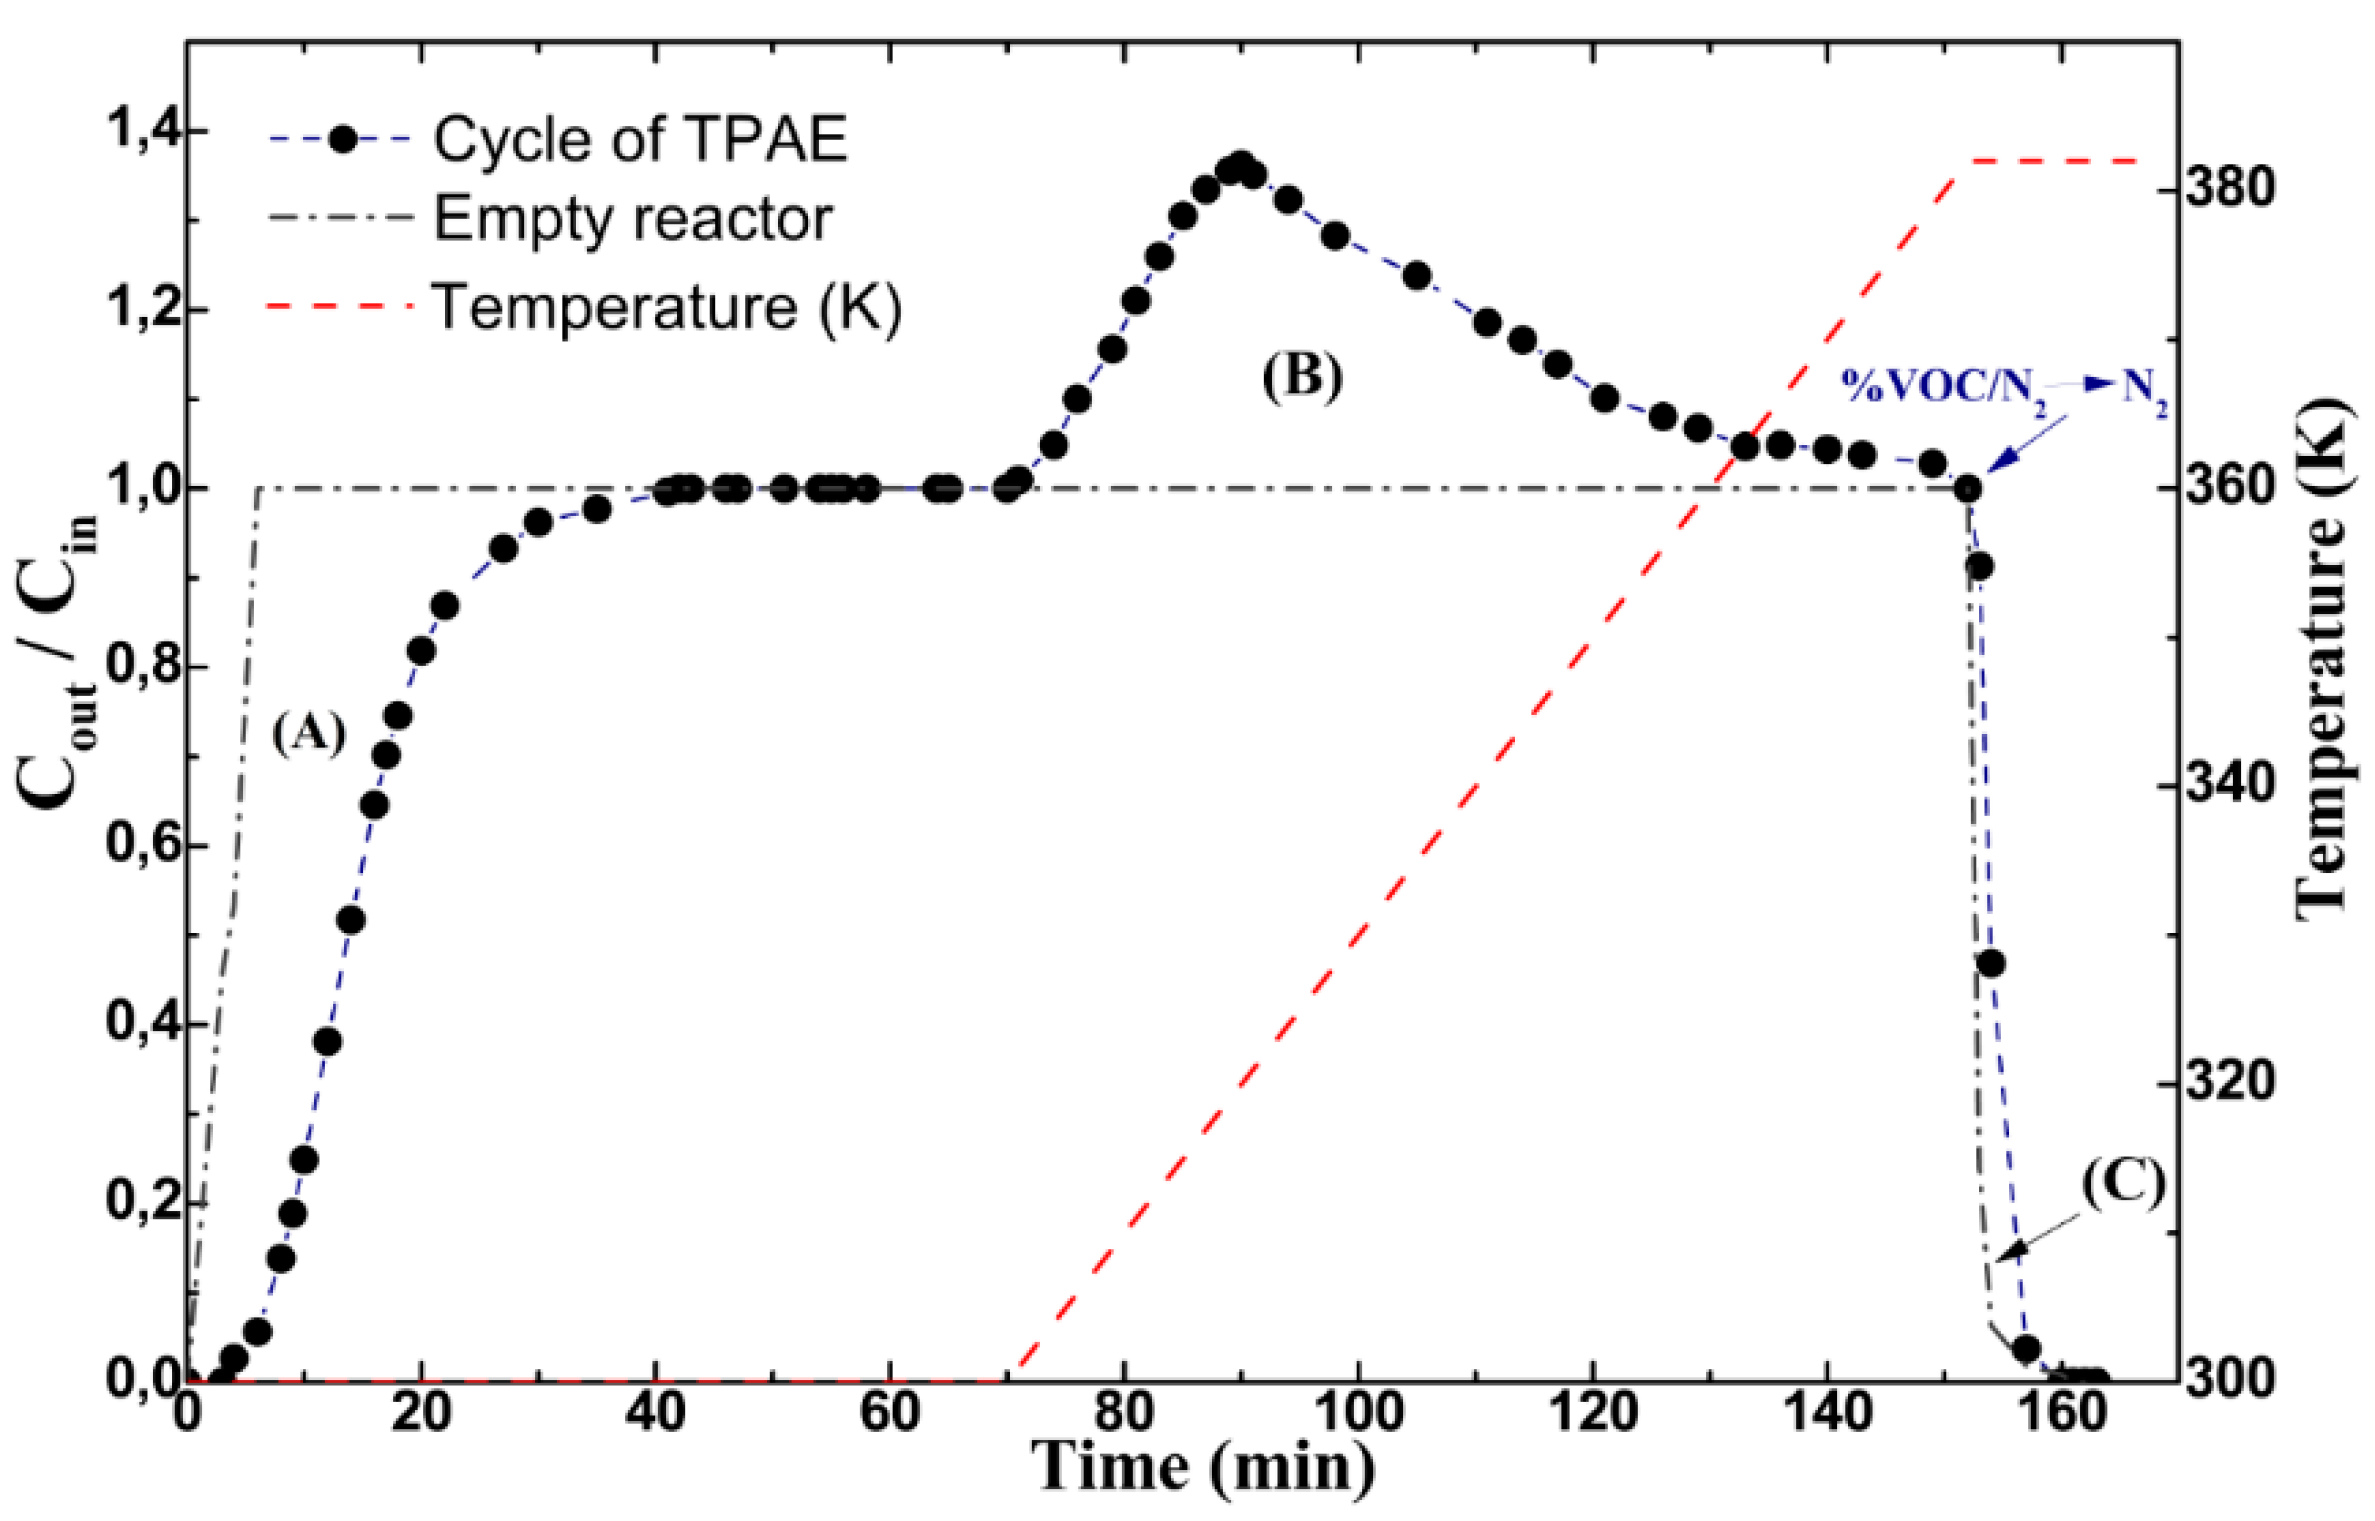
3.3.3. Application of Temperature-Programmed Adsorption Equilibrium (TPAE) Method

As previously reported [13], the application of the TPAE method is based on determining the surface coverage evolution θe with adsorption temperature Ta and pressure Pa at equilibrium according to Equation (10).
θ e ( T a ) = Q a d s ( F m ) t e q t 0 ( C t 0 C t e q ) d t Q m
where Qads is the measured adsorbed loading, Qm is the amount corresponding to the monolayer, F is the gaseous flow rate (cm3 min−1), m is the adsorbent weight (g), t0 is the time at the beginning of increasing adsorption at temperature Ta, teq is the time at which equilibrium is established (with t > teq), and Ct0 and Cteq correspond to the inlet and outlet o-xylene concentrations in N2 flow.
The obtained curves showing the surface coverage profile θe variation as a function of adsorption temperature Te, presented in Figure 6a,b, have been modeled in order to extract the adsorption coefficients and heat of adsorption values through best fit with the theoretical curves. As previously pointed out, particular attention must be paid to experiment design in order to select appropriate experimental temperature Ta and pressure Pa of adsorption values that permit us to obtain an amount of adsorbed o-xylene species significantly lower than Qm at monolayer. This avoids the formation of multi-layers and consideration of related models such as BET. On the other hand, although Langmuir’s model was found to reasonably fit the experimental data, the application of the Temkin model seems to be more realistic considering sorbate–sorbate interaction assumed based on isosteric method data. Accordingly, the variation of surface coverage θ as a function of Ta has been modeled using Equation (11) following the Temkin model:
θ e = R . T a Δ E ln ( 1 + K θ 0 . P a 1 + K θ 1 . P a )
where R is the gas constant and Kθ0 and Kθ1 are the adsorption coefficients at low (θ = 0) and high (θ = 1) coverage, respectively, calculated based on statistical thermodynamics consideration as detailed elsewhere, [13]:
K θ 0 = h 3 ( 2 Π M ) 3 2 . ( k . T a ) 5 2 exp ( E θ 0 R . T a ) ,  and  K θ 1 = h 3 ( 2 Π M ) 3 2 . ( k . T a ) 5 2 exp ( E θ 1 R . T a )
ΔE = Eθ0Eθ1 where Eθ0 and Eθ1 are, respectively, the heats of adsorption at low and high loading (θ = 0 and θ = 1). Thus, the best fitting permitted extraction of the heats of adsorption values are Eθ=0 = 63 kJ/mol and Eθ=1 = 61 kJ/mol for bentonite, and quite similar values are obtained for silica.
Figure 6. Confrontation of the evolution of o-xylene equilibrium coverage with the Temkin model during a TPAE experiment carried out with bentonite (a) and (b) with silica.
Catalysts 05 00653 g006
Figure 7 shows a graphical illustration comparing the heat values given by the three methods. As mentioned above, the isosteric method yields values ranging from 45.67 to 41.57 k/mol and from 49.39 to 47.97 kJ/mol, respectively, for bentonite and silica and for surface coverage (θ) ranging between 0.15 and 0.27. However, slightly higher values are obtained with the TPAE method at both lower and higher coverage: Eθ=0 = 63 kJ/mol and Eθ =1 = 61 kJ/mol. Note that the application of this method is based on mathematical formalism, taking into account adsorption equilibrium conditions, whereas the TPD method yields even higher values such as 76.46 kJ/mol and 74.01 kJ/mol, respectively, for bentonite and for silica.
Figure 7. Graphical illustration of the heat of adsorption values obtained using isosteric, TPD, and TPAE methods with bentonite and silica.
Catalysts 05 00653 g007

4. Conclusions

The present work is devoted to the investigation of the heat of o-xylene vapor adsorption under dynamic conditions onto natural clay (bentonite) and commercial silica. The adopted approach is based on the use of FTIR spectroscopy for the measurement of adsorbed and desorbed amounts. The collected data have been used to extract heat of adsorption values following three different methods namely isosteric, TPAE, and TPD. Note that a great number of experiments were required in order to obtain the adsorption heat values, which constitutes a major drawback of these methods. Nevertheless, this can be alleviated using a simpler TPAE method that allows simultaneous determination of adsorbed/desorbed amounts and adsorption heat values.
Therefore, this study highlights the following aspects:
The first one is related to the significant difference that could be found between values of the heat of adsorption depending on the adopted method. This issue requires particular attention because the knowledge of accurate values of the heat effect involved during adsorption is important for the engineering and operating of adsorption facilities, particularly with respect to safety considerations as well as adsorbent/adsorbat regeneration and recycling.
The second aspect is related to the promising potential revealed by clay mineral with interesting adsorptive properties allowing significant reduction in terms of adsorbent bed volume. The obtained result may help local sustainable development through valorization of available local resources such as clays with significant value-added application in environmental control and engineering technologies.

Acknowledgement

Tarik Chafik dedicates this paper in honor to Daniel Bianchi, on the occasion of his nomination as Professor Emeritus and in recognition of his achievement, for the way he inspires his students, co-workers, and colleagues with his ideas and scientific pragmatism. The National Scientific Research Center (CNRST-Maroc) is acknowledged for the financial support through AEK and MA doctorate fellowships.

Author Contributions

A.K. and A.S. carried out experimental work related to measurement of adsorbed and desorbed amounts as well as data analysis; A.E.K. and M.A. took care of textural properties determination and figures preparations; S.H. and O.A. took care of samples characterizations; T.C. designed the experiments and wrote the article.

Conflicts of Interest

The authors declare no conflict of interest.

References

  1. Chafik, T.; Zaitan, H.; Harti, S.; Darir, A.; Achak, O. Determination of the Heat of Adsorption and Desorption of a Volatile Organic Compound under Dynamic Conditions Using Fourier-Transform Infrared Spectroscopy. Spectrosc. Lett. 2007, 40, 763–775. [Google Scholar] [CrossRef]
  2. Gupta, V.K.; Suhas. Application of low-cost adsorbents for dye removal—A review. J. Environ. Manage. 2009, 90, 2313–2342. [Google Scholar] [CrossRef] [PubMed]
  3. Zaitan, H.; Korrir, A.; Chafik, T.; Bianchi, D. Evaluation of the potential of volatile organic compound (di-methyl benzene) removal using adsorption on natural minerals compared to commercial oxides. J. Hazard. Mater. 2013, 262, 365–376. [Google Scholar] [CrossRef] [PubMed]
  4. Kane, A.; Giraudet, S.; Vilmain, J.-B.; Le Cloirec, P. Intensification of the temperature-swing adsorption process with a heat pump for the recovery of dichloromethane. J. Environ. Chem. Eng. 2015, in press. [Google Scholar]
  5. Dunne, J.A.; Rao, M.; Sircar, S.; Gorte, R.J.; Myers, A.L. Calorimetric Heats of Adsorption and Adsorption Isotherms. 3. Mixtures of CH4 and C2H6 in Silicalite and Mixtures of CO2 and C2H6 in NaX. Langmuir 1997, 13, 4333–4341. [Google Scholar] [CrossRef]
  6. Rouquerol, J.; Rouquerol, F.; Llewellyn, P.; Maurin, G.; Sing, K.S.W. Adsorption by Powders and Porous Solids: Principles, Methodology and Applications; Academic Press: Waltham, MA, USA, 2013. [Google Scholar]
  7. Calorimetry and Thermal Methods in Catalysis; Auroux, A. (Ed.) Springer: Berlin&Heidelberg, 2013; Volume 154.
  8. Otero Areán, C.; Manoilova, O.V.; Turnes Palomino, G.; Rodriguez Delgado, M.; Tsyganenko, A.A.; Bonelli, B.; Garrone, E. Variable-temperature infrared spectroscopy: An access to adsorption thermodynamics of weakly interacting systems. Phys. Chem. Chem. Phys. 2002, 4, 5713–5715. [Google Scholar] [CrossRef]
  9. Chafik, T.; Darir, A.; Achak, O.; Carvalho, A.P.; Pires, J. Determination of the heat effects involved during toluene vapor adsorption and desorption from microporous activated carbon. Comptes Rendus Chim. 2012, 15, 474–481. [Google Scholar] [CrossRef]
  10. Ruthven, D.M. Principles of Adsorption and Adsorption Processes; John Wiley & Sons: Weinheim, Germany, 1984. [Google Scholar]
  11. Eley, D.D.; Pines, H.; Weisz, P.B. Advances in Catalysis; Academic Press: Waltham, MA, USA, 1967. [Google Scholar]
  12. Niwa, M.; Katada, N.; Sawa, M.; Murakami, Y. Temperature-programmed desorption of ammonia with readsorption based on the derived theoretical equation. J. Phys. Chem. 1995, 99, 8812–8816. [Google Scholar] [CrossRef]
  13. Hachimi, A.; Chafik, T.; Bianchi, D. Adsorption models and heat of adsorption of adsorbed ortho di-methyl benzene species on silica by using Temperature Programmed Adsorption Equilibrium methods. Appl. Catal. A 2008, 335, 220–229. [Google Scholar] [CrossRef]
  14. Chabanel, C.; Nerriere, L.; Pean, A. Composés organiques volatils : réduction des émissions de COV dans l’industrie. Avalable online: http://www.ademe.fr/composes-organiques-volatils-reduction-emissions-cov-lindustrie (accessed on 28 March 2015).
  15. Delage, F.; Pré, P.; Le Cloirec, P. Mass Transfer and Warming during Adsorption of High Concentrations of VOCs on an Activated Carbon Bed: Experimental and Theoretical Analysis. Environ. Sci. Technol. 2000, 34, 4816–4821. [Google Scholar] [CrossRef]
  16. Le Cloirec, P.; Pré, P.; Delage, F.; Giraudet, S. Visualization of the exothermal VOC adsorption in a fixed-bed activated carbon adsorber. Environ. Technol. 2012, 33, 285–290. [Google Scholar] [CrossRef] [PubMed]
  17. Zaitan, H.; Chafik, T. FTIR determination of adsorption characteristics for volatile organic compounds removal on diatomite mineral compared to commercial silica. Comptes Rendus Chim. 2005, 8, 1701–1708. [Google Scholar] [CrossRef]
  18. Zaitan, H.; Feronnato, C.; Bianchi, D.; Achak, O.; Chafik, T. Etude des propriétés texturales et adsorbantes d’une diatomite marocaine : Application au traitement d’air charge d’un polluant de type compose organique volatil. Ann. Chim. 2006, 31, 183–196. (In French) [Google Scholar] [CrossRef]
  19. Bianchi, D.; Gass, J.L.; Bouly, C.; Maret, D. Determination of Efficiency of Exhaust Gas Catalyst by F.T.I.R. Spectroscopy; SAE International: Warrendale, PA, USA, 1991. [Google Scholar]
  20. Kim, D.J.; Kim, J.M.; Yie, J.E.; Seo, S.G.; Kim, S.-C. Adsorption and conversion of various hydrocarbons on monolithic hydrocarbon adsorber. J. Colloid Interface Sci. 2004, 274, 538–542. [Google Scholar] [CrossRef] [PubMed]
  21. Chafik, T.; Dulaurent, O.; Gass, J.L.; Bianchi, D. Heat of Adsorption of Carbon Monoxide on a Pt/Rh/CeO 2/Al2O3, Three-Way Catalyst Using in-Situ Infrared Spectroscopy at High Temperatures. J. Catal. 1998, 179, 503–514. [Google Scholar] [CrossRef]
  22. Zeradine, S.; Bourane, A.; Bianchi, D. Comparison of the Coverage of the Linear CO Species on Cu/Al2O3 Measured under Adsorption Equilibrium Conditions by Using FTIR and Mass Spectroscopy. J. Phys. Chem. B 2001, 105, 7254–7257. [Google Scholar] [CrossRef]
  23. Rouquerol, F.; Rouquerol, J.; Sing, K.S.W. Adsorption by Powders and Porous Solids Principles, Methodology, and Applications; Academic Press: Waltham, MA, USA, 1999. [Google Scholar]
  24. Unger, K.K.; Rodríguez-Reinoso, F.; Rouquerol, J.; Sing, K.S.W. Characterization of Porous Solids II; Elsevier: Amsterdam, The Netherlands, 1991. [Google Scholar]
  25. Gregg, S.J.; Sing, K.S.W. Adsorption, Surface Area and Porosity, 2nd ed.; Academic Press: London, UK, 1982. [Google Scholar]
  26. Groen, J.C.; Peffer, L.A.A.; Pérez-Ramı́rez, J. Pore size determination in modified micro- and mesoporous materials. Pitfalls and limitations in gas adsorption data analysis. Microporous Mesoporous Mater. 2003, 60, 1–17. [Google Scholar] [CrossRef]
  27. Chevalier, S.; Franck, R.; Lambert, J.F.; Barthomeuf, D.; Suquet, H. Characterization of the porous structure and cracking activity of Al-pillared saponites. Appl. Catal. A 1994, 110, 153–165. [Google Scholar] [CrossRef]
  28. Brunauer, S.; Emmett, P.H.; Teller, E. Adsorption of gases in multimolecular layers. J. Am. Chem. Soc. 1938, 60, 309–319. [Google Scholar] [CrossRef]
  29. Corma, A.; Corell, C.; Pérez-Pariente, J.; Guil, J.M.; Guil-López, R.; Nicolopoulos, S.; Calbet, J.G.; Vallet-Regi, M. Adsorption and catalytic properties of MCM-22: The influence of zeolite structure. Zeolites 1996, 16, 7–14. [Google Scholar] [CrossRef]
  30. Pennell, K.D.; Rhue, R.D.; Rao, P.S.C.; Johnston, C.T. Vapor-phase sorption of p-xylene and water on soils and clay minerals. Environ. Sci. Technol. 1992, 26, 756–763. [Google Scholar] [CrossRef]
  31. Benkhedda, J.; Jaubert, J.-N.; Barth, D.; Perrin, L.; Bailly, M. Adsorption isotherms of m-xylene on activated carbon: measurements and correlation with different models. J. Chem. Thermodyn. 2000, 32, 401–411. [Google Scholar] [CrossRef]
  32. Wang, C.-M.; Chang, K.-S.; Chung, T.-W.; Wu, H. Adsorption Equilibria of Aromatic Compounds on Activated Carbon, Silica Gel, and 13X Zeolite. J. Chem. Eng. Data 2004, 49, 527–531. [Google Scholar] [CrossRef]
  33. Huang, Q.; Vinh-Thang, H.; Malekian, A.; Eić, M.; Trong-On, D.; Kaliaguine, S. Adsorption of n-heptane, toluene and o-xylene on mesoporous UL-ZSM5 materials. Microporous Mesoporous Mater. 2006, 87, 224–234. [Google Scholar] [CrossRef]
  34. Chiang, A.S.T.; Lee, C.-K.; Chang, Z.-H. Adsorption and diffusion of aromatics in AIPO4-5. Zeolites 1991, 11, 380–386. [Google Scholar] [CrossRef]
  35. Derrouiche, S.; Bianchi, D. Heats of Adsorption Using Temperature Programmed Adsorption Equilibrium: Application to the Adsorption of CO on Cu/Al2O3 and H2 on Pt/Al2O3. Langmuir 2004, 20, 4489–4497. [Google Scholar] [CrossRef] [PubMed]
  36. Langmuir, I. The Constitution and Fundamental Properties of Solids and Liquids. Part I. Solids. J. Am. Chem. Soc. 1916, 38, 2221–2295. [Google Scholar] [CrossRef]
  37. Freundlich, H. Ueber die Adsorption in Loesungen; Wilhelm Engelmann: Leipzig, Germany, 1906. [Google Scholar]
  38. Gundry, P.M.; Tompkins, F.C. Chemisorption of gases on metals. Q Rev. Chem. Soc. 1960, 14, 257–291. [Google Scholar] [CrossRef]
  39. Dulaurent, O.; Bianchi, D. Adsorption isobars for CO on a Pt/Al2O3 catalyst at high temperatures using FTIR spectroscopy: isosteric heat of adsorption and adsorption model. Appl. Catal. A 2000, 196, 271–280. [Google Scholar] [CrossRef]
  40. Yoshimoto, R.; Hara, K.; Okumura, K.; Katada, N.; Niwa, M. Analysis of Toluene Adsorption on Na-Form Zeolite with a Temperature-Programmed Desorption Method. J. Phys. Chem. C 2007, 111, 1474–1479. [Google Scholar] [CrossRef]
  41. Joly, J.-P.; Perrard, A. Determination of the Heat of Adsorption of Ammonia on Zeolites from Temperature-Programmed Desorption Experiments. Langmuir 2001, 17, 1538–1542. [Google Scholar] [CrossRef]
  42. Kanervo, J.; Keskitalo, T.; Slioor, R.; Krause, A. Temperature-programmed desorption as a tool to extract quantitative kinetic or energetic information for porous catalysts. J. Catal. 2006, 238, 382–393. [Google Scholar] [CrossRef]

