2.1. Catalyst Characterization
The physicochemical properties of zirconia and WZs are summarised in
Table 1 as a function of their calcination temperature and nominal W loading. There is good agreement between the nominal and surface W loadings observed by XPS, with the generally higher observed surface loadings consistent with the wet impregnation protocol employed and consequent concentration of tungsten at the catalyst surface relative to bulk. In almost all cases, tungsten addition increased the surface area relative to the corresponding parent ZrO
2, this effect being most significant at the lower calcination temperature of 500 °C, while the surface areas of all WZ materials decreased with increasing calcination temperature. There was no significant variation in either total pore volume or mean pore diameter, reflecting the non-porous nature of both parent zirconia and WZ, with measured porosity associated with interparticle voids and hence, was relatively insensitive to changes in particle morphology or crystallinity. Acid strength, as measured by the pH of an aqueous suspension of WZ, increased with W loading and calcination temperature (parent ZrO
2), reaching 3.31 for the 10 wt% WZ calcined at 500 °C. It is important to note that such moderate acidity is known to effect glucose dehydration/fructose isomerisation, but should be insufficient to drive further reaction of any HMF product to levulinic and formic acids observed when employing stronger acids [
15,
16].
Table 1.
Physicochemical properties of ZrO2 and WZ materials as a function of calcination temperature.
Table 1.
Physicochemical properties of ZrO2 and WZ materials as a function of calcination temperature.
| Catalyst | Calcination Temperature/°C | pH a | Surface W Loading b/wt% | Surface Area c/m2.g−1 | Mesopore Diameter d/Å | Total Pore Volume d/cm3.g−1 | Surface W Density e/atoms.nm−2 |
|---|
| ZrO2 | 500 | 5.0 | - | 78 | 25 | 0.19 | - |
| 5 wt% WZ | 5.6 | 7.7 | 122 | 17 | 0.18 | 2.1 |
| 10 wt% WZ | 5.3 | 12.6 | 184 | 17 | 0.12 | 2.7 |
| ZrO2 | 600 | - | - | 44 | 50 | 0.15 | - |
| 5 wt% WZ | 5.7 | 9.3 | 81 | 22 | 0.15 | 3.7 |
| 10 wt% WZ | 4.6 | 8.4 | 116 | 17 | 0.16 | 3.0 |
| ZrO2 | 700 | - | - | 86 | 17 | 0.19 | - |
| 5 wt% WZ | 5.5 | 11.7 | 64 | 25 | 0.14 | 6.0 |
| 10 wt% WZ | 3.3 | 17.7 | 98 | 20 | 0.18 | 7.1 |
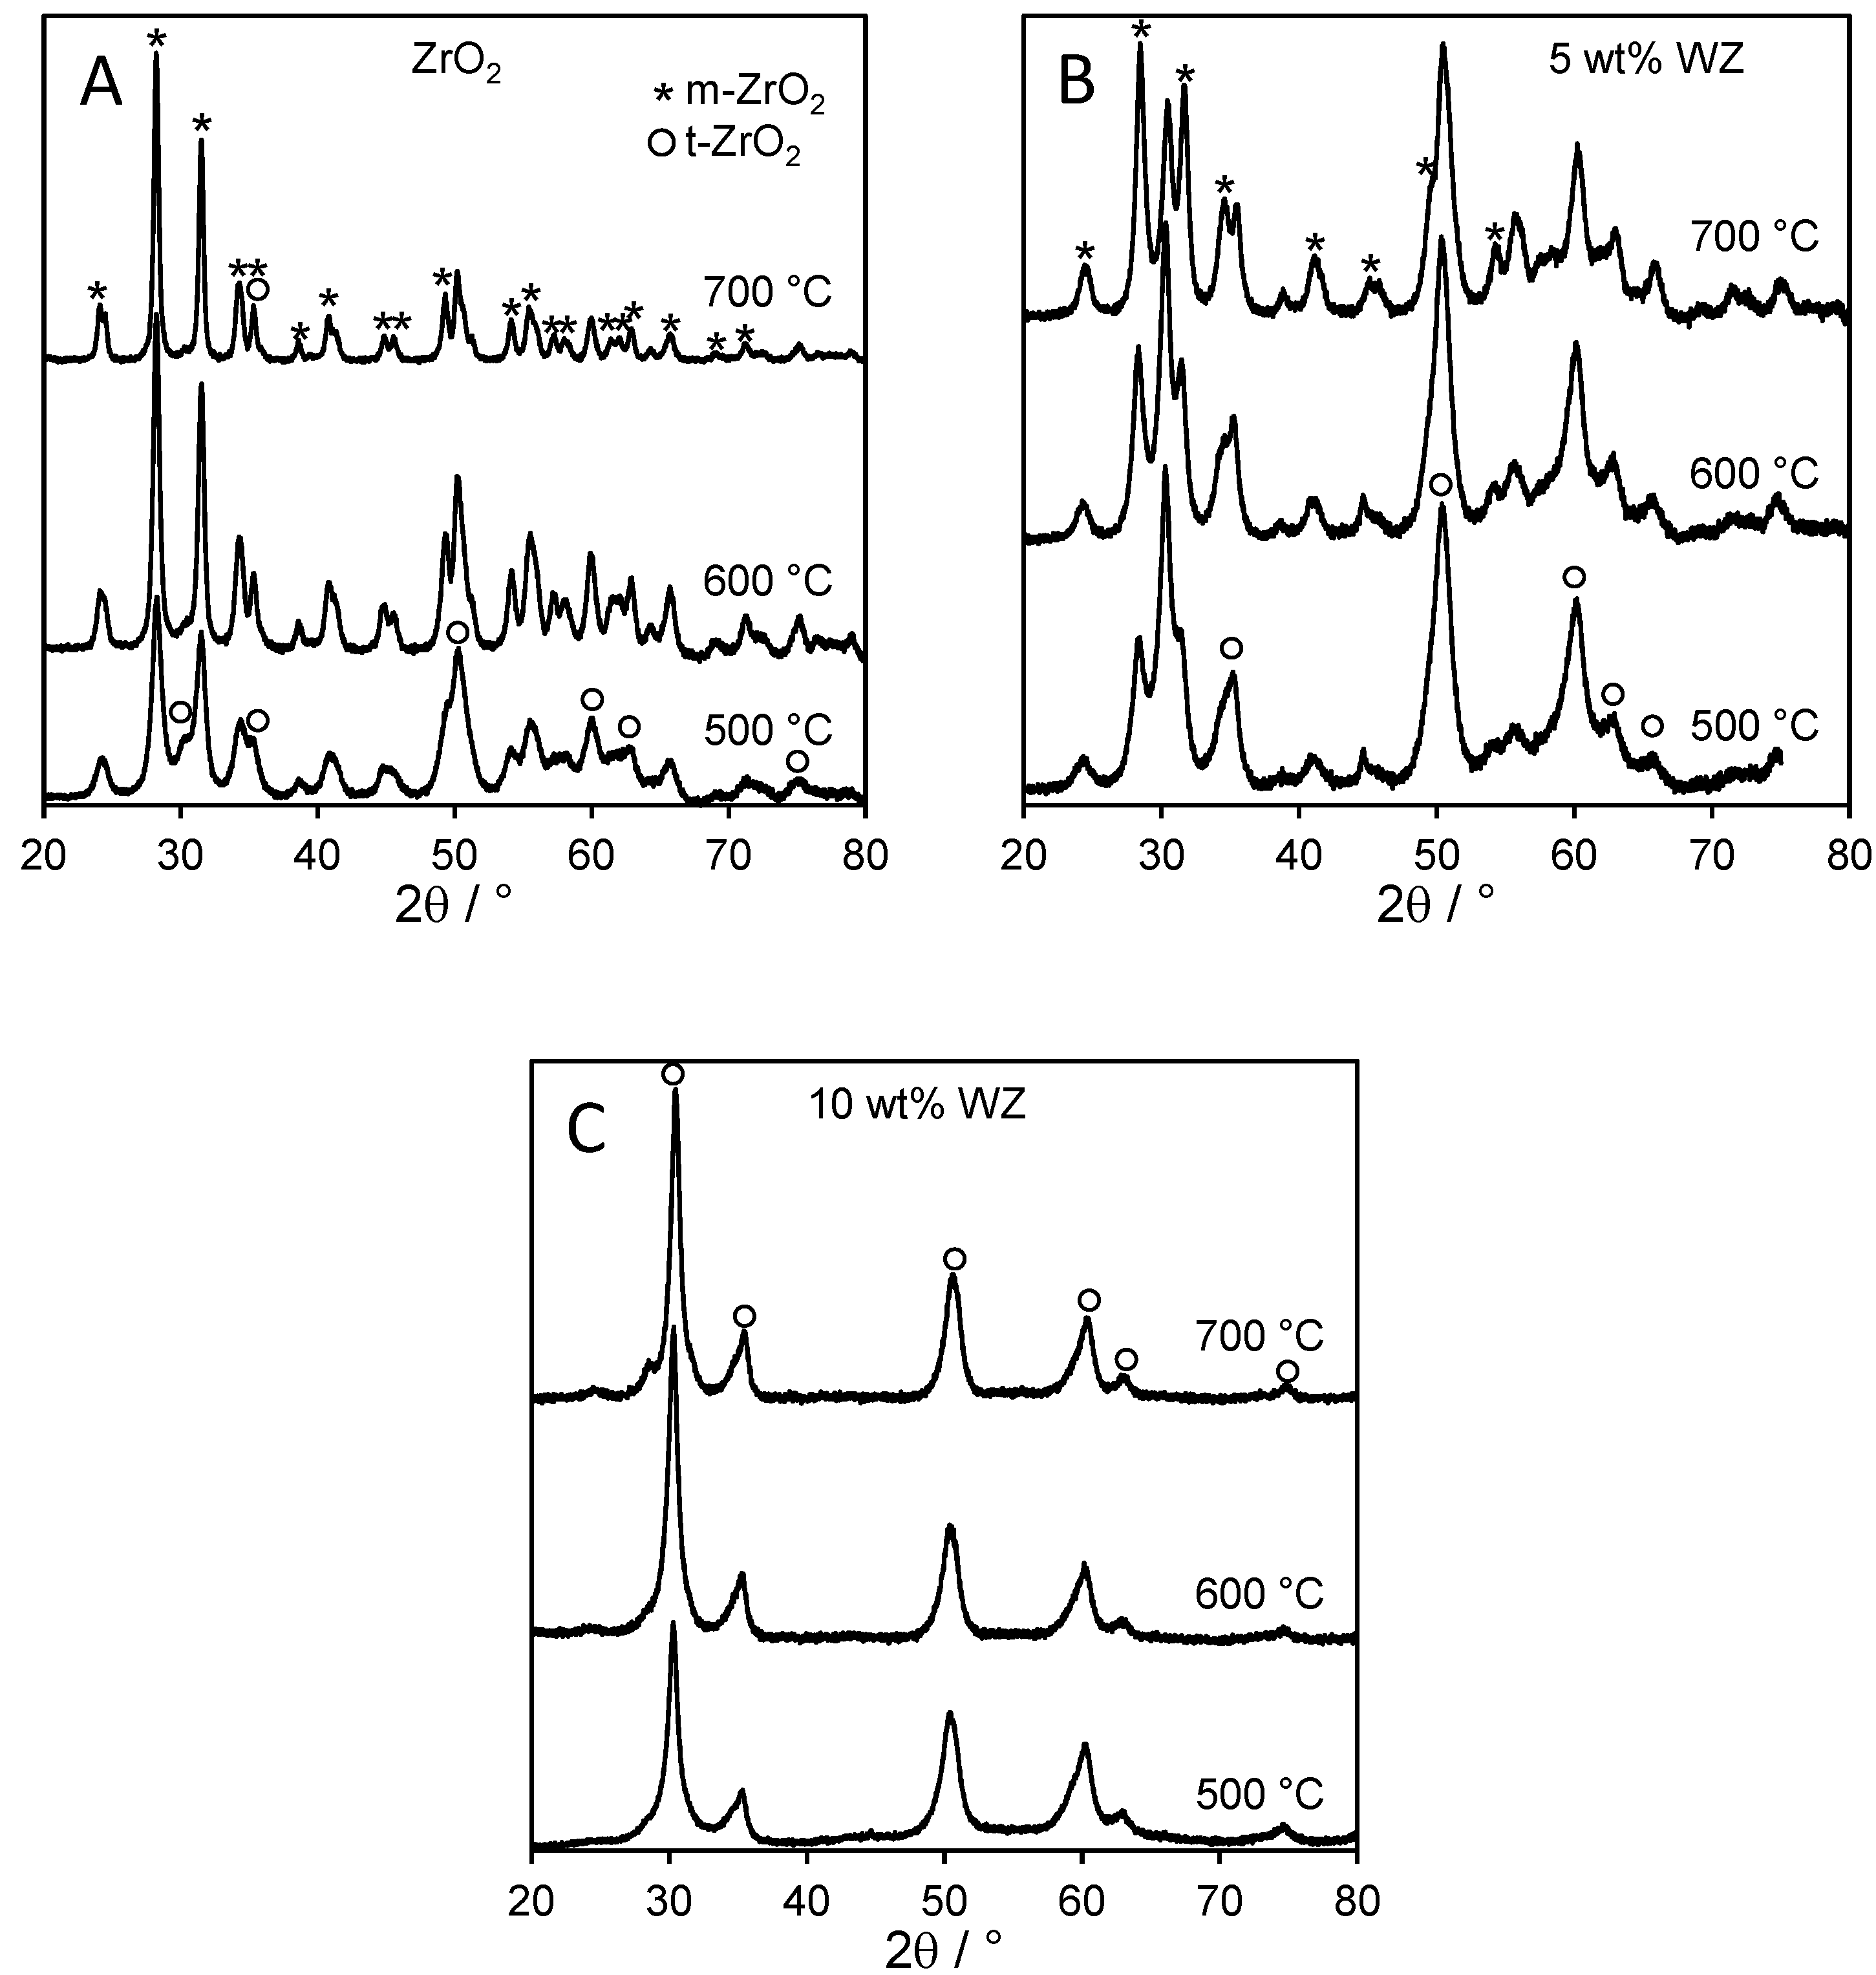
The nature of crystalline phases was also investigated via powder X-ray diffraction as a function of W loading and calcination temperature (
Figure 1). Tetragonal zirconia (
t-ZrO
2) is known to be thermodynamically unstable with respect to monoclinic zirconia (
m-ZrO
2), and indeed the latter phase dominates the diffractograms of the parent support. The intensity of
m-ZrO
2 reflections also increases with calcination temperature, accompanied by peak sharpening, indicative of an increase in crystallite size. Peak width analysis employing the Scherrer equation confirms the mean crystallite size rises from 10.2 nm after 500 °C calcination to 22 nm following 700 °C treatment, consistent with the decrease in surface area. In contrast, tungstated zirconias exhibited significant contributions from the
t-ZrO
2 phase, with the proportion
t-ZrO
2:
m-ZrO
2 ratio proportional to the tungsten loading. For the 10 wt% WZ sample, only
t-ZrO
2 was detectable even after calcination at 700 °C. Tungsten thus serves to stabilise the tetragonal phase with respect to the monoclinic, in accordance with previous reports for sulfated and tungstated zirconia [
15,
17,
18]. Crystallite size for the
t-ZrO
2 phase in the WZ materials were also far smaller than those of the parent
m-ZrO
2, varying from 6.6 nm (500 °C) to 9.6 nm (700 °C). No reflections attributable to any tungsten oxide phase were observed for any WZ samples, indicating that tungsten must be highly dispersed, either as sub-2 nm particles or as a monolayer coating over the underlying
t-ZrO
2 support. The latter hypothesis is in line with the surface W density, which increases with tungsten loading from 2.1 to 7.1 W atoms.nm
−2, but in all cases remains below that required to saturate a WO
3 monolayer (8.9 W atoms.nm
−2) [
19].
Figure 1.
Powder XRD patterns for (A) parent zirconia, (B) 5 wt% WZ, and (C) 10 wt% WZ as a function of W loading and calcination temperature showing the thermal stabilisation of t-ZrO2 by surface tungstate.
Figure 1.
Powder XRD patterns for (A) parent zirconia, (B) 5 wt% WZ, and (C) 10 wt% WZ as a function of W loading and calcination temperature showing the thermal stabilisation of t-ZrO2 by surface tungstate.
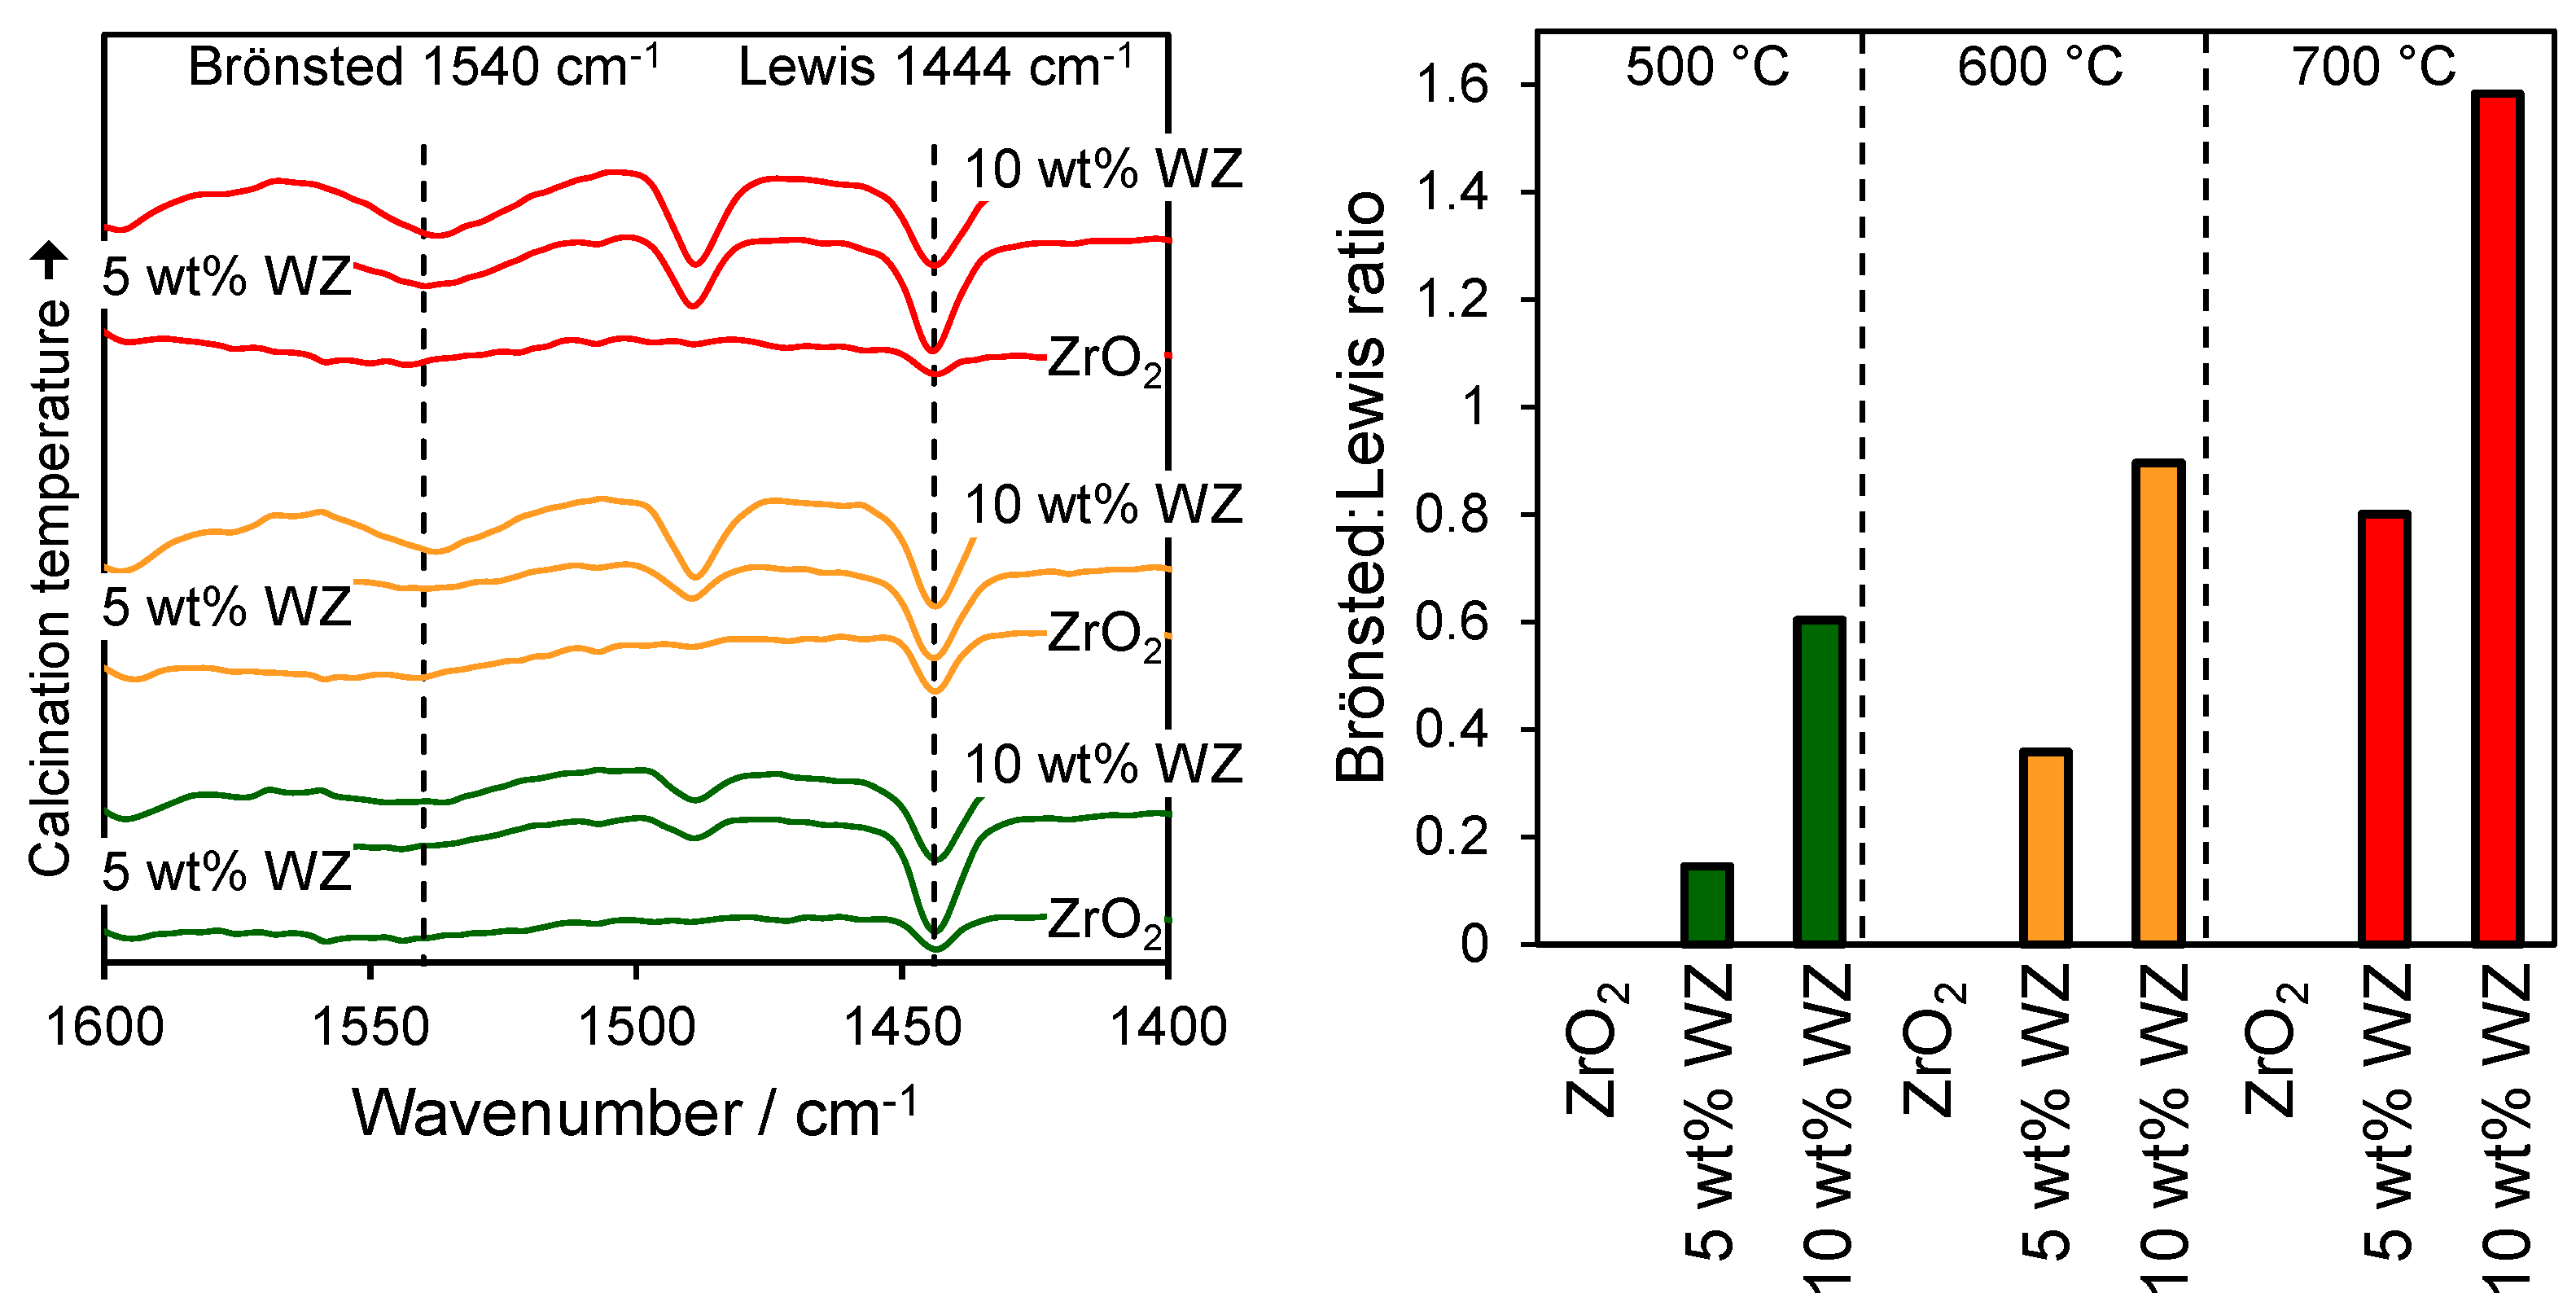
The nature of the surface acid sites was probed through pyridine chemisorption and subsequent DRIFTS analysis to identify the presence of Brönsted and Lewis acid sites and the relative Brönsted:Lewis character.
Figure 2 shows the resulting DRIFT vibrational spectra for the parent and WO
x/ZrO
2 solids calcined at 500, 600 and 700 °C, revealing bands at 1540, 1490 and 1440 cm
−1 typical of chemisorbed pyridine [
19,
20]. The band at 1540 cm
−1 is attributed to a pyridinium ion bound to Brönsted acid sites, while those at 1580 cm
−1 and 1438 cm
−1 are attributed to molecular pyridine coordinated to Lewis acid sites. Since the 1488 cm
−1 band is observed from pyridine adsorbed at both Brönsted and Lewis acid sites, the relative Brönsted:Lewis acidity can be quantified from the ratio of the 1540 cm
−1 and 1438 cm
−1 bands, as shown in
Figure 2 as a function of calcination temperature and W loading. The Brönsted:Lewis ratio increased significantly with tungsten content, as anticipated upon impregnation of the parent zirconia support, which possesses oxygen deficient Lewis acid centres, with tungstate clusters. Calcination also increased the Brönsted character of all materials, possibly reflecting the formation of two-dimensional polytungstate clusters and attendant charge neutralisation by adsorbed protons [
21].
Figure 2.
(left) DRIFT spectra of chemisorbed pyridine over zirconia and tungstated zirconias; and (right) ratio of Brönsted:Lewis adsorption bands as a function of W loading and calcination temperature.
Figure 2.
(left) DRIFT spectra of chemisorbed pyridine over zirconia and tungstated zirconias; and (right) ratio of Brönsted:Lewis adsorption bands as a function of W loading and calcination temperature.
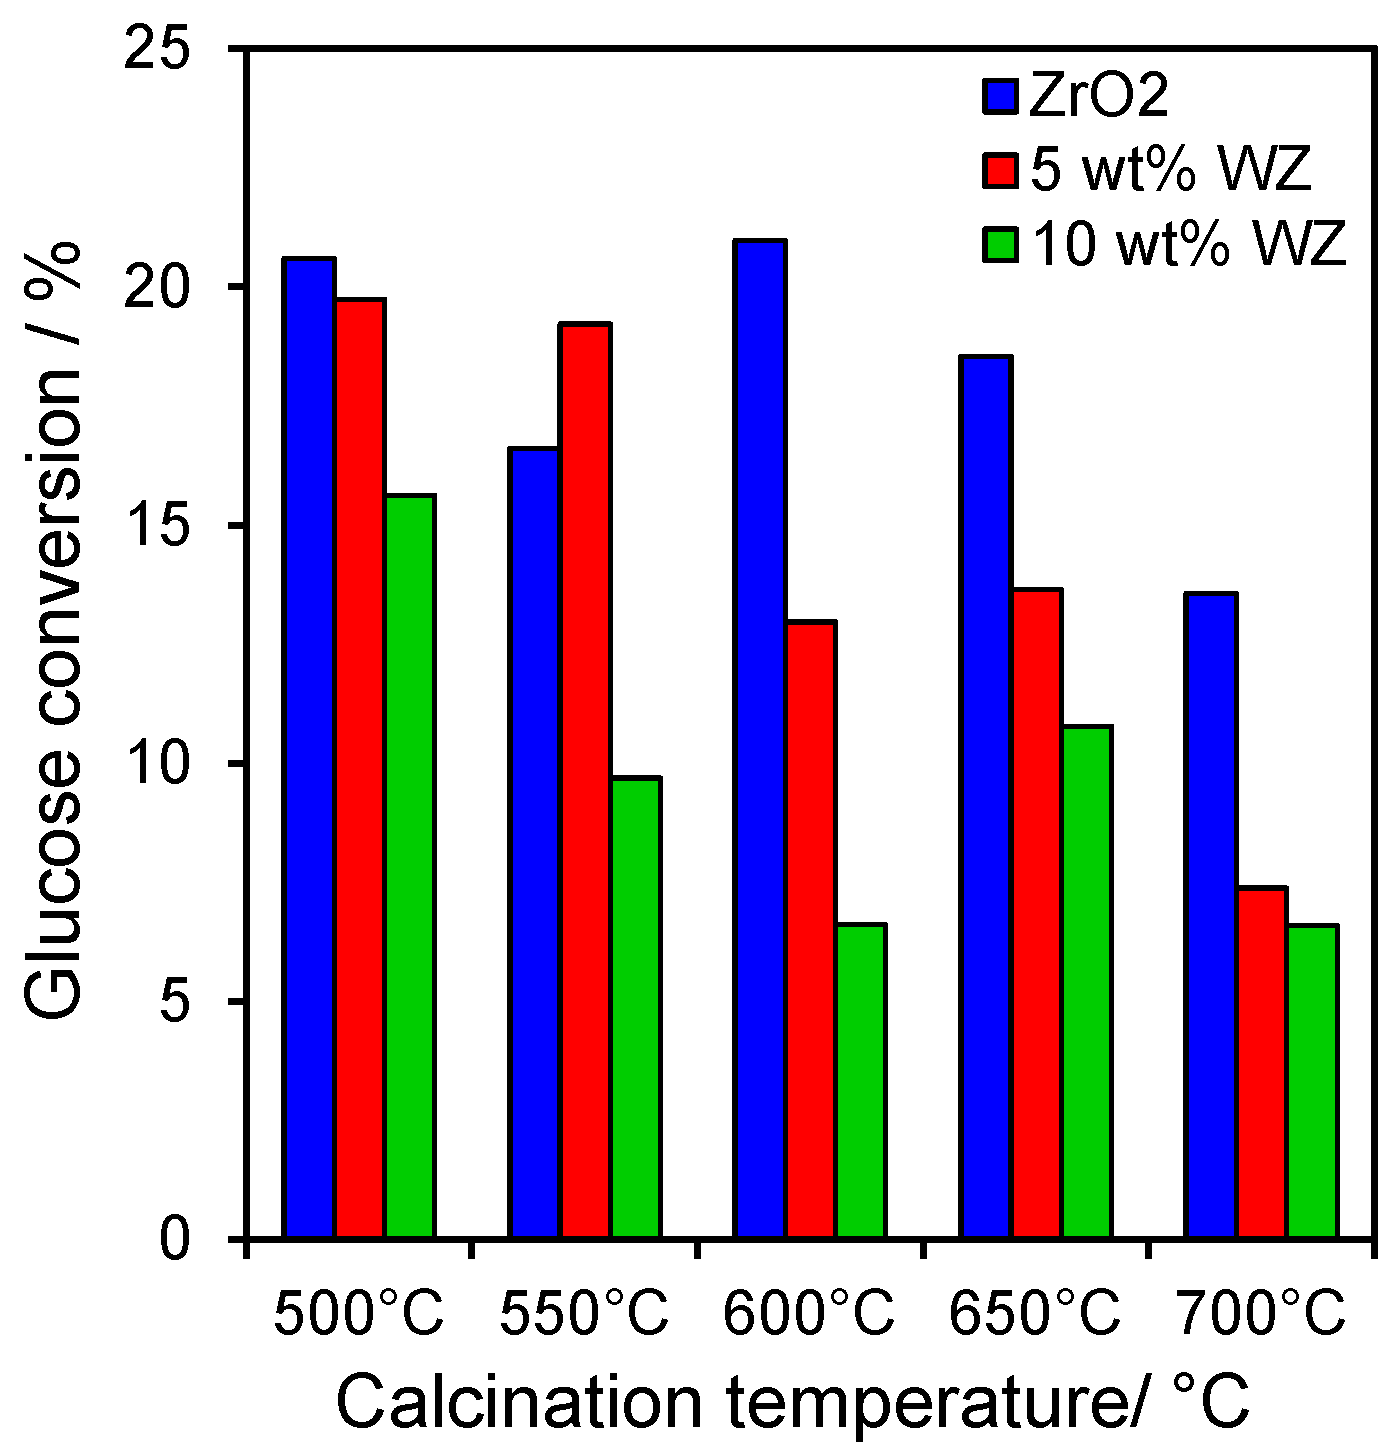
2.2. Catalytic Conversion of Glucose
The impact of tungsten upon glucose isomerisation to fructose and subsequent dehydration to HMF was explored as a function of calcination temperature. In all cases, glucose conversion ranged between 5% and 20% under the mild conditions employed in this work, with
Figure 3 revealing a decrease with increasing W loading and calcination temperature. These observations are consistent with another report on WZs, wherein glucose conversion is favoured over weak Lewis acid base sites associated with the bare zirconia support [
14], while higher W loadings and calcination temperatures favour Brönsted acid sites which drive fatty acid esterification [
19]. We can therefore infer a switchover in Lewis to Brönsted acid character resulting from the coalescence of isolated WO
x clusters as polytungstates and the resultant genesis of Brönsted acidity for the 5 and 10 wt% WZ samples. This observation is in excellent agreement with the pyridine titrations shown in
Figure 2. The fall in conversion with temperature also likely reflects the corresponding decreases in surface area due to crystallite sintering. Normalising the final glucose conversion to the acid site density derived from the integrated chemisorbed pyridine DRIFTS intensity, yielded Turnover Frequencies of 4.7, 0.9 and 0.8 h
−1 for the 700 °C calcined ZrO
2, 5 wt% and 10 wt% WZ materials, respectively. The superior activity of the parent zirconia is in accordance with its pure Lewis acid character.
Figure 3.
Glucose conversion after 6 h reaction at 100 °C over zirconia and tungstated zirconias.
Figure 3.
Glucose conversion after 6 h reaction at 100 °C over zirconia and tungstated zirconias.
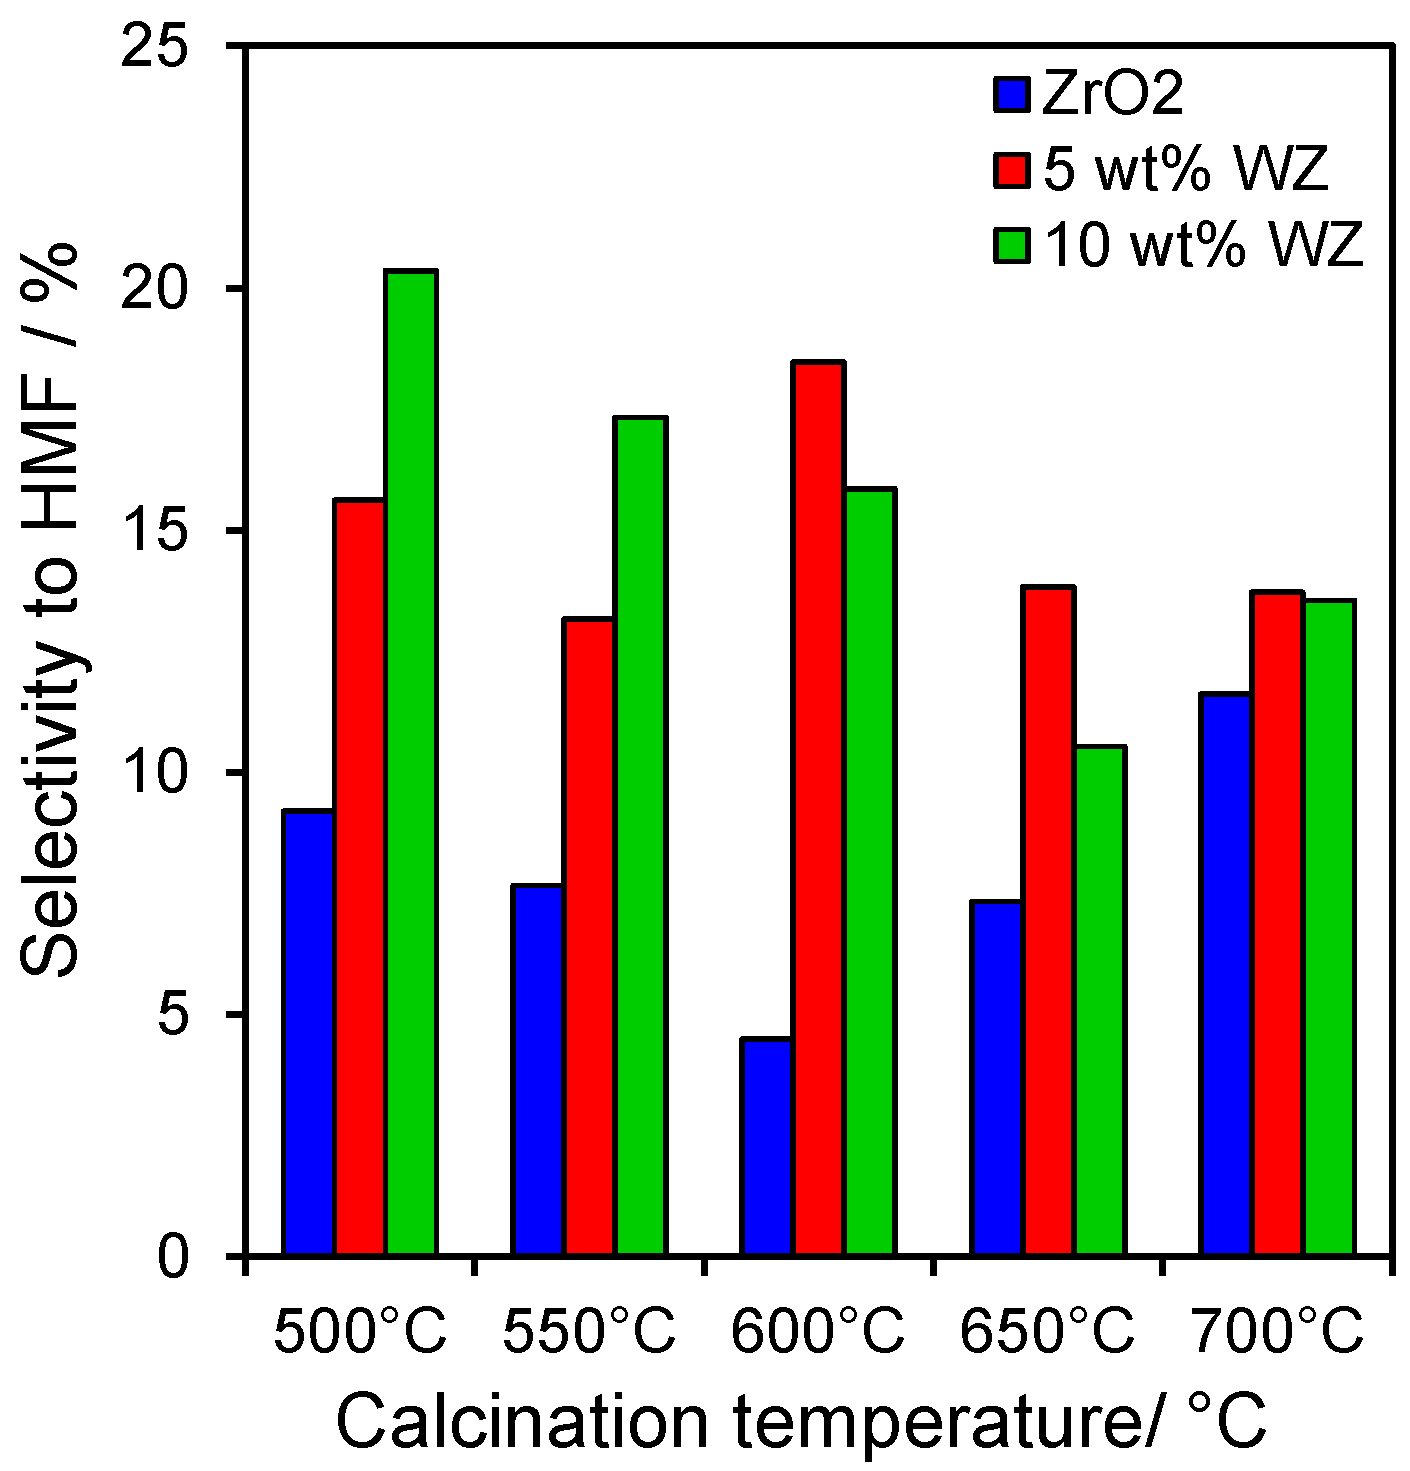
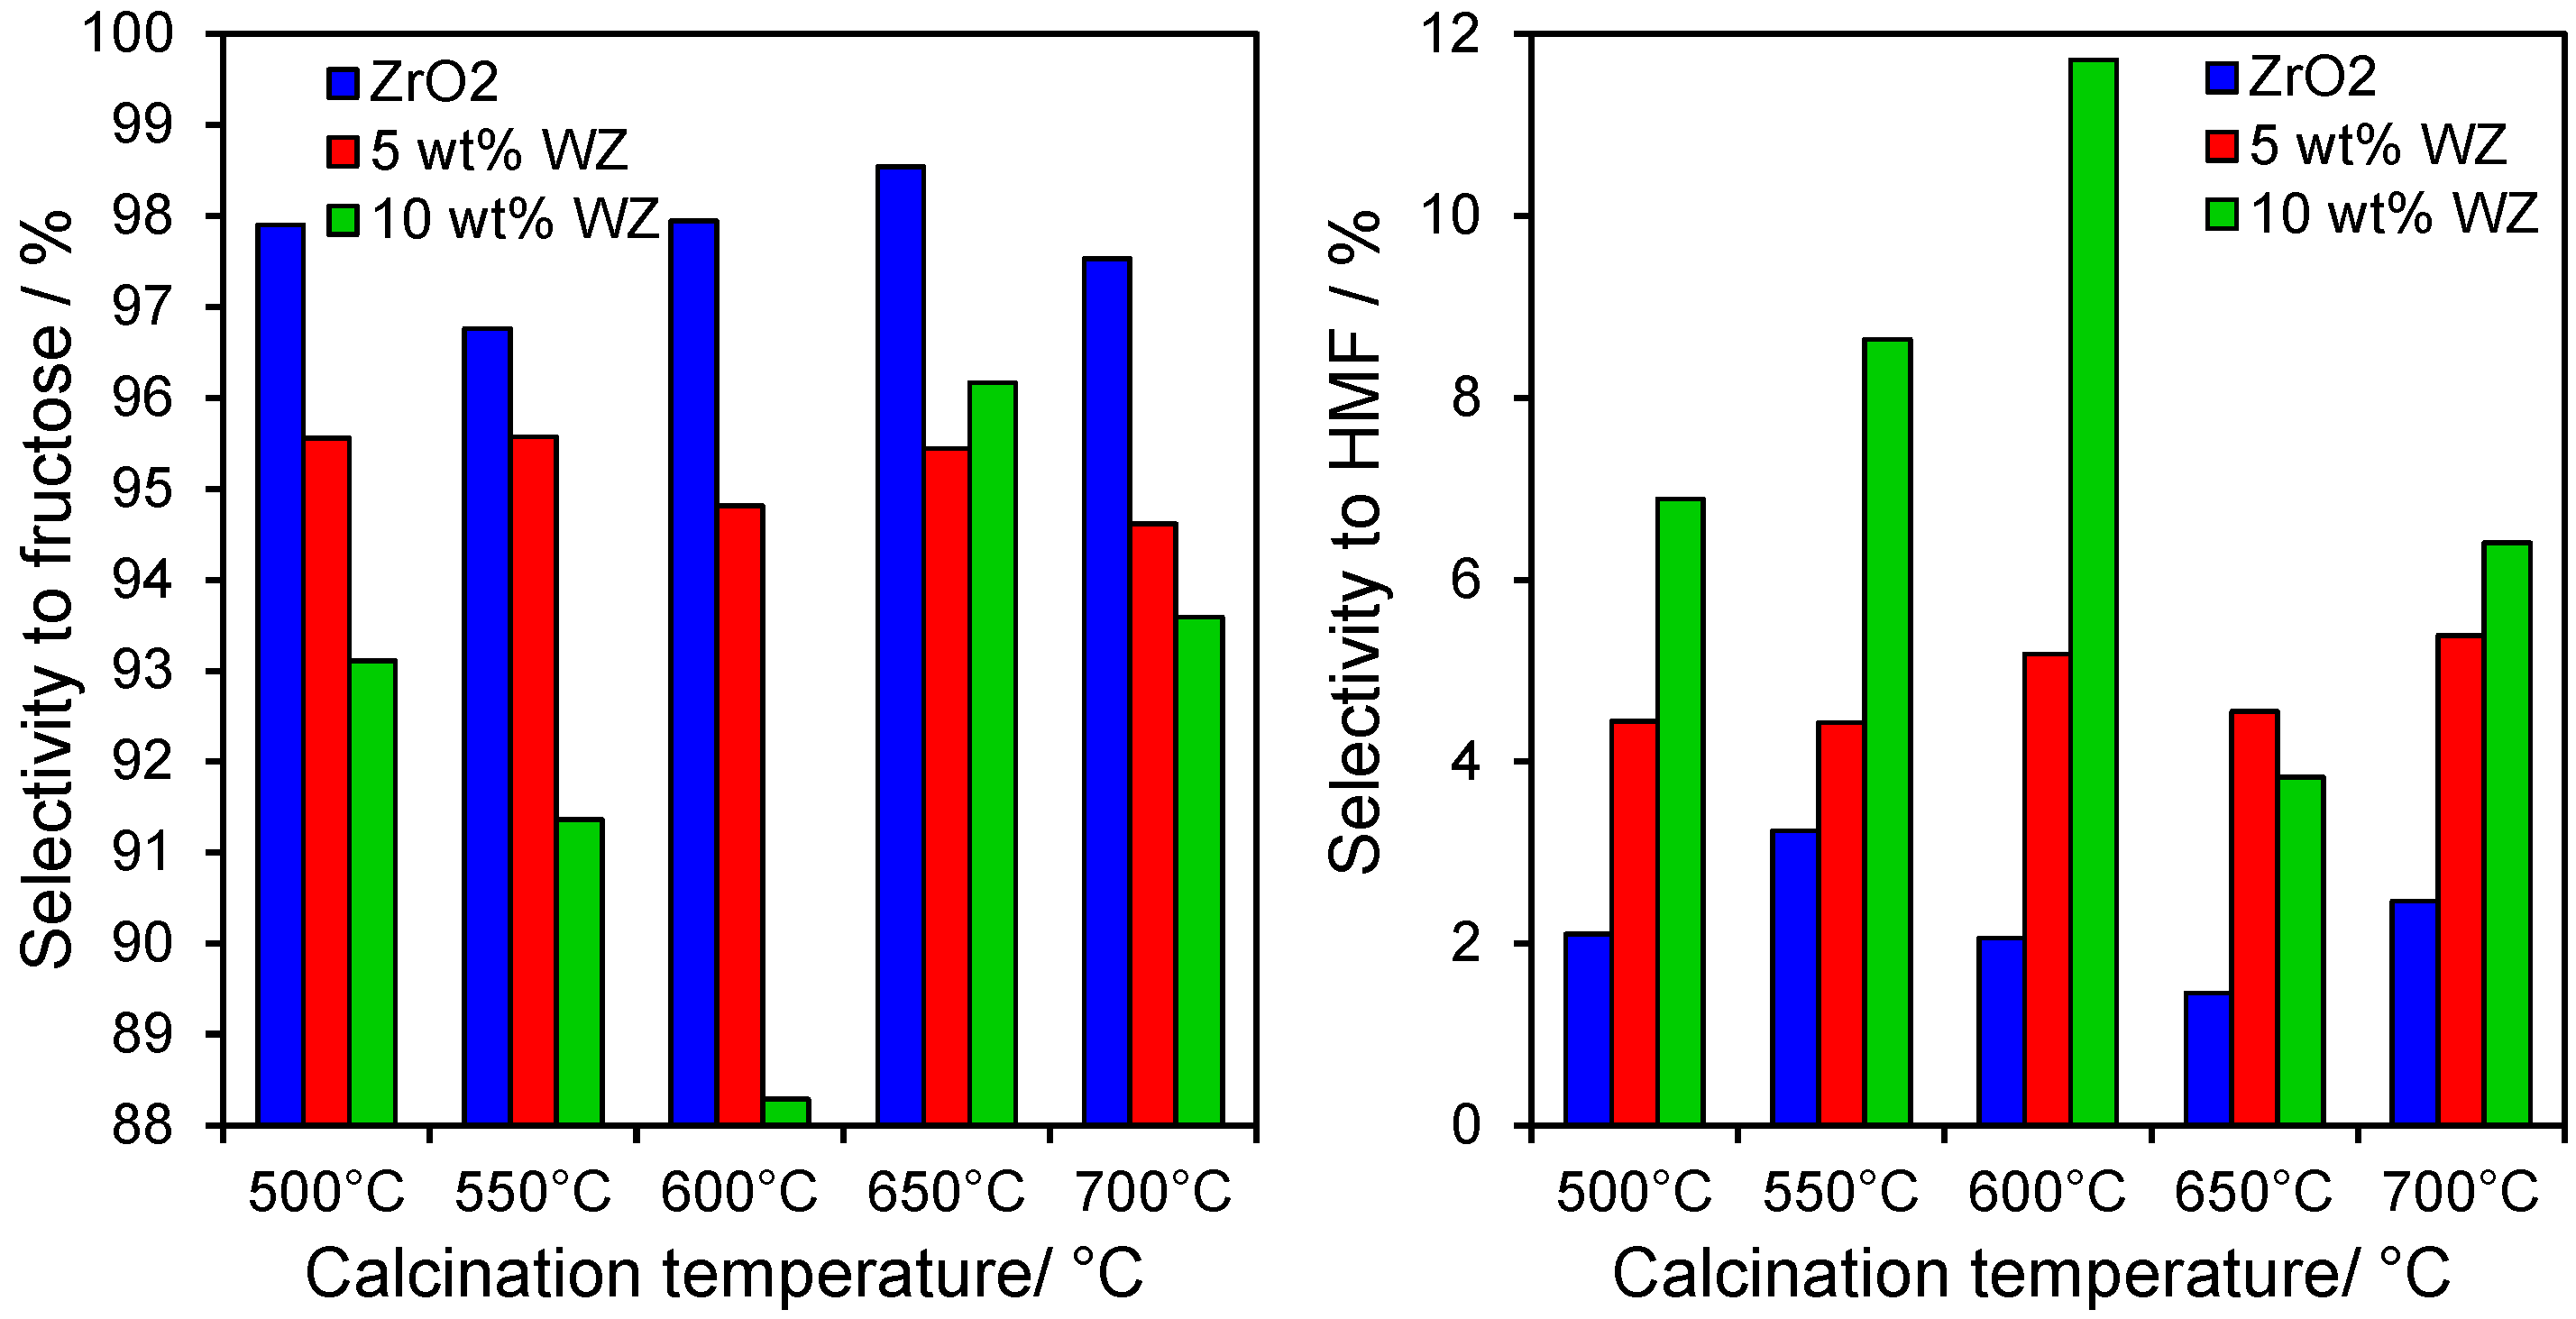
Only two major reaction products were observed from glucose conversion over all WZ materials, fructose via glucose isomerisation, and HMF via dehydration of the reactively-formed fructose. This reflects the low reaction temperatures employed in this study relative to the literature [
12] which disfavour HMF polymerisation and humin formation observed in other reports [
22]. In all cases, fructose was overwhelmingly the dominant product. However, tungsten incorporation significantly enhanced HMF production, with the 10 wt% WZ sample twice as selective towards the furan as the parent zirconia support (
Figure 4). High temperature calcination of WZ suppressed HMF formation at the expense of fructose, clearly indicating two competing reaction pathways, each requiring different active sites. Fructose appears favoured by Lewis acid sites present over the parent zirconia, whereas HMF is favoured by moderate surface tungstate densities of 2–3 atoms.nm
−2, significantly less than required to form a full monolayer (which impart Brönsted acidity), and calcination around 600 °C wherein surface areas remained around 100 m
2 g
−1. Fructose dehydration to HMF hence appears catalysed by isolated or dimeric WO
x clusters.
Figure 4.
(left) Selectivity to fructose; and (right) HMF production from glucose after 6 h reaction at 100 °C over zirconia and tungstated zirconias.
Figure 4.
(left) Selectivity to fructose; and (right) HMF production from glucose after 6 h reaction at 100 °C over zirconia and tungstated zirconias.
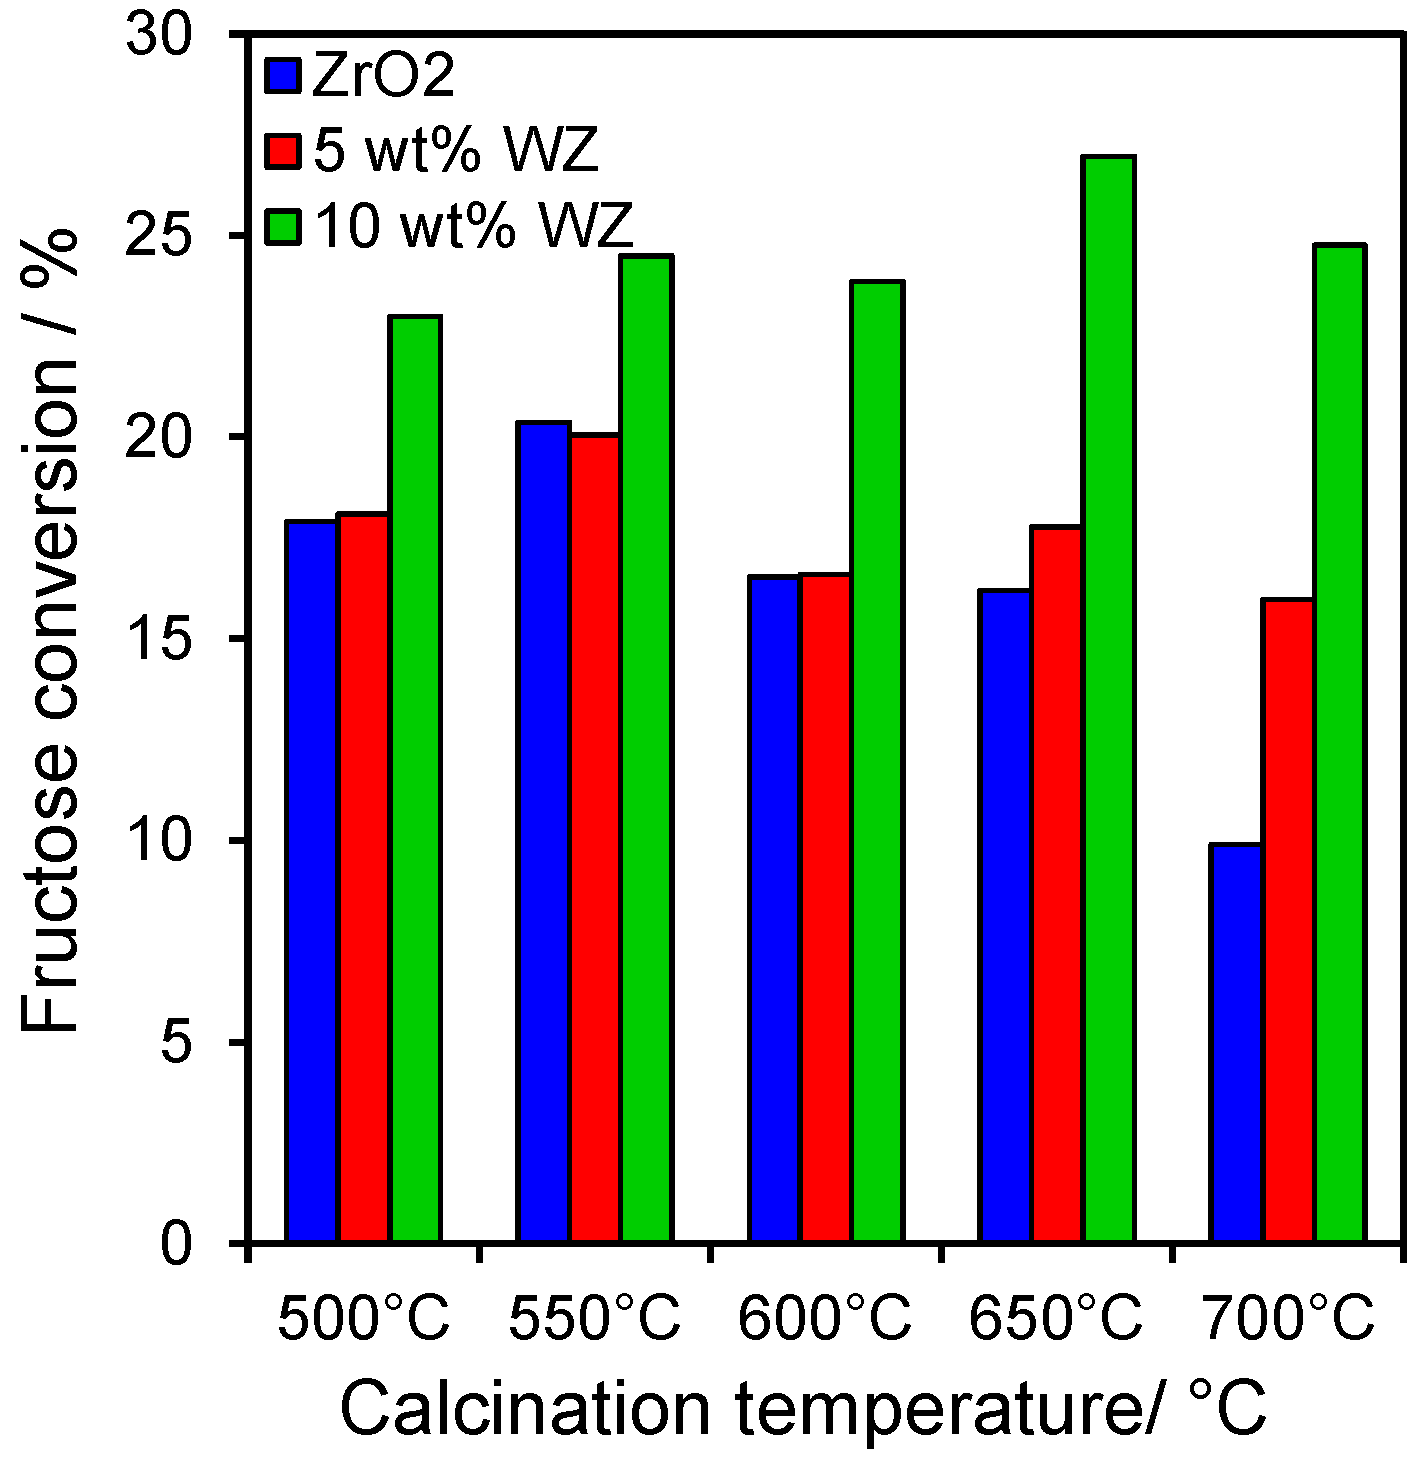
2.3. Catalytic Conversion of Fructose
In order to confirm the preceding hypothesis, namely that glucose isomerisation occurs over Lewis acid sites whereas fructose dehydration is favoured by Brönsted acid sites associated with small tungstate clusters, the behaviour of our WZ series was also assayed for the direct dehydration of fructose (
Figure 5). Activities were slightly higher than those observed for glucose, with fructose conversions spanning approximately 10%–30%. However, in contrast, regarding their reactivity to glucose, the WZ catalysts always outperformed the parent zirconia, consistent with their predominant Brönsted acidity observed by pyridine titration, and conferred significant conversion even at high calcination temperatures, despite the large decrease in BET surface areas; in contrast, calcination deactivated the pure zirconia. These observations are fully consistent with the notion that fructose dehydration occurs faster over WO
x Brönsted acid sites than Lewis acid sites on the parent ZrO
2 support.
Figure 5.
Fructose conversion after 6 h reaction at 100 °C over zirconia and tungstated zirconias.
Figure 5.
Fructose conversion after 6 h reaction at 100 °C over zirconia and tungstated zirconias.
Figure 6.
Selectivity to HMF production from fructose after 6 h reaction at 100 °C over zirconia and tungstated zirconias.
Figure 6.
Selectivity to HMF production from fructose after 6 h reaction at 100 °C over zirconia and tungstated zirconias.
HMF (and trace oligomers of its condensation products), alongside glucose formed via the reversible isomerisation reaction, were the major products of fructose dehydration, with the WZ samples significantly more selective to HMF than ZrO
2 (
Figure 6), with the highest selectivities of 15%–20% observed after moderate thermal processing of the 5 wt% and 10 wt% WZ catalysts, equating to a three-fold higher HMF yield, a consequence of the superior Brönsted acid character of the tugstated materials which favour rapid fructose dehydration over isomerisation back to glucose.
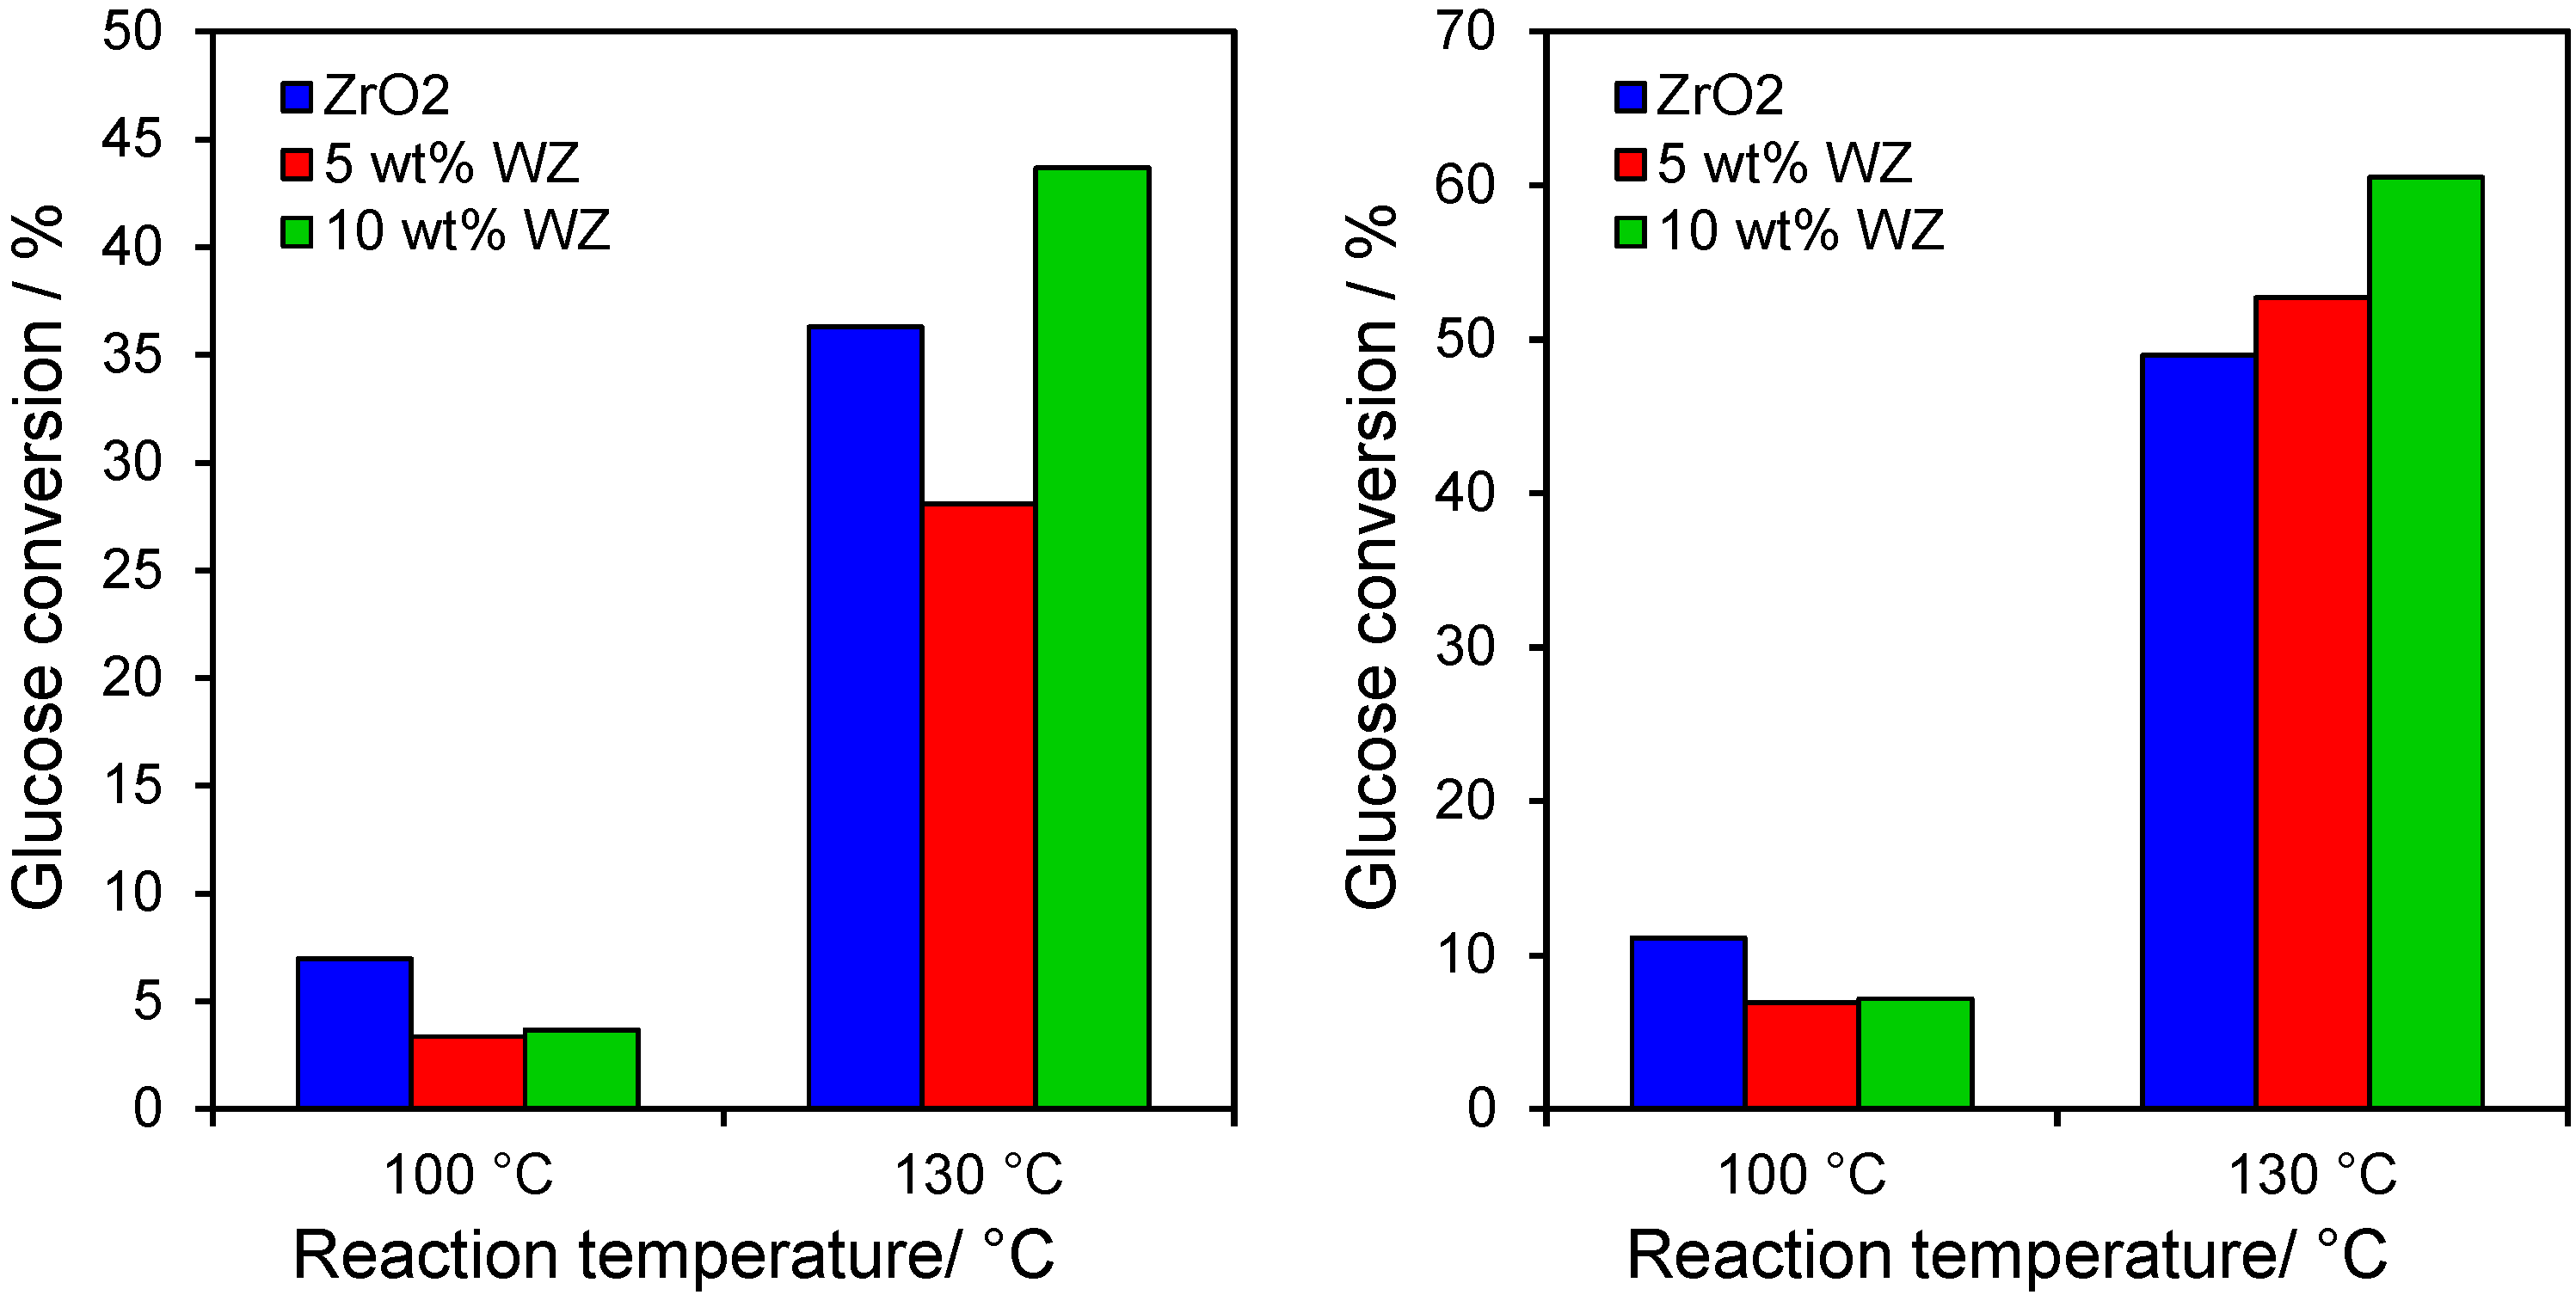
2.4. Catalytic Dehydration of Hydrolysate Sugar and Condensate
Having demonstrated the efficacy of WZ towards conversion of glucose and fructose model reactants, the behaviour of the 500 °C calcined materials was explored towards the transformation of hydrolysate sugar and condensate derived from Vietnamese rice straw. These catalysts were selected since they exhibited the optimum balance of glucose/fructose conversion and selectivity to HMF. The results in
Figure 7 show similar poor levels of glucose conversion within both the hydrolysate and condensate at 100 °C for all three catalysts, with the parent zirconia the most active in accordance with
Figure 3 and it superior Lewis acidity (
Figure 2) which is required to drive initial glucose isomerisation to fructose. However, even a small increase in reaction temperature to 130 °C dramatically enhanced catalyst activity, with conversion climbing to around 30%–40% for the hydrosylate and 50%–60% for the condensate. At these higher reaction temperatures, the 10 wt% WZ also now outperformed zirconia towards both feedstocks.
Figure 7.
Glucose conversion after 6 h reaction at 100 °C from (left) hydrolysate; and (right) condensate over zirconia and tungstated zirconias.
Figure 7.
Glucose conversion after 6 h reaction at 100 °C from (left) hydrolysate; and (right) condensate over zirconia and tungstated zirconias.
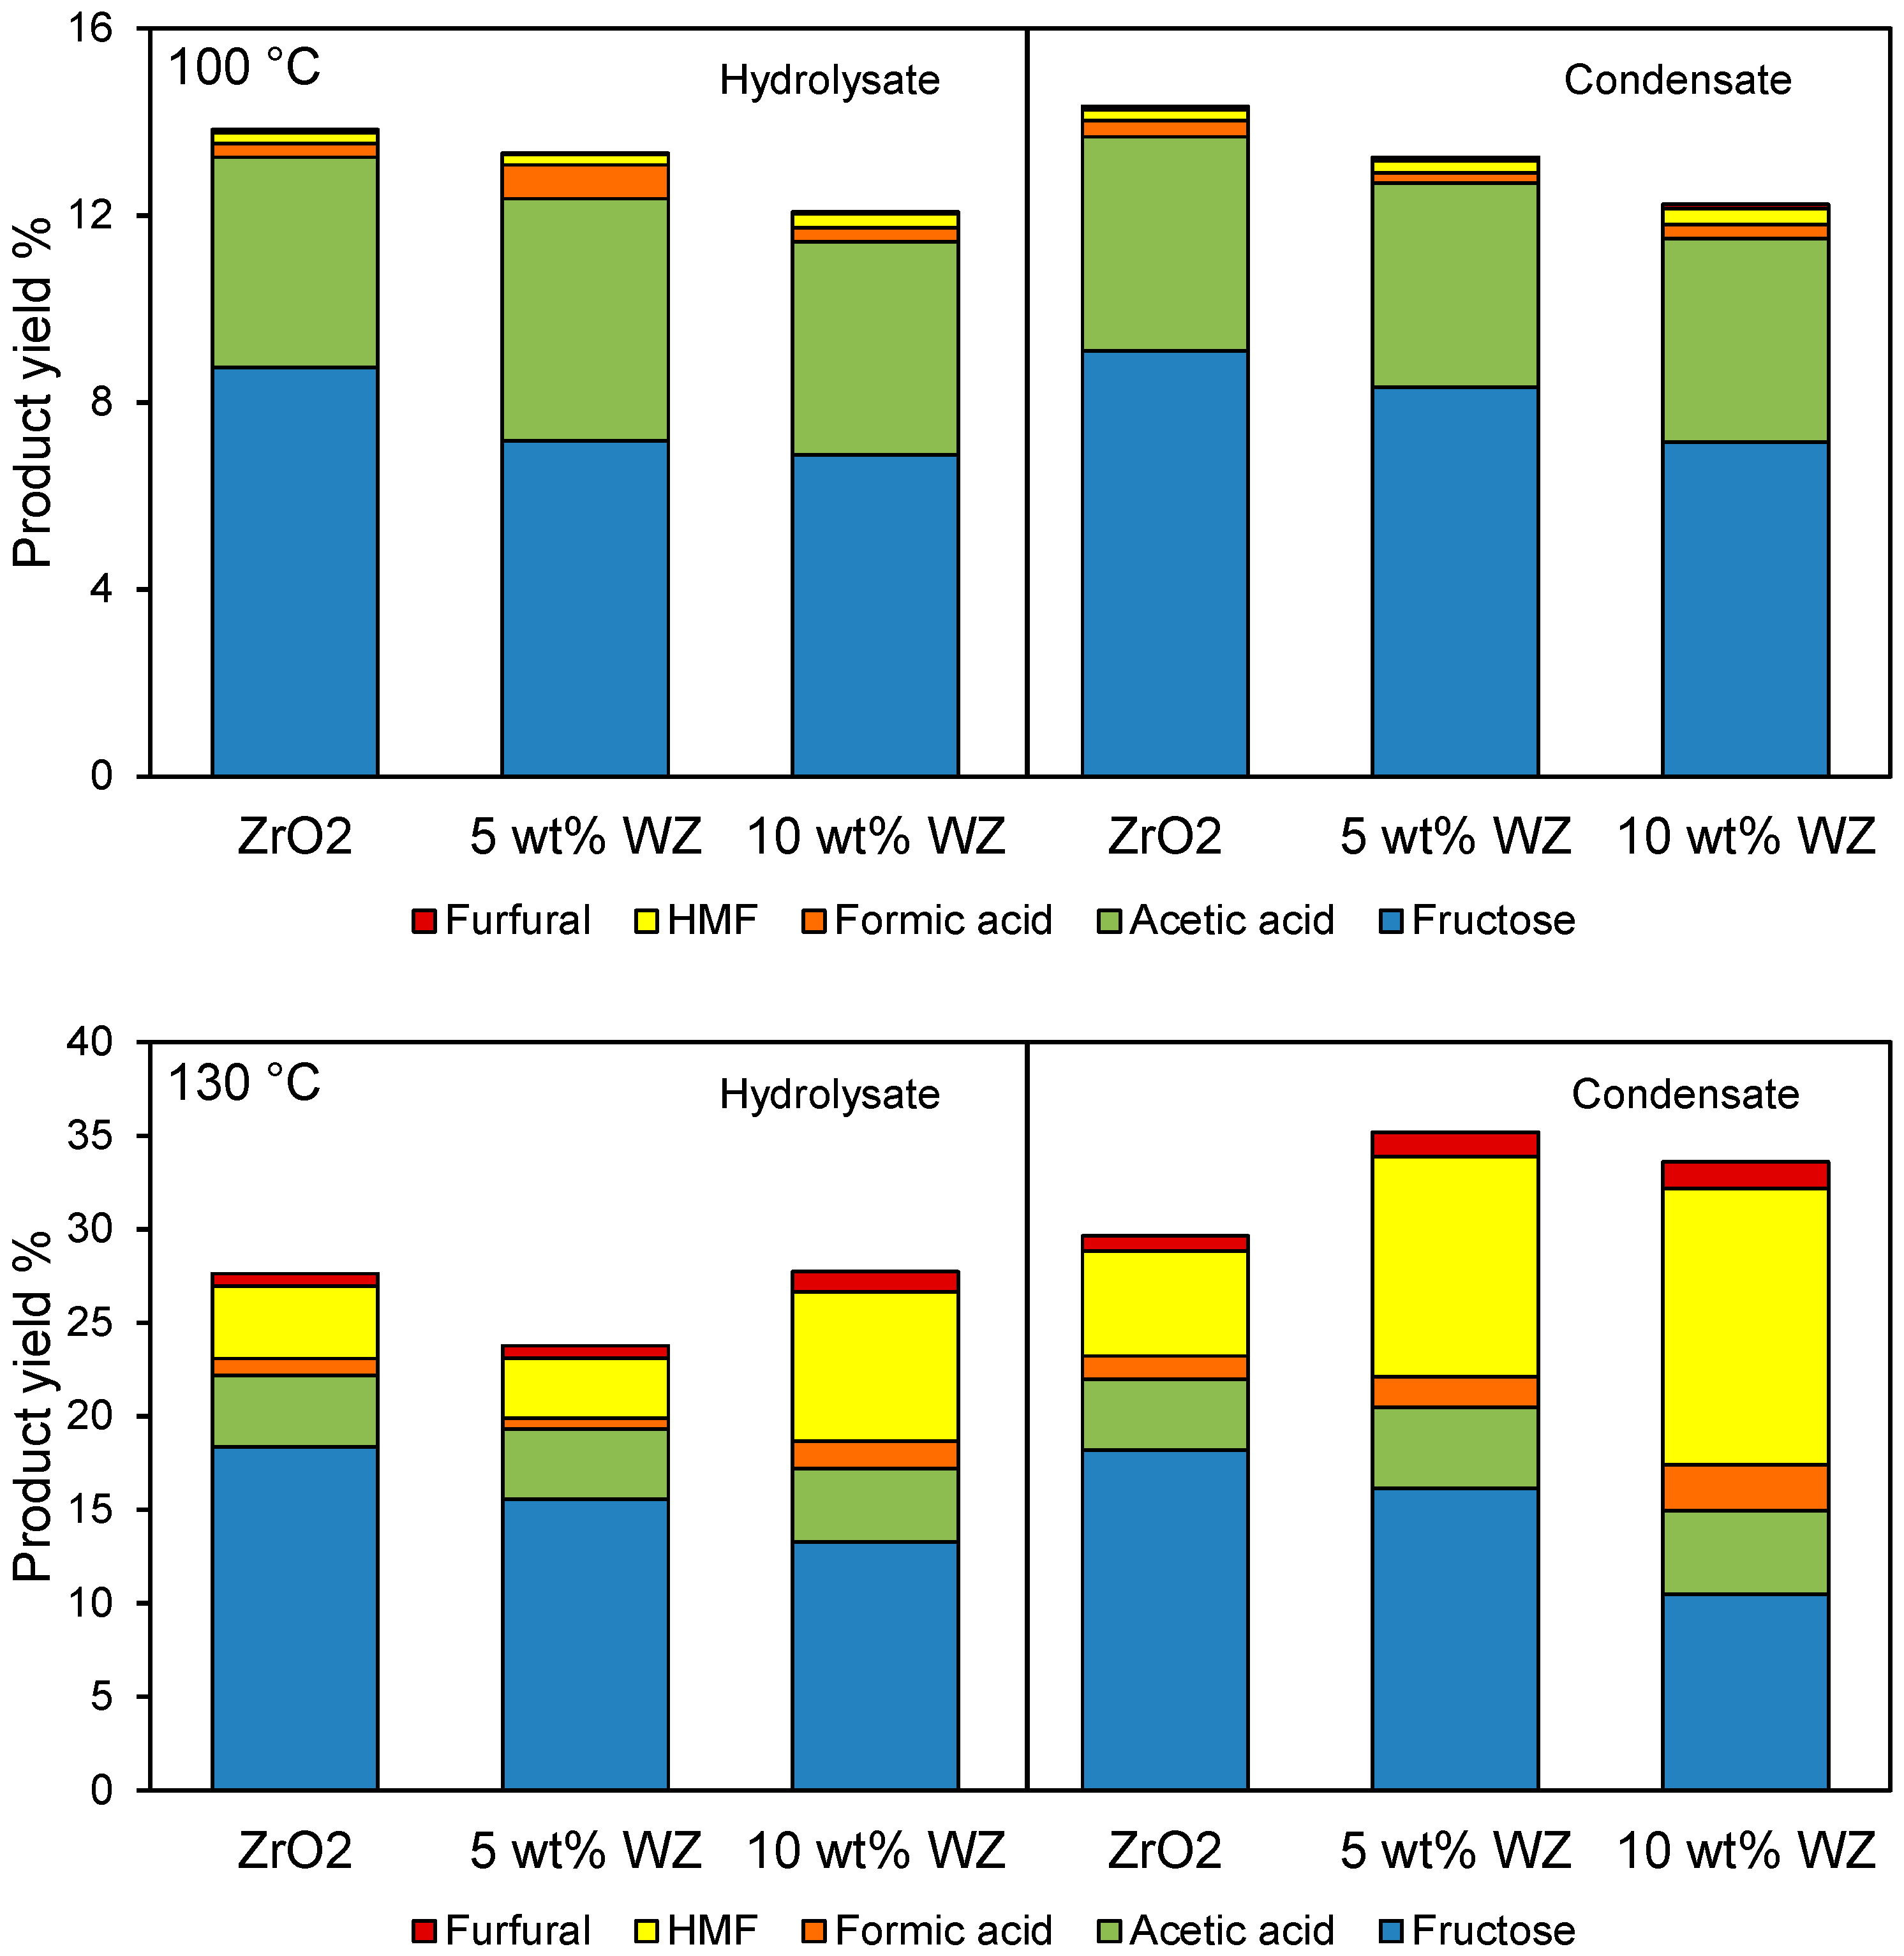
The slight rise in reaction temperature enhanced overall product yields from ~10% to between 25%–35% from both hydrolysate and condensate. Fructose was the primary product in almost all circumstances, with the observed acetic acid reflecting that present in the starting feedstocks and remaining essentially unchanged during reaction (equating to ~3.5 g·L
−1 in the hydrolysate and 2.5 g·L
−1 in the condensate). HMF and furfural production (the latter presumably formed from trace hemicellulose via dehydration of xylose) increased dramatically at 130 °C, seen in
Figure 8, particularly in the condensate wherein HMF actually becomes the principal product over the 10 wt% WZ catalyst with a yield of ~15%. This is a noteworthy achievement since it is difficult to obtain high HMF yields under aqueous reaction conditions due to competing HMF hydrolysis and resultant levulinic and formic acid formation, coupled with further degradation and polymerisation reactions to humins.
Figure 8.
Yield of major products after 6 h reaction of processed rice straw at 100 °C and 130 °C.
Figure 8.
Yield of major products after 6 h reaction of processed rice straw at 100 °C and 130 °C.

 ,
, 