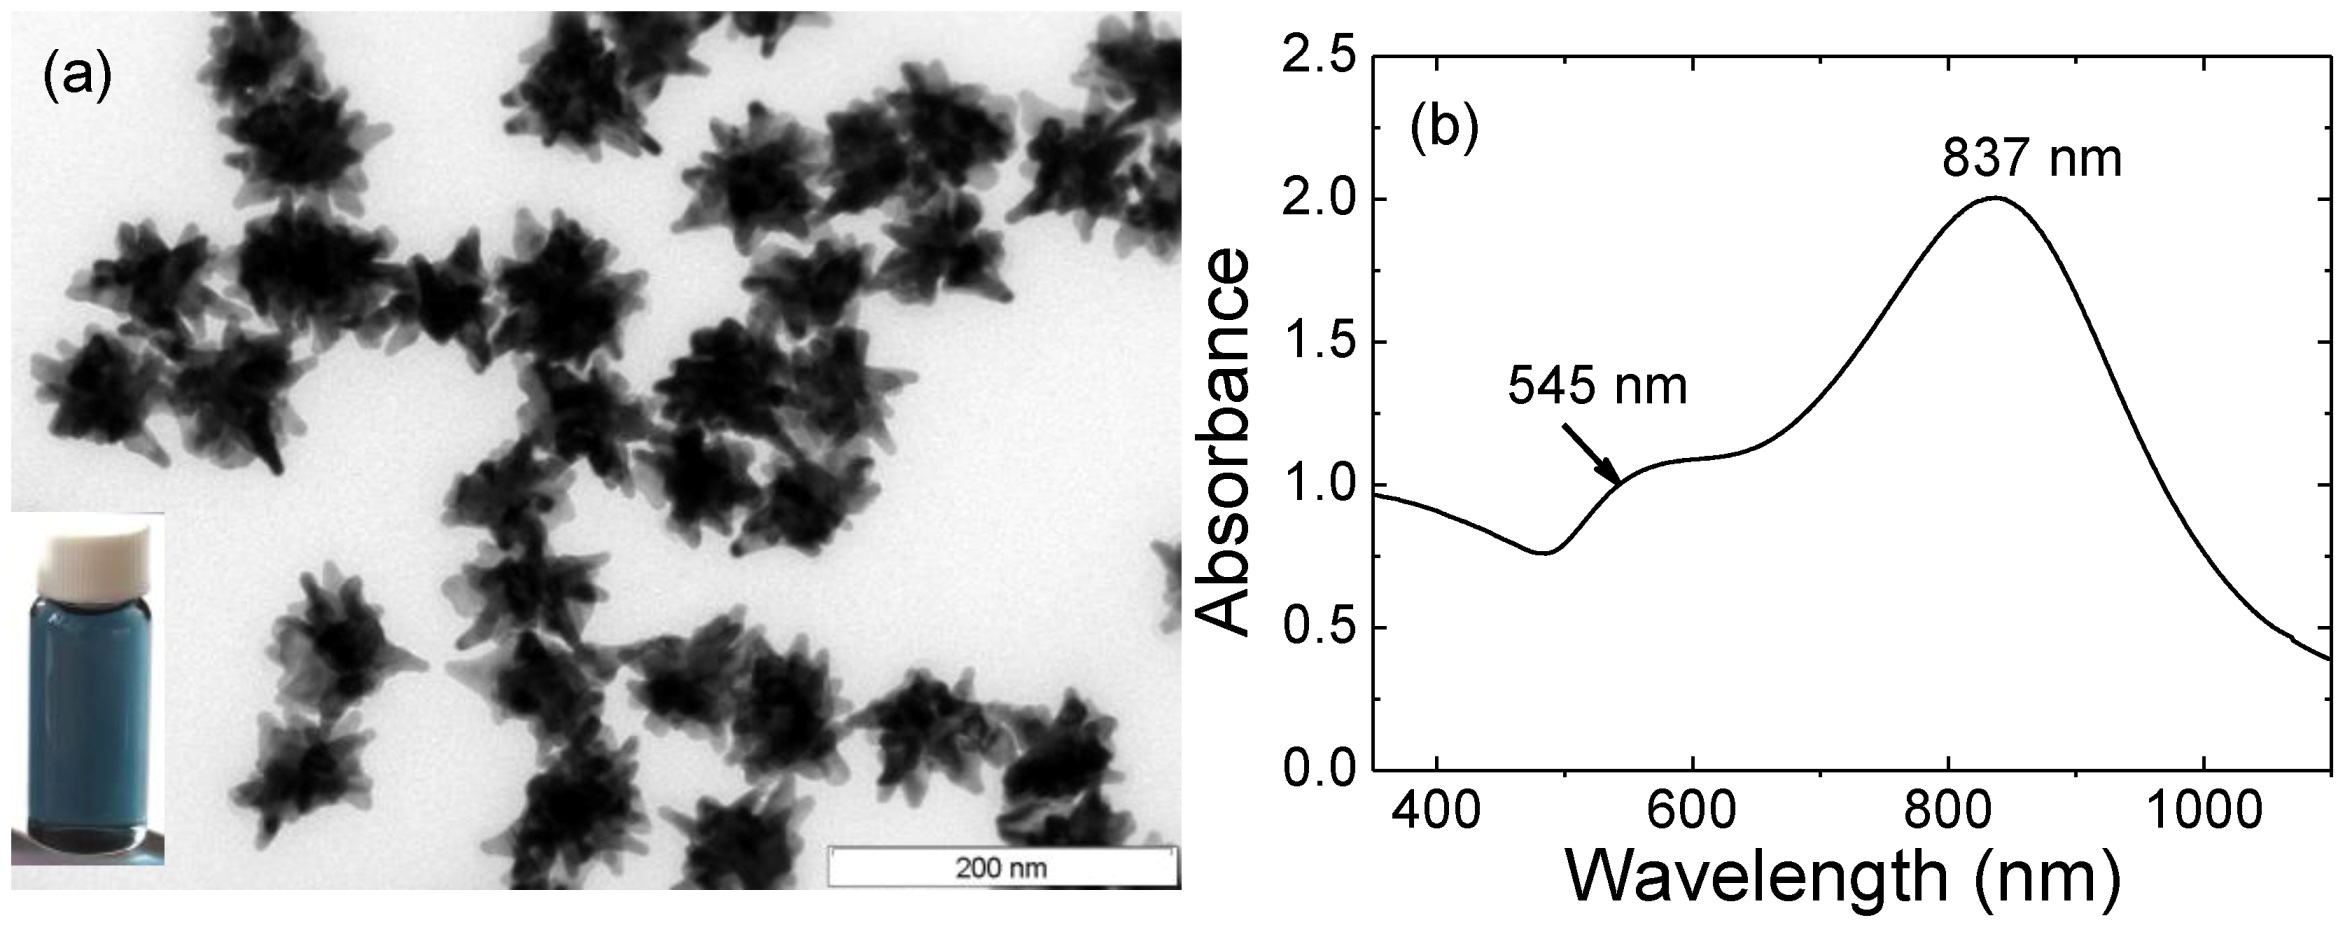
Figure 1.
(a) TEM image of gold nanostars. Scale bar: 200 nm. Inset: digital image of AuNSs’ solution; (b) Optical spectrum of gold nanostars.
2.1. Electrochemistry of [Fe(CN)6]4−/3− at Au-1,5PDT-AuNS Modified Electrodes for AuNSs’ Self-Assembly Time of 8 h
The gold nanostars were covalently self-assembled on gold electrodes using 1,5PDT as a cross linker molecule. It is important to emphasize that the purification of gold nanostars represent an important step for their self-assembly on dithiol modified electrodes. Repeated washing of gold nanostars with ethanol and Millipore water followed by one washing step in H
2SO
4:H
2O
2 = 1:1 and consecutive washing with Millipore water allows a partial removal of PVP from their surface [
25] and makes possible their covalent self-assembly on Au-1,5PDT-SAM modified electrodes. The structure of the 1,5PDT SAM was expected to be very similar to the structure of 1,6hexanedithiol SAM [
9] because there is only one -CH
2- difference between the chemical structures of the two dithiols. A dense coverage of the 1,5PDT SAM with up-right structure was achieved upon self-assembly of the dithiol from 15 mM ethanolic solution [
3,
4,
9]. The covalent binding of gold nanostars to dithiol films was observed to take place at the tips of the nanostars [
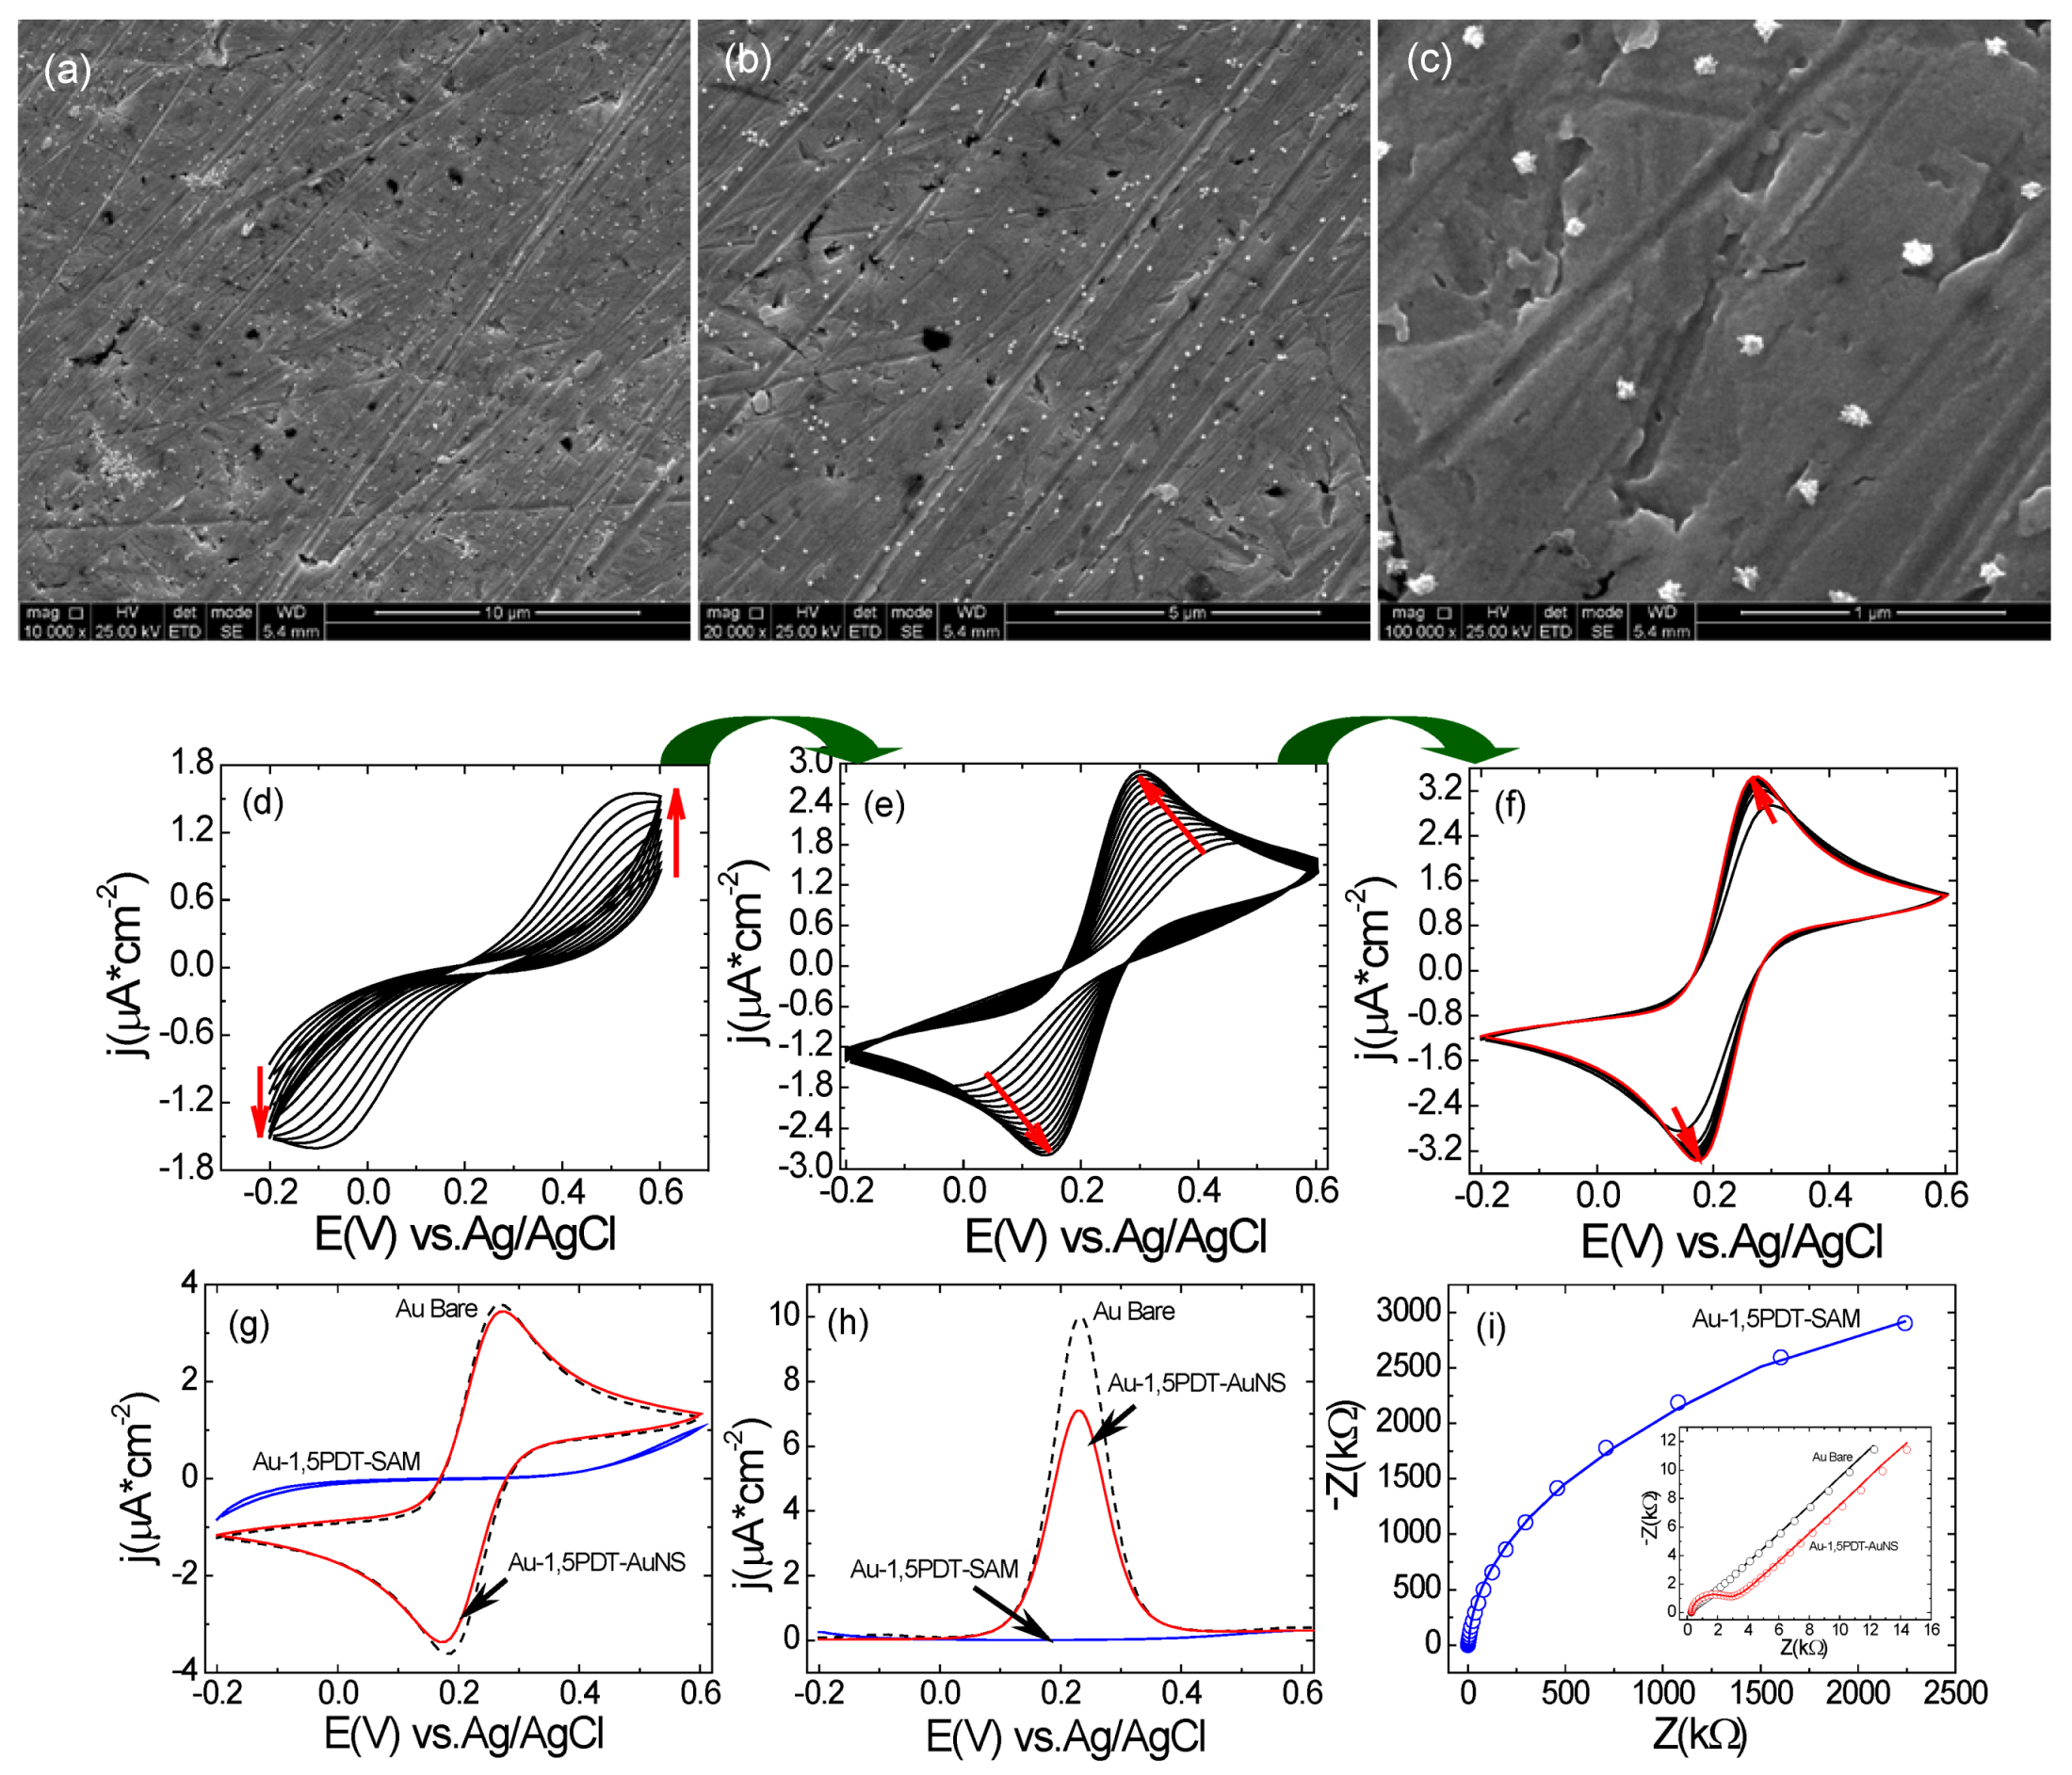
21]. Bilayers with increased AuNSs’ surface coverage were fabricated by immersing the 1,5PDT modified electrodes in aqueous solution of AuNSs (1 mg/mL) and let to react at room temperature for 8 h, 16 h, 24 h and 32 h under slow magnetic stirring. As mentioned previously, the first experimented self-assembly time was 8 h. The surface coverage with AuNSs was low (
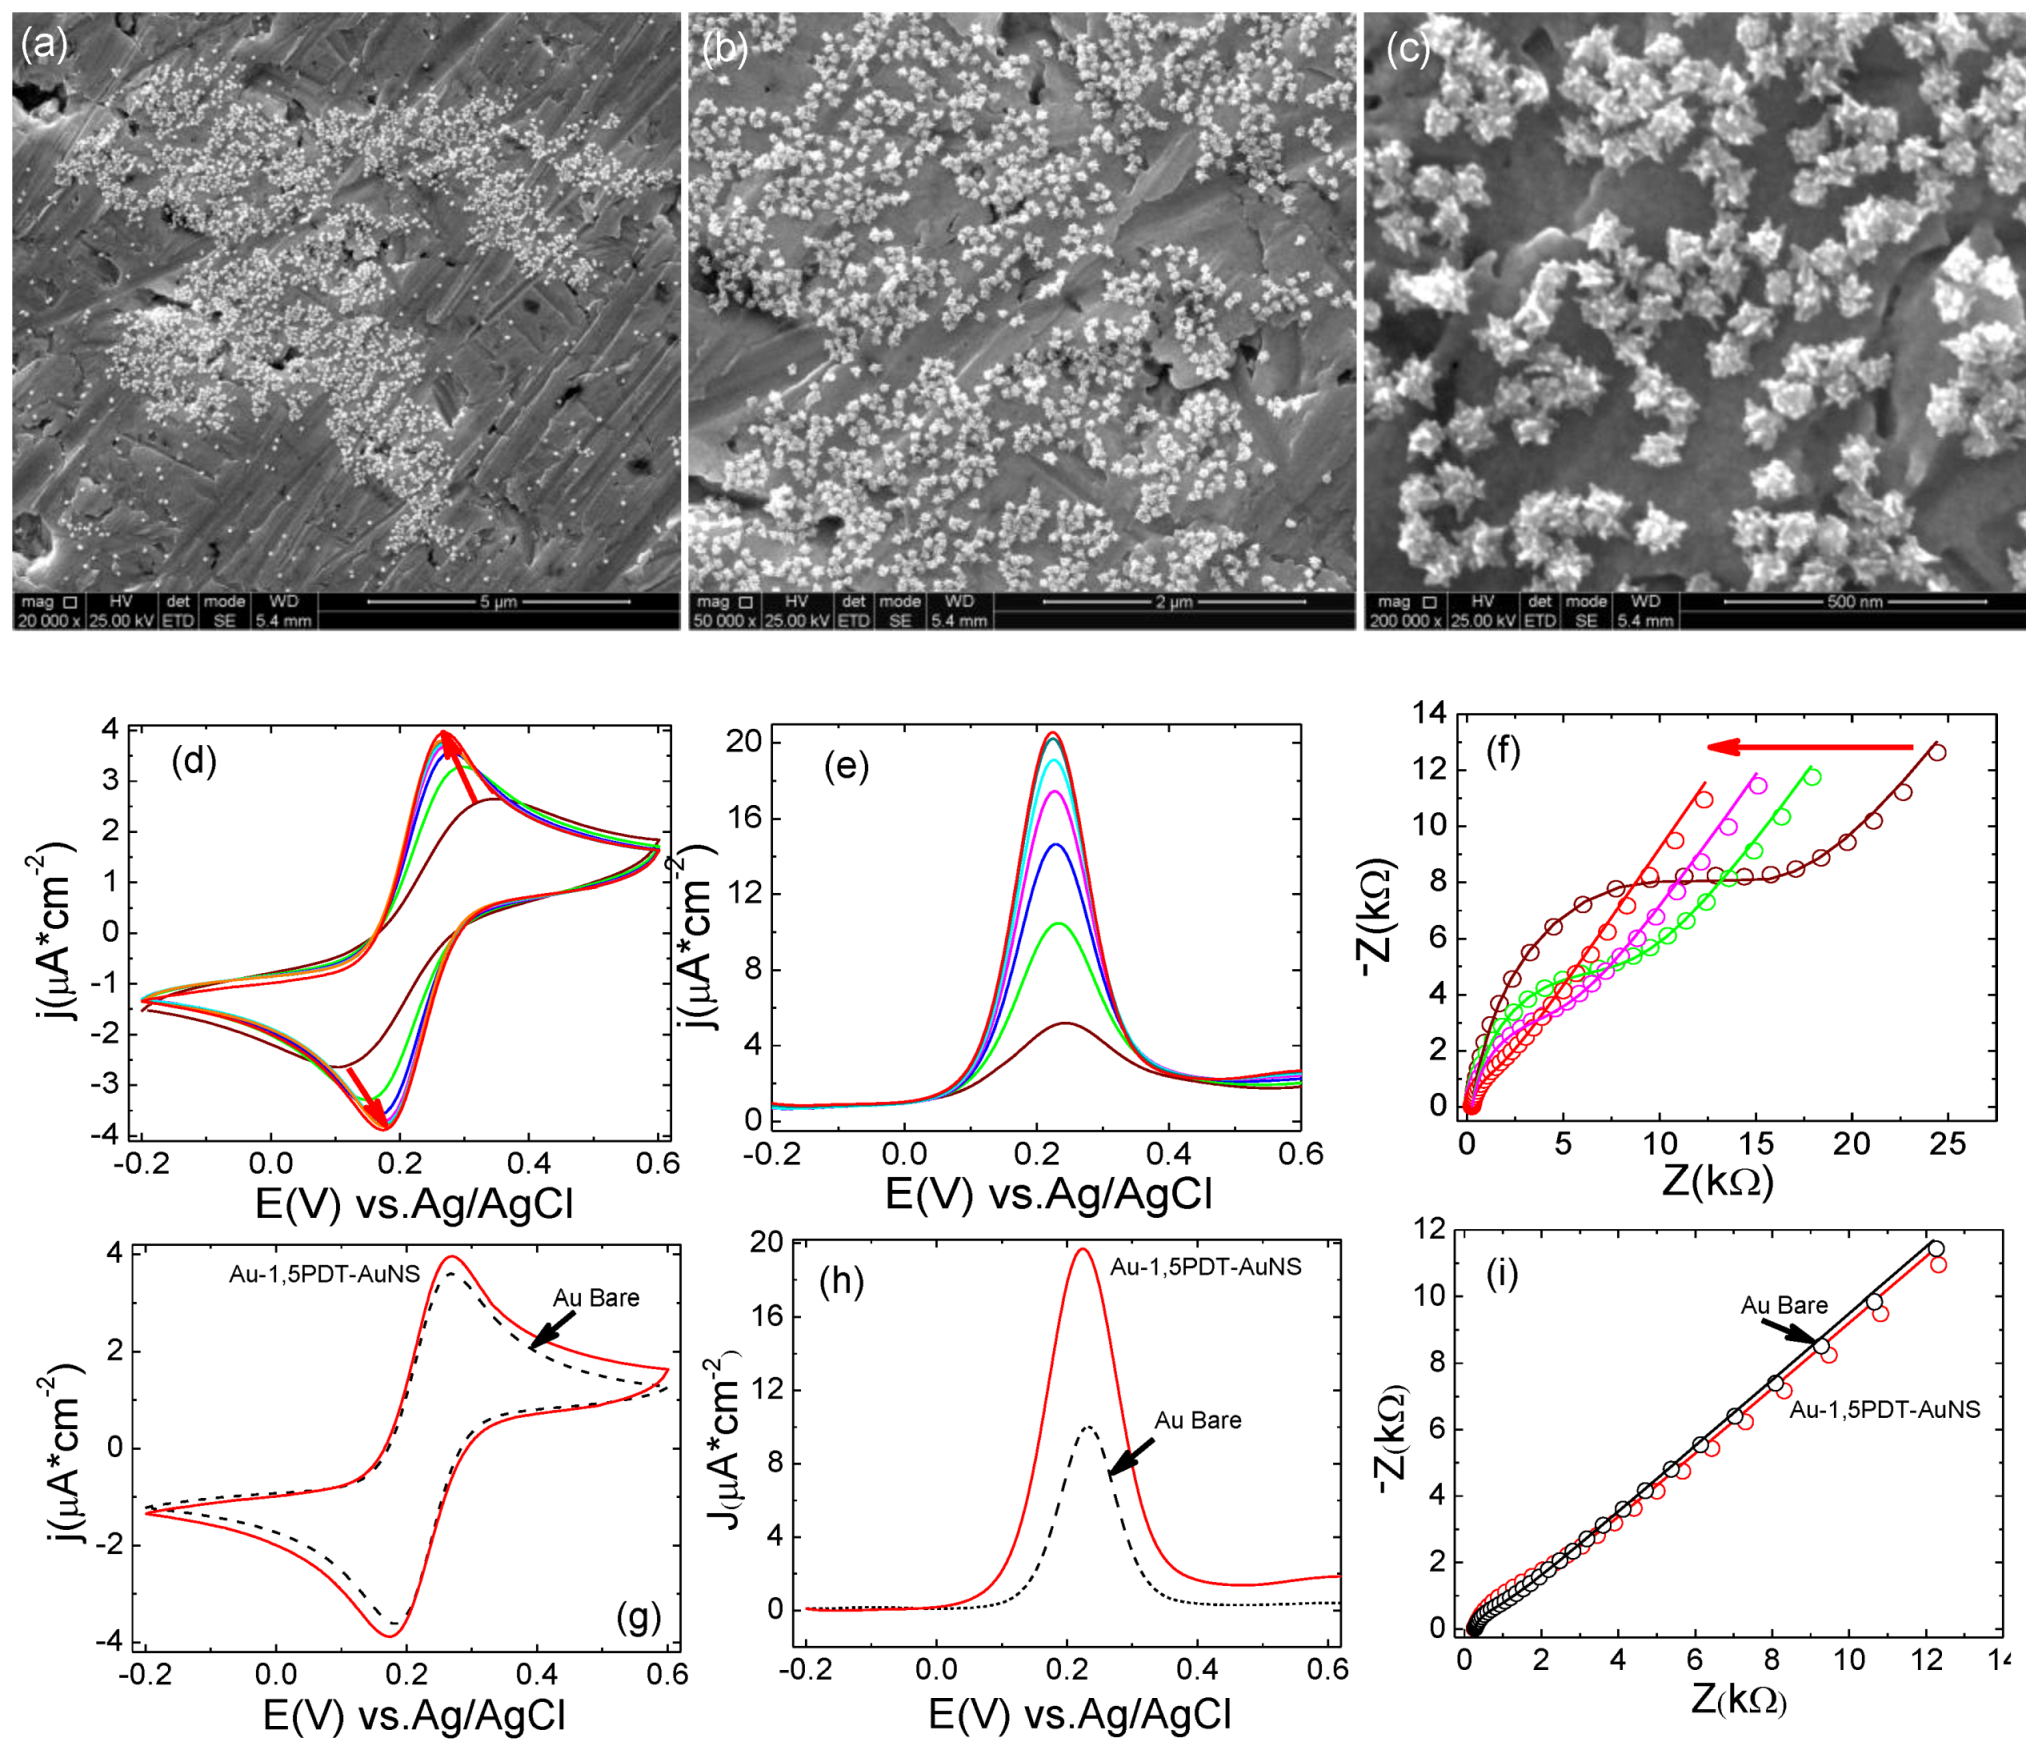
Figure 2a–c) but the electron transfer process at this particular electrode was very interesting.
In the CVs a strong symmetric flow of Faradaic currents was observed upon consecutive scans in 0.0005 M [Fe(CN)
6]
3−/4− aqueous solution (
Figure 2d–f), with a transition from an irreversible to a reversible electrochemical behavior. SEM analysis of this electrode before and after electrochemical measurements (
Figure 2a–c) has revealed similar surface coverage and no evident change in shape of gold nanostars. The first 10 cyclic voltammograms show high peak-to-peak potential separations and low current densities (for example the 10th CV in
Figure 2d has a ∆
Ep = 0.653 V and
ja = 1.47 µA cm
−2vs. Ag/AgCl). Consecutive measurements of CVs (
Figure 2e,f) show a progressive and continuous increase of peak current densities and continuous decrease of peak-to-peak potential separation indicating that the interfacial electron transfer was becoming faster. The final cyclic voltammogram has reached a peak-to-peak potential separation of ∆
Ep = 0.108 V at a current density of
ja = 3.45 µA cm
−2 (red curve in
Figure 2f,g) as compared to bare gold for which ∆
Ep = 0.088 V and
j = 3.60 µA cm
−2 (black dashed curve in
Figure 2g) illustrating slightly slower electron transfer (ET) kinetics at the AuNSs modified electrode (8 h self-assembly time). In the square wave voltammograms one can observe current densities of
ja = 7.1 µA cm
−2 (0.233 V) at Au-1,5PDT-AuNS modified electrode (8 h, red curve in
Figure 2h) as compared to bare gold for which the current density was
ja = 10 µA cm
−2 at 0.233 V (black dashed curve in
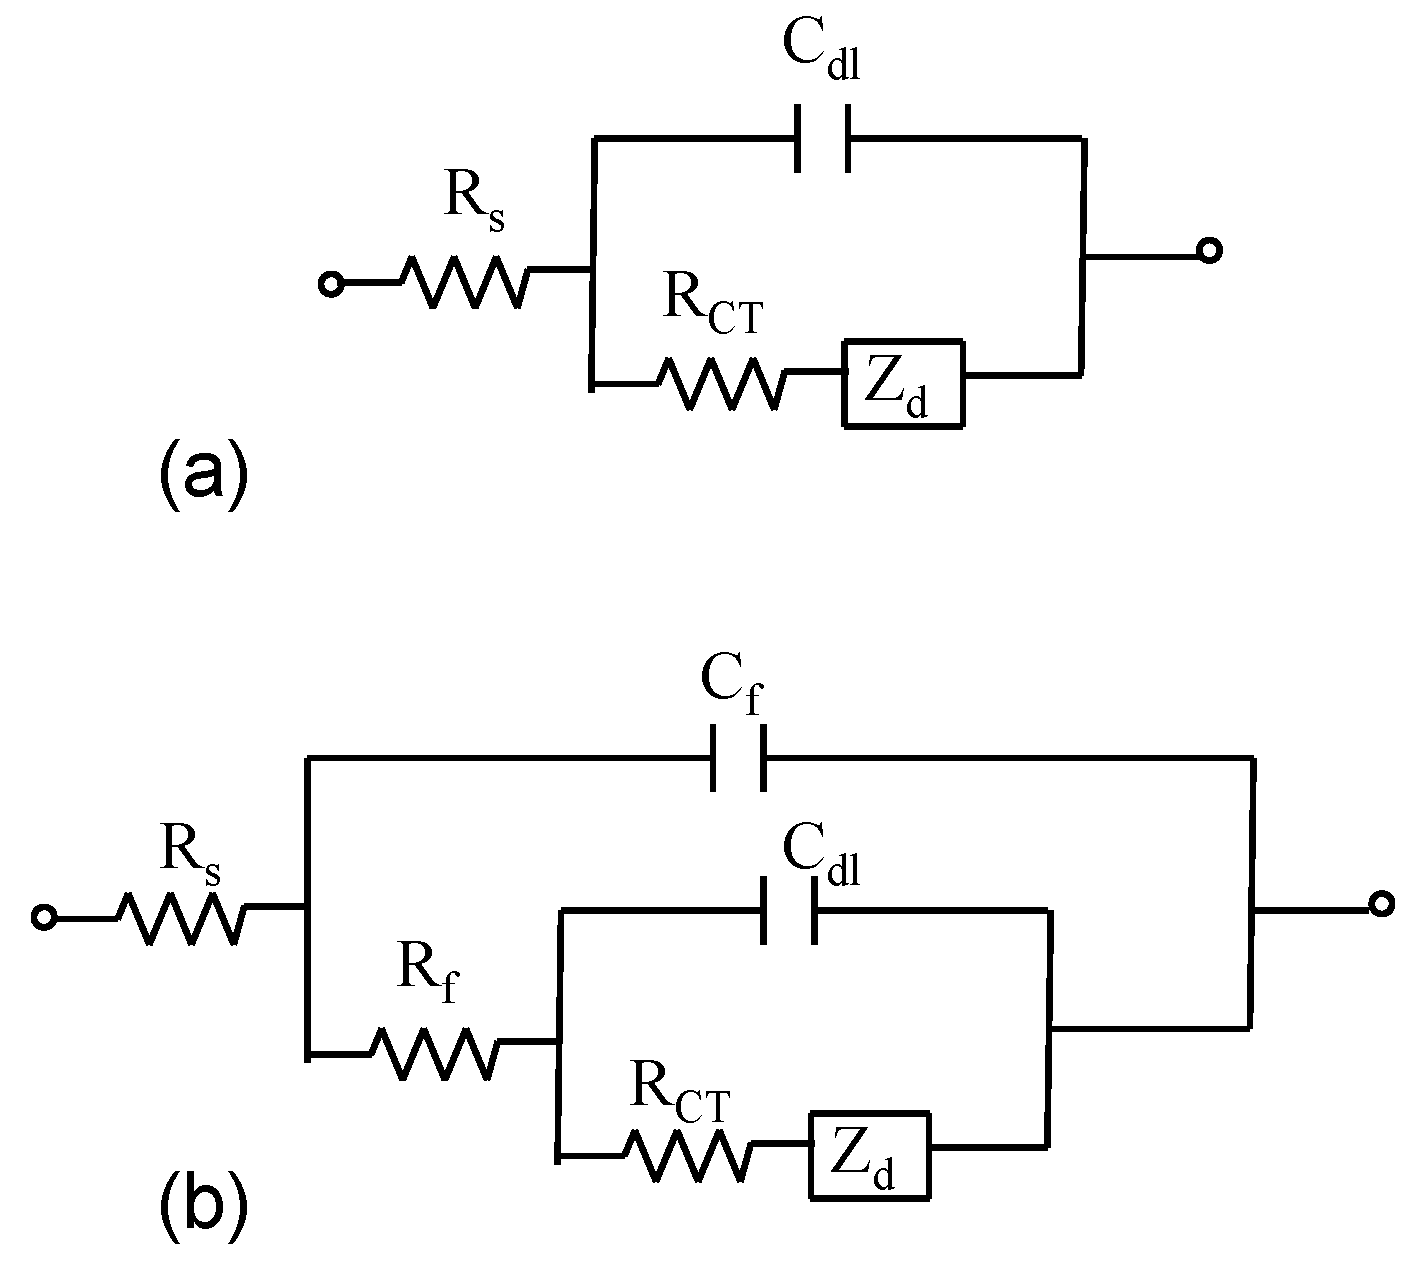
Figure 2h). Electrochemical impedance spectroscopy measurements were performed in order to obtain a detailed characterization of the interfacial properties of the modified electrodes. The modeling of EIS spectra for bare gold and AuNS modified electrodes’ surface was done using Randles electrical equivalent circuit (
Figure 3a) or a second more complex electrical equivalent circuit (
Figure 3b) which consist of a solution resistance Rs connected in series with the film capacitance and resistance,
Cf and
Rf (elements in parallel to each other) and in series with the double layer capacitance
Cdl, charge transfer resistance,
RCT and Warburg impedance (
Zw) respectively (
Figure 3b). The complex impedance is the sum of the real,
Z', and imaginary,
Z", components that originate mainly from elements of resistance and capacitance of the cell, respectively. The capacitance and resistance of the film,
Cf and
Rf give information about film area [
26,
27] and electron tunneling efficiency through the dithiol layer [
3,
4,
28,
29].
The double layer capacitance is dependent on the conductive (will increase) or insulating (will decrease) properties of the interface (
Table 1), whereas the charge transfer resistance is due to electron transfer generated by the redox probes present in the electrolyte solution. The fittings of all Nyquist diagrams were done by tentatively approaching the experimental curves through appropriate choices of the parameter values. All fittings were checked by evaluation of the chi-squared parameter, which was of 10
−4 order of magnitude yielding 98% confidence bound between parameters. One important parameter for further evaluation of the electrochemical features of the modified electrodes is the charge transfer resistance. The charge-transfer resistance is inverse proportional to the exchange current under equilibrium
I0 (1):
and can be used to evaluate the experimental heterogeneous electron-transfer rate constant,
ket, based on the Equations (1) and (2):
where
R is the gas constant,
T is the temperature (K),
A is the electrode area (0.0314 cm
2), [
c] corresponds to the bulk concentration of the redox probe (0.0005 mol cm
−3), and
n is the number of transferred electrons per molecule of the redox probe (
n= 1) for the [Fe(CN)
6]
3−/4− probes.
Figure 2.
(a–c) SEM images with different magnifications of top view of AuNS modified electrode for 8 h. Scale bars: 10 µm (a), 5 µm(b) and 1 µm(c); (d–f) Consecutive CVs measured at the Au-1,5PDT-AuNS modified electrode in aqueous solution of 0.0005 M [Fe(CN)6]4−/3− and 0.1 M NaClO4. Scan rate 50 mV/s; (g–h) Comparison of final cyclic voltammograms (g), square wave voltammograms (h, sw amplitude 50 mV, frequency 10Hz and potential step 2 mV) and Nyquist diagrams (i, frequency range 10 kHz to 0.1 Hz, amplitude 10 mV) measured at Au-1,5PDT-AuNS modified electrodes (red curves), bare gold (black dashed curves) and Au-1,5PDT-SAM (blue curves) in 0.0005 M [Fe(CN)6]4−/3− and 0.1 M NaClO4.
Figure 3.
Randles circuit (a) and the electrical equivalent circuit utilized to model impedance spectra at film modified electrodes (b).
Figure 3.
Randles circuit (a) and the electrical equivalent circuit utilized to model impedance spectra at film modified electrodes (b).
Table 1.
Parameter values obtained from fittings of the impedance spectra represented in
Figure 2i using non-linear square fit procedure
†.
Table 1.
Parameter values obtained from fittings of the impedance spectra represented in Figure 2i using non-linear square fit procedure †.
| EIS plot | Rs (kΩ) | Cf (µF) | Rf (kΩ) | Cdl (μF) | RCT (kΩ) |
|---|
| Au Bare | 0.284 (0.70) | - | - | 1.89 (0.11) | 0.61 (0.97) |
| Au-1,5PDT-SAM | 3.52 (0.60) | 0.252 (0.48) | 2558.4 (0.26) | 0.28 (0.92) | 2027 (0.97) |
| Au-1,5PDT-AuNS (8 h) | 0.303 (0.72) | - | - | 0.34 (0.98) | 2.60 (0.85) |
Table 2.
Heterogeneous electron transfer rate constants estimated using
RCT values presented in
Table 1 and based on Equations (1) and (2).
Table 2.
Heterogeneous electron transfer rate constants estimated using RCT values presented in Table 1 and based on Equations (1) and (2).
| EIS plot | ket(cm s−1) |
|---|
| Au bare | 2.78 × 10⁻⁵ |
| Au-1,5PDT-SAM | 0.84 × 10⁻⁸ |
| Au-1,5PDT-AuNS (8 h) | 0.65 × 10⁻⁵ |
The estimated heterogeneous electron transfer rate constants for bare gold, Au-1,5PDT-SAM and Au-1,5PDT-AuNS (8 h) modified electrodes are presented in
Table 2. The
ket at 1,5PDT modified electrode was three orders of magnitude smaller than at bare gold electrode indicating a strong hindered electron transfer. The electrochemical insulating nature of the 1,5PDT monolayer is illustrated also by the increase of solution resistance,
Rs (
Table 1). The fact that the tunneling resistance behaves as a solution resistance was previously demonstrated by Diao
et al. [
28,
29].
The estimated electron tunneling coefficient β was 0.97 Å
−1 for a tunneling distance of 8.75 Å (7 × 1.25 Å SAM chain length) [
3,
4]. This β value is much smaller than that of 1.3–1.8 Å
−1 estimated for through space tunneling [
30] indicating that the electron tunneling at the Au-1,5PDT-AuNS modified electrodes is through-bond tunneling. The heterogeneous electron transfer rate constant,
ket, at AuNS modified electrode was smaller than that at bare gold electrode (
Table 2) illustrating a slower electron transfer kinetics at the Au-1,5PDT-AuNS modified electrode being in accordance with lower current densities in the CVs and SQWVs (
Figure 2g,h) than those at bare gold electrode. This is due to low surface coverage with AuNSs and probably due to their large size (49.72 nm average core diameters and 19.44 nm average tip lengths). After our knowledge, there are no studies published on the electrochemical properties of gold nanostars. Only recently, we have published a report in which we have presented a comparison of kinetics of electron transfer at two different self-assembled films: one containing dithiol and larger gold nanostars, the other containing the same dithiol and spherical nanoparticles [
31]. A 2.5 times increase of double layer capacitance was observed at 45% surface coverage with gold nanostars. The study shows for the first time, a possible shape effect of gold nanostars in an electrochemical process as compared to spherical nanoparticles [
31]. The 1,5pentanedithiol self-assembled on gold electrodes has greatly hindered the heterogeneous electron transfer between the [Fe(CN)
6]
3−/4− redox probes in solution and the underlying bare gold electrode, this electronic blocking being illustrates by the disappearance of Faradaic currents in the cyclic voltammograms (maximum 50 scans) and square wave voltammograms (blue curves in
Figure 2g,h) and increase of solution resistance (
Table 1). The corresponding Nyquist plot in
Figure 2i (blue EIS plot) shows a depressed semicircle for all range of frequencies (10,000 Hz to 0.1 Hz) with no evident diffusion profile at low frequencies which corresponds to a high resistance to the charge transfer and a three order magnitude decrease of the heterogeneous electron transfer constant (see parameters values for Au-1,5PDT-SAM in
Table 1,
Table 2). The strong insulating behavior of 1,5PDT-SAM is almost nullified by the AuNSs consecutively attached to the electrodes with low surface coverage, generating EIS plots with small semicircles at high and intermediated frequencies and well defined diffusion profiles at low frequencies demonstrating semi-infinite planar diffusion to the film (slope was unity for the red EIS plot in inset of
Figure 2i). The switching-on of [Fe(CN)
6]
3−/4− electrochemistry upon AuNS self-assembly suggest that the rate limiting step is the exchange of electrons between redox probes in solution and AuNS at the electrode/solution interface and not the electron tunneling through the dithiol layer. Compared to spherical gold nanoparticles (AuNPs) or gold nanorods (AuNRs) self-assembled on electrodes using as cross linker molecules similar dithiols [
3,
4,
31], the gold nanostars have revealed a more complex electrochemical behavior. For example, at low surface coverage with larger AuNSs, the electrochemistry of [Fe(CN)
6]
4−/3− was recovered completely (
Figure 2b, [
31]), whereas at quit high surface coverage with spherical gold nanoparticles (13 nm average diameters) the electrochemical process is far from being reversible (
Figure 2f,g, [
31]). In both cases the 1,5PDT was used as cross-linker molecule and its strong insulating electronic behavior could not be nullified by the spherical gold nanoparticles but it was nullified by the gold nanostars [
31]. Moreover, the heterogeneous electron transfer constant was smaller at Au-1,5PDT-AuNP (0.087 × 10
−5 cm s
−1) than at Au-1,5PDT-AuNS (3.04 × 10
−5 cm s
−1) modified electrodes [
31].
2.2. Electrochemistry of [Fe(CN)6]4−/3− at Au-1,5PDT-AuNS Modified Electrodes for AuNSs’ Self-Assembly Time of 16 h
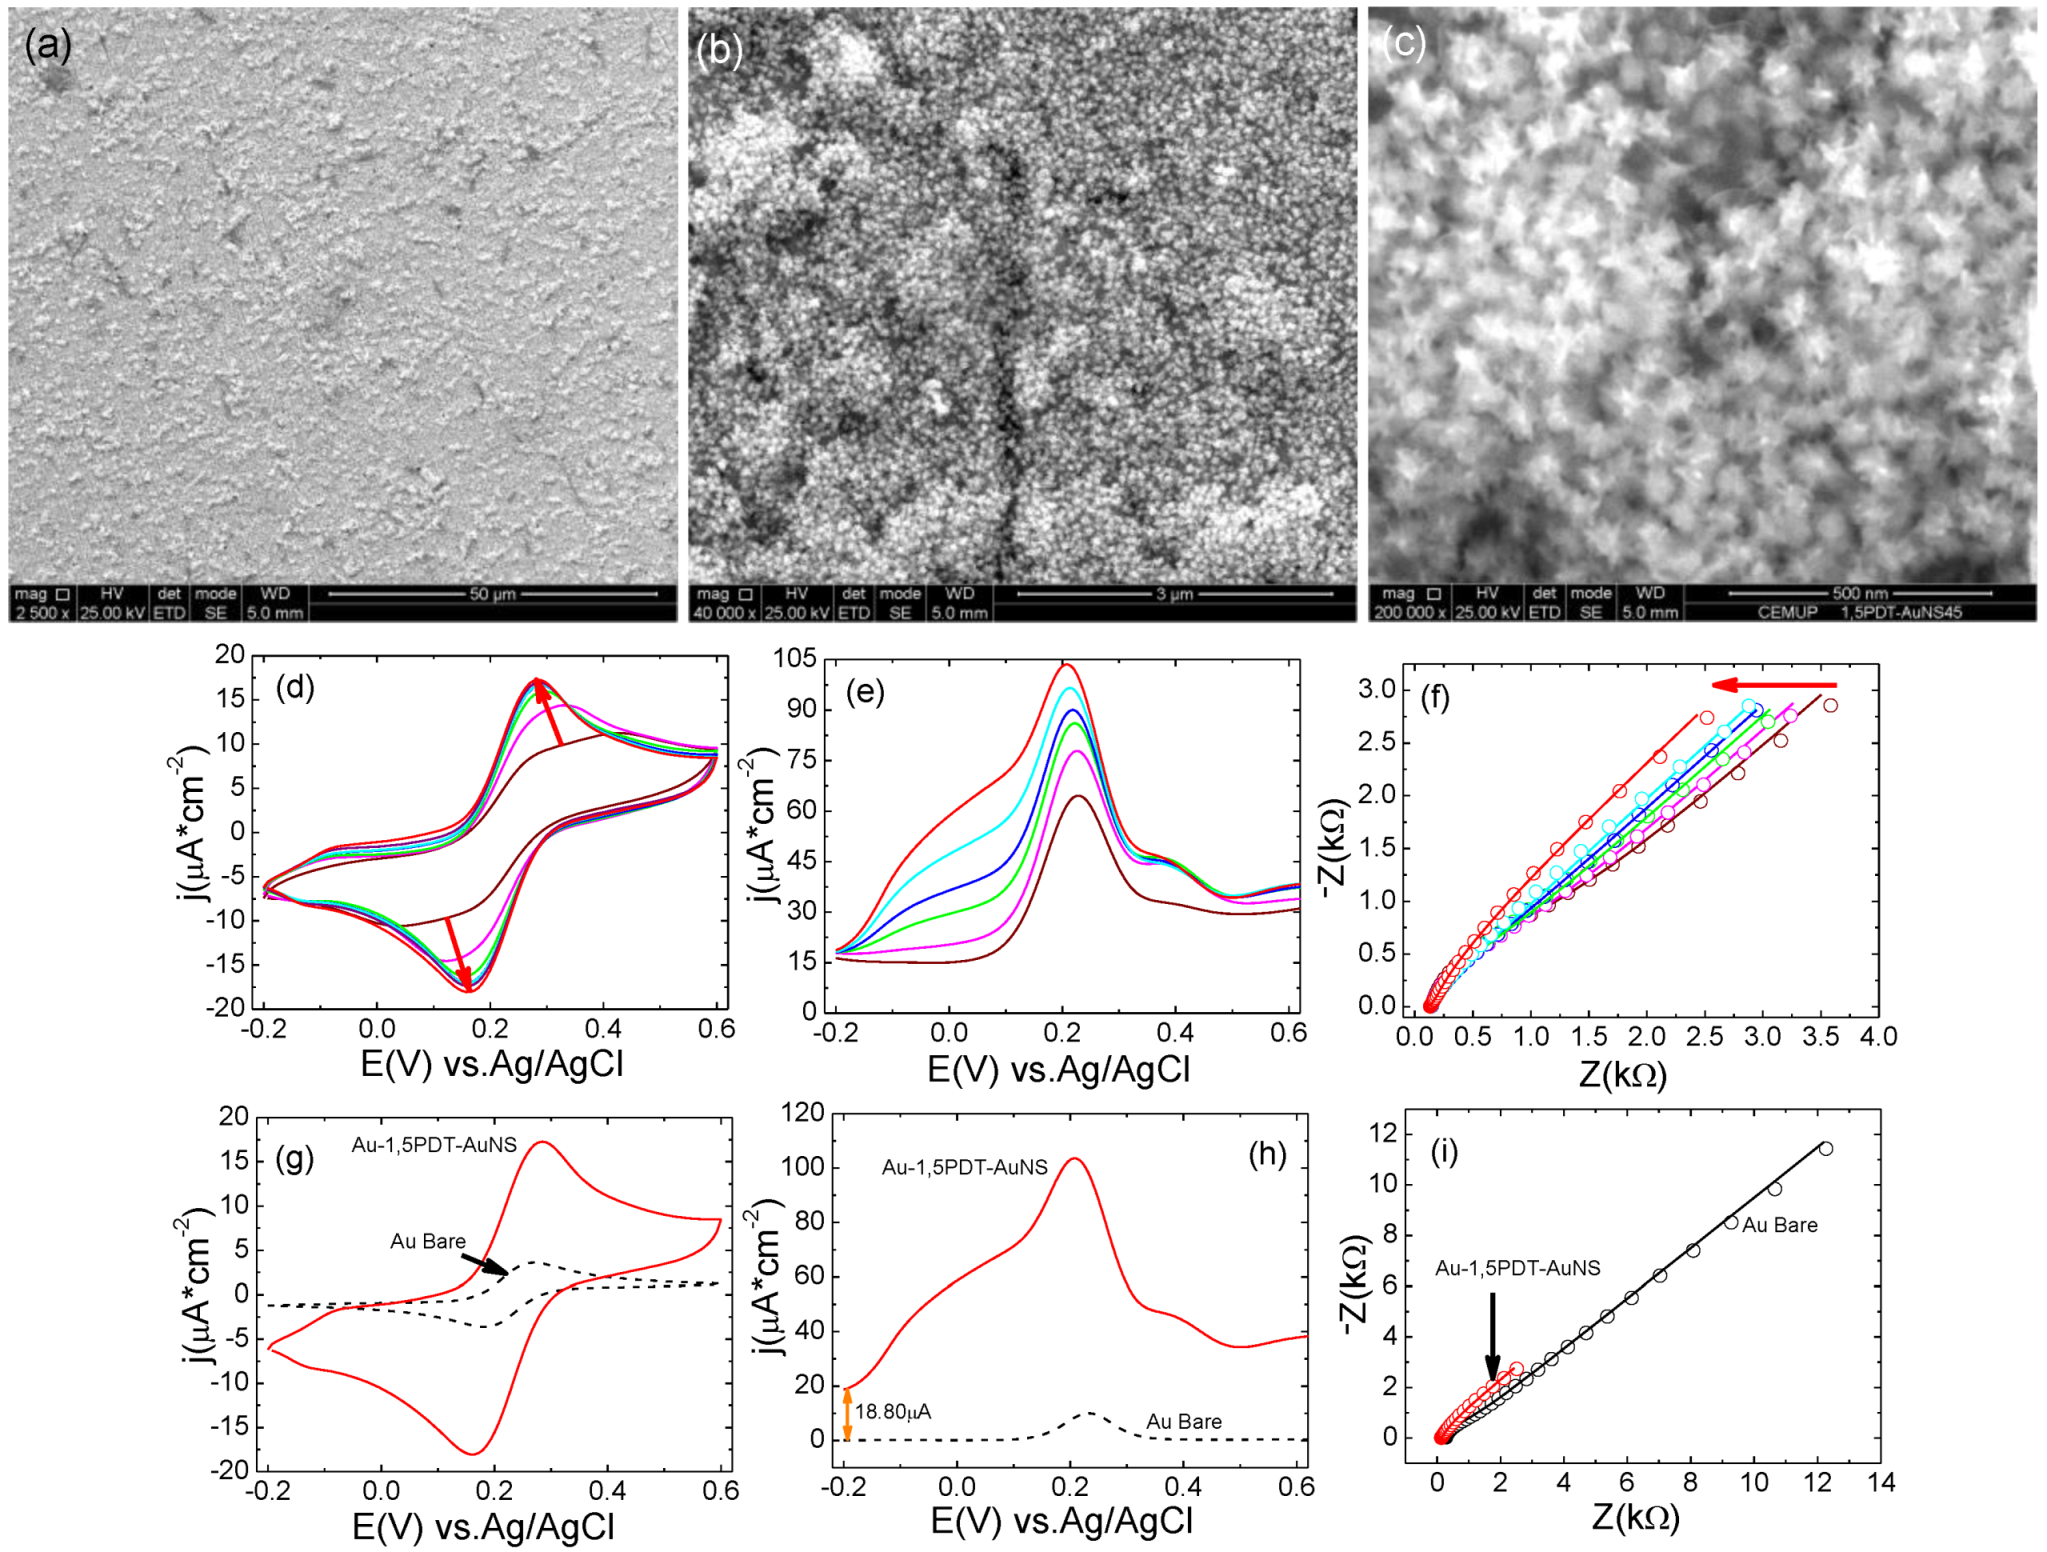
The fabrication of 1,5PDT-AuNSs films with slightly higher surface coverage of AuNSs was achieved by increasing their self-assembly time to 16 h. In
Figure 4a–c are presented the corresponding SEM images at different magnification, whereas
Figure 4d–e illustrate the evolution of consecutive cyclic voltammetry, square wave voltammetry and electrochemical impedance measurements performed at the Au-1,5PDT-AuNSs modified electrode (16 h) in aqueous solution of 0.0005 M [Fe(CN)
6]
4−/3− and 0.1 M NaClO
4. As previously observed, there is a transition from slow kinetics to fast kinetics of electron transfer. Both cyclic and square wave voltammograms show a continuous change from high (wine and green curves in
Figure 4d,e) to small (cyan and red curves in
Figure 4e,d) peak-to-peak potential separations and a continuous increase of current densities. In this case, the transition takes place with higher electrochemical steps and is faster than at the previous modified electrode (higher
ket,
Table 3) because the surface loading with AuNSs is higher. In the cyclic voltammograms (
Figure 5d) the peak-to peak potential separation and current densities varied as follows: ∆
Ep = 0.225 V,
ja = 2.64 µA cm
−2 (wine curve), ∆
Ep = 0.144 V,
ja = 3.28 µA cm
−2 (green curve), ∆
Ep = 0.108 V,
ja = 3.56 µA cm
−2 (blue curve), ∆
Ep = 0.094 V,
ja = 3.70 µA cm
−2 (magenta curve), ∆
Ep = 0.091 V,
ja = 3.76 µA cm
−2 (cyan curve), ∆
Ep = 0.090 V,
ja = 3.80 µA cm
−2 (dark cyan curve), and ∆
Ep = 0.090 V,
ja = 3.82 µA cm
−2 (red curve) as compared to bare gold for which ∆
Ep = 0.088 V,
ja = 3.60 µA cm
−2.
Keeping in mind that the concentration of redox probes in solution is constant (0.0005 M), the variation of these parameters illustrates an electrocatalytic effect of AuNSs. This electrocatalytic effect is even more evident in the SQWVs (
Figure 4e) which show a drastic increase of net Faradaic currents,
i.e.,:
ja= 5.80 µA cm
−2 at 0.244 V(wine curve),
ja= 10.64 µA cm
−2 at 0.232 V (green curve),
ja = 14.65 µA cm
−2 at 0.227 V (blue curve),
ja = 17.47 µA cm
−2 at 0.227 V(pink curve),
ja = 19.00 µA cm
−2 at 0.224 V (cyan curve),
ja= 20.20 µA cm
−2 at 0.224 V(dark cyan curve),
ja= 20.65 µA cm
−2 at 0.224 V (red curve) as compared to bare gold for which
ja= 10 µA cm
−2 at 0.230 V (
Figure 2h, black dashed curve). It is important to note that the impedance is decreasing at any given frequency for consecutive measurements at the Au-1,5PDT-AuNS modified electrode (16 h,
Figure 4f) in aqueous solution of 0.0005 M [Fe(CN)
6]
4−/3− and 0.1 M NaClO
4. The decrease of impedance values was observed for the first time at AuNP/polymer multilayer modified electrodes [
26,
27]. This decrease of EIS values was achieved by increasing the number of AuNPs layers electrostatically self-assembled on gold electrodes using positively charged polymers [
26,
27]. In recent reports we have demonstrated that the impedance values could also decrease if small nanorods (AuNRs) were covalently attached to electrodes [
3] or if, despite their size, the AuNRs surface density was increased [
4]. In this work, a monodisperse sample of gold nanostars was used for modifying the electrodes, being varied only their surface density. As presented in
Figure 2,
Figure 4, the impedance values were decreasing from 8 h to 16 h self-assembly time of AuNSs, so again, by increasing the surface density of AuNSs. What does differ from the other electrochemical systems is the fact that the EIS values were decreasing also during consecutive measurements performed at the same Au-1,5PDT-AuNS modified electrodes in aqueous solution of 0.0005 M [Fe(CN)
6]
4−/3− for both low and high surface coverage with AuNSs. This reflects a different electrocatalytic behavior of gold nanostars as compared to their spherical or nanorod counterparts [
3,
4,
26,
27,
29]. Fittings of EIS plots (in
Figure 4f) show a continuous decrease of apparent charge transfer resistance,
RCT (
Table 3) in parallel with a continuous increase of double layer capacitance,
Cdl. The variation of these two parameters proves a continuous improvement of electron transfer kinetics and, simultaneously, charges accumulation (!) at the Au-1,5PDT-AuNSs modified electrode surface (16 h). The charge accumulation on the AuNS layer can arise from two contributions: slow electron transfer at the gold nanostar surface due to their large sizes and electronic blocking generated by the underlying 1,5pentanedithiol layer. These synergic influences could explain the progressive transition from CVs with large peak-to-peak separation and low peak current densities to CVs with narrow peak-to-peak separation and high peak current densities as presented in
Figure 2d–f and
Figure 4d,e. The capacitance of the film,
Cf, was almost constant (
Table 3) proving that the area of the electrode does not change during the electrochemical process. The constant value of this parameter confirms the stability of nanostar shape and size during the electrochemical process as observed in SEM images (
Figure 4a–c). Rodriguez-Lorenzo
et al. [
32] have observed that gold nanostars can undergo chemical reshaping in the presence of cetyltrimethylammonium bromide (CTAB) after 8 h of reaction. By increasing the CTAB concentration, the reshaping process was speeded-up (5 h) [
32]. Zou
et al. have demonstrated that gold nanorods were protected against thermal or chemical reshaping by PVP which has hindered CTAB diffusion to the surface of rods [
33]. In our work, if the nanostars were reshaping into smaller nanomaterials, the capacitance of the film,
Cf, could have decreased illustrating the diminishing of the overall electrode area during the electrochemical process. Contrarily, as presented in
Table 3, the
Cf was slightly increasing with consecutive electrochemical measurements suggesting only a swelling of AuNS layer upon penetration of redox probes into the film but no reshaping of AuNSs. The variation of this parameter also suggests that the PVP was not removed completely from the surface of AuNSs.
The resistance of the film, which is a tunneling resistance,
Rf, was progressively decreasing (
Table 3), demonstrating a progressive improvement of electron tunneling through the aliphatic chains of the 1,5PDT-SAM and toward the underlying bare gold electrode surface. The variation of these electrochemical parameters (
Table 3) demonstrates a complex electron transfer process generated by a synergic influence of both electrochemical charging of gold nanostars and electron tunneling through the insulating 1,5PDT layer.
The large sizes of gold nanostars seem to generate initially a slow electron transfer process, which becomes faster upon continuous electrochemical measurements. In other words, the AuNSs need first to accumulate enough electrons in order to generate a faster electron transfer process. Another cause of the transition from slow to fast electron transfer process during consecutive measurements could be the shape of gold nanostars. By comparing the different sizes existent in a nanostar it may be possible that the ET at the tips of gold nanostars (19.44 nm) to be faster than ET at their cores (49.72 nm), this difference of electron transfer kinetics generating charge accumulation at the surface of AuNSs.
Figure 4.
(a–c) SEM images recorded after electrochemical measurements performed at Au-1,5PDT-AuNS modified electrodes (16 h self-assembly time for AuNSs). Scale bars: 5µm (a), 2 µm (b) and 500 nm (c); (d–f) Evolution of cyclic (d) and square wave voltammetry (e) and EIS (f) measurements recorded at the Au-1,5PDT-AuNS modified electrode in aqueous solution of 0.0005 M [Fe(CN)6]4−/3− and 0.1 M NaClO4. Scan rate 50 mV/s. Frequency 10 Hz; (g–i) Comparison of final cyclic (g), square wave voltammograms (h) and EIS spectra (i) recorded in the same conditions at Au-1,5PDT-AuNS modified electrodes (red curves) and bare gold (black dashed curves).
Table 3.
Parameters values obtained from fittings of the impedance spectra represented in
Figure 4f.
Table 3.
Parameters values obtained from fittings of the impedance spectra represented in Figure 4f.
| EIS plot | Rs (kΩ) | Cf (µF) | Rf (kΩ) | Cdl (μF) | RCT (kΩ) |
|---|
| wine | 0.307 (1.50) | 2.66 (1.21) | 4.46 (0.92) | 1.60 (0.79) | 9.15 (0.45) |
| green | 0.312 (1.0) | 2.70 (1.26) | 4.90 (0.96) | 1.69 (0.72) | 8.80 (0.42) |
| blue | 0.295 (1.26) | 2.70 (0.92) | 2.12 (0.96) | 1.73 (0.63) | 4.87 (0.93) |
| magenta | 0.300 (1.06) | 2.76 (0.69) | 2.36 (0.94) | 1.81 (0.65) | 4.70 (0.94) |
| cyan | 0.280 (1.10) | 2.50 (0.91) | 0.97 (1.25) | 1.77 (0.58) | 3.07 (1.12) |
| dark cyan | 0.294 (1.15) | 2.80 (0.89) | 1.54 (0.52) | 2.02 (0.65) | 2.70 (0.91) |
| red | 0.296 (1.09) | - | - | 3.18 (1.35) | 1.15 (0.87) |
Table 4.
Heterogeneous electron transfer constants estimated from fittings of impedance spectra represented in
Figure 5f and the corresponding electron tunneling coefficients,
β.
Table 4.
Heterogeneous electron transfer constants estimated from fittings of impedance spectra represented in Figure 5f and the corresponding electron tunneling coefficients, β.
| EIS plot | ket (cm s−1) | β (Å−1) |
|---|
| wine | 0.18 × 10⁻⁵ | 1.13 |
| green | 0.19 × 10⁻⁵ | 1.11 |
| blue | 0.35 × 10⁻⁵ | 1.04 |
| magenta | 0.36 × 10⁻⁵ | 1.04 |
| cyan | 0.55 × 10⁻⁵ | 0.99 |
| dark cyan | 0.62 × 10⁻⁵ | 0.97 |
| red | 1.47 × 10⁻⁵ | 0.87 |
Regardless of the cause of this completely new and unusual electrochemical behavior, it is evident that by consecutive electrochemical measurements and increasing the surface density of AuNSs attached to the electrodes, the overall electron transfer process was improved. The heterogeneous electron transfer rate constant has progressively increased from 0.18 × 10
−5 cm·s
−1 to 1.47 × 10
−5 cm·s
−1 (
Table 4) demonstrating a continuous improvement of the overall electron transfer process at the Au-1,5PDT-AuNS modified electrode (16 h self-assembly time of AuNSs) with consecutive electrochemical measurements. Moreover, the electron tunneling coefficient, β, was progressively decreasing (
Table 4) demonstrating a continuous and excellent improvement of the electron tunneling process through the underlying 1,5PDT-SAM layer. In previous reports was demonstrated that the electron transfer at nanomaterial modified electrodes was dependent on the size of nanomaterials, number of layers self-assembled on electrodes, presence of pinholes in the films, nature of outermost layer, type of surface bonding and surface density [
1,
3,
4,
5,
6,
16,
26,
27,
29]. None of these reports have presented spontaneous charging of electrodes surface during a simple electrochemical process as demonstrated here. Like in a capacitor, it appears that one plate (the redox probes in solution) is transferring electrons to the parallel plate (the layer of AuNSs), which is storing them slowly and continuously. At the AuNS layer, part of these electrons was further tunneled through the 1,5PDT layer and underlying bare electrode surface. The presented experiments and modeling of EIS spectra, strongly suggest that the AuNSs could act as energy storage nanodevices [
34,
35].
2.3. Electrochemistry of [Fe(CN)6]4−/3− at Au-1,5PDT-AuNS Modified Electrodes for AuNSs’ Self-Assembly Time of 24 h
A self-assembly time of 24 h has yielded 1,5PDT-AuNS films with higher surface coverage of AuNSs. Scanning electron microscopy analysis of the third Au-1,5PDT-AuNS modified electrode (
Figure 5a–c) has revealed a dense coverage with AuNSs, some areas of the modified electrode being more covered with AuNSs than other areas (less covered surface areas were marked with white arrows in
Figure 5b,c).
Figure 5.
(a–c) SEM images and (d–i) electrochemistry of 0.0005 M [Fe(CN)6]4−/3− at the third Au-1,5PDT-AuNS modified electrode for 24 h self-assembly time of AuNSs. Scale bars in SEM images were: 10 µm (a), 2 µm (b) and 500 nm (c), respectively. The electrochemical conditions are the same as previously presented.
The physical aspect of the Au-1,5PDT-AuNS modified electrode suggests that the 1,5PDT SAM was formed of disulfides layers as demonstrated by Qu
et al. [
9] and Chah
et al. [
11], a fact which may explain the different heights observed in the structure of the 1,5PDT-AuNS film (
Figure 5a–c). The presence of a dense layer of AuNSs at the Au-1,5PDT-AuNS/aqueous solution interface had a strong influence on the electrochemical properties of the modified electrode. The electrochemical behavior observed previously (
Figure 2,
Figure 4) was confirmed, with a stronger effect of AuNSs in the overall electrochemical process. First of all, cyclic voltammograms with high current densities of
ja= 9.60 µA cm
−2 (Δ
Ep = 0.105 V) were obtained by consecutive measurements at the Au-1,5PDT-AuNS modified electrodes (
Figure 5d, 24 h self-assembly time of AuNSs) in aqueous solution of 0.0005 M [Fe(CN)
6]
4−/3− and 0.1 M NaClO
4. In the square wave voltammograms (
Figure 5e), the maximum current densities were 45.4 µA cm
−2 (at 0.216 V), being 4.5 orders of magnitude higher than at bare Au electrode. The current densities in the SQWVs (
Figure 5e) start at a slightly higher value (5.45 µA) than at bare Au electrode (
Figure 5h). This difference is most probably due to the increase of electrode area upon self-assembly of AuNSs. And last but not least, the impedance values have drastically decreased to half of the values of impedance recorded at bare gold electrode (see Nyquist plots represented in
Figure 5i). It has to be noted that the solution resistance, Rs, has slightly decreased (
Table 5) illustrating a drastic change of the dielectric properties of the electrodes surface upon self-assembly of AuNSs as a dense layer.
From the fittings of impedance spectra, it was confirmed that the area of the Au-1,5PDT-AuNS modified electrode (24 h) has increased due to 4.2 times increase of film capacitance,
Cf, as compared to the previous Au-1,5PDT-AuNS modified electrode (16 h) (compare final
Cf values in
Table 3,
Table 5). The film resistance,
Rf, has decreased even more than at the previous AuNS modified electrodes implying that a higher number of tunneling channels have been created by increasing AuNSs surface density (lower starting
Rf) and additionally, the
Rf was decreasing with consecutive measurements illustrating a progressive improvement of through-bond electron tunneling process (
Table 5).
Table 5.
Parameter values obtained from fittings of the EIS spectra represented in
Figure 5f.
Table 5.
Parameter values obtained from fittings of the EIS spectra represented in Figure 5f.
| EIS plot | Rs (kΩ) | Cf (µF) | Rf (kΩ) | Cdl (μF) | RCT (kΩ) |
|---|
| wine | 0.223 (1.0) | 11.7 (0.83) | 0.96 (0.75) | 6.79 (0.83) | 1.94 (0.78) |
| magenta | 0.214 (0.98) | 11.5 (0.65) | 0.67 (0.90) | 7.19 (0.83) | 1.28 (0.67) |
| green | 0.214 (0.90) | 12.4 (0.83) | 0.57 (0.87) | 8.34 (0.75) | 0.77 (0.72) |
| blue | 0.202 (0.85) | 11.8 (0.75) | 0.39 (0.82) | 7.43 (0.92) | 0.68 (0.90) |
| cyan | 0.204 (0.97) | 12.1 (0.86) | 0.46 (1.0) | 8.23 (0.98) | 0.58 (0.77) |
| purple | 0.202 (1.05) | 11.03 (0.80) | 0.56 (0.76) | 8.20 (0.95) | 0.62 (0.82) |
| red | 0.205 (0.88) | 14.4 (0.65) | 0.63 (0.91) | 13.3 (0.79) | 0.43 (0.87) |
Moreover, the high efficiency of electron tunneling through the underlying molecules of 1,5PDT layer was confirmed by the continuous decrease of the electron tunneling coefficient,
β, with consecutive electrochemical measurements (
Table 6). The double layer capacitance,
Cdl, has progressively increased (
Table 5) being seven times larger than at bare gold electrode. The
Cdl increase confirms a strong charge accumulation at the surface of Au-1,5PDT-AuNS modified electrode (24 h).
Table 6.
Heterogeneous electron transfer rate constants estimated based on Equations (1) and (2) and using
RCT parameters from
Table 5 and the corresponding electron tunneling coefficients, respectively.
Table 6.
Heterogeneous electron transfer rate constants estimated based on Equations (1) and (2) and using RCT parameters from Table 5 and the corresponding electron tunneling coefficients, respectively.
| EIS plot | ket (cm s−1) | β (Å−1 ) |
|---|
| wine | 0.88 × 10⁻⁵ | 0.93 |
| magenta | 1.33 × 10⁻⁵ | 0.88 |
| green | 2.19 × 10⁻⁵ | 0.83 |
| blue | 2.48 × 10⁻⁵ | 0.81 |
| cyan | 2.91 × 10⁻⁵ | 0.80 |
| purple | 2.72 × 10⁻⁵ | 0.80 |
| red | 3.95 × 10⁻⁵ | 0.76 |
As previously discussed, this spontaneous charging effect was also observed at films containing larger AuNSs (with average core diameters of 63.50 nm and average tip lengths of 23.57 nm) at low surface coverage on modified electrodes [
31]. The apparent charge transfer resistance,
RCT, has strongly decreased revealing a very efficient electron transfer process taking place between the redox probes in solution and the AuNS modified electrode (24 h,
Table 5). Accordingly, the heterogeneous electron transfer rate constants have greatly increased (
Table 6), the final value being 1.42 higher than at bare gold (compare
ket values in
Table 2,
Table 6). The variations of all electrochemical parameters strongly suggest that the increased surface density of AuNS was improving the electrochemical process. Our work is consistent with the work of Diao
et al. [
29] which have also demonstrated that a higher particle density results in higher number of tunneling channels and then a smaller apparent tunneling resistance,
Rt (app) determining a more reversible electrochemical process and higher current densities in the voltammograms.
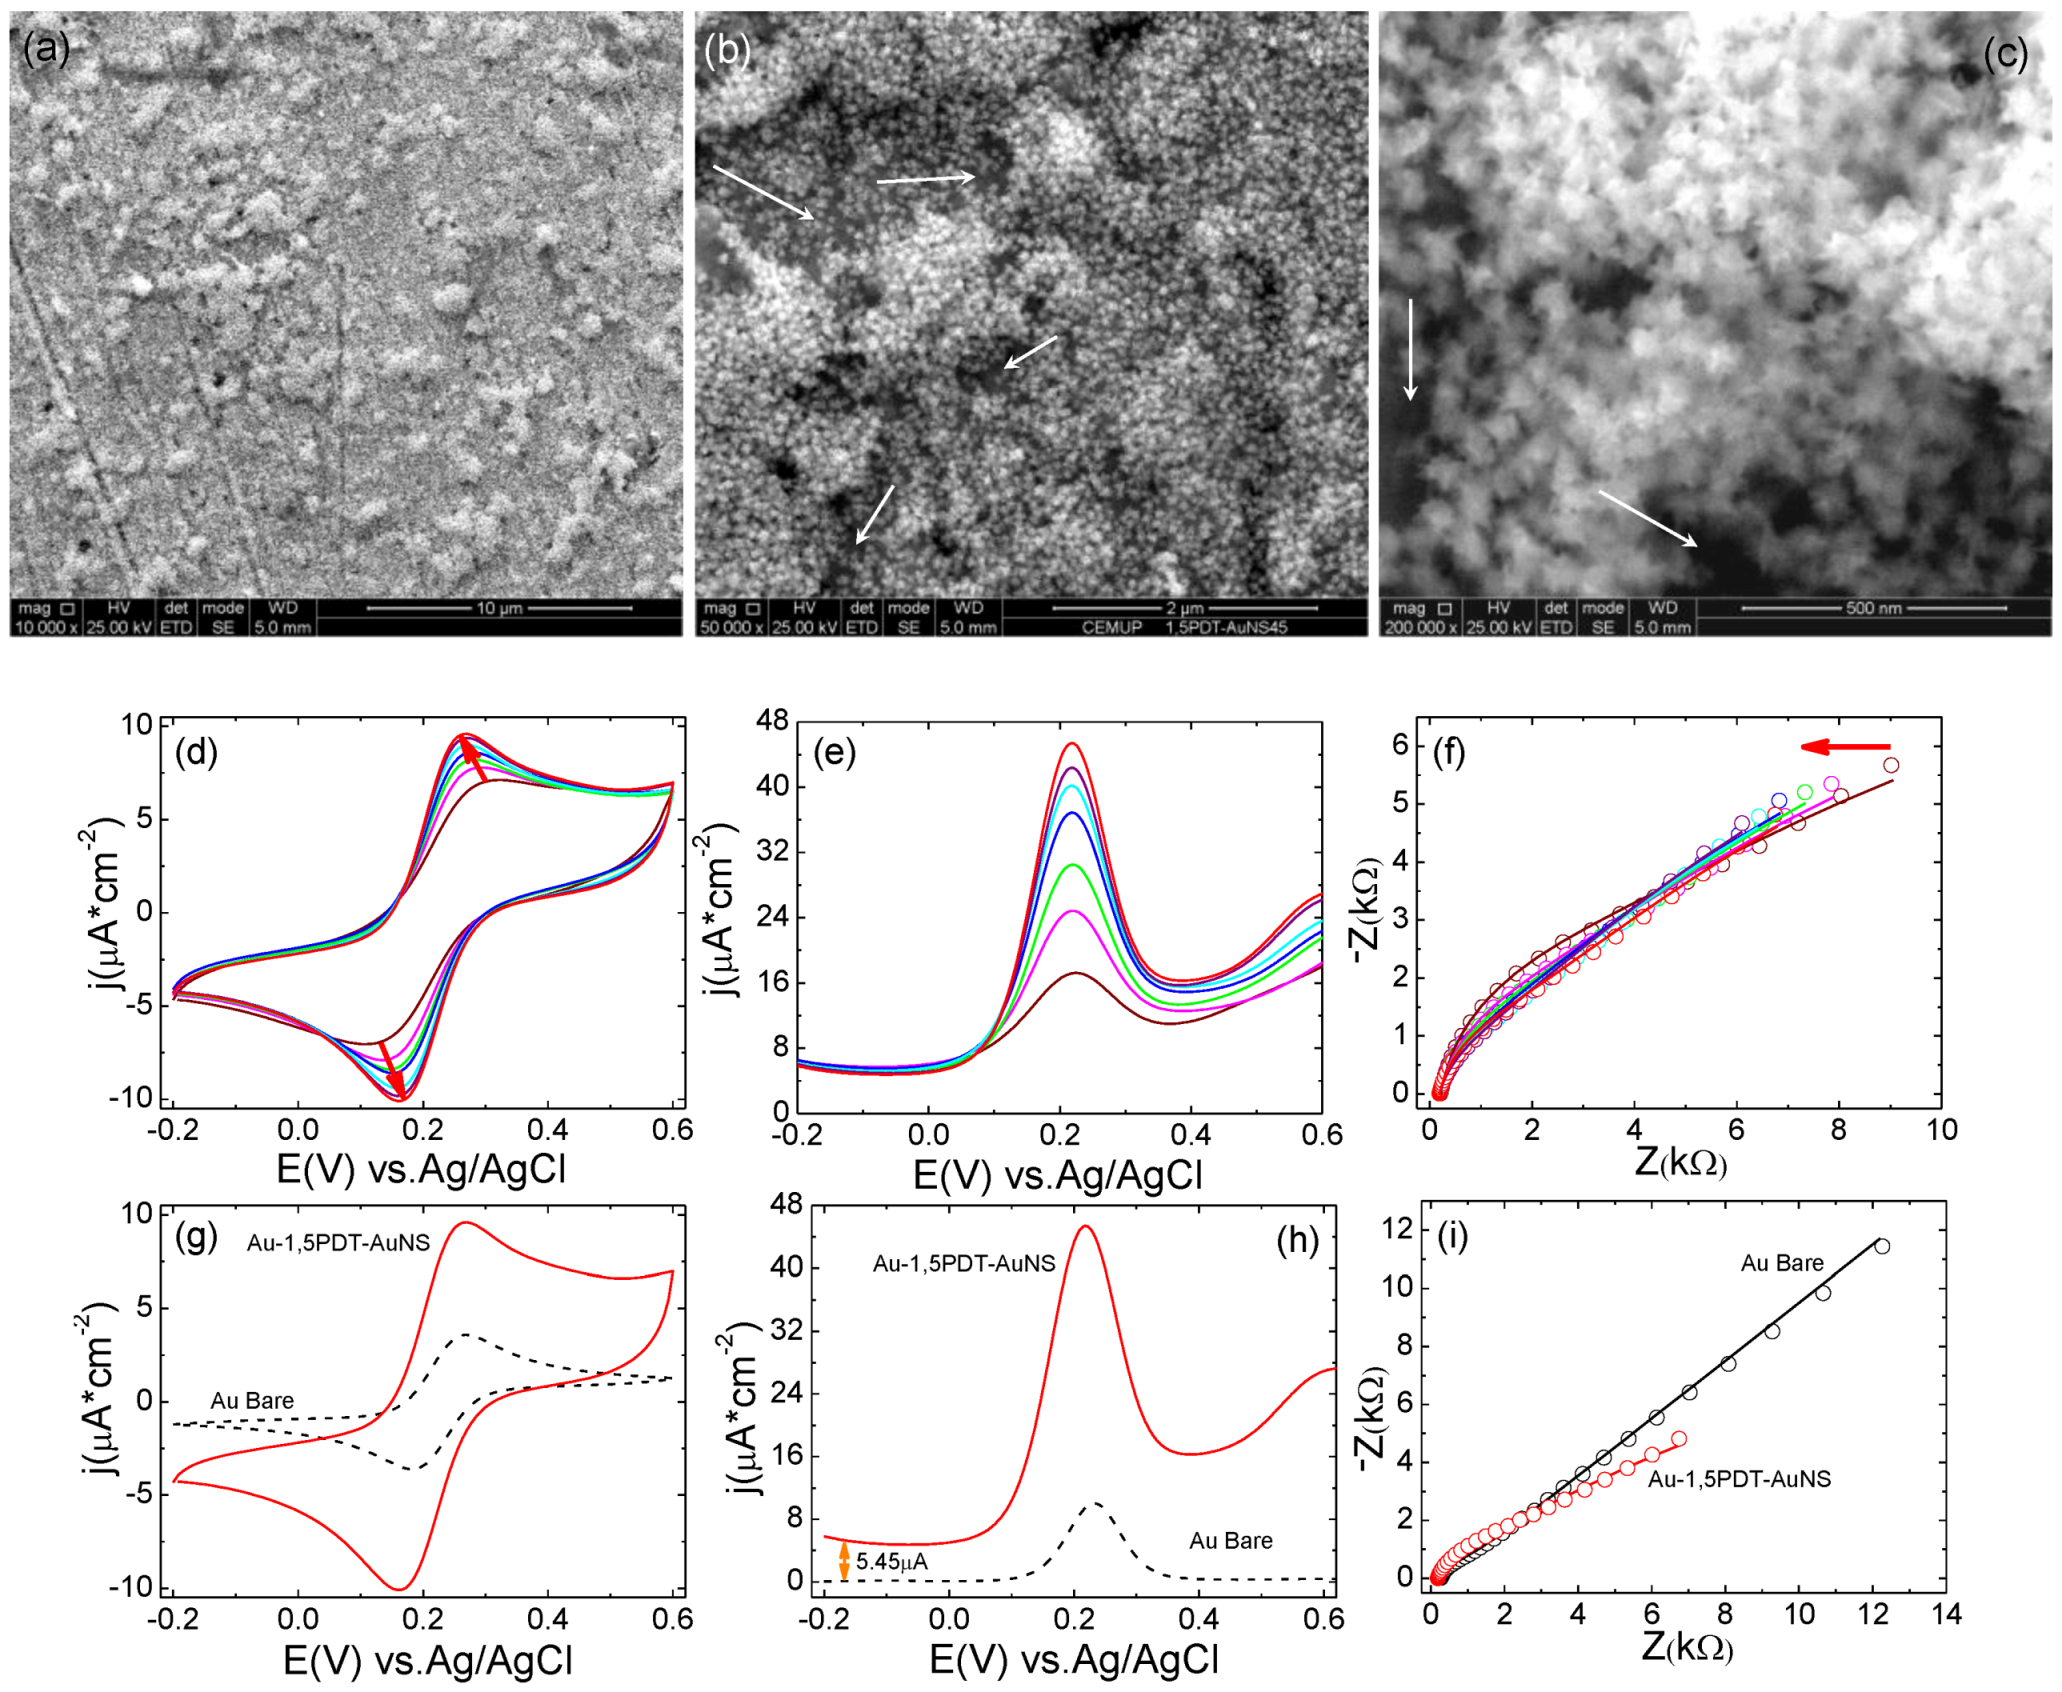
2.4. Electrochemistry of [Fe(CN)6]4−/3− at Au-1,5PDT-AuNS Modified Electrodes for AuNSs’ Self-Assembly Time of 32 h
A final tested time of AuNSs’ self-assembly was 32 h. At this time of AuNSs’ self-assembly, their coverage on Au-1,5PDT-SAM modified electrode was complete (
Figure 6a–c) and the electrochemical properties of the bilayer modified electrode were reconfirmed (
Figure 6d–i). SEM analysis of the fourth AuNS modified electrode shows a compact structure of the bilayer (
Figure 6a–c) very similar to the structure of the previous Au-1,5PDT-AuNS modified electrode (16 h,
Figure 5a–c). Consecutive measured cyclic voltammograms in aqueous solution of 0.0005 M [Fe(CN)
6]
4−/3− redox probes at this fourth Au-1,5PDT-AuNS modified electrode show a strong increase of current densities with decreasing peak potential separations (
Figure 6d). After eight measured CVs, the peak current densities were stabilized (
ja= 17.4 µA cm
−2, Δ
Ep = 0.117 V for red curve in
Figure 6d,g). The peak-to peak potential separation of ∆
Ep = 0.117 V shows a less reversible electrochemical process than at previously modified electrodes suggesting that after 32 h self-assembly time for AuNS, the optimal surface coverage with AuNS is overpassed. Nevertheless, the overall electrochemical process shows interesting features. For example, continuous measurements of square wave voltammograms have revealed a progressive shift of peak currents toward less positive potentials and a dramatic increase of current densities demonstrating an excellent improvement of electron transfer process induced by the AuNSs present at the Au-1,5PDT-AuNS modified electrode/solution interface. During the electrochemical process, the formal redox potential in the SQWVs was shifted from 0.226 V to 0.224 V, 0.220 V, 0.216 V, 0.210 V, 0.208 V and 0.184 V (wine to red plots in
Figure 6e), the square wave voltammograms recorded at this AuNS modified electrode featuring also a second shoulder at about 0.016 V (green to dark cyan plots in
Figure 6e) which was further shifted to 0.093 V (red plot,
Figure 6e). The shift of peak potential position toward less positive potentials together with a strong increase of current densities in SQWVs (
Figure 6e) illustrates a strong facilitation of the overall electron transfer process induced by the AuNSs. Accordingly, EIS measurements performed at the Au-1,5PDT-AuNS modified electrode (32 h) show a 4 times decrease of impedance values for all range of frequency (
Figure 6f,i) as compared to bare gold. The solution resistance, Rs, has decreased to half of the initial value indicating dielectric changes of electrode surface.
From an electrochemical point of view, the charging of AuNS layer at the Au-1,5PDT-AuNS/solution interface has determined a decrease of solution resistance as presented in
Table 7. The dielectric properties of the film have an obvious influence on the solution resistance,
Rs. As discussed previously, the dithiol layer determines an increase of solution resistance due to its hydrophobic nature. Contrarily, the AuNSs electrochemically charged and being attached in a high number at the surface of electrodes (24 h and 32 h self-assembly time,
Figure 5,
Figure 6), have formed very conductive layers, which have determined a decrease of solution resistance. The decrease of
Rs was observed only at high surface coverage with AuNSs (
Table 5,
Table 7). At low surface coverage although the electrochemical charging of AuNSs was confirmed by the increase of
Cdl parameter, the increased electrical conductivity of the AuNS layer is undetectable because no change in solution resistance was observed at Au-1,5PDT-AuNS modified electrodes with 8 h and 16 h AuNSs’ self-assembly time (see
Rs values in
Table 1,
Table 3). Additionally, a dramatic increase of film capacitance, as compared with the previous
Cf values, illustrates a high increase of electrode area upon AuNSs self-assembly (32 h,
Table 7). The film capacitance was progressively increasing illustrating a swelling of the film structure upon penetration of the redox probes into the AuNS layer.
Overall, the resistance of the film
Rf is very small indicating an extremely efficient tunneling process through the chain of the 1,5PDT-SAM toward the underlying bare gold surface. The double layer capacitance,
Cdl, has drastically and progressively increased illustrating a strong charging effect at the Au-1,5PDT-AuNS modified electrode caused by a continuous exchange of electrons between the AuNSs in the film and the redox probes in solution. Compared to
Cdl estimated at bare gold electrode (1.89 µF,
Table 1) the
Cdl at this fourth Au-1,5PDT-AuNS modified electrode has increased 14 times (27 µF,
Table 7). It is clearly demonstrated that AuNSs act as strong energy storage materials opening great possibilities for their use as “nanoelectrochemical” capacitors [
35]. Even more interesting, a very surprising evolution of apparent charge transfer resistance, R
CT, is represented by its strong decrease almost to nullification (
Table 7). The estimated heterogeneous electron transfer rate constants using
RCT parameters from
Table 7 show a progressive improvement of electron transfer process in parallel with a strong electrical charging of AuNSs during consecutive electrochemical measurements.
Figure 6.
(a–c) SEM images of gold nanostars covalently self-assembled on Au-1, 5PDT-SAM modified electrodes for 32 h. Scale bars: 50 µm (a), 3 µm (b) and 500 nm (c); Evolution of cyclic (d) and square wave voltammetry (e) and EIS (f) measurements recorded at the Au-1,5PDT-AuNS modified electrode in aqueous solution of 0.0005 M [Fe(CN)6]4−/3− and 0.1 M NaClO4. Comparison of final cyclic (g), square wave voltammograms (h) and EIS spectra (i) recorded in the same conditions at Au-1,5PDT-AuNS modified electrodes (red curves) and bare gold (black dashed curves). Scan rate 50 mV/s. Frequency 10 Hz.
The
ket values have drastically increased (
Table 8) demonstrating that the electron transfer was becoming faster at Au-1,5PDT-AuNS modified electrode than at bare gold electrode. Moreover, the strong electrical charging of AuNSs has determined a high increase of
ket values (
Table 8). There is a strong jump of
ket value from 10.77 × 10
−5 cm·s
−1 to 85.0 × 10
−5 cm·s
−1,this increase of
ket suggesting an extremely high electrical charging of AuNSs within their layer. This strong charging of the AuNS layer had a strong influence on the electron tunneling process, which was highly improved, the electron tunneling coefficient decreasing continuously from 0.78 Å
−1 to 0.50 Å
−1 (
Table 8).
In a report to be published, we will demonstrate that the increase of ket is possible due to the high number of electrons that could be stored on one single AuNS, the duration of charging process being 180 min for entire sample. During chemical charging with NaBH4, the most evident changes were observed at the tips of gold nanostar. The surface plasmon band of tips was blue shifted whereas its absorbance was increased revealing clearly a charging process. Moreover, their discharging process was very slow taking days to be completed. Compared to dense gold nanorod films at which the fastest electron transfer was depicted through a ket of 1.58 × 10⁻⁵ cm·s−1, the dense AuNSs films have generated clearly higher ket values: 3.95 × 10⁻⁵ cm·s−1 (24 h) and 85.0 × 10⁻⁵ cm·s−1 (32 h) respectively. These results have clearly demonstrated that AuNSs have a higher electrocatalytic effect combined with excellent energy storage abilities.
Table 7.
Parameter values obtained from fittings of the impedance data represented in
Figure 6f.
Table 7.
Parameter values obtained from fittings of the impedance data represented in Figure 6f.
| EIS plot | Rs (kΩ) | Cf (µF) | Rf (kΩ) | Cdl (μF) | RCT (kΩ) |
|---|
| wine | 0.15 (0.76) | 20.2 (0.86) | 0.40 (0.82) | 15.2 (0.50) | 0.51 (0.92) |
| magenta | 0.15 (0.72) | 20.0 (0.79) | 0.27 (0.96) | 17.5 (0.92) | 0.44 (0.68) |
| green | 0.15 (0.77) | 21.3 (0.83) | 0.28 (0.96) | 18.1 (0.59) | 0.40 (0.71) |
| blue | 0.15 (1.08) | 23.1 (0.95) | 0.26 (0.94) | 26.3 (0.69) | 0.35 (0.76) |
| cyan | 0.145 (0.81) | 24.8 (0.76) | 0.17 (0.71) | 26.0 (0.58) | 0.16 (0.68) |
| red | 0.14 (0.67) | 26.5 (0.89) | 0.11 (0.87) | 27.0 (0.65) | 0.02 (0.80) |
Table 8.
Heterogeneous electron transfer rate constants estimated based on R
CT parameters from
Table 7.
Table 8.
Heterogeneous electron transfer rate constants estimated based on RCT parameters from Table 7.
| EIS plot | ket (cm s−1) | β (Å−1) |
|---|
| wine | 3.31 × 10⁻⁵ | 0.78 |
| pink | 3.90 × 10⁻⁵ | 0.76 |
| green | 4.30 × 10⁻⁵ | 0.75 |
| blue | 4.85 × 10⁻⁵ | 0.74 |
| cyan | 10.77 × 10⁻⁵ | 0.65 |
| red | 85.0 × 10⁻⁵ | 0.50 |


