Voluntary Leadership and Asymmetric Endowments in the Investment Game

1
Universität Erfurt, Professur für Quantitative Methoden der Empirischen Sozialforschung and CEREB (Center for Empirical Research in Economics and Behavioral Sciences), Nordhäuser Str. 63, D-99089 Erfurt, Germany
2
Universität Erfurt, Professur für Angewandte Mikroökonomie and CEREB, Nordhäuser Str. 63, D-99089 Erfurt, Germany
3
Center for Empirical Research in Economics and Behavioral Sciences, Nordhäuser Str. 63, D-99089 Erfurt, Germany
*
Author to whom correspondence should be addressed.
Games 2018, 9(3), 51; https://doi.org/10.3390/g9030051
Submission received: 1 May 2018
/
Revised: 10 July 2018
/
Accepted: 15 July 2018
/
Published: 21 July 2018
(This article belongs to the Special Issue Dictator Games)
Abstract
:We experimentally investigate variants of the investment game by Berg, Dickhaut, and McCabe (1995), in which one of the two players decides who are first mover and second mover. It has been shown by Kleine, Königstein, and Rozsnyói (2014) that voluntary leadership increases both investment and backtransfer. We interpret voluntary leadership as a signal of cooperation that stimulates reciprocal cooperation. If a relatively rich player takes the lead (putting himself/herself under investment risk) this should be seen as a less strong signal of cooperation than taking the lead among equally endowed players. Indeed, we show that under asymmetric endowments, voluntary leadership has a weaker effect than under symmetric endowments.
1. Introduction
The investment game—we also refer to it as trust game—introduced by Berg, Dickhaut, and McCabe (1995) [1] is a widely used experimental game to study cooperation. The game has two players, each of them being endowed with an amount of money, one player choosing an investment, and the other one choosing a backtransfer. The invested amount is tripled and can be kept by the second mover. If the second mover backtransfers an amount, this is also tripled and can be kept by the first mover.1 Thus, full investment and full backtransfer is efficient. However, the backtransfer choice is like a dictator game. Since the first mover cannot be sure to receive something back, investment is risky in the first place. Different levels of investment and backtransfer can be interpreted as different degrees of cooperation, and it is interesting to investigate how cooperation varies with structural variations of the game and individual differences of the participants.
Kleine, Königstein, and Rozsnyói (2014) [2]—henceforth KKR—introduced a structural variation called “voluntary leadership”: One of the two players has the right to determine who is first mover and who is second mover. If a player decides to be first mover (“to take the lead”) this is voluntary leadership. KKR [2] found that voluntary leadership increases investment and backtransfer as compared to a control treatment with exogenous sequencing. KKR [2] interpret voluntary leadership among equally endowed players as a signal of cooperation that triggers reciprocally higher backtransfer.
As our main hypothesis in the current study we investigate whether the beneficial effect of voluntary leadership also occurs when the players differ in endowments. In KKR [2], endowments were equal. With asymmetric endowments, however, there is a relatively rich player and a relatively poor player, so issues of inequality between the two players are more difficult to assess than with symmetric endowments. Second, since investment is a risky decision that may be expected more naturally from the rich player, voluntary leadership of the rich player might be a weaker signal of cooperation than with symmetric endowments. Indeed, we find that the beneficial effect of voluntary leadership is weakened with asymmetric endowments when compared to symmetry.
In addition to our main hypothesis, we develop further predictions regarding the influence of endowment asymmetry under exogenous sequencing. Studying these issues has to be done within a theoretical framework that can capture the stylized facts of positive investments and backtransfers in trust games. Therefore, we discuss social preference models, with a focus on the model of Fehr and Schmidt (1999) [3]—in the following FS. We collect data on individual FS-preference parameters and risk aversion—among other individual measures—to control for individual heterogeneity.
To our knowledge, this is the first study on endogenous sequencing in an investment game with asymmetrically endowed players. However, there are related studies on investment games with asymmetric endowments and on games with endogenous leadership. Xiao and Bicchieri (2008) [4] introduce asymmetric endowments. They find a decline in positive reciprocity when reciprocation increases inequality. Endogenous leadership is studied e.g., in Arbak and Villeval (2007) [5] and Rivas and Sutter (2009) [6].2 They focus on endogenous leadership in public good games. Both of the studies find positive effects of endogenous leadership on cooperation. Furthermore, studying public good games with heterogeneous players and endogenous leadership Collins (2015) [12], Dasgupta and Orman (2013) [13], Güth et al. (2007) [14], and Levati et al. (2007) [15] document positive effects on group performance if the better off players take the lead.3 While KKR [2] add to the literature on endogenous leadership by showing that in the investment game voluntary leadership increases investment and backtransfer, the main contribution of the current study is to show that the beneficial effect of voluntary leadership is flawed under endowment asymmetry.
2. Experimental Game and Theoretical Predictions
2.1. The Trust Game with Endogenous Leadership and Asymmetric Endowments
Consider the following version of the Berg et al. (1995) [1] investment game. The game—we also refer to it as trust game—has two players and consists of three stages:
- Stage 1
- Player H (“high endowment player”) is endowed with 50 money units and decides upon the sequencing of moves in the investment game that follows in stages 2 and 3. H has two options, either become first mover in the investment game, and let player L who is endowed with 10 money units (“low endowment player”) be second mover. Or H may become second mover and let’s player L be first mover.
- Stage 2
- The first mover decides upon investment x with . Then, the second mover receives the amount .
- Stage 3
- The second mover decides upon backtransfer y with . Then, the first mover receives the amount .
Payoffs (first mover) and (second mover) are determined, as follows:
or
This concludes the description of the game.
2.2. Game Variants/Experimental Treatments
If H has chosen to be first (second) mover, then we refer to this as treatment HighEndoHighLow (HighEndoLowHigh).4 The label identifies that H determined the endogenous sequencing, and that in the trust game H chooses investment and L chooses backtransfer. We also ran treatments LowEndoHighLow and LowEndoLowHigh, in which the endogenous sequencing was determined by player L. Furthermore, we report data on treatments ExoHighLow and ExoLowHigh, in which the sequencing was determined exogenously by the experimenter. Furthermore, we include data that have been reported in KKR [2], in which the players had equal endowments of 10 money units. We refer to these sessions as ExoMidMid (“exogenous mid mid”), as well as Mid1EndoMid1Mid2 (player M1 decides on sequencing and chooses to be first mover) and Mid1EndoMid2Mid1 (player M1 decides on endogenous sequencing and chooses to be second mover). All of the treatments are listed in Table 1.
2.3. Theoretical Benchmark Solutions
Applying the standard assumption of egoistic and rational players, there will be no backtransfer, no investment, and the choice of sequencing is irrelevant. However, the stylized facts about the trust game are that there is substantial investment and backtransfer. In general, social preference models can predict these stylized facts. For example, Cox (2004) [18] shows that a model should incorporate (unconditional) altruistic other-regarding preferences, trust, and reciprocity. Cox considers a person A’s beliefs in another person B’s altruistic preference and reciprocating behavior. Obviously, a person that is sufficiently altruistic will choose positive backtransfer, positive investment, and may decide to take the lead. The same set of predictions can be derived from intention-based social preference models, like Rabin (1993) [19], Charness and Rabin (2002) [20], Dufwenberg and Kirchsteiger (2004) [21], and Falk and Fischbacher (2006) [22]. E.g., Falk and Fischbacher (2006) [22] assume reciprocity and kindness. Obviously, taking the lead may be seen as an act of kindness that leads to a reciprocal choice of positive backtransfer. We do not explore the feasible predictions of all these models and how they depend on parameters. Similar to KKR (2014) [2], we rather restrict a detailed analysis to the model of Fehr and Schmidt (1999) [3] for the following reasons: First, it is a rather simple outcome-based social preference model that nevertheless provides some behavioral restrictions for the current game. These restrictions guide our development of empirical Hypotheses and empirical analyses. Second, our experimental design was guided by the FS-model in that we chose the values of endowments, such that the poor (rich) player experiences unfavorable (favorable) inequality under all circumstances. This simplifies the analysis. Third, we applied the incentivized procedure of Danneberg et al. (2007) [23] to collect individual FS-preference parameters.
The Fehr/Schmidt-model (FS-model) assumes the following utility functions
with restrictions and . The variables and represent monetary payoffs of players j and i, while the parameter () represents the degree of aversion against unfavorable (favorable) inequality.
If (standard egoistic preferences), the second mover in the trust game does not backtransfer money. Thus, the first mover has no incentive to invest in the first place. The subgame perfect equilibrium with zero investment and zero backtransfer is inefficient.
However, if players are inequality averse, maximal investment and/or maximal backtransfer is feasible. Intuitively, an inequality averse player may forgo a monetary amount if this reduces inequality. For a more detailed understanding note that the monetary payoffs as well as utilities are linear in both investment and backtransfer. So, in general, an optimal choice will be either minimal (0) or maximal (10).
With equal endowments of 10 money units and an investment of x = 10 the second mover experiences favorable inequality such that y = 10 results in whereas y = 0 results in . Consequently, for values , the backtransfer choice y = 10 is optimal. To establish an optimal investment choice of x = 10 note that this choice leads to y = 10 and thus if . Alternatively, an investment of x = 0 leads to y = 0 (since y > 0 reduces the second movers monetary payoff and induces unfavorable inequality), and thus . In sum, with equal endowments and sufficiently inequality averse players, there exist SPE reaching 100% efficiency (x = 10 and y = 10).
This changes, however, with asymmetric endowments: Suppose that player H is first mover, player L is second mover. Any positive backtransfer y > 0 reduces L’s monetary payoff and increases unfavorable inequality for any . Thus, y = 0 is optimal. If H chooses x = 0 this results in . If H chooses x = 10 this results in . Consequently, for values the investment choice x =10 is optimal. Thus, if there is sufficient inequality aversion there exist SPE that reach 50% efficiency (x = 10, y = 0).
Now, suppose player L is first mover, player H is second mover. H experiences favorable inequality for all investments and will choose y = 10 if . Since backtransfer is independent from investment, any positive investment x > 0 reduces L’s monetary payoff and increases unfavorable inequality. Thus, x = 0 is optimal, and so there exist SPE that reach 50% efficiency (x = 0, y = 10) if there is sufficient inequality aversion.
Summing up the predictions of the FS-model we find that player L should neither invest nor backtransfer for any value of inequality aversion. Player H will choose maximal investment (maximal backtransfer) if H is sufficiently inequality averse . Full efficiency is only feasible in the treatments with symmetric endowments. Furthermore, the predictions for investment and backtransfer are independent of the sequencing. Thus, the FS-model does not provide a prediction for the sequencing choice.
Similar predictions could be derived from the model of Bolton and Ockenfels (2000) [24], which assumes that utility is increasing in money and is maximal ceteris paribus when both of the players have an equal share of the sum of payoffs. Consequently, the poor player should neither invest nor backtransfer, since this reduces both, the absolute amount of money and the payoff share. However, for the rich player positive investment and backtransfer is feasible.
Another simple model of social preferences, which, however, allows for positive investment and backtransfer also by the poor player is described in Charness and Rabin (2002) [20]: Individuals care for efficiency and the payoff of the worst-off player (“maximin preference”), in addition to own payoff. Obviously, if players exhibit a preference for efficiency, also the poor player has an incentive for choosing positive investment or positive backtransfer.
In addition to social preferences, there is an issue of risk preferences. Since investment is risky, a more risk averse player invests less and prefers not to take the lead. Furthermore, for general classes of risk preferences, e.g., risk preferences with constant relative risk aversion, the rich player can be expected to take the lead, rather than the poor player.5
Our experiment is not designed to test these theories against each other. Rather, we are interested in how endowment asymmetry influences the effect of voluntary leadership that has been documented in KKR [2]. But, this question should be addressed within a theoretical framework that can rationalize positive investments and backtransfers, which have been observed in many experiments on trust games. Therefore, we provided a mostly informal description of relevant theories and their implications. The theories also give some guidance for our empirical Hypotheses regarding the behavior of rich players relative to poor players and are suggestive of individual measures of heterogeneity that should be taken into account. Accordingly, we collected data on individual FS-parameters and risk aversion and use them as control variables.
2.4. Empirical Hypotheses
The focus of our experiment lies on the investigation of voluntary leadership and endowment asymmetry. Voluntary leadership occurs when a player puts himself in the first mover position, so it occurs in treatments HighEndoHighLow, Mid1EndoMid1Mid2, and LowEndoLowHigh. KKR [2] compared Mid1EndoMid1Mid2 with treatment ExoMidMid (when the sequence of moves is exogenously given by the experimenter) and showed that voluntary leadership increased investment as well as backtransfer. The choice of voluntary leadership is interpreted as a signal of cooperation, which leads to reciprocal cooperation.
We are specifically interested in comparing HighEndoHighLow (the rich player is taking the lead) versus Mid1EndoMid1Mid2 (one player among two equally endowed players is taking the lead). Comparing these two treatments is not a simple ceteris paribus comparison. Rather, several things change at the same time: In HighEndoHighLow, it is the poor player who chooses backtransfer. As worked out above, the FS-model predicts (1) lower backtransfer in this case compared to Mid1EndoMid1Mid2. If taking the risky first mover position is naturally expected from the rich player—remember our above argument about risk aversion—voluntary leadership in HighEndoHighLow is a weaker signal of cooperation than in Mid1EndoMid1Mid2. This furthermore (2) reduces the second mover’s backtransfer in HighEndoHighLow. Both of these arguments reduce the first mover’s incentives to invest (3) in HighEndoHighLow when compared to the Mid1EndoMid1Mid2. However, (4) a rich and/or inequality averse first mover can be expected to invest more ceteris paribus. Since arguments (3) and (4) work against each other, a prediction for investment is ambiguous. We expect (3) to exhibit a stronger influence on investment than (4). We formulate our main hypothesis, as follows:
Hypothesis 1.
In HighEndoHighLow backtransfer (Hypothesis 1.a) and investment (Hypothesis 1.b) are lower than in Mid1EndoMid1Mid2.
In treatment, LowEndoLowHigh it is the relatively poor player who takes the lead. We do not have a behavioral prediction for this condition: Even though a rich player should naturally be expected to bear more risk, the poor player puts himself in the first mover position. Our experiment did not prevent this possibility, and we did observe such cases. However, since we have no a-priori prediction, we will not discuss it in detail and leave it for further research. In general, we varied experimental conditions to study all of the combinations of endowment asymmetry and endogenous sequencing even though we do not have a-priori predictions for all possible combinations. Our discussion is focused on comparisons for which we have a-priori predictions.
The three exogenous treatments ExoHighLow, ExoMidMid, and ExoLowHigh allow for us to study the influence of endowment asymmetry and sequencing in isolation from voluntary leadership. We have predictions regarding backtransfer (assuming appropriate control variables, like investment and individual characteristics):
Hypothesis 2.
Backtransfer is higher in ExoLowHigh than in ExoMidMid and ExoHighLow.
Note that the FS-model predicts a strong difference in backtransfer between ExoLowHigh and ExoHighLow. The prediction regarding ExoMidMid is less strong, since maximal backtransfer is also feasible with equal endowments. But, we think that the moral obligation to reciprocate is particularly strong for the rich player. Therefore, we expect ExoMidMid in between ExoLowHigh and ExoHighLow.
Regarding investment under exogenous sequencing similar to our arguments for Hypothesis 1.b there are effects that work in opposite directions: A rich player may be expected to invest more than a poor player ceteris paribus either due to risk preferences or social preferences or both. However, in ExoHighLow the rich player has to also anticipate a low backtransfer, which reduces the incentives to invest ceteris paribus. The latter argument is even stronger here than for Hypothesis 1.b, since the cooperative signal of voluntary leadership that may increase backtransfer of a poor player does not apply here. The net effect is ambiguous, especially if one considers that preferences are in general incomplete information. Our specific FS analysis, which implicitly assumed that preferences are known, predicted that with asymmetric endowments only the rich player may invest. Based on this analysis, we therefore predict higher values in ExoHighLow than in ExoLowHigh. Again, we expect ExoMidMid in between and formulate this as:
Hypothesis 3.
Investment is higher in ExoHighLow than in ExoMidMid and ExoLowHigh.
KKR [2] tested whether an individual measure of a person’s trust in others plays a role for investment. They relied on a trust measure that is included within the World Value Survey (2005) [26]. However, empirically it turned out to be statistically insignificant. Therefore, in collecting the data under asymmetric endowments, we collected measures of individual trust in a different manner. Specifically, we took a measure of an investor’s expected backtransfer (see details below). We hypothesize:
Hypothesis 4.
Investment increases in individual trust (measured by expected backtransfer).
In our empirical assessment of Hypotheses 1 to 4, we will also include control variables, like gender and individual measures of inequality aversion. They will be introduced together with the data analyses.
As Table 1 shows under endogenous sequencing, we also observed cases in which players decided not to become first mover in the trust game, but delegate the investment decision to the other player. We refer to this as “delegation of responsibility”. It did occur in the experiment and we refer to these data as treatments HighEndoLowHigh, LowEndoHighLow, and Mid1EndoMid2Mid1. We think that it is difficult to interpret e.g., if the rich player delegates the risky first move to the poor player. We report and explore these data empirically but do not provide a-priori Hypotheses.
3. Experimental Procedures
The experiment was run in the experimental economics lab at the University of Erfurt. It was computerized using the software z-Tree (see Fischbacher, 2007 [27]). Each session featured about 20 participants, which were matched in pairs to play one variant of the investment game only once. So, the experiment was truly one-shot. The numbers of pairs (observations) in each treatment are reported in Table 2. With endogenous sequencing it is in general not feasible to have a balanced design. We ran more session under endogenous rather than exogenous sequencing in order to generate sufficiently many observations for each treatment.
The participants were students from different fields (social sciences and humanities) and were recruited via Orsee (Greiner 2015 [28]). Players received written instructions, were randomly paired and interacted anonymously (instructions are provided in the Appendix). In addition to the game choices we also collected several individual measure as follows: After a first mover’s investment, choice we collect his/her expected backtransfer. This was incentivized applying the Quadratic Scoring Rule6 and can be seen as a measure of trust. After the second mover’s backtransfer choice, the players were informed about their payoffs. Then, they played the lottery game of Holt and Laury (2002) [31] to determine their degree of risk aversion. Afterwards, they played the distribution game of Danneberg et al. (2007) [23] to determine their FS-preference parameters αi and βi. The collection of both, the degree of risk aversion and the FS-parameters, were incentivized.
Furthermore, we also collected some non-incentivized measures: A measure of an individual’s trust in other persons or in society as a whole, as it is collected by the World Value Survey (2005) [26].7 A measure of personality according to the 16-PA-personality questionnaire of Brandstätter (1988) [32] and some socio-demographic characteristics (age, gender, etc.). Sessions took about 50 min, subjects were paid anonymously, and average earnings were about 10 EUR in the symmetric treatments and about 17 EUR in the asymmetric treatments.8 In the investment game, 10 money units earned translated to 3 EUR. When only considering the payoffs resulting from the investment game, the minimal (maximal) feasible money payoff for an individual player was 0 EUR (12 EUR) in symmetric treatments and 0 EUR (24 EUR) in asymmetric treatments. The efficient payoff sum was 18 EUR in symmetric treatments and 30 EUR in asymmetric treatments.
4. Experimental Results
4.1. Descriptive Statistics
Summary statistics of experimental decisions are provided in Table 2 (means and standard deviations) and Table 3 (medians and inter-quartile ranges). Accordingly, in the investment game with endogenous sequencing, voluntary leadership occurred 69 times (39 + 16 + 14), whereas delegation of responsibility occurred 167 times (57 + 64 + 46). Thus, voluntary leadership occurs in about 29% of the cases. Voluntary leadership has the highest relative frequency (39/96) when the rich player has to decide on the sequencing. This is supported by a Binomial test for the relative frequency of voluntary leadership when the rich player moves first versus the relative frequency of voluntary leadership when the poor player moves first. The test is significant (p < 0.001, n = 156) supporting our intuition that the risky investment decision can more naturally be expected from the rich player.9 The assessment of individual risk measures resulted in about 73% of the participants being classifiable as risk averse (419 out of 574), while 155 were risk-neutral or risk-loving. Note that, according to Holt and Laury (2002) [31], this assumes a CRRA-utility function.
4.2. Regression Analyses: Backtransfer
Table 4 reports a Tobit regression of backtransfer applying an upper (lower) bound of 10 (0).10 As has been reported in other studies, we find that investment has a strong and significant, positive effect on backtransfer.11 The coefficient is 0.66 so increasing investment by 1 money unit increases backtransfer by 0.66 money units. The coefficient is in between the level 1.0 (“backtransfer equal to investment”) and level 0.33 (“backtransfer sufficient to compensate investment”). Since backtransfer is tripled, this means that each money unit invested returns two money units to the investor. It also means that the first mover gets a lower share of the generated surplus than the second mover.
The model includes eight 0/1-dummy variables for different treatments with the ninth, Mid1EndoMid1Mid2, being the reference treatment.12 In KKR [2], it has been shown that backtransfer is higher under voluntary leadership (Mid1EndoMid1Mid2) than with exogenous sequencing ExoMidMid. This can be seen here as well: The estimated coefficient of ExoMidMid is negative and significant. Furthermore, we find that voluntary leadership increases backtransfer also under endowment asymmetry: Namely, applying an F-Test to the joint hypothesis “HighEndoHighLow > ExoHighLow & LowEndoLowHigh > ExoLowHigh” results in p = 0.093 and supports this hypothesis.13
Our main Hypothesis 1.a predicts that backtransfer in HighEndoHighLow is smaller than in the reference category Mid1EndoMid1Mid2. This is actually the case. The estimated coefficient is −2.12, so backtransfer is more than two units smaller in HighEndoHighLow than in Mid1EndoMid1Mid2. The effect is significant and supports our hypothesis.14
We think that this result is driven by two forces: First, that the relatively rich player takes the lead in HighEndoHighLow is a weaker signal of cooperation than when one of two equally endowed players takes it. Second, in HighEndoHighLow, the second mover is relatively poor even though the absolute endowment is equal to that of the second mover in Mid1EndoMid1Mid2. But, being relatively poor when compared to the first mover reduces backtransfer.
Hypothesis 2 predicts that under exogenous sequencing a rich player backtransfers more than a poor player or when players have equal endowments. Indeed, we find that backtransfer is higher in ExoLowHigh than in ExoMidMid and ExoHighLow. Applying an F-test to the joint hypothesis “ExoLowHigh > ExoMidMid & ExoMidMid > ExoHighLow” results in p < 0.001. This supports Hypothesis 2 and fits qualitatively to the prediction of the FS-model.15 It does not fit exactly, since the FS-model predicts a backtransfer of zero by the poor player.
That a rich second mover backtransfers more ceteris paribus than a poor second mover holds also under delegation of responsibility: Backtransfer is higher in HighEndoLowHigh than in Mid1EndoMid2Mid1 and LowEndoHighLow. Testing the joint hypothesis “HighEndoLowHigh > Mid1EndoMid2Mid1 & Mid1EndoMid2Mid1 > LowEndoHighLow” results in p = 0.004.16
The effect of LowEndoLowHigh is not significantly different from the reference category M1EndoMid1Mid2. We did not specify a prediction for this condition and do not discuss it further.
Table 4 furthermore reports significantly positive effects of favorable and unfavorable inequality aversion. Since the rich (poor) player always experiences favorable (unfavorable) inequality only the parameter may be relevant. Therefore, Alpha-High and Beta-High are interaction terms that measure the influence of the FS-parameters whenever the respective parameter is relevant.17 As should be expected theoretically Beta-High has a positive effect. Backtransfer increases in favorable inequality aversion. The effect of Alpha-High, however, is counter to the theoretical prediction. It should be negative rather than positive. If the second mover is poor, Alpha-High is relevant but it should decrease backtransfer. We can only speculate about possible explanations for this counter-intuitive effect. If fairness preferences were correlated with other kinds of social preferences, e.g., care for efficiency, this could be an explanation. In this case, better measures of social preferences than the ones we used would be required.
Alpha-Missing and Beta-Missing are dummies for participants that gave incomplete or inconsistent answers on the inequality aversion measure. They are not of interest and were just included to avoid a loss of observations or confusion of our estimates of interest Alpha-High and Beta-High.
Summarizing our analysis of backtransfer, we find that with endowment asymmetry the relatively rich player backtransfers higher amounts than the relatively poor player or players with equal endowments (Hypothesis 2). Backtransfer is higher under voluntary leadership than with exogenous sequencing. But, voluntary leadership has a stronger influence when endowments are symmetric (Hypothesis 1.a). Both findings extend the findings for symmetric endowments that are reported in KKR [2]. Favorable inequality aversion by the second mover (FS-Beta) increases backtransfer, which is consistent with the FS-model. However, FS-Alpha also has an increasing effect on backtransfer which is implausible. As described above, we collected not only FS-parameters, but also a number of other individual measures. However, including them in the analysis of backtransfer turned out to be insignificant.
4.3. Regression Analyses: Investment
Table 5 and Table 6 report Tobit regression analyses (upper bound: 10, lower bound: 0) of investment.18 All of the variables are analogous to Table 4. Table 5 uses data of all sessions. Table 6 is a separate analysis of all sessions with asymmetric endowment. Only in these sessions we collected individual expectations on backtransfer which we include in the analysis.
Our main Hypothesis 1.b predicts lower investment in HighEndoHighLow than in the reference treatment Mid1EndoMid1Mid2. The estimated coefficient is −5.19 and it is statistically significant.19 This supports our Hypothesis 1.b. We think that the reduction in investment has two causes: First, the rich player anticipates that taking the lead by himself/herself is naturally expected rather than a strong signal of cooperation. Second, the rich player anticipates that, due to inequality aversion, the poor second mover’s motivation to backtransfer money is flawed. These two effects together are stronger than the counter-effect of a rich player investing more ceteris paribus than a poor player.
When comparing other estimated coefficients across treatments, we find HighEndoHighLow > ExoHighLow & LowEndoLowHigh > ExoLowHigh which qualitatively supports the general prediction that voluntary leadership increases investment. However, a joint F-Test is insignificant as well as pairwise MWU-tests.
Hypothesis 3 predicts higher investment in ExoHighLow than in ExoLowHigh and ExoMidMid. According to Table 5, this is the case, but a joint F-Test based on the regression estimates is insignificant (p = 0.893). Also pairwise MWU-test are insignificant. Thus, for Hypothesis 3 we fail to reject the Null-hypothesis. This might be due to low power since the power of a two-sample, two-sided t-test is only 0.344 (Cohen’s d = 0.474, α = 0.05) for the test ExoHighLow vs. ExoMidMid. For the test ExoHighLow vs. ExoLowHigh, the power is only 0.258 (Cohen’s d = 0.400, α = 0.05).
Remember that in developing Hyothesis 3, we argued that there are effects working in opposite directions. While a rich player should invest more than a poor player ceteris paribus, the rich player in ExoHighLow has to anticipate a relatively low backtransfer by the poor second mover, which undermines investment incentives. This view, that the first mover’s expectations about backtransfer are important for investment, is supported by Table 6. The variable Expected Backtransfer is not only highly statistically significant (p < 0.001)20, but it has also large effect size when considering that it has a mean of 4.64 and a standard deviation of 2.11. Thus, a difference in Expected Backtransfer by one standard deviation increases investment by about 3.12 units (2.11 × 1.48). These findings support our Hypothesis 4: Investment is increasing in the first mover’s expected backtransfer. This result is important also because there is substantial heterogeneity in expectations, which can be seen not only from the standard deviation but also from the fact that Expected Backtransfer ranges from 0 to 10.
5. Discussion and Conclusions
As other studies before (e.g., Berg et al. (1995) [1]), our experiment rejects the prediction of zero investment and zero backtransfer, which is implied by the standard paradigm of egoistic preferences. We find substantial amounts of investment and backtransfer and a strong positive correlation between both.
We rely on the investment game to study voluntary leadership under endowment asymmetry. A number of studies as referred to in the introduction have shown that endogenous sequencing has beneficial effects on cooperation in public good games. KKR [2] have shown that voluntary leadership has beneficial effects in an investment game with equal endowments as well. Namely, investment and backtransfer increase when compared to exogenous sequencing. Our main contribution to the literature on endogenous sequencing is to show that the beneficial effects of voluntary leadership may be flawed when endowments are asymmetric.
The data support our Hypothesis 1.a that backtransfer in HighEndoHighLow (voluntary leadership by the rich player) is significantly smaller than in Mid1EndoMid1Mid2 (voluntary leadership among equally endowed players). We think that in HighEndoHighLow there are two forces at work: First, the second mover observes that the other player has taken the lead, but since it is the rich player, this is not perceived as an equally strong signal of cooperation than voluntary leadership among equally endowed players (in Mid1EndoMid1Mid2). Our intuition that it is more natural to expect the risky first mover position by the rich player can be justified by standard risk preferences, like constant relative risk aversion. The data also support this view since voluntary leadership is relatively more frequent when the rich player decides on the sequencing. Second, the poor second mover knows that he/she experiences unfavorable inequality. Any backtransfer decreases monetary earnings and increases unfavorable inequality. This is different from Mid1EndoMid1Mid2 in which the second mover usually experiences favorable inequality due to a positive investment of the equally endowed first mover.
These arguments regarding backtransfer also guide the interpretation of first mover behavior. Namely, both of the arguments reduce the rich first mover’s incentives for investment. There is a counter-effect to be considered, namely that a rich first mover may be expected to invest more than a poor first mover ceteris paribus. However, we show that the net effect is negative, i.e., as predicted in Hypothesis 1.b, investment is smaller in HighEndoHighLow than in Mid1EndoMid1Mid2.
This discussion shows that we interpret the players’ moves as intentional, e.g., the first mover’s investment is made conditional on an expectation regarding backtransfer. Cox (2004 and 2009) [18,33] works out the distinction between unconditional other-regarding preferences and intention-conditional trust (investment) and reciprocity (backtransfer), and argues that all three kinds of behavior are present. He shows that it is difficult to disentangle these motivations unless one uses a specific triadic experimental design. We did not do so, and therefore cannot discriminate these issues here. Similarly the voluntary decision to lead may be seen as an intentional signal to increase cooperation which is taken more likely by a less risk averse player or a rich player. Alternatively it might be a choice of a player with unconditional other-regarding preferences. E.g., players who exhibit a larger degree of unconditional kindness choose voluntary leadership more likely than players with a lower degree. Thus, there remains ambiguity with respect to the interpretation of the observed effect of voluntary leadership.
We ran treatments with exogenous sequencing to study the influence of endowment asymmetry in isolation from endogeneity. As predicted by Hypothesis 2, backtransfer is higher in ExoLowHigh than in ExoMidMid and ExoHighLow. This hypothesis was derived straightforward from the FS-model.
The data do not support the more complicated Hypothesis 3 predicting higher investment in ExoHighLow than in ExoMidMid and ExoLowHigh. It is more complicated since there are effects that run counter to each other. The rich first mover in ExoHighLow has to anticipate a relatively low backtransfer by the poor second mover. This reduces incentives to invest. However, a rich and/or inequality averse player may ceteris paribus be expected to invest more than a poor player. Hypothesis 3 may be motivated by a FS analysis if preferences are known. In this case, there is no investment risk and only the rich player will invest. However, in the experiment, preferences were not known.
We find strong support for our Hypothesis 4 that investment depends on individual expectations about backtransfer.22 There is a strong positive and significant correlation between the expected backtransfer and investment. Thus, in empirical studies of the investment game the expected backtransfer should be seen as an important control variable. This is related to Chaudhuri et al. (2003) [36] and Chaudhuri and Gangadharan (2007) [37], according to which there is a positive within-person correlation of trust (investment) and trustworthiness (backtransfer). However, this holds only for some part of the player population, whereas some other part of the player population shows trust but low trustworthiness. The latter is characterized as an intention to exploit trust and trustworthiness of others. A similar result is shown by Dasgupta and Menon (2011) [38] who show that such exploitative players can be found more often among economics majors than other students.
As reported in KKR [2] and Chaudhuri and Gangadharan (2007) [37], we also found that male participants invest more than female.
The sharp prediction of the FS-model, that the poor player should neither invest nor backtransfer anything for any degree of inequality aversion is not supported by the data. Even poor players choose positive investment and backtransfer. Also, like in other studies of the investment game, there are not only minimal and maximal choices, but also above-minimal and below-maximal choices.
However, in line with the FS-model investment by the poor or equally endowed player23 decreases in unfavorable inequality aversion. Backtransfer by the rich or equally endowed player24 increases in favorable inequality aversion. Counter-intuitively, we also found backtransfer increasing in unfavorable inequality aversion. One explanation might be a correlation between inequality aversion and other kinds of social preferences like e.g., a preference for efficiency. If this were the case, better measures of social preferences than the one we used (Danneberg et al., 2007) [23] would be necessary.
Author Contributions
Conceptualization, Kleine, Königstein and Rozsnyói; Methodology, Kleine, Königstein and Rozsnyói; Software, Kleine.; Validation, Kleine, Königstein. and Rozsnyói; Formal Analysis, Königstein and Rozsnyói; Investigation, Königstein; Resources, Königstein; Data Curation, Kleine and Königstein; Writing-Original Draft Preparation, Königstein; Writing-Review & Editing, Kleine and Königstein; Visualization, Kleine and Königstein; Supervision, Königstein; Project Administration, Königstein.
Funding
This research received no external funding.
Conflicts of Interest
The authors declare no conflict of interest.
Appendix A. Instructions
The set of experiments consists of three treatments where each consist of on endogenous and one exogenous treatment. All instructions are translated from German.
Appendix A.1. General Introduction
You are participating in various decision experiments. At the end you will be paid according to your performance. Thus, it is important that you understand the following instructions. First, you receive and read the instructions for experiment one. Instructions for other experiments will be provided on the computer screen.
Within the experiments you can earn money depending on your decisions. Earnings will be added to your account while losses will be subtracted. In the end of the experiment your earnings will be paid in cash. Earnings are denoted by points. The conversion into Euro will be announced in each experiment.
Please note that during the experiments communication is not allowed. If you have any question, please raise your arm. All decisions are taken anonymously. No other participant will get to know your name or monetary payoff.
Good luck!
Appendix A.2. Exogenous Treatment of Sym
The participants will be divided into groups with two persons in each group. They are called player A and B. Players are randomly assigned to their groups and types. Your type of player is displayed on screen. Points are converted into Euros according to the following rule:
10 points = 3 Euro
- (1)
- Each participant receives an endowment.
- Participant A receives 10 points
- B receives 10 points
- (2)
- Participant B transfers an amount x (0 ≤ x ≤ 10) to participant A.
- (3)
- Participant A gains 3x, i.e., participant A receives three times the amount transferred by B.
- (4)
- Participant A transfers an amount y (0 ≤ y ≤ 10) to participant B.
- (5)
- Participant B gains 3y, i.e., participant B receives three times the transferred amount.
- (6)
- The experiment is done.
Appendix A.3. Endogenous Treatment of Sym
The participants will be divided into groups with two persons in each group. They are called player A and B. Players are randomly assigned to their groups and types. Your type of player is displayed on screen. Points are converted into Euros according to the following rule:
10 points = 3 Euro
- (1)
- Each participant receives an endowment.
- Participant A receives 10 points
- Participant B receives 10 points
- (2)
- Participant B decides about the sequence of choices. There are two possible sequences. B–A or A–B. If B–A is chosen, the experiment continues as described in (3a) to (7a). If A–B is chosen, the experiment continues as described in (3b) to (7b).
Sequence B–A
- (3a)
- Participant B transfers an amount x (0 ≤ x ≤ 10) to participant A.
- (4a)
- Participant A gains 3x, i.e., participant A receives three times the amount transferred by B.
- (5a)
- Participant A transfers an amount y (0 ≤ y ≤ 10) to participant B.
- (6a)
- Participant B gains 3y, i.e., participant B receives three times the transferred amount.
- (7a)
- The experiment is done.
Sequence A–B
- (3b)
- Participant A transfers an amount x (0 ≤ x ≤ 10) to participant B.
- (4b)
- Participant B gains 3x, i.e., participant B receives three times the amount transferred by participant A
- (5b)
- Participant B transfers an amount y (0 ≤ y ≤ 10) to participant A.
- (6b)
- Participant A gains 3y, i.e., participant A receives three times the amount transferred by participant B.
- (7b)
- The experiment is done.
Appendix A.4. Exogenous Treatment of AsymHigh
The participants will be divided into groups with two persons in each group. They are called player A and B. Players are randomly assigned to their groups and types. Your type of player is displayed on screen. Points are converted into Euros according to the following rule:
10 points = 3 Euro
- (3)
- Each participant receives an endowment.
- Participant A receives 10 points
- receives 50 points
- (4)
- Participant B transfers an amount x (0 ≤ x ≤ 10) to participant A.
- (5)
- Participant A gains 3x, i.e., participant A receives three times the amount transferred by B.
- (6)
- Participant A transfers an amount y (0 ≤ y ≤ 10) to participant B.
- (7)
- Participant B gains 3y, i.e., participant B receives three times the transferred amount.
- (8)
- The experiment is done.
Appendix A.5. Endogenous Treatment of AsymHigh
The participants will be divided into groups with two persons in each group. They are called player A and B. Players are randomly assigned to their groups and types. Your type of player is displayed on screen. Points are converted into Euros according to the following rule:
10 points = 3 Euro
- (1)
- Each participant receives an endowment.
- Participant A receives 10 points
- Participant B receives 50 points
- (2)
- Participant B decides about the sequence of choices. There are two possible sequences. B–A or A–B. If B–A is chosen, the experiment continues as described in (3a) to (7a). If A–B is chosen, the experiment continues as described in (3b) to (7b).
Sequence B–A
- (3a)
- Participant B transfers an amount x (0 ≤ x ≤ 10) to participant A.
- (4a)
- Participant A gains 3x, i.e., participant A receives three times the amount transferred by B.
- (5a)
- Participant A transfers an amount y (0 ≤ y ≤ 10) to participant B.
- (6a)
- Participant B gains 3y, i.e., participant B receives three times the transferred amount.
- (7a)
- The experiment is done.
Sequence A–B
- (3b)
- Participant A transfers an amount x (0 ≤ x ≤ 10) to participant B.
- (4b)
- Participant B gains 3x, i.e., participant B receives three times the amount transferred by participant A
- (5b)
- Participant B transfers an amount y (0 ≤ y ≤ 10) to participant A.
- (6b)
- Participant A gains 3y, i.e., participant A receives three times the amount transferred by participant B.
- (7b)
- The experiment is done.
Appendix A.6. Exogenous Treatment of AsymLow
The participants will be divided into groups with two persons in each group. They are called player A and B. Players are randomly assigned to their groups and types. Your type of player is displayed on screen. Points are converted into Euros according to the following rule:
10 points = 3 Euro
- (3)
- Each participant receives an endowment.
- Participant A receives 50 points
- B receives 10 points
- (4)
- Participant B transfers an amount x (0 ≤ x ≤ 10) to participant A.
- (5)
- Participant A gains 3x, i.e., participant A receives three times the amount transferred by B.
- (6)
- Participant A transfers an amount y (0 ≤ y ≤ 10) to participant B.
- (7)
- Participant B gains 3y, i.e., participant B receives three times the transferred amount.
- (8)
- The experiment is done.
Appendix A.7. Endogenous Treatment of SymLow
The participants will be divided into groups with two persons in each group. They are called player A and B. Players are randomly assigned to their groups and types. Your type of player is displayed on screen. Points are converted into Euros according to the following rule:
10 points = 3 Euro
- (1)
- Each participant receives an endowment.
- Participant A receives 50 points
- Participant B receives 10 points
- (2)
- Participant B decides about the sequence of choices. There are two possible sequences. B–A or A–B. If B–A is chosen, the experiment continues as described in (3a) to (7a). If A–B is chosen, the experiment continues as described in (3b) to (7b).
Sequence B–A
- (3a)
- Participant B transfers an amount x (0 ≤ x ≤ 10) to participant A.
- (4a)
- Participant A gains 3x, i.e., participant A receives three times the amount transferred by B.
- (5a)
- Participant A transfers an amount y (0 ≤ y ≤ 10) to participant B.
- (6a)
- Participant B gains 3y, i.e., participant B receives three times the transferred amount.
- (7a)
- The experiment is done.
Sequence A–B
- (3b)
- Participant A transfers an amount x (0 ≤ x ≤ 10) to participant B.
- (4b)
- Participant B gains 3x, i.e., participant B receives three times the amount transferred by participant A
- (5b)
- Participant B transfers an amount y (0 ≤ y ≤ 10) to participant A.
- (6b)
- Participant A gains 3y, i.e., participant A receives three times the amount transferred by participant B.
- (7b)
- The experiment is done.
Appendix A.8. Side Experiment 1
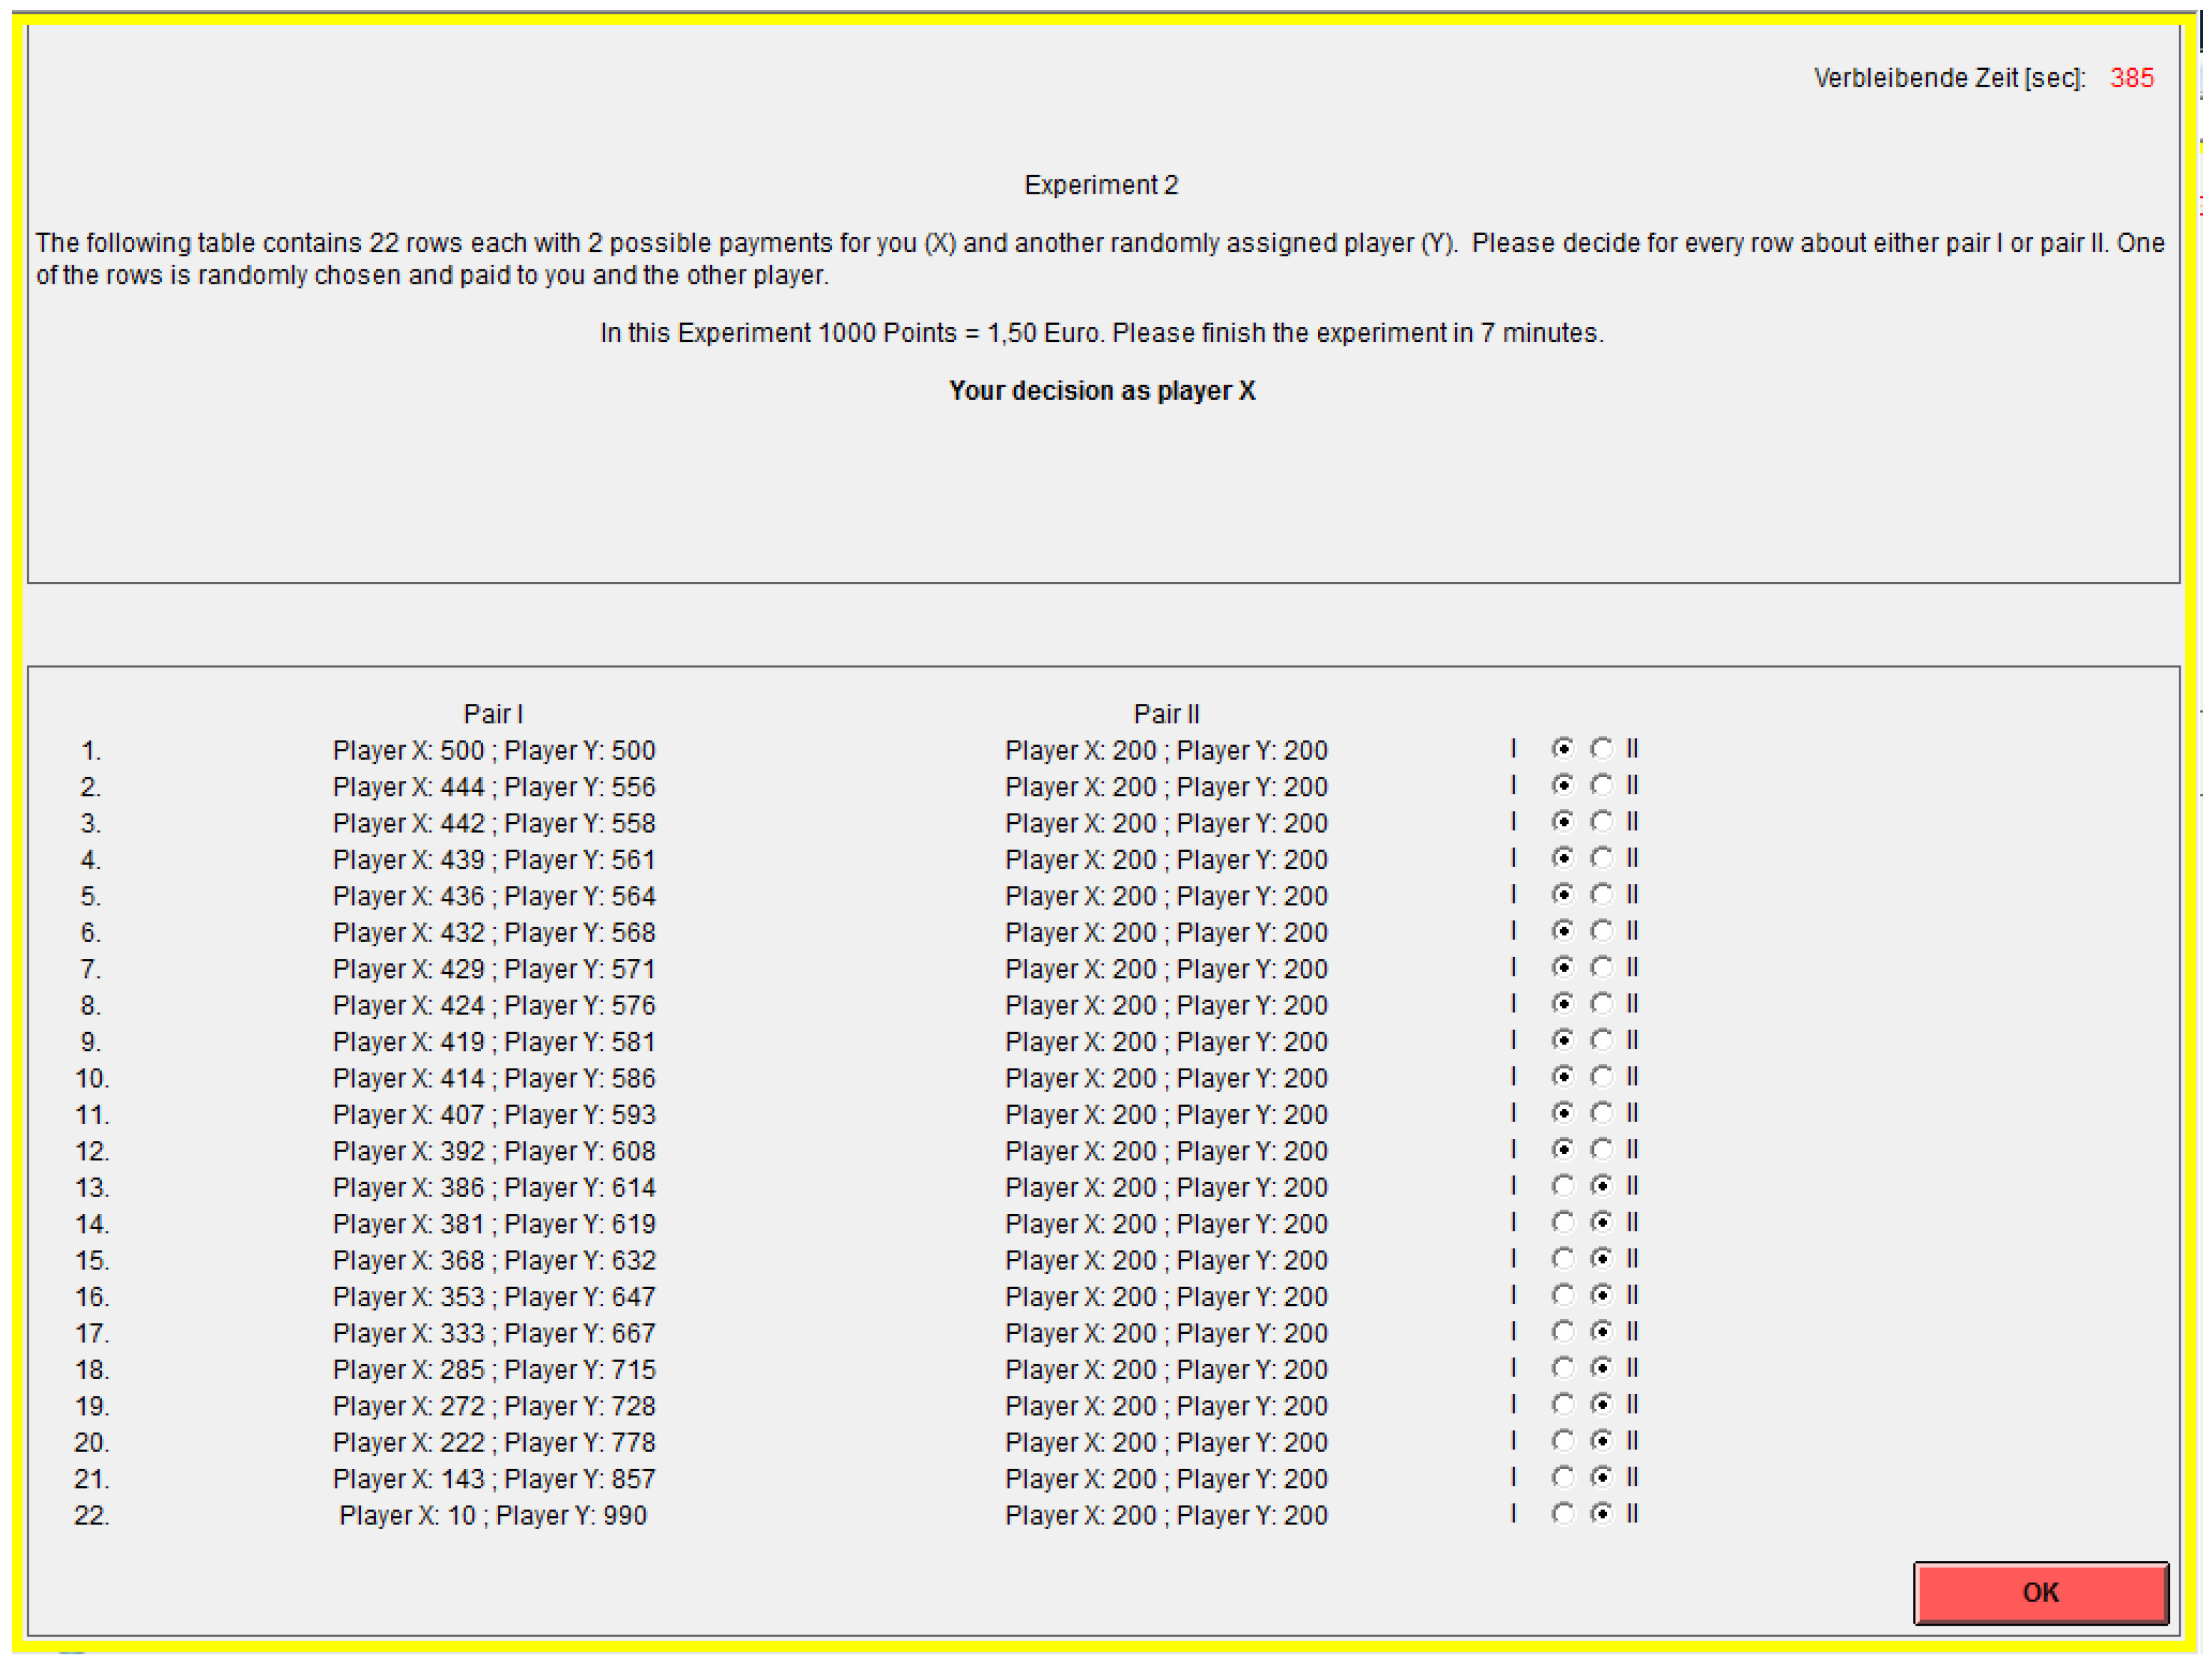
Figure A1.
Z-Tree Screenshot of Elicitation of Unfavored Inequality Aversion. Notes: Players have to decide upon one of each column in every row. The procedure is as proposed by Danneberg et al. 2007.
Figure A1.
Z-Tree Screenshot of Elicitation of Unfavored Inequality Aversion. Notes: Players have to decide upon one of each column in every row. The procedure is as proposed by Danneberg et al. 2007.
Appendix A.9. Side Experiment 2
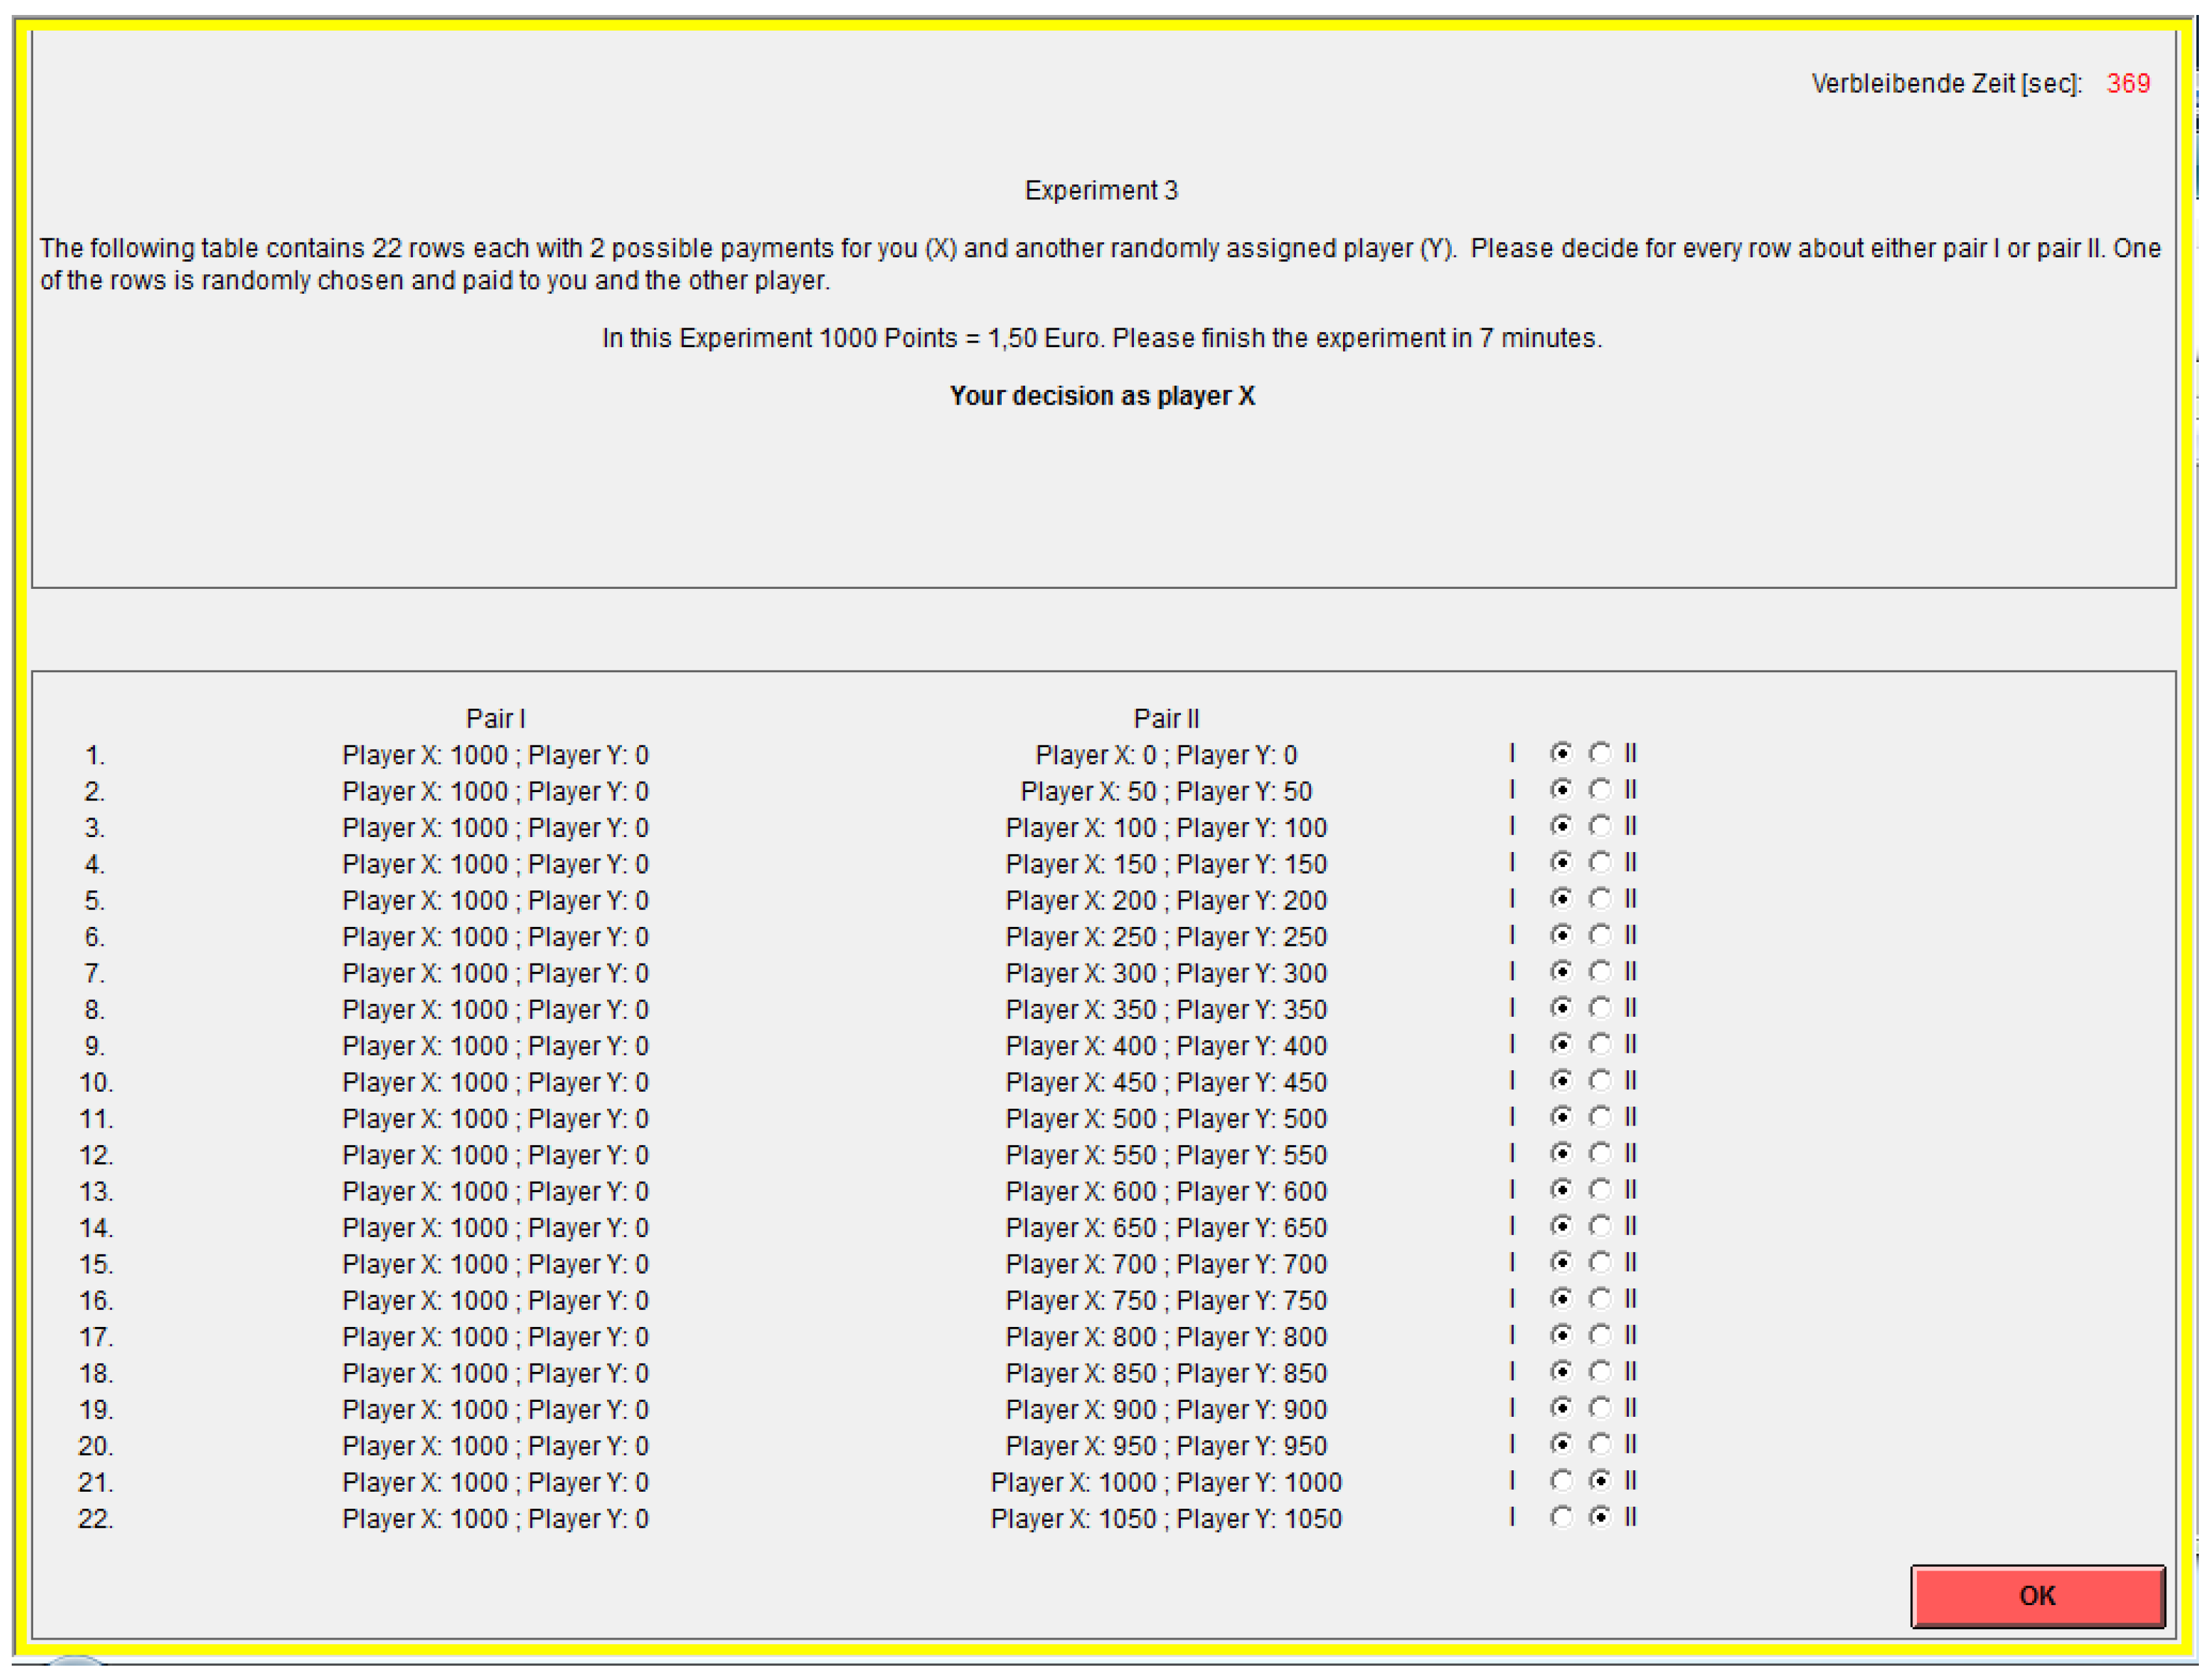
Figure A2.
Z-Tree Screenshot of Elicitation of Favored Inequality Aversion. Notes: Players have to decide upon one of each column in every row. The procedure is as proposed by Danneberg et al. 2007.
Figure A2.
Z-Tree Screenshot of Elicitation of Favored Inequality Aversion. Notes: Players have to decide upon one of each column in every row. The procedure is as proposed by Danneberg et al. 2007.
Appendix A.10. Side Experiment 3
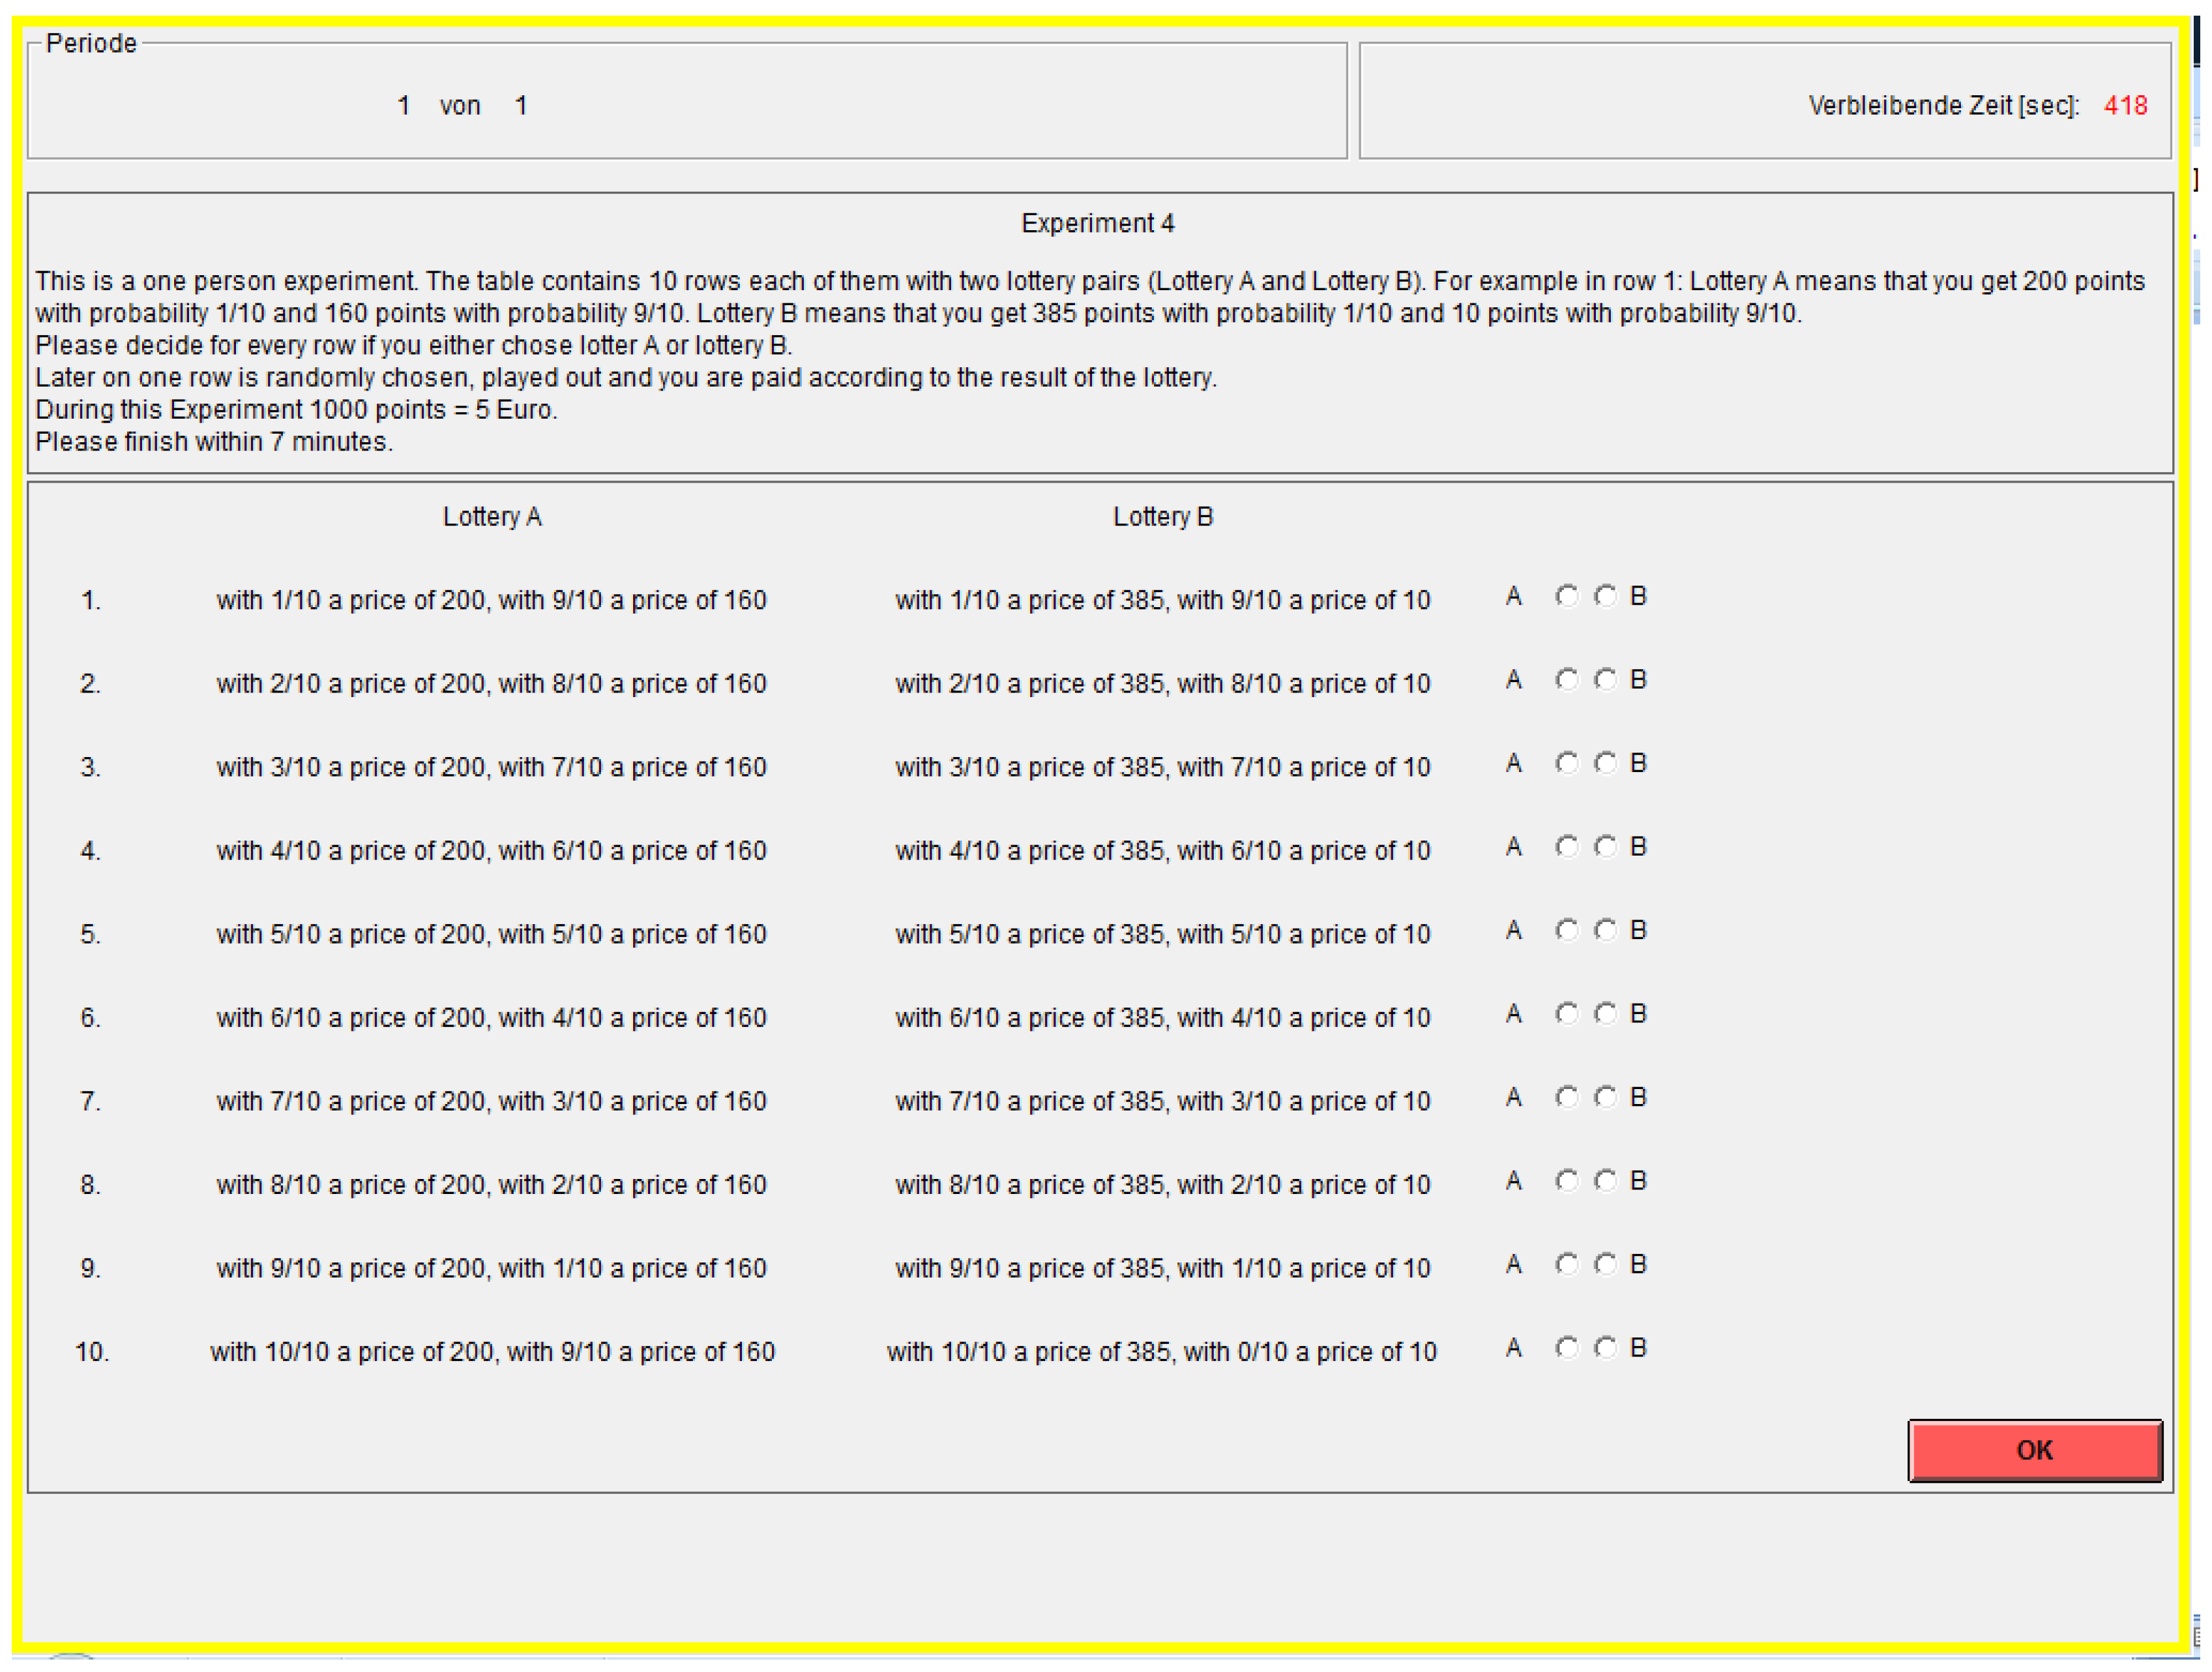
Figure A3.
Z-Tree Screenshot of Elicitation of Risk Preferences. Notes: Players have to decide upon one of two lotteries in every row. The procedure is as proposed by Holt and Laury (2002).
Figure A3.
Z-Tree Screenshot of Elicitation of Risk Preferences. Notes: Players have to decide upon one of two lotteries in every row. The procedure is as proposed by Holt and Laury (2002).
References
- Berg, J.; Dickhaut, J.; McCabe, K. Trust, Reciprocity and Social History. Games Econ. Behav. 1995, 10, 122–142. [Google Scholar] [CrossRef]
- Kleine, F.; Königstein, M.; Rozsnyói, B. Voluntary Leadership in an Experimental Trust Game. J. Econ. Behav. Organ. 2014, 108, 442–452. [Google Scholar] [CrossRef]
- Fehr, E.; Schmidt, K.M. A Theory of Fairness, Competition, and Cooperation. Q. J. Econ. 1999, 114, 817–868. [Google Scholar] [CrossRef] [Green Version]
- Xiao, E.; Bicchieri, C. When equality trumps reciprocity. J. Econ. Psychol. 2010, 31, 456–470. [Google Scholar] [CrossRef] [Green Version]
- Arbak, E.; Villeval, M.C. Voluntary leadership: Motivation and influence. Soc. Choice Welf. 2013, 40, 635–662. [Google Scholar] [CrossRef]
- Rivas, M.F.; Sutter, M. Leadership in Public Goods Experiments—On the Role of Reward, Punishment and Endogenous Leadership. Available online: http://campus.usal.es/ehe/Papers/Leadership_FernandaRivas.pdf (accessed on 27 April 2018).
- Fonseca, M.A.; Huck, S.; Normann, H.T. Endogenous Timing in Duopoly: Experimental Evidence. Int. J. Game Theory 2006, 34, 443–456. [Google Scholar] [CrossRef]
- Fonseca, M.A.; Huck, S.; Normann, H.T. Playing Cournot although they shouldn’t. Econ. Theory 2006, 25, 669–677. [Google Scholar]
- Huck, S.; Müller, W.; Normann, H.T. To Commit or Not to Commit: Endogenous Timing in Experimental Duopoly Markets. Games Econ. Behav. 2002, 38, 240–264. [Google Scholar] [CrossRef] [Green Version]
- Potters, J.; Sefton, M.; Vesterlund, L. After You—Endogenous Sequencing in Voluntary Contribution Games. J. Public Econ. 2005, 89, 1399–1419. [Google Scholar] [CrossRef]
- Nosenzo, D.; Sefton, M. Endogenous Move Structure and Voluntary Provision of the Public Goods: Theory and Experiment. J. Public Econ. Theory 2011, 13, 721–754. [Google Scholar] [CrossRef]
- Collins, S. Relay the Right Way: Harnessing Heterogeneity in Sequential Team Production. Manag. Decis. Econ. 2016, 37, 407–423. [Google Scholar] [CrossRef]
- Dasgupta, U.; Orman, W.H. Does Heterogeneity Help in Overcoming the Public Goods Dilemma in a Sequential Contribution Environment? Group Decis. Negot. 2013, 23, 1219–1239. [Google Scholar] [CrossRef]
- Güth, W.; Levati, M.V.; Sutter, M.; van der Heijden, E. Leading by example with and without exclusion power in voluntary contribution experiments. J. Public Econ. 2007, 91, 1023–1042. [Google Scholar] [CrossRef] [Green Version]
- Levati, M.V.; Sutter, M. Leading by Example in a Public Goods Experiment with Heterogeneity and Incomplete Information. J. Confl. Resolut. 2007, 51, 793–818. [Google Scholar] [CrossRef] [Green Version]
- Au, W.T.; Chung, M.W. Effect of Order of Contribution in a Sequential Public Goods Dilemma. Group Decis. Negot. 2007, 16, 437–449. [Google Scholar] [CrossRef]
- Reuben, E.; Riedl, A. Enforcement of contribution norms in public good games with heterogeneous populations. Games Econ. Behav. 2013, 77, 122–137. [Google Scholar] [CrossRef] [Green Version]
- Cox, J.C. How to identify trust and reciprocity. Games Econ. Behav. 2004, 46, 260–281. [Google Scholar] [CrossRef] [Green Version]
- Rabin, M. Incorporating Fairness into Game Theory and Economics. Am. Econ. Rev. 1993, 83, 1281–1302. [Google Scholar]
- Charness, G.; Rabin, M. Understanding Social Preferences with Simple Tests. Q. J. Econ. 2002, 117, 817–869. [Google Scholar] [CrossRef] [Green Version]
- Dufwenberg, M.; Kirchsteiger, G. A Theory of Sequential Reciprocity. Games Econ. Behav. 2004, 47, 268–298. [Google Scholar] [CrossRef]
- Falk, A.; Fischbacher, U. A Theory of Reciprocity. Games Econ. Behav. 2006, 54, 293–315. [Google Scholar] [CrossRef]
- Danneberg, A.; Reichmann, T.; Sturm, B.; Vogt, C. Inequality Aversion and Individual Behavior in Public Good Games: An Experimental Investigation. ZEW Discuss. Pap. 2007. [Google Scholar] [CrossRef]
- Bolton, G.E.; Ockenfels, A. ERC: A theory of equity, reciprocity, and competition. Am. Econ. Rev. 2000, 90, 166–193. [Google Scholar] [CrossRef]
- Pratt, J.M. Risk Aversion in the Small and in the Large. Econometrica 1964, 32, 122–136. [Google Scholar] [CrossRef]
- World Value Survey: WVS 2005 Questionnaire. Available online: http://www.worldvaluessurvey.org/WVSDocumentationWV5.jsp (accessed on 27 April 2018).
- Fischbacher, U. Z-Tree Zurich Toolbox for ready-made Economic Experiments. Exp. Econ. 2007, 10, 171–178. [Google Scholar] [CrossRef]
- Greiner, B. Subject Pool Recruitment Procedures: Organizing Experiments with ORSEE. J. Econ. Sci. Assoc. 2015, 1, 114–125. [Google Scholar] [CrossRef]
- Brier, G. Verification of forecasts expressed in terms of probability. Month. Weather Rev. 1950, 78, 1–3. [Google Scholar] [CrossRef]
- Offerman, T.; Sonnemans, J.; van de Kuilen, G.; Wakker, P. A Truth Serum for Non-Bayesians: Correcting Proper Scoring Rules for Risk Attitudes. Rev. Econ. Stud. 2009, 76, 1461–1489. [Google Scholar] [CrossRef] [Green Version]
- Holt, C.A.; Laury, S.K. Risk Aversion and Incentive Effects. Am. Econ. Rev. 2002, 92, 1644–1655. [Google Scholar] [CrossRef] [Green Version]
- Brandstätter, H. Sechzehn Persönlichkeits-Adjektivskalen (16 PA) als Forschungsinstrument anstelle des 16 PF. Z. Exp. Angew. Psychol. 1988, 25, 370–391. [Google Scholar]
- Maniadis, Z.; Tufano, F.; List, J.A. One Swallow Doesn’t Make a Summer: New Evidence on Anchoring Effects. Am. Econ. Rev. 2014, 104, 277–290. [Google Scholar] [CrossRef]
- Cohen, J. Statistical Power Analysis for the Behavioral Sciences, 2nd ed.; Lawrence Erlbaum: Hillsdale, NJ, USA, 1988. [Google Scholar]
- Cox, J.C. Trust and reciprocity: Implications of game triads and social contexts. N. Z. Econ. Pap. 2009, 43, 89–104. [Google Scholar] [CrossRef]
- Chaudhuri, A.; Ali Khan, S.; Lakshmiratan, A.; Py, A.-L.; Shah, L. Trust and trustworthiness in a sequential bargaining game. J. Behav. Decis. Mak. 2003, 16, 331–340. [Google Scholar] [CrossRef] [Green Version]
- Chaudhuri, A.; Gangadharan, L. An Experimental Analysis of Trust and Trustworthiness. South. Econ. J. 2007, 73, 959–985. [Google Scholar]
- Dasgupta, U.; Menon, A. Trust and Trustworthiness among Economics Majors. Econ. Bull. 2011, 31, 2799–2815. [Google Scholar]
| 1 | |
| 2 | Fonseca et al. (2006a) [7], (2006b) [8] and Huck et al. (2002) [9] study duopoly games with endogenous timing. Firms can choose their quantities in one of two periods. Potters et al. (2005) [10] study a public good game with endogenous sequencing when some donors do not know the value of the public good. Nosenzo and Sefton (2009) [11] study a public good game with endogenous move structure. Players can choose their contribution in one of two periods. Furthermore players receive different returns of the public good. |
| 3 | |
| 4 | We refer to this as two treatments even though the distinction was not implemented exogenously by us as experimenters but endogenously by the player’s sequencing choice. However, it is advantageous to discriminate and label this as two experimental conditions since all empirical analyses will be done conditional on this distinction. The same applies to other cases of endogenous sequencing. |
| 5 | Investors with the same degree of constant relative risk aversion invest the same share of wealth into risky assets. Thus, a rich player invests a larger absolute amount into a risky asset than a poor player (see Pratt (1964) [25]). |
| 6 | The participants had to state probabilities for each possible backtransfer. Using these responses we calculated the expected backtransfer and paid the participants based on the squared difference between expected and received payoff. The Quadratic Scoring Rule was introduced by Brier (1950) [29]. For a methodological discussion of this and other scoring rules see Offerman et al. (2009) [30]. |
| 7 | The question is: Generally speaking, would you say that most people can be trusted or that you need to be very careful in dealing with people? Participants may answer “yes” or “no”. |
| 8 | An average earning for a student job at the time of the experiment was about 8 EUR per hour. |
| 9 | A Binomial test for the frequency of voluntary leadership by the rich player versus voluntary leadership under equal endowments also supports this (p < 0.001, n = 176). |
| 10 | We also estimated this and all the other models reported in the paper with median regression in order to check for robustness. All of the effects were qualitatively the same as those of the Tobit regressions. |
| 11 | In all tests we report p-values for two-tailed tests. The values may be adjusted for our directional hypotheses. |
| 12 | |
| 13 | To save on notation, we simply formulate hypotheses using variable names instead of coefficients of these variables. |
| 14 | Hypothesis 1.a is also supported by a Mann-Whitney U-test (MWU) when comparing the backtransfer y between the two treatments HighEndoHighLow and Mid1EndoMid1Mid2 (p < 0.003, n = 55). Maniadis [33] et al. consider the problem of false positives and present a model of the post-study probability of a result which hinges among other things on the power of individual studies. Therefore, for our Hypothesis 1 to 4, we report post-hoc measures of statistical power in addition to the p-values of statistical tests. Regarding Hypothesis 1.a we get a power value of 0.88 for a simple two-sample t-test (two-sided) for a value of Cohen’s d of 0.949 (Cohen [34]) and assuming a significance level α = 0.05. This is a more conservative calculation of power than one based on the regression model since the two-sample t-test relies on the sample sizes of the two-treatments rather than all treatments. To calculate power values we use the R Package pwr, Version 1.2-2, which refers to Cohen [34]. |
| 15 | This effect is also significant according to MWU-tests of backtransfer: ExoLowHigh vs. ExoMidMid (p < 0.006, n = 39), ExoLowHigh vs. ExoHighLow (p < 0.003, n = 46). The power of a two-sample, two-sided t-test is 0.854 (Cohen’s d = 0.991, α = 0.05) for the test ExoLowHigh vs. ExoMidMid. The power is 0.910 (Cohen’s d = 1.011, α = 0.05) for the test ExoLowHigh vs. ExoHighLow. |
| 16 | MWU-tests of backtransfer: HighEndoLowHigh vs. Mid1EndoMid2Mid1 (n.s., n = 123), HighEndoLowHigh vs. LowEndoHighLow (p = 0.036, n = 103). |
| 17 | Specifically, Alpha-High and Beta-High are 0/1-dummies for above-median values of the respective parameter conditional on the respective parameter being relevant. E.g., Alpha-High is equal to 1 when the second mover is poor and his/her value of α is above median. Alpha-High is equal to 0 when the value is below median (or missing/inconsistent) or if the second mover is rich. When endowments are equal unfavorable inequality aversion is relevant if investment is zero. Similar definitions apply to the variables Beta-High, Alpha-Missing, and Beta-Missing. E.g., Alpha-Missing is equal to 1 only when unfavorable inequality aversion is relevant and α is missing (incomplete or inconsistent measurement); otherwise, it is zero. When endowments are equal favorable inequality aversion is relevant if investment is greater than zero. |
| 18 | Note that in Table 5 all the estimated treatment coefficients are negative while they are all positive in Table 6. This should not be confusing because it simply comes from the change in the reference category. In Table 5 the reference category is Mid1EndoMid1Mid2 since this is the relevant category according to the main Hypothesis 1.b. In Table 6, we cannot use this reference category since Table 6 uses only asymmetric treatments. Here, we choose the treatment with the lowest investment (HighEndoLowHigh) as reference category. |
| 19 | The effect is also supported by a MWU-test of investment in treatments HighEndoHighLow vs. Mid1EndoMid1Mid2 (p < 0.009, n = 55). The power of a two-sample, two-sided t-test is 0.801 (Cohen’s d = 0.848, α = 0.05). |
| 20 | Also a Spearman rank correlation is highly significant: ρ = 0.67, p < 0.001, n = 202). The power of a two-sided correlation test (Pearson correlation) is 1 (α = 0.05). |
| 21 | As in the analysis of backtransfer the influence of Alpha-High, Beta-High, Alpha-Missing, Beta-Missing are measured for relevant conditions. E.g., Alpha-High is relevant when the first mover is poor or equally endowed. |
| 22 | While we think that expectations cause backtransfer, we agree to the comment of an anonymous referee that the reversed causality is possible if players exhibit a false consensus effect. In this case players who intend to choose high backtransfer will develop high expectations. |
| 23 | In these cases unfavorable inequality aversion is relevant. |
| 24 | In these cases favorable inequality aversion is relevant. |

Table 1.
Game Variants and Treatment Labels.
| Endogenous/Exogenous Sequencing | Treatment Label | Asymmetric/Symmetric Endowments |
|---|---|---|
| Endogenous Sequencing “Voluntary Leadership” | HighEndoHighLow | asymmetric |
| Mid1EndoMid1Mid2 | symmetric | |
| LowEndoLowHigh | asymmetric | |
| Endogenous Sequencing “Delegation of Responsibility” | HighEndoLowHigh | asymmetric |
| Mid1EndoMid2Mid1 | symmetric | |
| LowEndoHighLow | asymmetric | |
| Exogenous Sequencing | ExoHighLow | asymmetric |
| ExoMidMid | symmetric | |
| ExoLowHigh | asymmetric |
Table 2.
Summary Statistics: Mean (Standard Deviation).
| Sequencing | Treatment | Investment x | Expected Backtransfer | Backtransfer | Backtransfer Rate y/x | # Obs. |
|---|---|---|---|---|---|---|
| Voluntary Leadership | HighEndoHighLow | 6.84 (3.03) | 5.06 (1.90) | 4.95 (3.49) | 0.82 (0.73) | 39 |
| Mid1EndoMid1Mid2 | 9.13 (1.50) | - | 8.06 (2.70) | 0.89 (0.26) | 16 | |
| LowEndoLowHigh | 6.71 (2.84) | 5.40 (2.15) | 6.07 (2.99) | 1.01 (0.46) | 14 | |
| Delegation of Responsibility | HighEndoLowHigh | 4.94 (3.30) | 4.53 (2.08) | 5.39 (3.42) | 1.38 (1.16) | 57 |
| Mid1EndoMid2Mid1 | 6.83 (3.09) | - | 5.19 (3.09) | 0.88 (0.64) | 64 | |
| LowEndoHighLow | 6.13 (3.53) | 4.20 (2.59) | 3.96 (3.42) | 0.89 (1.39) | 46 | |
| Exogenous Sequencing | ExoHighLow | 6.70 (2.74) | 4.59 (1.72) | 4.19 (2.84) | 0.66 (0.39) | 27 |
| ExoMidMid | 5.40 (2.76) | - | 4.10 (3.09) | 0.94 (0.86) | 20 | |
| ExoLowHigh | 5.53 (3.20) | 4.71 (1.75) | 7.16 (3.08) | 1.57 (1.12) | 19 |
Notes: Table 2 includes mean and standard deviation of investment, backtransfer and backtransfer rate by treatment. Expected backtransfer is only elicited in asymmetric treatments.
Table 3.
Summary Statistics: Median (Interquartile Range).
| Sequencing | Treatment | Investment x | Expected Backtransfer | Backtransfer | Backtransfer Rate y/x | # Obs. |
|---|---|---|---|---|---|---|
| Voluntary Leadership | HighEndoHighLow | 7.0 (5.0) | 5.0 (2.01) | 5.0 (6.0) | 0.8 (0.5) | 39 |
| Mid1EndoMid1Mid2 | 10.0 (2.0) | - | 9.0 (3.0) | 1.00 (0.17) | 16 | |
| LowEndoLowHigh | 5.5 (5.0) | 5.0 (2.88) | 6.0 (3.0) | 1.0 (0.2) | 14 | |
| Delegation of Responsibility | HighEndoLowHigh | 5.0 (6.0) | 4.78 (2.88) | 5 (6) | 1.0 (0.5) | 57 |
| Mid1EndoMid2Mid1 | 7.5 (5.75) | - | 5.0 (4.75) | 1.00 (0.50) | 64 | |
| LowEndoHighLow | 6.5 (7.0) | 4.14 (2.87) | 3.0 (5.0) | 0.8 (0.8) | 46 | |
| Exogenous Sequencing | ExoHighLow | 7.0 (5.0) | 4.63 (1.31) | 4.0 (6.0) | 0.66 (0.57) | 27 |
| ExoMidMid | 5.0 (5.0) | - | 3.0 (4.0) | 0.67 (0.57) | 20 | |
| ExoLowHigh | 5.0 (7.0) | 4.55 (1.97) | 9.0 (5.0) | 1.2 (1.33) | 19 |
Notes: Table 3 includes median and inter-quartile range of investment, backtransfer and backtransfer rate by treatment. Expected backtransfer is only elicited in asymmetric treatments.
Table 4.
Tobit Regression of Backtransfer (reference category for treatment is Mid1EndoMid1Mid2).
| Variable | Coefficient | Std. Error | p-Value (Two-Tailed) |
|---|---|---|---|
| Investment | 0.660 | 0.072 | <0.001 |
| HighEndoHighLow | −2.119 | 1.222 | 0.084 |
| LowEndoLowHigh | −1.405 | 1.378 | 0.309 |
| ExoHighLow | −2.663 | 1.243 | 0.033 |
| ExoMidMid | −2.648 | 1.272 | 0.038 |
| ExoLowHigh | 1.353 | 1.320 | 0.306 |
| LowEndoHighLow | −2.864 | 1.221 | 0.020 |
| Mid1EndoMid2Mid1 | −2.268 | 1.072 | 0.035 |
| HighEndoLowHigh | −0.432 | 1.115 | 0.698 |
| Alpha | 1.857 | 0.797 | 0.020 |
| Alpha-Missing | −2.230 | 1.126 | 0.049 |
| Beta | 1.582 | 0.597 | 0.008 |
| Beta-Missing | 0.702 | 0.784 | 0.371 |
| Constant | 2.302 | 1.213 | 0.059 |
| Number of Observations | 302 | ||
| Pseudo R2 | 0.085 |
Table 5.
Tobit Regression of Investment (reference category for treatment is Mid1EndoMid1Mid2).
| Variable | Coefficient | Std. Error | p-Value (Two-Tailed) |
|---|---|---|---|
| HighEndoHighLow | −5.190 | 1.567 | 0.001 |
| LowEndoLowHigh | −5.383 | 1.742 | 0.002 |
| ExoHighLow | −5.682 | 1.603 | <0.001 |
| ExoMidMid | −6.302 | 1.576 | <0.001 |
| ExoLowHigh | −6.110 | 1.601 | <0.001 |
| LowEndoHighLow | −5.958 | 1.514 | <0.001 |
| Mid1EndoMid2Mid1 | −4.774 | 1.389 | 0.001 |
| HighEndoLowHigh | −7.396 | 1.400 | <0.001 |
| Alpha | −1.524 | 0.692 | 0.028 |
| Alpha-Missing | −1.260 | 0.989 | 0.204 |
| Beta | 0.374 | 0.872 | 0.668 |
| Beta-Missing | −0.861 | 1.255 | 0.493 |
| Male | 2.502 | 0.543 | <0.001 |
| Constant | 12.160 | 1.319 | <0.001 |
| Number of Observations | 302 | ||
| Pseudo R2 | 0.044 |
Table 6.
Tobit Regression of Investment (data for asymmetric endowments only; reference treatment is HighEndoLowHigh).
Table 6.
Tobit Regression of Investment (data for asymmetric endowments only; reference treatment is HighEndoLowHigh).
| Variable | Coefficient | Std. Error | p-Value (Two-Tailed) |
|---|---|---|---|
| HighEndoHighLow | 1.389 | 0.790 | 0.080 |
| LowEndoLowHigh | 1.079 | 0.965 | 0.265 |
| ExoHighLow | 1.649 | 0.820 | 0.046 |
| ExoLowHigh | 0.847 | 0.835 | 0.312 |
| LowEndoHighLow | 2.033 | 0.746 | 0.007 |
| Alpha | −1.471 | 0.716 | 0.041 |
| Alpha-Missing | −2.050 | 1.179 | 0.084 |
| Beta | −0.152 | 0.645 | 0.814 |
| Beta-Missing | −0.354 | 0.973 | 0.707 |
| Male | 1.346 | 0.485 | 0.006 |
| Expected-Backtransfer | 1.483 | 0.128 | <0.001 |
| Constant | −1.441 | 0.734 | 0.051 |
| Number of Observations | 202 | ||
| Pseudo R² | 0.164 |
© 2018 by the authors. Licensee MDPI, Basel, Switzerland. This article is an open access article distributed under the terms and conditions of the Creative Commons Attribution (CC BY) license (http://creativecommons.org/licenses/by/4.0/).
Share and Cite
MDPI and ACS Style
Kleine, F.; Königstein, M.; Rozsnyói, B. Voluntary Leadership and Asymmetric Endowments in the Investment Game. Games 2018, 9, 51. https://doi.org/10.3390/g9030051
AMA Style
Kleine F, Königstein M, Rozsnyói B. Voluntary Leadership and Asymmetric Endowments in the Investment Game. Games. 2018; 9(3):51. https://doi.org/10.3390/g9030051
Chicago/Turabian StyleKleine, Fabian, Manfred Königstein, and Balázs Rozsnyói. 2018. "Voluntary Leadership and Asymmetric Endowments in the Investment Game" Games 9, no. 3: 51. https://doi.org/10.3390/g9030051
Note that from the first issue of 2016, this journal uses article numbers instead of page numbers. See further details here.