Incentive Magnitude Effects in Experimental Games: Bigger is not Necessarily Better


1
Department of Neuroscience, Psychology and Behaviour, University of Leicester, Leicester LE1 7RH, UK
2
Department of Economics, University of Warwick, Coventry CV4 7AL, UK
*
Author to whom correspondence should be addressed.
Games 2018, 9(1), 4; https://doi.org/10.3390/g9010004
Submission received: 10 November 2017
/
Revised: 29 December 2017
/
Accepted: 11 January 2018
/
Published: 18 January 2018
Abstract
:In experimental games, task-related incentives are payments to experimental subjects that vary according to their strategy choices and the consequent outcomes of the games. Limited evidence exists regarding incentive magnitude effects in experimental games. We examined one-off strategy choices and self-reported reasons for choices in eight 3 × 3 and four 4 × 4 normal-form games under task-related incentives of conventional magnitude and compared them with choices and reasons in the same games under incentives five times as large. Both strategy choices and self-reported reasons for choices were almost indistinguishable between the two conditions. These results are in line with earlier findings on individual decision making and with a parametric model, in which the incentive elasticity of effort is very small when compared with other factors, such as the complexity of the decision problem.
Keywords:
capital-labor-production framework; crowding out; experimental games; incentives; incentive elasticity of effort; reasons for choicesJEL Classification:
C72; C90; C91; C92; J331. Introduction
The first experimental study of the Prisoner’s Dilemma game, published originally as a Rand Corporation Research Memorandum [1], and later, slightly abbreviated, as a journal article [2], included small financial incentives associated with the payoffs to motivate the players’ strategy choices. The payoffs in the game ranged from −1 to +2, and these were converted into pennies (US cents) after 100 repetitions of the game. This was the first published experimental game of any kind, apart from an experimental market study of Chamberlin [3]. Most of the experimental games that were published from that time until the late 1980s were performed by psychologists, and few of them included task-related financial incentives [4,5]. Subjects were often incentivized to participate by being offered flat-rate show-up fees or course credits, but the payoffs for which they played in the experimental games were in most cases simply notional points or imaginary money.
The growth of experimental economics in the 1970s was accompanied by the introduction of substantial task-related financial incentives in the vast majority of experiments published in economics journals, and the issue of incentives has continued to divide psychologists and economists. While experiments can be traced back to the 1940s, it might be said that the formalization of principles and “best practice” was not well articulated until the 1970s and 1980s, with Smith’s paper [6], often cited as an influential flagship contribution in this respect. An increasing number of psychologists favor incentives, and while some psychologists and economists, notably [7,8], have raised questions about whether they are always necessary or even desirable, it is nevertheless the case that literally every experimental article published in the American Economic Review from 1970 to 1997 included task-related financial incentives [9] (p. 31), whereas only 26% of those published in the more psychologically oriented Journal of Behavioral Decision Making between 1988 and 1997, included them [10] (p. 391).
A general consensus has evolved in economics, as a consequence of which experiments on both individual and interactive decision making are very difficult to publish in economics journals unless they include substantial financial incentives [11] (Chapter 6). However, there is no consensus about the necessary or desirable magnitudes of those incentives. According to the influential capital-labor-production framework of Camerer and Hogarth, an extended version of the simpler labor theory of Smith and Walker [12], “experimental subjects do not work for free and work harder, more persistently, and more effectively, if they earn more money for better performance” [9] (p. 7). This seems to imply that, when it comes to incentive payments, bigger is better. In terms of this framework, a subject in an experiment applies costly effort (cognitive labor) and brings expertise or procedural knowledge (cognitive capital) to the performance of the experimental task (production). Camerer and Hogarth acknowledge that “ultimately, the effect of incentives is an empirical question” [9] (p. 8). However, investigating these effects is not straightforward, because task performance is generally difficult to measure. Most of the 74 experimental studies reviewed by Camerer and Hogarth showed no effect on mean performance of increased task-related incentives, and where incentive magnitude effects were found, they were most often simply reductions in the variance of responses rather than increased or improved performance.
Some production tasks have the property that increased effort does generally improve performance, and evidence from studies of such tasks suggests that subjects appear to work harder if they are incentivized than if they are not; but provided that they are paid something, the magnitudes of the incentives do not seem to make any difference. For example, Libby and Lipe [13] provided experimental evidence of a 21% step increase in total time allocated to accounting judgment tasks in subjects paid task-related incentives plus flat-rate show-up fees when compared to those paid flat-rate show-up fees only. In the light of this and similar studies, Camerer and Hogarth [9] concluded from their review that when effects of task-related incentives on cognitive effort are found, they appear to differentiate zero incentives from positive incentives; but once some level of task-related reward exists, “raising incentives from some modest level L to a higher level H is more likely to have no effect” (p. 21). According to Bardsley et al. [11], “The message seems to be that in terms of the impact on cognitive effort allocation, the presence of task related incentives matters more than their level” (p. 253). However, in more recent research, comparisons of incentivized and non-incentivized individual decisions have most often found no significant differences [14,15,16,17,18,19,20,21,22,23].
The effects of incentives are sometimes negative. There are circumstances in which financial incentives have the effect of “crowding out” intrinsic motivation. For example, Gneezy and Rustichini [24] reported an experiment using a psychometric task in which subjects were randomly assigned to four incentive treatment conditions: no payment, low payment, medium payment, and high payment. In the conditions in which some payment was made, higher payment elicited better performance; but subjects who were offered no financial incentives performed significantly better than those who were paid. According to the researchers, “we may conclude that the monetary compensation produces a reduction in the performance” (p. 802). This suggests that extrinsic rewards can undermine or crowd out intrinsic motivation, an idea first suggested by Deci [25]. In one of Deci’s key experiments, undergraduate students were either paid or not paid to work for a certain time on an interesting puzzle. In a later unrewarded “free-time” period, subjects in the no-reward condition played with the puzzle significantly more than those who were paid, and the unrewarded subjects also reported a greater interest in the task. This effect has been replicated many times, and a meta-analysis [26] suggests that the phenomenon is fairly widespread (see also [27]).
The effects of incentive magnitude, even in individual decision making, are evidently not well understood. Furthermore, a Web of Science search suggests that only a few studies have investigated such effects in interactive decisions or games. For example, both cooperation and punishment were studied in a one-shot public goods experiment and neither were affected by stake size [28]. Amir, Rand, and Gal [29] studied four types of games (Dictator Game, Trust Game, Ultimatum Game, and Public Goods Game), and concluded that $1 stakes produced results that were consistent with those when there were no stakes, and that the results from online experiments were consistent with those from in-person testing sessions. Karagözoğlu and Urhan [30] recently reviewed the evidence on incentive magnitude effects in bargaining and distribution games and found only a small number of studies, mostly focused on the Ultimatum game, which had investigated such effects in games. They concluded that the number of published studies is not sufficient to justify any definite conclusions regarding incentive effects in games and that the existing findings do not provide any clear or consistent picture, at least for that class of games. The limited number of experimental normal-form games included in the earlier reviews of Smith and Walker [12] and Camerer and Hogarth [9] do not clarify the picture greatly for games of the type investigated in the experiment reported below.
Our experiment was designed to provide much-needed rigorous evidence on incentive magnitude effects of task-related payments in standard normal-form games. Our focus is on twelve experimental games reported by Colman, Pulford, and Lawrence [31] that were designed to disentangle cognitive hierarchy [32], team reasoning [33,34,35], and strong Stackelberg [31] theories in games without obvious, payoff-dominant solutions. The patterns of strategic choice in that study, and the reasons given by players for the choices they made, appeared to suggest that relatively low-effort thinking (simple heuristics and Level-1 cognitive hierarchy strategies) accounted for rather more behavior than more deliberative higher-level reasoning. One possible explanation for this is that the incentives in the Colman et al. [31] study were insufficient to induce the effort involved in greater deliberation. To examine that possibility, in the present study subjects were randomly assigned to treatment conditions in which they were incentivized with task-related payments either of the original magnitude or else five times larger. In all other respects, the two treatment conditions were identical. In both conditions, subjects made one-off strategy choices in the same range of 3 × 3 and 4 × 4 games. We compared the strategy choices of subjects in the two conditions to determine whether incentive magnitude had any significant effects on strategy choices, and we also compared their self-reported reasons for their choices.
2. Materials and Methods
2.1. Subjects
The subjects were 94 students and employees at the University of Leicester (55 female, 39 male), aged 18–54 years (M = 27.68, SD = 9.72) recruited from the School of Psychology’s subject panel and the university’s weekly online newsletter, an approximate sample size of 40 for each condition having been determined in advance. These 94 were to participate in the role of Player 1. A further 19 subjects were recruited to play the role of Player 2 in each condition in order to avoid deception and to enable calculations of payoffs for subjects in the role of Player 1. (Data from subjects in the role of Player 2 were too few to be included in the analyses reported in this article.) Participants were randomly allocated to conditions irrespective of whether they were students or employees of the university and all volunteered to take part. The average age of subjects in the control group (M = 27.21 years, SD = 9.99) did not differ from those in the experimental group (M = 28.15 years, SD = 9.52), t(92) = 0.465, p = 0.64. All of the subjects gave their informed consent before they participated in the study. The study was conducted in accordance with the Declaration of Helsinki, and the protocol was approved by the University of Leicester Psychology Research Ethics Committee (PREC) (identification code bdp5-f797).
We paid each subject a show-up fee of £3.00 (US $5.00) plus an additional amount, either up to £5.00 (US $8.60) or £25.00 (US $43.00), according to which condition they were assigned to and depending on how their decision in a single randomly selected game interacted with the strategy chosen by Player 2 in that game. We did not mention the show-up fee until the experiment was over since we wished them to focus upon the link between their decision and their earnings. The average incentive-linked payout in the control condition was £3.44 ($5.74) and £17.45 ($29.09) in the experimental condition (currency conversion rates at July 2014). The task-related incentives were implemented according to the random lottery incentive system, a technique that avoids problems that are associated with other incentive payment schemes [36] and that has been shown to elicit true preferences [37,38]. When collecting data from experimental subjects on multiple rounds it is effective to pay a subset of subjects, a subset of rounds, or both, to incentivize the subjects [39]. Accordingly, after one game was randomly selected at the end of an experimental session, each player was randomly matched with one of the players in the other role for the purpose of calculating their payoff in that game.
2.2. Design
We used a between-subjects design, with subjects randomly allocated to either a control or a ×5 experimental treatment condition. In the control condition, the payoffs in every game ranged from zero to 5. In the ×5 experimental condition, these payoffs were all multiplied by five. The subjects were told that, at the end of the session, the payoffs would be converted to pounds sterling for the game that was randomly selected for payment. In every other respect, subjects were treated identically in both conditions.
2.3. Materials
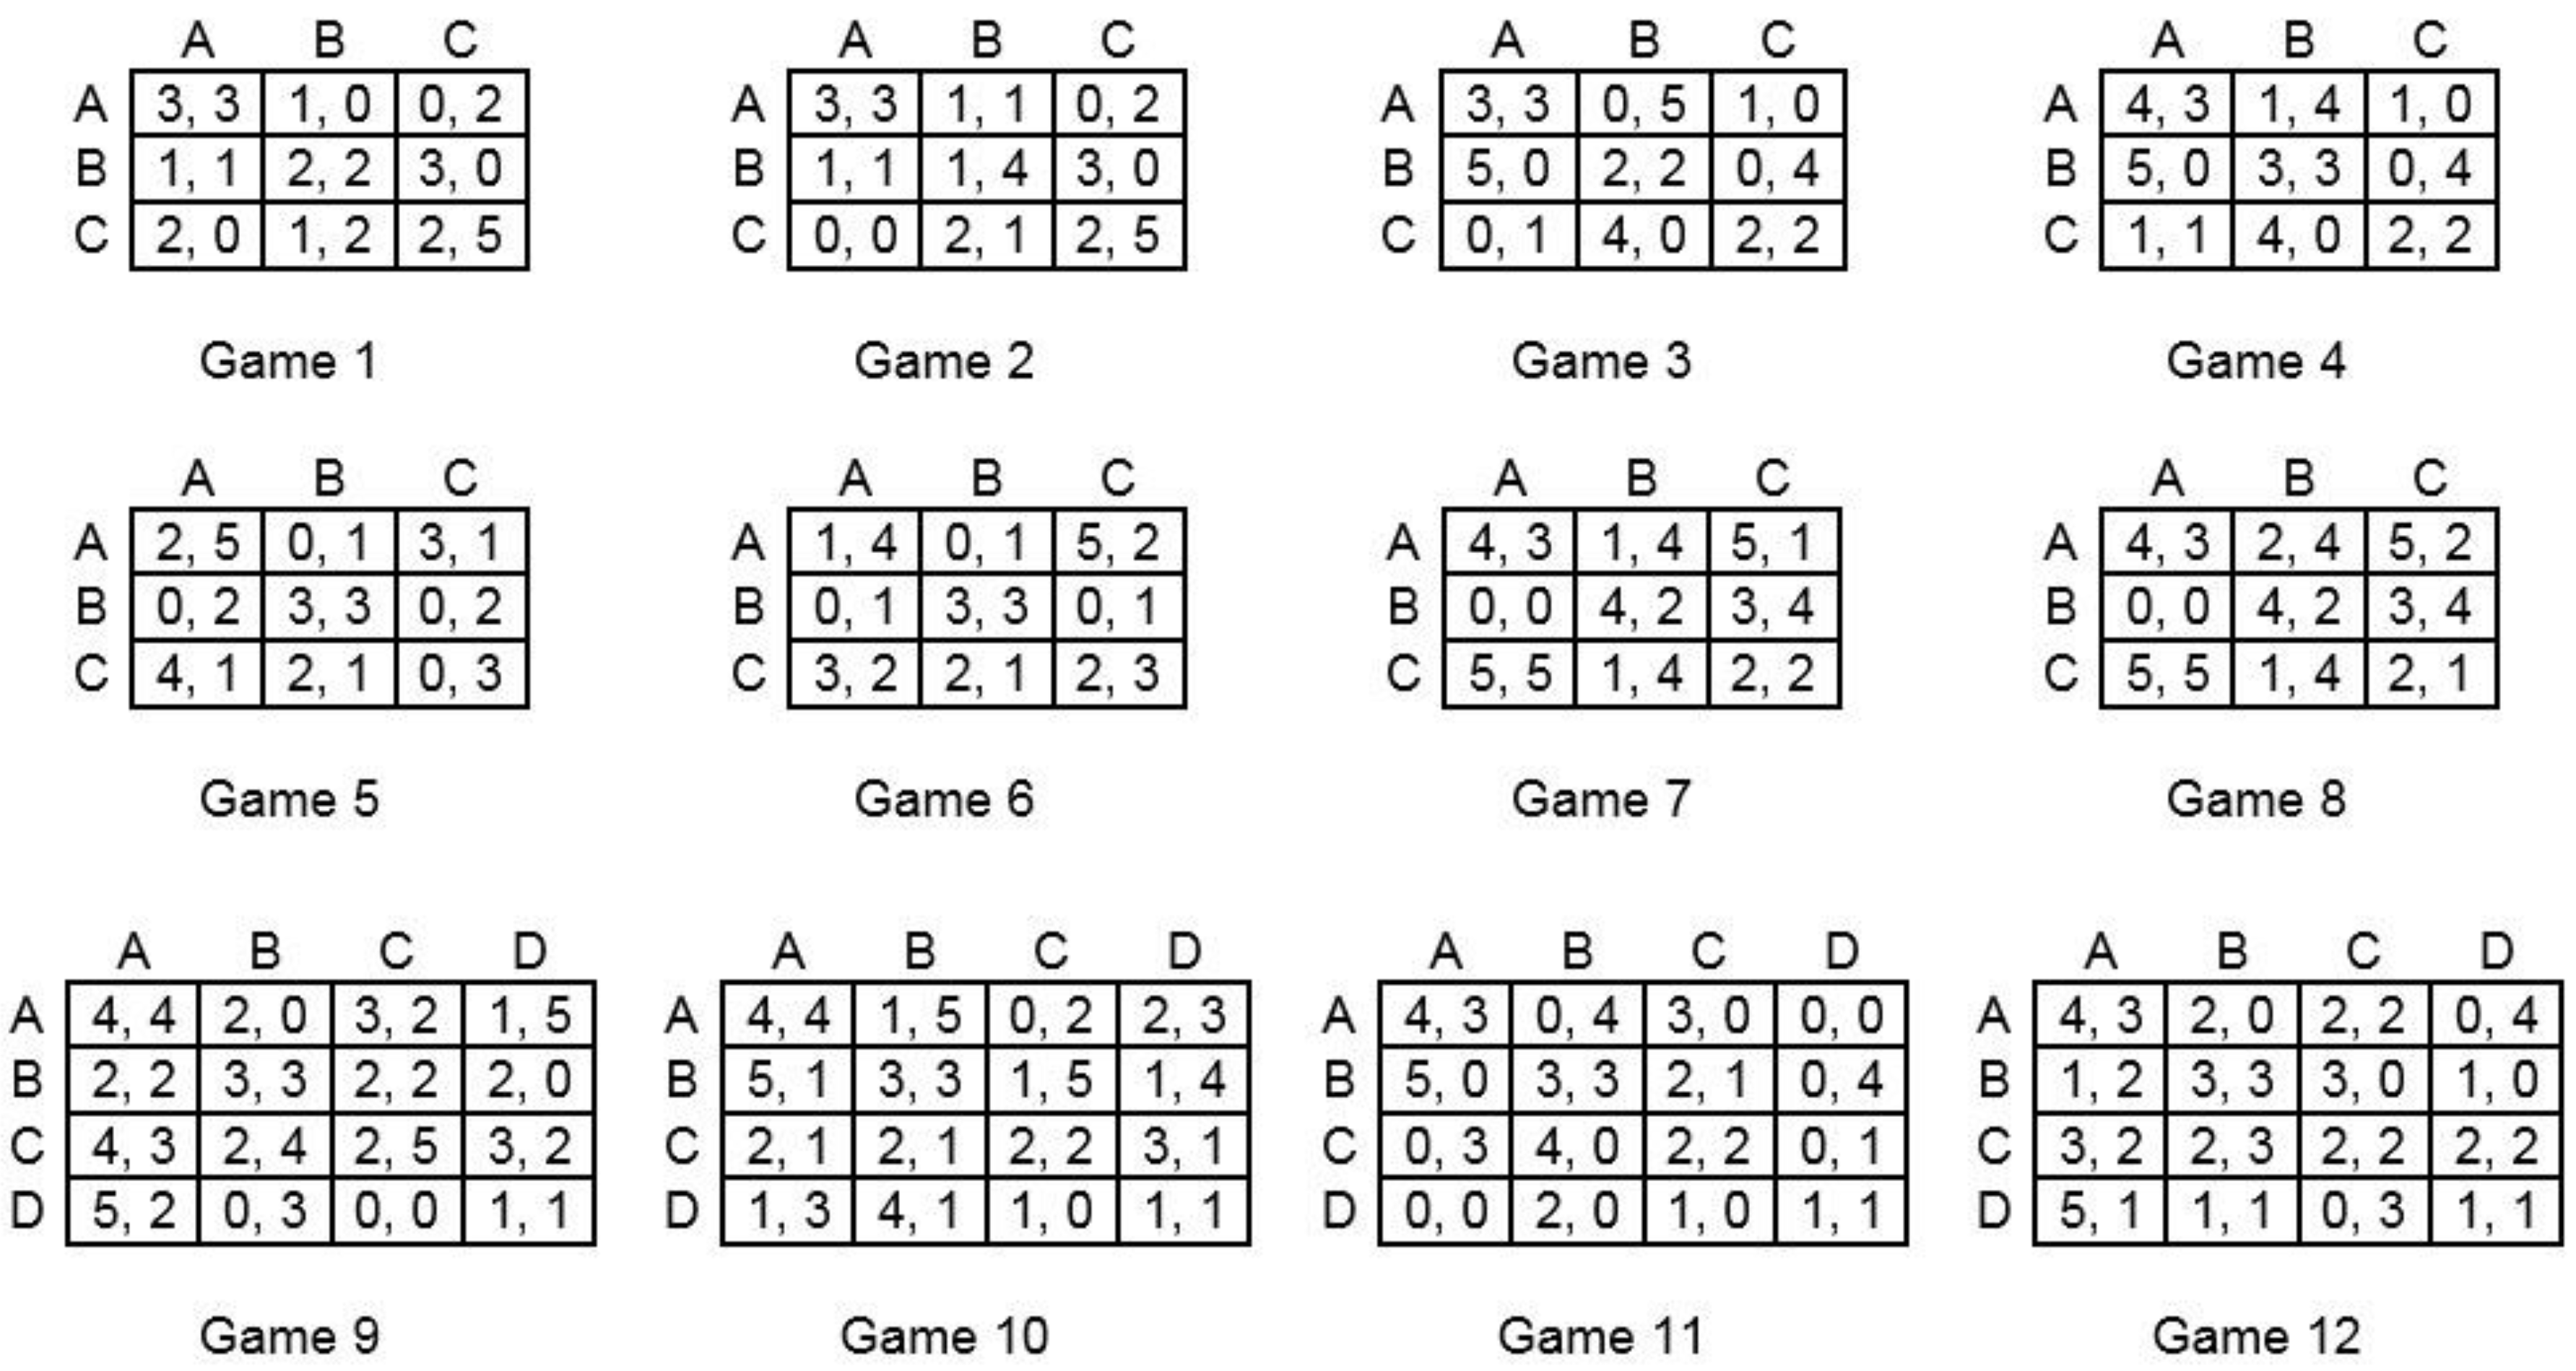
The experimental games used in the control condition were eight 3 × 3 and four 4 × 4 games originally used by Colman et al. [31]. The 12 games are displayed in Figure 1. They represent a diverse range of two-player normal-form games, extending considerably the range covered in earlier reviews [9,12,30], and there are no strongly or weakly dominant strategies in any game. Multiplying all the payoffs by 5 has no effect whatsoever on a game’s strategic properties. We did not drop any variables, conditions, or games from our analyses.
2.4. Procedure
The experiment was conducted over five 40-min testing sessions, with 20–25 subjects per session, approximately half being randomly allocated to the control condition and half to the ×5 experimental condition. The subjects sat at computer monitors and logged on to the SurveyGizmo website, where they read the following instructions. These were the same for both conditions, apart from adjustments to the payoff information.
You will be presented with a series of 12 grids. For some grids you will be asked to choose between A, B, and C, and for others you will be asked to choose between A, B, C, and D. The numbers in the grids represent pounds sterling (e.g., “5” = £5). You will be paired with another randomly selected participant in this room for each of your 12 decisions. In each case, the other participant will be presented with the identical grid and will also be choosing between A, B, and C, or A, B, C, and D. At the end of the experiment, one of the grids will be chosen randomly from the 12. The amount of money that you scored in that grid will be paid in cash at the end of today’s session. When you are making your choices, you will not know who you are paired with or what choices they are making. For each grid, please indicate your choice by selecting either A, B, C, or D.
The subjects were given the opportunity to ask questions (in practice, no one did), after which, the payoff matrices were presented in succession in a random order on their monitors, with Player 1’s labels and payoffs shown in blue and Player 2’s in red. In each session, at least one subject was assigned the role of Player 2 and was presented with the same games, but the instructions were slightly rewritten from the perspective of the red player.
For the subjects in the role of Player 1, the following text was displayed below each payoff matrix to help them interpret the game: “You are the Blue decision maker, choosing between the rows marked A, B, or C (or D). The person you have been paired with is the Red decision maker, choosing between columns A, B, or C (or D). Depending on what you and the other decision maker choose, you will get one of the blue payoffs, and the red decision maker will get one of the red payoffs.” Subjects thus knew that their choices were liable to impact their own and their co-player’s payoffs. A summary of the information shown in the payoff matrix was then presented, as follows (this example relates to Game 1 in the control condition):
- If you choose A, then:
- If Red chooses A, you will get 3, and Red will get 3
- If Red chooses B, you will get 1, and Red will get 0
- If Red chooses C, you will get 0, and Red will get 2
- (and so on …)
The subjects then made one-off strategy choices in each of the 12 games by clicking radio buttons marked A, B, C, or D. They were able to change their strategy choice at any time until they clicked Next. Returning to previous games was not possible and no feedback was provided before they progressed to the next game.
After the subjects had recorded their decisions for all 12 games, they were presented with a randomized list of ten possible reasons (see Table 1 that might have influenced their decisions, and they were asked to indicate on a seven-point Likert scale the extent to which they agreed or disagreed with each reason (Strongly disagree; Moderately disagree; Slightly disagree; Neutral; Slightly agree; Moderately agree; Strongly agree). The reasons were based on a qualitative pilot study [31] in which subjects had been asked to describe their reasons for choices in games similar to the ones used in the present study. Instructions to Subjects read: “Listed below are 10 possible reasons that may have influenced the decisions you made in choosing between A, B, C, and D in the decision task you have just completed. For each reason, please indicate to what extent you agree or disagree with the statement, taking into account all 12 decisions that you have just made.” These reasons for choices were asked at the end of all games because we (like Colman et al. [31]) did not want to influence subjects’ thinking and strategy use while they were playing the games.
Finally, one game was selected at random. Subjects were reminded of their strategy choice in that game, were informed what strategy the other player had chosen, and were then paid what they had earned in that game.
3. Results
3.1. Strategy Choices
Modal choices of players in all 12 experimental games are shown in Table 2, together with unique predictions of Player 1’s strategy choices for cognitive hierarchy theory Level-1 and Level-2 reasoning, strong Stackelberg reasoning, and team reasoning. (Raw data are supplied as Supplementary Materials). The modal response for each group was identical in six of the eight 3 × 3 games (2, 3, 4, 6, 7, 8), and in all four of the 4 × 4 games (9, 10, 11, and 12). The modal choice of the control group was identical to that found by Colman et al. [31] in all but game 9.
3.2. Multiplying Payoffs by 5
The choices of the subjects in the two treatment conditions, split by game number, are shown in Table 3. Results of all 12 Condition × Choice chi-square tests were non-significant. The similarity between the control and the ×5 experimental conditions is striking in every game. Substantial increases in the magnitude of task-related incentive payments did not significantly alter the distribution of players’ strategy choices in any of the games.
Results of the analysis of self-reported reasons for choices are presented Table 1. For nine out of ten of the reasons, subjects’ responses showed no significant differences between the two treatment conditions (all p > 0.05). Only in Question 8 did the control group agree significantly more strongly than the ×5 experimental group that they used the heuristic of aiming for the highest number in the grid, t(92) = 2.931, p = 0.004, d = 0.581. If this is a meaningful result, then it could be explained by the fact that payoffs in the ×5 versions of the games are all more appealing than in the control condition, and thus the highest (maximax) may be less of a focal point in the environment of such attractive alternative payoffs.
4. Discussion
The results of this experiment help to fill a gap arising from the fact that there is limited published evidence on incentive magnitude effects in experimental games. Karagözoğlu and Urhan [30] attempted to review the relevant literature on bargaining and distribution games, but found few relevant studies, except on the Ultimatum game. Our findings provide no evidence of incentive magnitude effects in a wide range of normal-form experimental games. This corroborates a conclusion of Camerer and Hogarth [9] from their review, and most subsequent studies of individual decision making, that have also failed to find evidence of such incentive effects.
The magnitude of the incentives in our control condition were roughly in line with typical payments for experiments in our laboratory and are generally considered to be adequate to motivate thoughtful participation. The payoffs in the ×5 experimental condition were very much larger than our subjects are accustomed to or than they expect. The manipulation of the independent variable left all strategic aspects of the games (Nash equilibria, Stackelberg strategies, strategic dominance, payoff dominance, and so on) unchanged, and, from a game-theoretic point of view, should not affect strategy choices. There is certainly little evidence that incentive magnitude influenced strategy choices in our experiment, and the analysis of self-reported reasons for choices suggests that the incentive manipulation hardly influenced the way players thought about the games. How subjects’ emotions are influenced by incentives was not something we studied, but this could be examined in future research on incentives in games, as recent research [40] has been shown in a power-to-take game (PTTG) that emotions and incentives interact.
A compelling interpretation of the non-significant incentive magnitude effects in our data and in many previous studies of individual decision making is provided by the results of an important study of risky individual choice [41]. Taking the capital-labor-production framework of Camerer and Hogarth [9] as a starting point, Moffatt used experimental data previously published by Hey [42] to estimate a fully parametric stochastic model of risky choice. In the model, the logarithm of decision time is used as a proxy measure of cognitive effort (labor) and it turns out that the monetary values of payoffs in risky choices have only a small positive effect on the amount of cognitive effort that subjects allocate to decision tasks. The incentive elasticity of effort is estimated to be +0.028, meaning that if incentives were doubled, then response times would be expected to increase by 2.8%, compared to almost 40% if task complexity were doubled. In other words, Moffatt’s parametric model suggests that the complexity of a decision task has vastly more effect than incentive magnitude on the amount of cognitive effort that decision makers allocate to the task.
5. Conclusions
We conclude that there is little evidence of any effect of incentive magnitude on strategy choices in normal-form 3 × 3 or 4 × 4 games, at least within the range of monetary values that were included in our experiment: from the level typically expected by subjects in our laboratory to payments five times as large. From our qualitative investigation of self-reported reasons for choices, we conclude that there is no evidence that incentive magnitude within this range has much influence on the way players think about these games. We believe that these findings are in line with far more numerous studies of incentive effects in individual decision making, and with a parametric model, in which the incentive elasticity of effort is very small when compared with other factors, such as the complexity of the decision problem.
Supplementary Materials
The following are available online at www.mdpi.com/2073-4336/9/1/4/s1: Database SI: Raw data.
Acknowledgments
We are grateful to the Economic and Social Research Council (Grant ES/K002201/1 to the third author) and the Leicester Judgment and Decision Making Endowment Fund (Grant RM43G0176 to the first and second authors) for support in the preparation of this article. We also thank Diana G. Pinto and Felix Kölle for research assistance on this project.
Author Contributions
Briony D. Pulford, Andrew M. Colman and Graham Loomes conceived and designed the experiments; Briony D. Pulford and Andrew M. Colman performed the experiments; Briony D. Pulford, Andrew M. Colman and Graham Loomes analyzed the data and wrote the paper.
Conflicts of Interest
The authors declare no conflict of interest.
References
- Flood, M.M. Some Experimental Games: Research Memorandum RM-789-1; The Rand Corporation: Santa Monica, CA, USA, 1952; Available online: https://www.rand.org/content/dam/rand/pubs/research_memoranda/2008/RM789-1.pdf (accessed on 8 January 2017).
- Flood, M.M. Some experimental games. Manag. Sci. 1958, 5, 5–26. [Google Scholar] [CrossRef]
- Chamberlin, E.H. An experimental imperfect market. J. Polit. Econ. 1948, 56, 95–108. [Google Scholar] [CrossRef]
- Balliet, D.; Mulder, L.B.; Van Lange, P.A.M. Reward, punishment, and cooperation: A meta-analysis. Psychol. Bull. 2011, 137, 594–615. [Google Scholar] [CrossRef] [PubMed]
- Pruitt, D.G.; Kimmel, M.J. Twenty years of experimental gaming: Critique, synthesis, and suggestions for the future. Ann. Rev. Psychol. 1977, 28, 363–392. [Google Scholar] [CrossRef]
- Smith, V.L. Experimental economics: Induced value theory. Am. Econ. Rev. 1976, 66, 274–279. [Google Scholar]
- Read, D. Monetary incentives, what are they good for? J. Econ. Methodol. 2005, 12, 265–276. [Google Scholar] [CrossRef]
- Rubinstein, A.A. A theorist’s view of experiments. Eur. Econ. Rev. 2001, 45, 615–628. [Google Scholar] [CrossRef]
- Camerer, C.F.; Hogarth, R.M. The effects of financial incentives in economic experiments: A review and capital-labor-production framework. J. Risk Uncertain. 1999, 19, 7–42. [Google Scholar] [CrossRef]
- Hertwig, R.; Ortmann, A. Experimental practices in economics: A methodological challenge for psychologists? Behav. Brain Sci. 2001, 24, 383–451. [Google Scholar] [CrossRef] [PubMed]
- Bardsley, N.; Cubitt, R.; Loomes, G.; Moffatt, P.; Starmer, C.; Sugden, R. Experimental Economics: Rethinking the Rules; Princeton University Press: Princeton, NJ, USA, 2010; ISBN 9781400831432. [Google Scholar]
- Smith, V.L.; Walker, J.M. Monetary rewards and decision costs in experimental economics. Econ. Inq. 1993, 31, 245–261. [Google Scholar] [CrossRef]
- Libby, R.; Lipe, M.G. Incentives, effort, and the cognitive processes involved in accounting-related judgments. J. Account. Res. 1992, 30, 249–273. [Google Scholar] [CrossRef]
- Abdellaoui, M.; Kemel, E. Eliciting prospect theory when consequences are measured in time units: “Time is not money”. Manag. Sci. 2014, 60, 1844–1859. [Google Scholar] [CrossRef]
- Bryan, S.; Jowett, S. Hypothetical versus real preferences: Results from an opportunistic field experiment. Health Econ. 2010, 19, 1502–1509. [Google Scholar] [CrossRef] [PubMed]
- Kemel, E.; Travers, M. Comparing attitudes towards time and money in experience-based decisions. Theory Decis. 2016, 80, 71–100. [Google Scholar] [CrossRef] [Green Version]
- Kühberger, A.; Schulte-Mecklenbeck, M.; Perner, J. Framing decisions: Hypothetical and real. Organ. Behav. Hum. Decis. Process. 2002, 89, 1162–1175. [Google Scholar] [CrossRef]
- Lagorio, C.H.; Madden, G.J. Delay discounting of real and hypothetical rewards III: Steady-state assessments, forced-choice trials, and all real rewards. Behav. Process. 2005, 69, 173–187. [Google Scholar] [CrossRef] [PubMed]
- Noussair, C.N.; Trautmann, S.T.; van de Kuilen, G. Higher order risk attitudes, demographics, and financial decisions. Rev. Econ. Stud. 2014, 81, 325–355. [Google Scholar] [CrossRef]
- Noussair, C.N.; Trautmann, S.T.; van de Kuilen, G.; Vellekoop, N. Risk aversion and religion. J. Risk Uncertain. 2013, 47, 165–183. [Google Scholar] [CrossRef]
- Rabin, M.; Weizsäcker, G. Narrow bracketing and dominated choices. Am. Econ. Rev. 2009, 99, 1508–1543. [Google Scholar] [CrossRef]
- Schunk, D.; Betsch, C. Explaining heterogeneity in utility functions by individual differences in decision modes. J. Econ. Psychol. 2006, 27, 386–401. [Google Scholar] [CrossRef]
- Von Gaudecker, H.-M.; van Soest, A.; Wengström, E. Heterogeneity in risky choice behavior in a broad population. Am. Econ. Rev. 2011, 101, 664–694. [Google Scholar] [CrossRef]
- Gneezy, U.; Rustichini, A. Pay enough or don’t pay at all. Q. J. Econ. 2000, 115, 791–810. [Google Scholar] [CrossRef]
- Deci, E.L. Effects of externally mediated rewards on intrinsic motivation. J. Pers. Soc. Psychol. 1971, 18, 105–115. [Google Scholar] [CrossRef]
- Deci, E.L.; Koestner, R.; Ryan, R.M. A meta-analytic review of experiments examining the effects of extrinsic rewards on intrinsic motivation. Psychol. Bull. 1999, 125, 627–668. [Google Scholar] [CrossRef] [PubMed]
- Bénabou, R.; Tirole, J. Intrinsic and extrinsic motivation. Rev. Econ. Stud. 2003, 70, 489–520. [Google Scholar] [CrossRef]
- Kocher, M.G.; Martinsson, P.; Visser, M. Does stake size matter for cooperation and punishment? Econ. Lett. 2008, 99, 508–511. [Google Scholar] [CrossRef]
- Amir, O.; Rand, D.G.; Gal, Y.G. Economic games on the internet: The effect of $1 stakes. PLoS ONE 2012, 7, e31461. [Google Scholar] [CrossRef] [PubMed] [Green Version]
- Karagözoğlu, E.; Urhan, U.B. The effect of stake size in experimental bargaining and distribution games: A survey. Group Decis. Negot. 2017, 26, 285–325. [Google Scholar] [CrossRef]
- Colman, A.M.; Pulford, B.D.; Lawrence, C.L. Explaining strategic coordination: Cognitive hierarchy theory, strong Stackelberg reasoning, and team reasoning. Decision 2014, 1, 35–58. [Google Scholar] [CrossRef]
- Camerer, C.F.; Ho, T.-H.; Chong, J.-K. A cognitive hierarchy model of games. Q. J. Econ. 2004, 119, 861–898. [Google Scholar] [CrossRef]
- Bacharach, M. Interactive team reasoning: A contribution to the theory of co-operation. Res. Econ. 1999, 53, 117–147. [Google Scholar] [CrossRef]
- Colman, A.M.; Pulford, B.D.; Rose, J. Collective rationality in interactive decisions: Evidence for team reasoning. Acta Psychol. 2008, 128, 387–397. [Google Scholar] [CrossRef] [PubMed]
- Sugden, R. Thinking as a team: Towards an explanation of nonselfish behaviour. Soc. Philos. Policy 1993, 10, 69–89. [Google Scholar] [CrossRef]
- Lee, J. The effect of the background risk in a simple chance improving decision model. J. Risk Uncertain. 2008, 36, 19–41. [Google Scholar] [CrossRef]
- Cubitt, R.P.; Starmer, C.; Sugden, R. On the validity of the random lottery incentive system. Exp. Econ. 1998, 1, 115–131. [Google Scholar] [CrossRef]
- Starmer, C.; Sugden, R. Does the random-lottery system elicit true preferences? Am. Econ. Rev. 1991, 81, 971–978. [Google Scholar] [CrossRef]
- Charness, G.; Gneezy, U.; Halladay, B. Experimental methods: Pay one or pay all. J. Econ. Behav. Organ. 2016, 131, 141–150. [Google Scholar] [CrossRef]
- Bosman, R.; Hennig-Schmidt, H.; van Winden, F. Emotion at stake—The role of stake size and emotions in a power-to-take game experiment in China with a comparison to Europe. Games 2017, 8, 17. [Google Scholar] [CrossRef]
- Moffatt, P.G. Stochastic choice and the allocation of cognitive effort. Exp. Econ. 2005, 8, 369–388. [Google Scholar] [CrossRef]
- Hey, J.D. Does repetition improve consistency? Exp. Econ. 2001, 4, 5–54. [Google Scholar] [CrossRef]
Figure 1.
Experimental games, with labels for Player 1 (row chooser) and Player 2 (column chooser) omitted to save space.
Figure 1.
Experimental games, with labels for Player 1 (row chooser) and Player 2 (column chooser) omitted to save space.

Table 1.
Self-reported reasons for strategy choices, with mean ratings of the extent to which each reason influenced players’ choices, ranging from 1 (Strongly disagree) to 7 (Strongly agree), and associated standard deviations (N = 47) and t tests, for both conditions (control and ×5 experimental).
| Control | ×5 | t | df | p | ||||
|---|---|---|---|---|---|---|---|---|
| M | SD | M | SD | |||||
| 1 | I chose rows with the aim of avoiding zero payoffs. | 5.64 | 1.54 | 5.89 | 1.62 | −0.784 | 92 | 0.435 |
| 2 | I chose rows by trying to predict or anticipate the most likely choices of the other person and then choosing the rows that would give me the highest payoffs if my predictions were correct. | 4.85 | 2.01 | 4.66 | 2.05 | 0.458 | 92 | 0.648 |
| 3 | I chose rows with the aim of maximizing the total payoff to both me and the other person. | 5.53 | 1.71 | 5.89 | 1.45 | −1.109 | 92 | 0.271 |
| 4 | I chose rows randomly, or with no particular reason in mind. | 1.32 | 0.81 | 1.45 | 1.04 | −0.664 | 92 | 0.508 |
| 5 | I chose rows by working out or estimating the average payoff that I could expect if the other person was equally likely to choose any column, and then choosing the best rows for me on that basis. | 3.94 | 2.03 | 4.49 | 2.14 | −1.288 | 92 | 0.201 |
| 6 | I chose rows with the aim of trying to get higher payoffs than the other person. | 2.98 | 1.99 | 2.79 | 1.93 | 0.473 | 92 | 0.638 |
| 7 | I chose rows with the aim of trying to ensure that the payoffs to me and the other person were the same or equal. | 4.85 | 1.77 | 5.45 | 1.67 | −1.681 | 92 | 0.096 |
| 8 | I chose rows by finding the highest possible payoff available to me in each grid and aiming for that payoff. | 3.91 | 2.02 | 2.74 | 1.85 | 2.931 | 92 | 0.004 |
| 9 | I chose as if the other person could anticipate my choices and they would always pick the best for them, and then I chose the best response for me. | 4.19 | 2.07 | 4.28 | 1.89 | −0.208 | 92 | 0.835 |
| 10 | I chose the best row for myself, pretending that, whatever row I chose, the other person would choose whatever column is best for them. | 3.79 | 1.90 | 4.02 | 2.03 | −0.578 | 92 | 0.565 |
Table 2.
Modal choices of players in 12 original games and 12 × 5 versions of the same games, and unique strategy choice predictions for Player 1 of cognitive hierarchy (CH) theory for Level-1 and Level-2 reasoning, strong Stackelberg reasoning, and team reasoning.
Table 2.
Modal choices of players in 12 original games and 12 × 5 versions of the same games, and unique strategy choice predictions for Player 1 of cognitive hierarchy (CH) theory for Level-1 and Level-2 reasoning, strong Stackelberg reasoning, and team reasoning.
| Games | Modal Choice Control | Modal Choice ×5 | CH Level-1 | CH Level-2 | Strong Stack. | Team Reas. |
|---|---|---|---|---|---|---|
| 3 × 3 games | ||||||
| 1 | B | A | B | B | A | C |
| 2 | A | A | B | B | A | C |
| 3 | B | B | B | C | C | A |
| 4 | B | B | B | C | C | A |
| 5 | C | B | C | C | B | A |
| 6 | C | C | C | C | B | A |
| 7 | C | C | A | B | C | C |
| 8 | C | C | A | B | C | C |
| 4 × 4 games | ||||||
| 9 | A | A | C | D | B | A |
| 10 | A | A | B | D | C | A |
| 11 | B | B | B | C | D | A |
| 12 | C | C | C | D | B | A |
Table 3.
Choices of players in the two treatment conditions (control and ×5 experimental) split by game number, with Chi square tests.
Table 3.
Choices of players in the two treatment conditions (control and ×5 experimental) split by game number, with Chi square tests.
| Games | A | B | C | D | χ2 | df | p |
|---|---|---|---|---|---|---|---|
| 3 × 3 games | |||||||
| 1 (control) | 18 | 19 | 10 | 0.733 | 2 | 0.693 | |
| 1 (×5) | 22 | 17 | 8 | ||||
| 2 (control) | 23 | 19 | 5 | 0.048 | 2 | 0.976 | |
| 2 (×5) | 22 | 20 | 5 | ||||
| 3 (control) | 15 | 24 | 8 | 0.737 | 2 | 0.692 | |
| 3 (×5) | 19 | 21 | 7 | ||||
| 4 (control) | 10 | 23 | 14 | 0.173 | 2 | 0.917 | |
| 4 (×5) | 11 | 21 | 15 | ||||
| 5 (control) | 8 | 15 | 24 | 1.550 | 2 | 0.461 | |
| 5 (×5) | 10 | 19 | 18 | ||||
| 6 (control) | 4 | 13 | 30 | 0.412 | 2 | 0.814 | |
| 6 (×5) | 5 | 15 | 27 | ||||
| 7 (control) | 14 | 2 | 31 | 0.623 | 2 | 0.733 | |
| 7 (×5) | 11 | 3 | 33 | ||||
| 8 (control) | 20 | 2 | 25 | 0.520 | 2 | 0.771 | |
| 8 (×5) | 17 | 3 | 27 | ||||
| 4 × 4 games | |||||||
| 9 (control) | 22 | 2 | 17 | 6 | 4.206 | 3 | 0.240 |
| 9 (×5) | 20 | 6 | 19 | 2 | |||
| 10 (control) | 28 | 13 | 6 | 0 | 4.533 | 2 | 0.104 |
| 10 (×5) | 20 | 13 | 14 | 0 | |||
| 11 (control) | 4 | 36 | 0 | 7 | 0.938 | 2 | 0.626 |
| 11 (×5) | 4 | 39 | 0 | 4 | |||
| 12 (control) | 11 | 9 | 22 | 5 | 1.016 | 3 | 0.797 |
| 12 (×5) | 8 | 12 | 21 | 6 |
© 2018 by the authors. Licensee MDPI, Basel, Switzerland. This article is an open access article distributed under the terms and conditions of the Creative Commons Attribution (CC BY) license (http://creativecommons.org/licenses/by/4.0/).
Share and Cite
MDPI and ACS Style
Pulford, B.D.; Colman, A.M.; Loomes, G. Incentive Magnitude Effects in Experimental Games: Bigger is not Necessarily Better. Games 2018, 9, 4. https://doi.org/10.3390/g9010004
AMA Style
Pulford BD, Colman AM, Loomes G. Incentive Magnitude Effects in Experimental Games: Bigger is not Necessarily Better. Games. 2018; 9(1):4. https://doi.org/10.3390/g9010004
Chicago/Turabian StylePulford, Briony D., Andrew M. Colman, and Graham Loomes. 2018. "Incentive Magnitude Effects in Experimental Games: Bigger is not Necessarily Better" Games 9, no. 1: 4. https://doi.org/10.3390/g9010004
Note that from the first issue of 2016, this journal uses article numbers instead of page numbers. See further details here.