1. Introduction
Conventional logic implies that an increase in a country’s assets should lead to greater opportunities for economic development. In many cases, however, resource-rich economies experience lower growth, worse institutions and more conflict than their resource-poor counterparts. An often-cited example is Nigeria. Sala-i-Martin and Subramanian [
27] observed that after the huge discovery of oil reserves worth 350 billion dollars, the proportion of the population living on less than one dollar per day has jumped from 36 to 70 percent. More alarmingly, because of bad governance, it has since then experienced zero growth in per capita income. Another example is the demise of Spain after its sudden discovery and appropriation of gold in the New World. The extraordinary resource windfall was followed by an uncontrollable boom and bust cycle, which led to the bankruptcy of Spain. Karl [
12] describes the adverse impact of windfalls on Spain as follows: “The monarchy consolidated the loyalty of the lesser aristocracy through political favoritism, especially by selling patents of nobility and ecclesiastical appointments. This practice dramatically expanded the size of the parasitic noble class, while simultaneously siphoning off the most productive talent from business and commerce...”. With these historical observations citing the crowding out of productive activities, resource abundance is usually associated with being poor economically (Karl [
12]),
i.e., the “paradox of the plenty”.
Interest in the paradox of the plenty has grown much more rapidly among empiricists. However, thus far, there is no clear consensus about its validity, and studies are often muddled by endogeneity issues. The seminal econometric papers of Sachs and Warner [
24,
25,
26] illustrate that, after controlling for a range of variables, an increase of one standard deviation in resource exports (over the national income) reduces economic growth by approximately one percent per year. Compared to Sachs and Warner’s export dependence datasets, to avoid problems like feedback effects and omitted variable bias, Brunnschweiler and Bulte [
1] employed natural capital data from the World Bank. They found out that resource abundance is not harmful to economic development. Emphasizing endogeneity issues, van der Ploeg and Poelhekke [
18,
19] argued against the results of Brunnschweiler and Bulte. In a similar vein, empirical results on the impact of resource wealth on appropriative conflict have been mixed. Work by Collier and Hoeffler [
6,
7] has shown that resource dependence triggers civil wars, whilst Brunnschweiler and Bulte [
2] showed that it is conflict that leads to greater resource dependence. Using newer datasets, numerous papers, like Dube and Vargas [
8], have shown that only certain types of natural resources lead to political unrest. Nonetheless, Mehlum
et al. [
16] found that when institutions, such as property rights, are strong, more resources lead to better economic outcomes. Behind this, we find other examples, such as oil-rich Nigeria, Angola and Venezuela and diamond-rich Sierra Leone and Congo. Countries like these perform poorly. In contrast, countries with good governance tend to perform well, in spite of their resource wealth. Excellent examples include Canada, Iceland and Australia.
Meanwhile, the theoretical literature about the relation between resource abundance and institutional quality can be categorized as either based on centralized or decentralized mechanisms. The literature based on decentralized mechanisms predicts that resource abundance weakens property rights and intensifies conflict incentives among private agents (Wick and Bulte [
29], Holder [
11]). Meanwhile, centralized mechanisms focus on the inefficient allocation decisions by the ruling elite, e.g., using natural resource wealth for wasteful investment, like bribes (Robinson
et al. [
23]). Caselli and Cunningham [
4] even argued that the existence of the paradox depends on leader behavior, e.g., if he or she is lazy, then he or she allocates less to productive activities.
Using a laboratory experiment, our main objective is to study the paradox of the plenty from a behavioral perspective. The experimental method is used for various reasons. The first is to test existing theoretical models. If strict assumptions are not met, theoretical results often fall apart. Laboratory experiments can therefore be used to see if there are behavioral deviations to theory. Second, experiments can substitute field data that are often financially infeasible or unavailable when studying rent-seeking or conflict. While field data offer a more realistic environment, they suffer adversely from too much noise and lack of control. This is not the case in the laboratory: one can test the impact of specific variables in a repeated and controlled setting (Ostrom [
17]). Furthermore, in empirical studies about the paradox of the plenty, unobservable historical dimensions of different countries are not controlled, and endogeneity problems may arise. Furthermore, extreme environments in which the paradox of the plenty fades away or is amplified may be difficult to observe in real-world settings. The experimental methodology is therefore a valuable complementary tool that provides additional insight into the relation between resource abundance and institutional design.
In our experiment, therefore, we investigate the following questions: Does sudden resource abundance intensify conflict? If so, does the existence of a institutional leadership always lead to better group outcomes, or is the efficiency of institutions dependent on leader behavior? We use a modified two-stage version of Hodler’s [
11] and Wick and Bulte’s [
29] conflict models. The first (second) stage reflects centralized (decentralized) mechanisms of the “paradox of the plenty”. In the first stage, a randomly-chosen leader of the group determines how much of the resource to protect from second-stage conflict. In the next stage, each group member decides to allocate his or her private endowment, e.g., time, between working or fighting for a share of the unprotected resource. Because institutional protection is costless and does not benefit leaders, theoretical predictions indicate that he or she should choose the strongest protection. Consequently, this reduces incentives to fight for the resource.
We considered two treatments. Specifically, we compare a situation where no institution regulates the potential protection of the resource (call it “anarchy”) to a situation where a member of the group decides unilaterally about the level of protection. In line with Caselli and Cunningham [
4], we categorize leader behavior depending on the level of protection that he or she chose. The leader can set either three levels of resource protection: none, weak and strong. We qualify these choices respectively as “anti-social”, “malevolent” and “benevolent”. We found that “anti-social” and “malevolent” leadership does not differ from anarchy. It is only when the leader is “benevolent” that within-group conflict is significantly reduced.
Several researchers have conducted experiments on conflict that are related to ours. In Durham
et al. [
10], subjects are paired and choose the allocation of their endowment between production and predatory appropriation. Productive investment determines total income, and appropriative investment determines how this total income is distributed. They noted that players tend to allocate a positive amount towards appropriation. Another study is that of Powell and Wilson [
21], who assume that subjects’ endowments can be allocated into either taking others’ income or defending one’s endowment. Even in the absence of institutions, they observed that sometimes individuals refrain from appropriation. Similar to the setting of Durham
et al. [
10], Duffy and Kim [
9] then introduced a government agent that selects how much producers have to spend in protecting their resources. The decision on how much to allocate on defense is taken away from players. Players then have to choose whether they want to be either producers (and spend the government-imposed level of defense) or predators, but not both. It was observed that the existence of a government provides incentive to produce. Finally, Smith
et al. [
28] designed a more complex setup where individual endowment can be invested into either production, appropriation or defense. They also have a treatment where subjects may endogenously form groups to pool their endowments. It was observed that group formation does not significantly lead to more cooperation.
While past experiments investigate the existence of anarchy in a laboratory setting, their models are different from ours. In our model, gains from private production are kept by players,
i.e., it is not contested. What they fight for is an external prize, e.g., common-pool resource. Unlike Duffy and Kim [
9] and Smith
et al. [
28], our model provides a more comprehensive link between leader behavior and conflict outcomes. Only the amount of protected resource is set by the leader. Furthermore, there are no restrictions as to how much group members invest in fighting. This strategy allows us to compare the efficiency of governance compared to anarchy. Finally, as this experiment provides a complementary investigation on the paradox of the plenty, we also contribute to the empirical literature on stake size and cooperation. Except for Puzon and Willinger [
22], who focused on the role of voting rights in rent-seeking games, almost all studies found that stake size does not affect group behavior in distribution (Carpenter
et al., [
3]) and social dilemma games (Kocher
et al., [
14]). To date, however, no study has investigated the interaction between stake size and leadership in conflict games. In the end, we found that malevolent leadership fails to eliminate conflict, especially when the resource at stake is high.
The remainder of this paper is structured as follows. In
Section 2, we present a conflict game where resource size is endogenously chosen by the leader.
Section 3 describes the experimental procedures.
Section 4 discusses the results. Finally,
Section 5 concludes.
2. Theoretical Framework
We model a game of conflict à la Wick and Bulte [
29] and Holder [
11] between
n symmetric, risk-neutral players. By including an institutional protection stage, we extend these contest models to the paradox of the plenty. Since the game takes place in two sequential stages, we solve it by backward induction. In the first stage, the leader of each group determines the fraction
λ = [0, 1] of resource protected from conflict. This fraction
λ of the resource
R is equally shared by the
n members of the group. In the second stage, each member of the group fights over the remaining, unprotected resource.
In the conflict stage, each player
i has an endowment
, which he or she invests either in production
, or in fighting for a share of the resource
. The production technology is linear,
i.e., each investment unit is multiplied by
α > 0. Player
i’s payoff from production,
, is computed as:
,
, 0 <
α < ∞. Given other players’ decisions, the expected payoff from fighting is given by
, where
is a contest function determining the share of the unprotected resource that player
i obtains. The contest function is formulated such that the player who invests relatively more effort in fighting gets a larger share of the unprotected resource. If nobody invests in fighting, each one receives an equal share. This contest function is defined as:
Each player
i chooses
to maximize his or her total expected income, given
the sum of the fighting efforts of the other players
:
Assuming that all players decide simultaneously, the symmetric Nash equilibrium level of allocation to fighting is: . At the group level, the sum of the fighting efforts of the group members is equal to . An increase in the resource, R, leads to more conflict. Nonetheless, this effect can be crowded-out by stronger protection λ. Under non-cooperative play, each player gets .
Prediction 1a: Groups fight more when the size of resource R is high or when the level of protection λ is weak.
Prediction 1b: The negative effect of a high resource R can be compensated by a stronger protection level λ.
Proof: derivative and cross-derivatives of with respect to R and λ.
Before choosing investments in fighting, assume there is an additional stage where one member of the group (
i.e., the leader) can endogenously determine the amount of resource to protect. This fraction of the resource is shared equally among all members of his or her group. The leader chooses
λ to maximize
:
It is easy to see that income is maximized when λ = 1. If protection is feasible, then the Nash equilibrium group fighting coincides with the optimum (i.e., nF = 0). Players have no incentive to fight, as the level of unprotected resource is negligible. Prediction 2 summarizes these findings.
Prediction 2: If leaders can choose the level of resource protection λ, then they set the highest feasible level. Fighting incentives become negligible.
Proof: derivative of ΠN with respect to λ.
3. Procedures and Predictions
The experiment was designed to investigate the interplay among leader behavior, resource abundance, and group conflict. Each session involved up to 18 subjects randomly assigned to groups of three. Subjects remained in the same group for the whole session. We considered two treatments: anarchy (no institutions) and leadership (e.g., with government). In the anarchy treatment (control), there is no possibility to protect the resource. In the leadership treatment, a fraction of the resource can be protected from conflict. Consistent with the environment of a “resource boom”, the size of the common-pool was “low” at 100 points in the first sequence. In the second sequence, it is multiplied by two (“high” at 200 points).
For the anarchy treatment, subjects’ main task was to allocate their endowment between a private activity (Activity M) and a collective activity (Activity R). They were told that each token invested in Activity M was worth five points, while the number of points received from their investment in Activity R depended on the their own investment and the other members’ investments. It was made clear that the fraction of the unprotected resource that a subject would receive was determined according to the following rule: “your investment in Activity R over the total investment of your group in Activity R”. In each decision round, subjects disposed of an endowment of 20 tokens that they had to allocate between Activity R and Activity M.
For the leadership treatment, there was an additional stage. Before the investment task above, one randomly-chosen group member determined how much of the points in the common account in Activity R should be protected and shared by all members. Three different levels of protection were possible:
λ ∈ {0, 0.3, 0.7}. The strongest level of protection considered is 70%. We chose the highest protection at less than 100% to reflect the fact that property rights are rarely perfect (Chichilnisky, [
5]). Nevertheless, 70% protection is high enough to exhibit its disparities with weak protection (30%) and non-protection (0%). This also allows us to find a link between protection and fighting decisions,
i.e., does conflict always decrease with institutional protection?
The following parameters were chosen for the experiment:
n = 3,
R ∈ {100, 200},
α = 5,
E = 20 and
λ ∈ {0, 0.3, 0.7}. Based on the theoretical model, the predictions are shown below in
Table 2. With these, leaders are expected to choose
λ = 0.7. Consequently, this should lead to an aggregate investment of four (eight) tokens to conflict when
R = 100(200).
Upon their arrival, subjects were told that the session consists of two sequences with 10 rounds each. They initially received written instructions and check-up questionnaires for the first sequence only. However, the instructions mentioned that they would play a second sequence shortly after the first one and that at the end of the experiment, one of the two sequences would be randomly selected to be paid. Overall, the experimental design allows for both within-group analysis (resource size) and between-group analysis (institutions). With subjects earning approximately 23 euros, a total of four sessions were conducted at the University of Montpellier.
Table 1 summarizes the number of groups and subjects for each treatment.
Table 1.
Number of independent groups and subjects per treatment.
Table 1.
Number of independent groups and subjects per treatment.
| Treatment | Anarchy (Control) | Leader | Total |
|---|
| Groups | 11 | 12 | 23 |
| Subjects | 33 | 36 | 69 |
Table 2.
Theoretical predictions on group fighting efforts.
Table 2.
Theoretical predictions on group fighting efforts.
| λ, Protection | None: λ = 0 | Weak: λ = 0.3 | Strong: λ = 0.7 |
|---|
| R, resource size | | | |
| Low: R = 100 | 14 | 9 | 4 |
| High: R = 200 | 27 | 19 | 8 |
4. Experimental Results
This section presents the results of the experiment. The first part explores the impact of resource size on group conflict. The second part investigates the role of leader behavior on conflict outcomes.
4.1. Does Resource Abundance Intensify Conflict?
We first examine the existence of the paradox of the plenty. Does a sudden increase in the resource lead to more within-group conflict?
Result 1: On average, a higher level of resource increases within-group conflict.
Table 3.
Mean impact of resource size and institutions on group conflict.
Table 3.
Mean impact of resource size and institutions on group conflict.
| Institutions | Anarchy (Control) | Leader (Treatment) | Rank-Sum (p-Value) |
|---|
| Resource size | (mean, SD) | | (p-value) |
| Low | 18.46 | 10.73 | 0.0011 |
| 4.17 | 4.75 | |
| High | 29.48 | 16.02 | 0.003 |
| 4.77 | 6.17 | |
| Rounded-up mean difference | 11 | 6 | 0.0267 |
| # of groups | 11 | 12 | |
| Sign-rank (p-value) | 0.003 | 0.004 | |
Table 3 compares the impact of resource size on aggregate fighting efforts. Sign-rank tests show that a higher resource level always significantly increases within-group conflict in both the anarchy (
p-value of 0.003) and leadership (
p-value of 0.004) treatments. Under anarchy, investment in fighting increases by 10 points of the 60-point group endowment. In the presence of leadership, there is an approximately six-point increment. This results leads us to further explore Result 2.
Result 2: On the aggregate, conflict is less intense in groups with leaders than under anarchy.
Table 4.
Impact of resource size and institutions on conflict. Random error-Generalized least squares regression with robust standard errors clustered across groups; Dependent variable: group fighting.
Table 4.
Impact of resource size and institutions on conflict. Random error-Generalized least squares regression with robust standard errors clustered across groups; Dependent variable: group fighting.
| All | | Periods 10–11 | |
|---|
| Coef. | Std. Err. | Coef. | Std. Err. |
|---|
| anarchy_low (base) | 18.463 *** | 1.228 | 15.363 *** | 1.341 |
| anarchy_high | 11.018 *** | 1.685 | 9.727 *** | 2.950 |
| leader_low | −7.738 *** | 1.822 | −6.613 *** | 2.561 |
| leader_high | −2.446 | 2.136 | 3.803 | 3.976 |
| R-squared | 0.413 | | 0.337 | |
| observations | 460 | | 46 | |
| groups | 23 | | 23 | |
| rounds | 20 | | 2 | |
| Wald test (p-value) | | | | |
| anarchy_low = leader_low | 0 | | 0 | |
| anarchy_high = leader_high | 0 | | 0.178 | |
| anarchy_high = leader_low | 0.004 | | 0.153 | |
| leader_low =leader_high | 0.004 | | 0.002 | |
Rank-sum tests in
Table 3 indicate that groups under some form of leadership are, on the aggregate level, better-off than those who are not. Meanwhile,
Table 4 presents panel regressions exploring the interaction between resource size and institutional type. When the resource is low, groups governed by leaders fight six points less than those under anarchy. Both the significant regression coefficients and Wald test (
p-value of 0.00) provide support. This result is not surprising, because there is a possibility to protect the resource in the leadership treatment. Only a fraction of the resource is fought for in the second stage. In contrast, under anarchy, there is no possibility of protection, and all of the resource is always fought for. Nonetheless, results are less clear-cut when the resource is high. While regressions indicate that there is also a six-point differential between anarchy_high and leader_high, results for the Wald test show that the coefficients for these variables are not significantly different (
p-value of 0.178). Because of this, when there is sudden abundance in the resource, we tentatively hypothesize that the existence of leadership might not always lead to better outcomes.
4.2. Is Malevolent Leadership Worse than Anarchy?
Findings in the previous section indicate that, regardless of the institutional type, resource abundance always leads to more within-group conflict. However, does the mere existence of institutions automatically imply better group outcomes, i.e., less intensity of group conflict, or are the results dependent on the quality of leadership? These are the questions we attempt to investigate in this section.
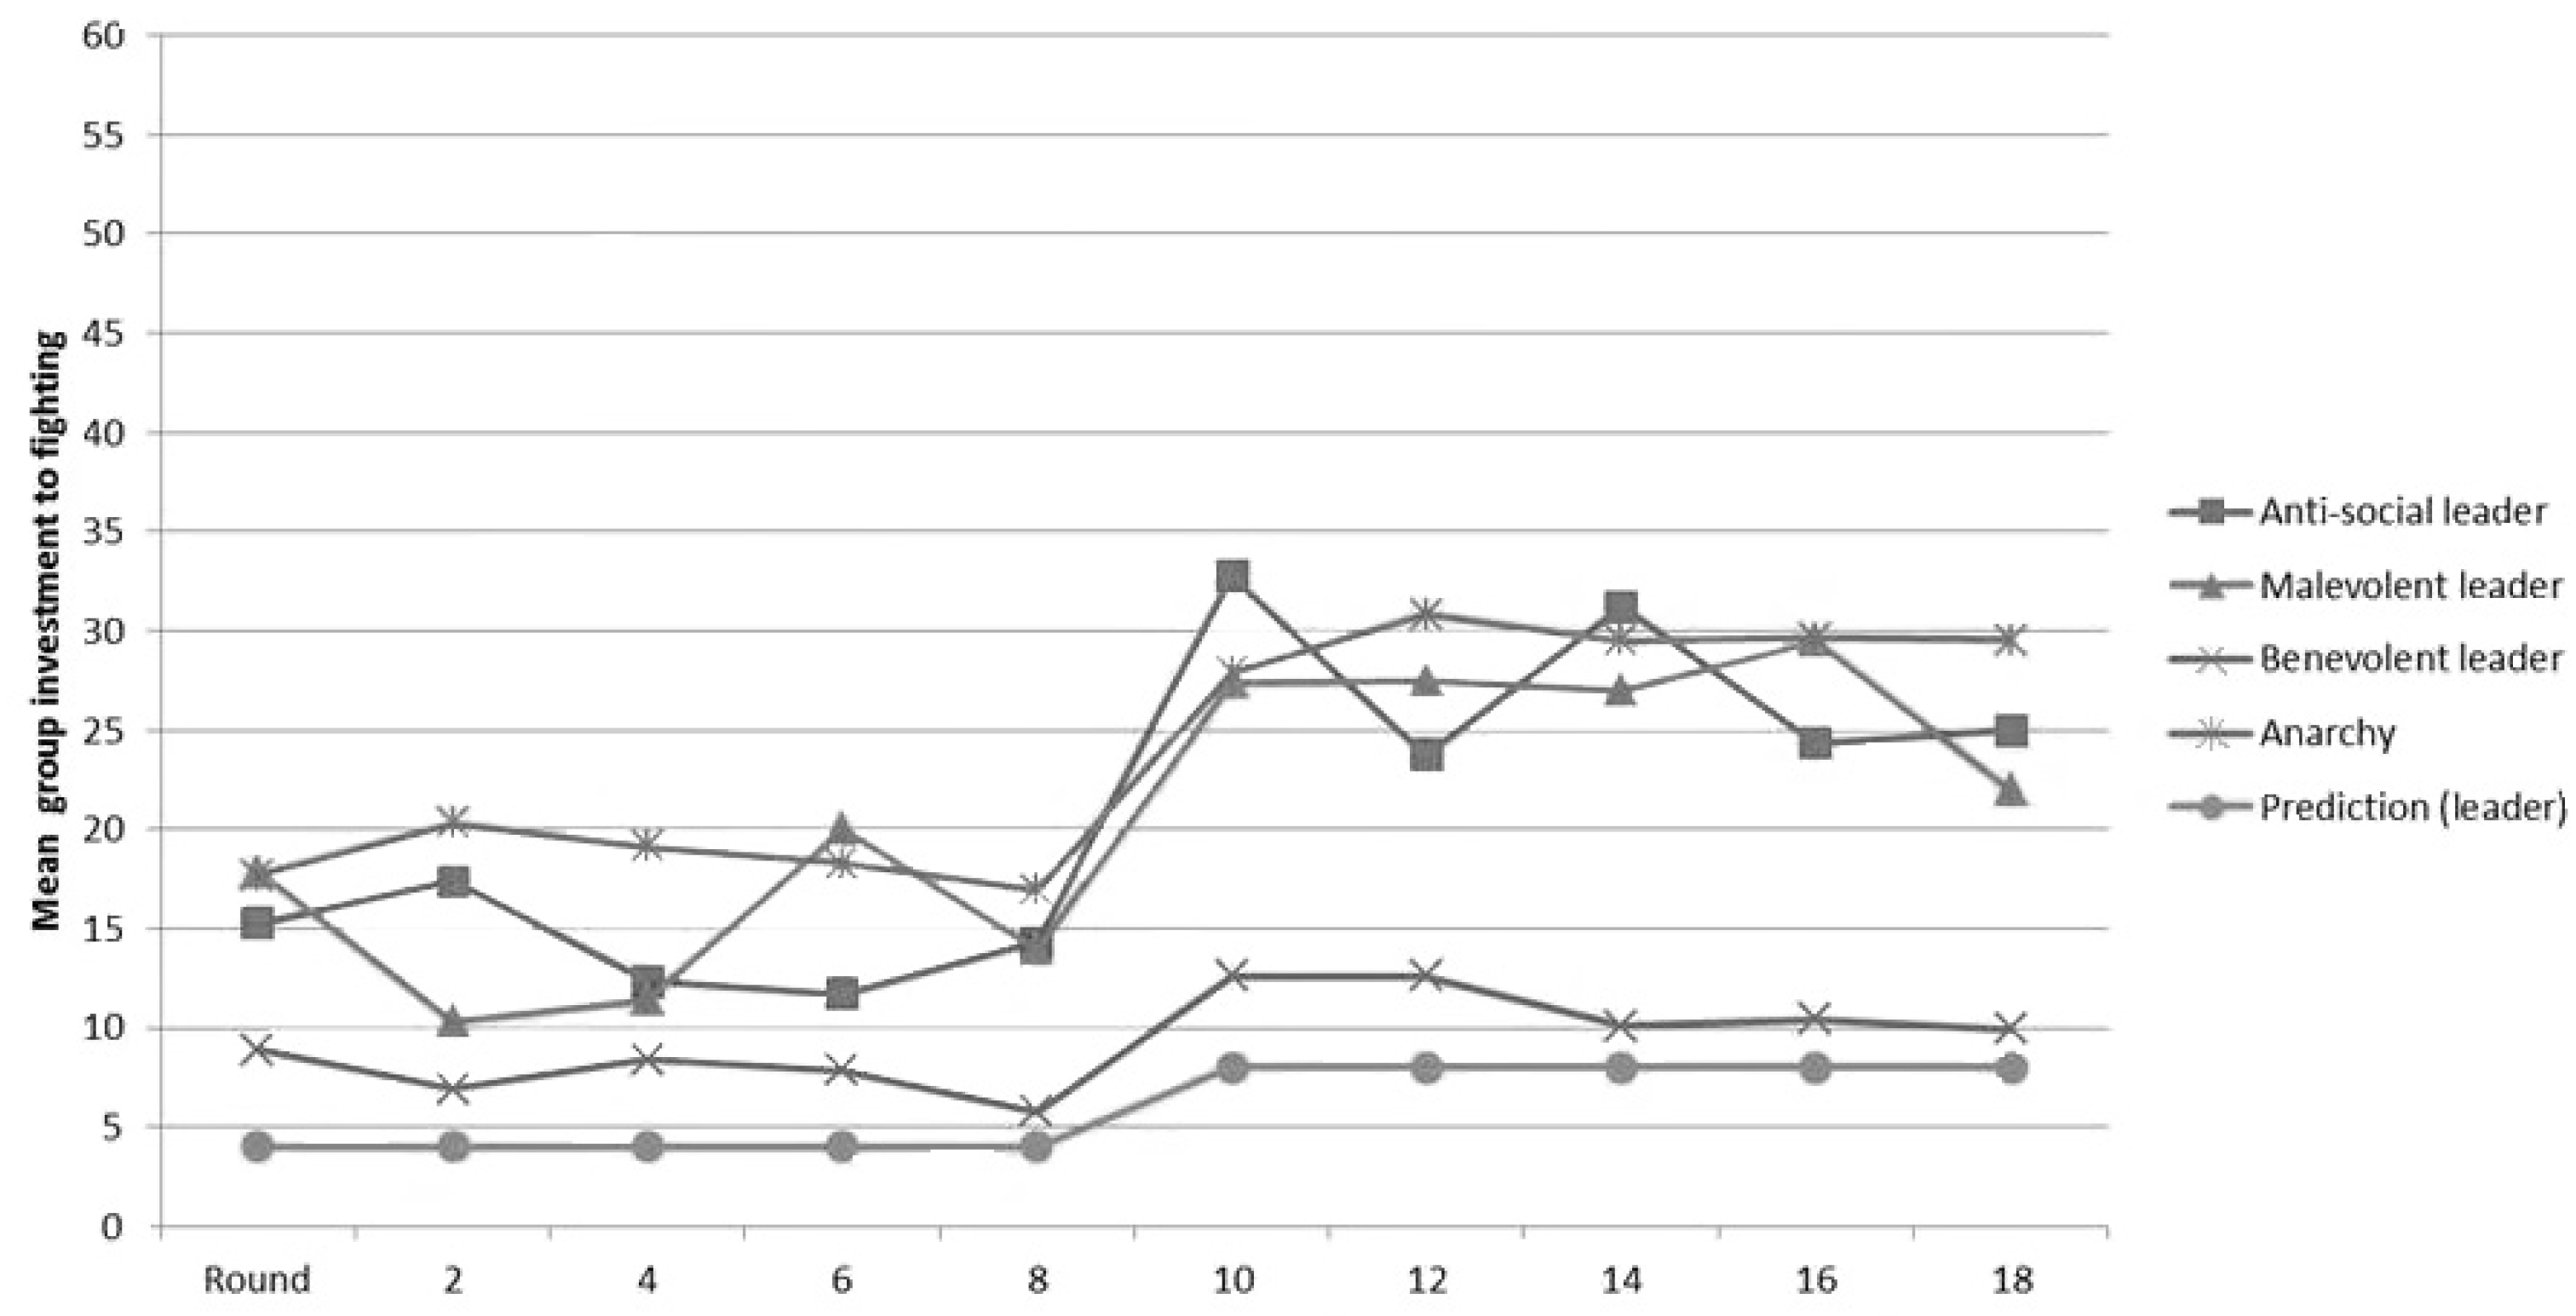
Figure 1 presents average group investment in fighting over time. Recall that the resource is low (high) for Rounds 1–10 (11–20). Groups are categorized into three types according to the protection level chosen by the leader: anti-social (0% protection), malevolent (30% protection) and benevolent (70% protection). These are compared to those under anarchy and the Nash prediction. From a theoretical perspective, as they gain nothing from choosing 70% protection and doing so is costless, leaders are predicted to be benevolent. Nonetheless, on average, this is not what is observed.
As can be seen, regardless of the resource size and leader behavior, groups tend to over-invest with respect to the prediction. This is also the case even if 70% protection is chosen. Another interesting observation is that leadership is only better than anarchy if it is benevolent. If the leader is either malevolent or anti-social, group conflict is similar to that when there is no protection under anarchy. While theory suggests that 30% protection should lead to less conflict than 0% protection, this is not what is observed. The graph implies that malevolent and anti-social leadership may sometimes be worse than anarchy, i.e., mean group investment to fighting is higher even if property rights are present. We further explore this finding in the statistical tests below.
Figure 1.
Quality of leadership and group conflict.
Figure 1.
Quality of leadership and group conflict.
Result 3: Malevolent leadership does not reduce conflict. Only benevolent leadership, i.e., λ = 0.7, leads to more efficient group outcomes. This is especially the case when the resource is high.
Table 5.
Impact of leader behavior on within-group conflict. Random error-Generalized least squares regression with robust standard errors clustered across groups; Dependent variable: group fighting.
Table 5.
Impact of leader behavior on within-group conflict. Random error-Generalized least squares regression with robust standard errors clustered across groups; Dependent variable: group fighting.
| Low | | High | |
|---|
| Coef. | Std. Err. | Coef. | Std. Err. |
|---|
| anarchy (base) | 18.463 *** | 1.233 | 29.481 *** | 1.410 |
| anti-social leader | −4.502 ** | 1.953 | −2.450 | 2.967 |
| malevolent leader | −2.744 | 2.535 | −3.980 | 3.063 |
| benevolent leader | −10.954 *** | 1.724 | −18.345 *** | 1.753 |
| R-sq | 0.309 | | 0.606 | |
| obs | 230 | | 230 | |
| grps | 23 | | 23 | |
| rounds | 10 | | 10 | |
Table 6.
Impact of leader behavior on individual conflict investment by type. Random error-Generalized least squares regression with robust standard errors; Dependant variable: individual fighting.
Table 6.
Impact of leader behavior on individual conflict investment by type. Random error-Generalized least squares regression with robust standard errors; Dependant variable: individual fighting.
| Low Resource | Leaders Only | | Non-Leaders Only | |
| Coef. | Std. Err. | Coef. | Std. Err. |
| anarchy (base, all) | 6.154 *** | 0.247 | 6.154 *** | 0.247 |
| anti-social leader | −1.190 | 0.988 | −1.350 ** | 0.682 |
| malevolent leader | 1.285 | 0.894 | −2.334 *** | 0.670 |
| benevolent leader | −4.676 *** | 0.353 | −3.147 *** | 0.427 |
| R-sq | 0.141 | | 0.086 | |
| obs | 450 | | 570 | |
| High Resource | Leaders Only | | Non-Leaders Only | |
| Coef. | Std. Err. | Coef. | Std. Err. |
| anarchy (base, all) | 9.827 *** | 0.235 | 9.827 *** | 0.234 |
| anti-social leader | −0.865 | 1.284 | −0.884 | 0.926 |
| malevolent leader | −1.243 | 1.494 | −0.702 | 0.964 |
| benevolent leader | −6.424 *** | 0.425 | −6.028 *** | 0.347 |
| R-sq | 0.249 | | 0.282 | |
| obs | 450 | | 570 | |
With anarchy as the baseline,
Table 5 shows the impact of leader behavior on group fighting investment. When the resource is low and the highest protection level of 70% is chosen, groups fight 10 points less than when there is no opportunity to protect,
i.e., no governance under the anarchy treatment. Even anti-social leadership,
i.e., 0% protection is chosen, leads to less group fighting when the resource is low. What is interesting is that 0% protection is more effective than 30% protection when the resource is low,
i.e., the variable for malevolent leadership is insignificant. Even if 30% protection is chosen, within-group fighting does not decrease compared to anarchy. Results get worse when the resource is high. In particular, leadership institutions only become effective when they are benevolent. If leaders choose protection levels lower than 70%, conflict outcomes do not significantly differ from the anarchy treatment where 30 out of 60 group tokens are invested in fighting.
Table 7.
Impact of leader behavior on income inefficiency. Random error-Generalized least squares regression with robust standard errors clustered across groups; Dependent variable : relative deviation from the efficient group income.
Table 7.
Impact of leader behavior on income inefficiency. Random error-Generalized least squares regression with robust standard errors clustered across groups; Dependent variable : relative deviation from the efficient group income.
| Low | | High | |
|---|
| Coef. | Std. Err. | Coef. | Std. Err. |
|---|
| anarchy (base) | 0.190 *** | 0.016 | 0.233 *** | 0.015 |
| anti-social leader | −0.059 ** | 0.025 | −0.026 | 0.032 |
| malevolent leader | −0.0361 | 0.033 | −0.043 | 0.033 |
| benevolent leader | −0.144 *** | 0.022 | −0.199 *** | 0.019 |
| R-sq | 0.309 | | 0.606 | |
| obs | 230 | | 230 | |
| grps | 23 | | 23 | |
| rounds | 10 | | 10 | |
These aggregate results are supported by individual fighting data in
Table 6. Fighting investments are analyzed by subject type (
i.e., leader
vs. non-leaders) and by resource size. With all individual observations in the anarchy treatment as the baseline, we compare fighting investments in Stage 2 given the level of resource protection chosen by the leader in Stage 1. When the resource is high, only 70% protection leads to significantly lower fighting than anarchy. This is true for both leaders and non-leaders. In particular, individual investment in fighting goes from approximately 10 tokens under anarchy to merely three tokens when the leader is benevolent. Thus, these individual results may explain the aggregate ineffectiveness of lower protection in decreasing conflict when the resource is relatively abundant. Indeed, only the strongest feasible protection level is effective at decreasing incentives to fight. Meanwhile, when the resource level is low, the same observation applies for subjects assigned as leaders. Except when 70% protection is implemented, subjects assigned as leaders invest six tokens regardless of the extent of protection. In contrast, non-leaders always fight significantly less. Even if the leader chose 0% protection, non-leaders invest relatively less in fighting (three tokens) than subjects experiencing anarchy (six tokens). Furthermore, when the resource is low, the discrepancies between non-leader and leader investments explain why conflict is more intense under malevolent than anti-social leadership. When 30% protection is chosen, leaders invest seven tokens as opposed to non-leaders’ average investment of four tokens. This difference is not observed for other protection levels. When 0% (70%) protection is selected, both subject types have fighting investments of five (three) tokens.
Finally, we complement these results for within-group conflict with data on income. Define
as the group income. Our measure of relative inefficiency is denoted as
. Furthermore, we define
as the socially-efficient (Nash predicted) group income. This leads us to
and
if
R = 100 and
R = 200, respectively. Taking all of these into account,
Table 7 presents the effect of leader behavior on the deviation from the predicted, efficient income level. Again with anarchy as the baseline (19%), when the resource is low, benevolent leadership leads to just a five-percent deviation from the efficient income level. Looking at the results for the anarchy treatment when the resource is high, deviation from the optimum income increases to 23%. Thus, under anarchy, a higher resource size leads to greater group inefficiency. In contrast, results indicate that benevolent leadership reduces the deviation from the optimum income is nearly zero when the resource is high. In contrast, when leadership is weak (
i.e., either 0% or 30% is chosen), the deviation from the efficient group income is not significantly different from 23%.
5. Final Remarks
We conducted a laboratory experiment investigating the existence of this so-called “paradox of the plenty” from a behavioral perspective. In the first stage, a randomly-chosen member of the group (the “leader”) determines how much of the resource to protect from conflict. In the next stage, each group member decides how to allocate his private endowment between working and fighting for appropriation of the unprotected resource. We observed that when the resource is high, benevolent leadership leads to the opposite result of the anarchy treatment,
i.e., less intense group conflict. The paradox can thus be avoided if the leader chose the highest resource protection level. However, the mere existence of institutions does not always reduce inefficiency as compared to anarchy. Institutional protection does not always reduce incentives to fight for the resource. If leader behavior is malevolent,
i.e., he chose weak resource protection, group outcomes are worse than those under anarchy. Thus, our experiment provides strong complementary evidence to the argument of Caselli and Cunningham [
4]. Leader behavior, indeed, has an integral role in the relationship among resource abundance and group outcomes.
Finally, our laboratory experiment has potential extensions. One may modify the game in such a way that the leader, depending on his or her choices in the first stage, gains an advantage in the second stage. A dynamic setting analyzing the interplay between resource extraction and lack of property rights can also be considered (Lane and Tornell [
4]). A rather simpler model that can be tested is the two-period analysis of Van der Ploeg and Rohner [
20], where the leader’s probability of staying in power depends on his or her and the challenger’s conflict efforts. Another possibility is to experimentally explore the role of leader behavior in conflict resolution, e.g., if they have a monopoly over the resource, are leaders willing to provide transfers to avoid subsequent conflict with non-leaders? Finally, differences between earned
versus randomly-assigned leadership may also be considered (Kimbrough and Sheremeta [
13]). These are all parts of the authors’ future research agenda.


