TaPT: Temperature-Aware Dynamic Cache Optimization for Embedded Systems

1
Department of Electrical and Computer Engineering, University of Arizona, Tucson, AZ 85721, USA
2
Department of Electrical and Computer Engineering, University of Florida, Gainesville, FL 32611, USA
*
Author to whom correspondence should be addressed.
Computers 2018, 7(1), 3; https://doi.org/10.3390/computers7010003
Submission received: 24 November 2017
/
Revised: 19 December 2017
/
Accepted: 20 December 2017
/
Published: 22 December 2017
(This article belongs to the Special Issue Multi-Core Systems-On-Chips Design and Optimization)
Abstract
:Embedded systems have stringent design constraints, which has necessitated much prior research focus on optimizing energy consumption and/or performance. Since embedded systems typically have fewer cooling options, rising temperature, and thus temperature optimization, is an emergent concern. Most embedded systems only dissipate heat by passive convection, due to the absence of dedicated thermal management hardware mechanisms. The embedded system’s temperature not only affects the system’s reliability, but can also affect the performance, power, and cost. Thus, embedded systems require efficient thermal management techniques. However, thermal management can conflict with other optimization objectives, such as execution time and energy consumption. In this paper, we focus on managing the temperature using a synergy of cache optimization and dynamic frequency scaling, while also optimizing the execution time and energy consumption. This paper provides new insights on the impact of cache parameters on efficient temperature-aware cache tuning heuristics. In addition, we present temperature-aware phase-based tuning, TaPT, which determines Pareto optimal clock frequency and cache configurations for fine-grained execution time, energy, and temperature tradeoffs. TaPT enables autonomous system optimization and also allows designers to specify temperature constraints and optimization priorities. Experiments show that TaPT can effectively reduce execution time, energy, and temperature, while imposing minimal hardware overhead.
1. Introduction
Embedded systems have become ubiquitous over the past few years, and with the emergence and growth of the Internet of Things, embedded systems are expected to become even more pervasive. Researchers have focused on effective optimization techniques for optimizing embedded systems’ energy consumption, since these systems typically have stringent resource and design constraints. These constraints include form factor, battery capacity, cost, real-time deadlines, etc., and pose significant challenges to embedded system optimization. The optimization challenges are exacerbated by the increase in high-demand (compute/memory intensive) applications that must be executed within these resource constraints. Since most embedded systems are battery operated, much research efforts have focused on reducing energy consumption without significantly degrading system performance. However, temperature is also a growing issue in embedded systems optimization research since most embedded systems have fewer cooling options as compared to general purpose computers due to area/size, cost, and energy constraints. Most embedded systems lack traditional cooling mechanisms, such as active cooling fan, water cooling, heat pipes/sinks, etc., and only dissipate heat by passive convection. These constraints necessitate efficient thermal management techniques that impose minimal hardware overhead.
An embedded system’s temperature affects several optimization goals, such as performance, reliability, power, and system cost. Increased chip temperature in an embedded system can increase cooling costs, and reduce performance, mean time to failure (MTTF), and reliability. In addition, increased temperature can lead to thermal emergencies, which can result in an exponential increase in leakage power and thermal runaway, leading to permanent chip damage. To address these issues, several dynamic thermal management (DTM) techniques have been proposed for managing chip temperature. Most of these techniques leverage clock gating [1], dynamic voltage scaling (DVS), dynamic frequency scaling (DFS), or dynamic voltage and frequency scaling (DVFS) [2], and/or task migration [3].
In our work, we use DFS as part of a broader technique for thermal management in embedded systems. DFS is an effective dynamic thermal optimization technique that adjusts a microprocessor’s frequency to changing application resource requirements, thereby reducing the microprocessor’s power consumption and/or heat dissipation. DFS is commonly implemented in modern day microprocessors [4], especially in battery-operated/resource-constrained devices, such as smartphones. The frequency at which the circuit is clocked determines the voltage required for stable operation, therefore, the voltage can be reduced as the frequency is reduced. Thus, DFS is commonly used in conjunction with DVS, and is sometimes referred to as DVFS. While we explicitly utilize DFS in our work, the work presented herein is also applicable to DVS or DVFS.
One of the potential drawbacks of DTM techniques is that optimizing the temperature in isolation can significantly degrade other optimization goals, such as execution time and/or energy consumption [5]. In addition, the applications’ execution characteristics (e.g., cache misses, instruction per cycle (IPC), branch mispredictions, etc.) can also affect the temperature [6]. Since applications typically have dynamically varying execution characteristics, we show that the temperature can be further optimized by considering intra-application characteristic variations. Some previous DTM techniques (e.g., [7]) consider inter-application characteristic variations, however, in this work, we optimize the system at a finer granularity than most previous works by considering intra-application characteristic variations.
To increase optimization potential by specializing system resources to varying application characteristics, we leverage phase-based tuning [8] as a complementary approach to DFS. A phase is a length of execution during which an application’s characteristics remain relatively stable. During a phase, the best system configurations or specific parameter values (e.g., cache size, associativity, line size, clock frequency, etc.) that satisfy design constraints also typically remain relatively stable. Phase-based tuning requires configurable hardware with tunable parameters, whose values can be specified/changed during runtime. Phase-based tuning also requires a mechanism to evaluate the application’s characteristics in order to determine the best system configurations that satisfy each phase’s resource requirements. Previous work showed that phase-based tuning significantly reduced energy consumption in embedded systems [8]. For example, Gordon-Ross et al. [9] showed that phase-based cache tuning reduced the cache’s memory access energy by up to 62%. However, few studies have addressed the combination of phase-based-tuning and DTM.
In order to maximize the benefits of phase-based tuning and DTM, the tuned system components must be carefully selected. In this work, we focus on the cache for phase-based tuning, and the clock frequency for DTM, using DFS. On-chip caches are well known to account for a significant portion of a microprocessor’s total energy consumption [10,11]. In addition, cache could also be a performance bottleneck, since they are used to bridge the processor-memory performance gap. However, even though previous work has shown that caches may contribute to a chip’s temperature [12,13], the thermal impacts of cache configurations have not been thoroughly investigated.
In this paper, we thoroughly investigate and analyze the thermal impacts of cache configurations and use the insight from this analysis to develop a low-overhead and flexible optimization heuristic that optimizes the temperature without degrading the execution time and/or energy. For the first time, to the best of our knowledge, we establish the impact order of cache parameters on the system temperature. This impact order will drive future advances in efficient temperature-aware cache tuning heuristics/algorithms.
We present a dynamic optimization heuristic—temperature-aware phase-based tuning (TaPT). TaPT dynamically determines the Pareto optimal system configurations, and trades off execution time, energy, or temperature design objectives, depending on user-specified priorities. TaPT leverages the strength Pareto evolutionary algorithm II (SPEA2) [14], which is a well-known and effective evolutionary algorithm for solving multi-objective optimization problems. TaPT features priority settings that offer designers the flexibility to choose which design objective to prioritize during optimization. TaPT’s runtime automation enables systems to adhere to resource constraints with minimal design time effort. TaPT also leverages previously proposed configurable hardware, in order to minimize hardware overhead with respect to prior optimization techniques. Experimental results show that compared to using the same system configuration throughout an applicatio’s execution, TaPT reduces average execution time, energy consumption, and temperature by to 5%, 30%, and 25%, while adhering to designer-specified design constraints. Additionally, we compare TaPT to DFS and cache tuning in isolation, and quantitatively illustrate the benefits and tradeoffs of TaPT over DFS and cache tuning. Finally, we show that TaPT can be easily implemented, requires minimal design time effort, and constitutes minimal hardware overhead with respect to state-of-the-art embedded system microprocessors.
2. Background and Related Work
Much previous work focused on phase-based tuning [8,15,16] and DTM [1,2,3,17]. Since we leverage both phase-based tuning and DTM, we present related work and background in these two areas. We also present background and key concepts from SPEA2 that we leveraged for TaPT.
2.1. Phase-Based Tuning and DTM
To facilitate phase-based tuning, hardware- or software-based phase classification partitions an application’s execution into intervals, measured by the number of instructions executed. Intervals showing similar characteristics can be clustered into phases. Sherwood et al. [18] studied applications’ time varying behaviors using SPEC 95 benchmarks, and showed that applications have periodic patterns and exhibit phase-based behavior with respect to several execution statistics (e.g., cache miss rates, branch mispredicts, IPC, etc.) Balasubramonian et al. [19] used cache miss rates, cycles per instruction (CPI), and branch frequency characteristics to detect changes in application characteristics for cache tuning, and found that these characteristics were effective for phase classification. Dhodapkar et al. [20] found a relationship between phases and the phases’ working sets, and concluded that phase changes could be detected by detecting changes in the working set. In this work, we use execution statistics obtained from the microprocessor’s hardware performance counters for phase classification [21]. Since we use cache tuning in this work, for brevity, we limit our review to phase-based cache tuning.
A major challenge in phase-based cache tuning is tuning the configurable hardware to determine the best cache configuration for each phase without incurring significant tuning overhead. Zhang et al. 2003 [11] proposed a cache tuning heuristic that traded off energy consumption and performance to determine the Pareto optimal cache configurations. The heuristic searched the cache parameters in order of the parameters’ impact on the energy consumption. The heuristic first determined the best cache size, which has the largest impact on energy, followed by the best line size, and finally the best associativity. However, this method executed several inferior, non-optimal configurations, thus incurring tuning overhead. Gordon-Ross et al. [8] presented phase-based cache design space exploration heuristics that achieved up to 39% energy savings on average, as compared to non-phase-based tuning (i.e., using a single configuration for the entire application). To find the best cache configuration for applications’ distinct phases, Hajimir et al. [16] presented a dynamic programming-based cache assignment algorithm that reduced the time complexity of design space exploration, and also determined optimal cache configurations. However, these methods only focused on energy savings and did not consider thermal issues.
Huang et al. [22] showed that the cache contributes significantly to the overall chip temperature, and necessitates optimization techniques that target cache thermal management. Homayoun et al. [12] showed that the memory cell peripherals’ power dissipation is significantly higher than the actual memory cell’s power dissipation. This difference in power dissipation results in thermal variations within the cache, and is caused by the difference in activity factors between peripheral logic and memory cells. Peripheral logic includes global and local address routing drivers, global data in/out drivers, row predecoder drivers, and wordline drivers. Additionally, the different types of transistors used for the peripheral logic and memory cell also contribute to the cache’s thermal variation. Since the peripheral logic and memory cells interplay with the cache configurations differently, these observations motivate our study of the cache configurations’ impact on temperature dissipation.
To reduce chip temperature dissipation, several DTM techniques have been proposed. Brooks et al. [1] investigated clock gating, which turns off the clock signals during thermal emergencies. Heo et al. [3] proposed task migration, which migrated tasks from a hot core to a cooler core to avoid a thermal emergency. More recently, Liu et al. [23] proposed a DTM technique that used task migration to reduce temperature variations across the chip, while considering transient thermal effects. Kong et al. [24] presented a survey of recent thermal management techniques for microprocessors, focusing on the techniques that affect or rely on the microarchitecture. The authors showed that most DTM techniques have the potential to degrade performance due to longer execution times. Additionally, these works did not explicitly consider the tradeoffs between energy, temperature, and execution time. As a result, there was a much higher possibility of significantly degrading one design objective while optimizing other competing objectives. Furthermore, these methods were not phase-based and did not consider intra-application/intra-task variations.
This paper is based on the fact that prior work has established that phase-based cache tuning can substantially reduce energy consumption and execution time, and DTM techniques can significantly impact temperature, energy consumption, and execution time. Thus, we combine phase-based cache tuning and DFS for fine-grained and efficient temperature, energy, and execution time optimization. However, since optimizing one design objective may adversely affect other competing objectives, combining phase-based cache tuning and DFS presents a multi-objective optimization problem. The solution to a multi-objective optimization problem is the Pareto optimal configuration set, which enables designers to choose system configurations that best meet design constraints.
Our work improves the robustness of thermal management and explores the synergies between different optimization techniques. We combine phase-based cache tuning and DFS to determine Pareto optimal configurations that trade off execution time, energy, and temperature, thus increasing optimization potential and achieving fine-grained multi-objective optimization.
2.2. Configurable Hardware
Phase-based tuning can leverage any configurable cache architecture (e.g., [11]) and tuning method to search the configuration design space, which consists of all the different system configurations/combinations of tunable parameter values. Motorola’s M*CORE processor [25] provided per-way configuration using way management, which allowed ways to be shut down or designated as instruction only, data only, or unified. For our work, we assume highly configurable, private, separate level one (L1) instruction and data caches, however our methods can be extended to consider additional levels of cache. Figure 1 depicts our configurable cache architecture, which is based on the configurable cache proposed by Zhang et al. [11]. This configurable cache provides runtime-configurable total cache size, associativity, and line size using a small, hardware-settable bit-width configuration register. Configurable associativity is achieved by logically concatenating ways, configurable size is achieved by shutting down ways, and configurable line size is achieved by fetching additional physical cache lines for larger, logical line sizes. We elaborate on the achievable design space given this configurability in Section 4.1.
2.3. SPEA2 Algorithm
Evolutionary algorithms use biological evolutionary concepts—such as population, reproduction, mutation, selection, etc.—to efficiently determine Pareto optimal solutions to multi-objective optimization problems. The algorithm features a solution space that contains all of the possible solutions to the optimization problem. A subset of the solution space is referred to as a population; and a population’s solutions are referred to as individuals. A solution’s fitness represents the solution’s quality and how well the solution satisfies design constraints. Evolution iterates over successive generations of populations. Each evolution evaluates the fitness of individuals within the populations, and replaces the least fit individuals with new solutions from the solution space. To create the successive generation, random solutions are interjected from the solution space.
We leverage the SPEA2 since it has been shown to be a highly efficient evolutionary algorithm for solving multi-objective optimization problems [14]. SPEA2 uses the notion of elitism, which an archive comprising of an external set of non-dominated solutions. A non-dominated (or Pareto optimal) solution is a solution in which none of the design objectives can be improved without degrading another design objective. For example, given two configurations and , dominates (written as ) if and only if:
where k is the number of objectives, represents the design objective functions, and represents how well satisfies the design objectives.
SPEA2 takes the solution space as input, and outputs the Pareto optimal solution set. SPEA2 generates an initial population, creates an empty archive, and populates the first generation’s archive with the non-dominated individuals in the initial population. For subsequent generations, SPEA2 calculates the fitness of each individual within each population and archive, and populates the next generation’s archive with the non-dominated individuals from the population and archive. When the maximum number of generations has been reached and/or number of solutions that satisfy the design objectives have been determined, the current archive contains the Pareto optimal set. We refer the reader to [14] for additional details on the SPEA2 algorithm.
3. Temperature-Aware Phase-based Tuning (TaPT)
Previous research [24] on power and thermal management techniques have showed an intersection between power and thermal management hardware mechanisms. Most hardware mechanisms for power management can be leveraged for thermal management, since power reduction can also lead to temperature reduction. Thus, thermal management need not be a complex or high-overhead process, since the microprocessor designers typically do not need to adopt additional hardware specifically for thermal management. Since hardware mechanisms that can be leveraged for power management are commonly available in modern-day microprocessors, these mechanisms can also be leveraged for thermal management with new algorithms and management policies. However, thermal/power management techniques must consider and limit incurred performance degradations and/or increases in energy consumption.
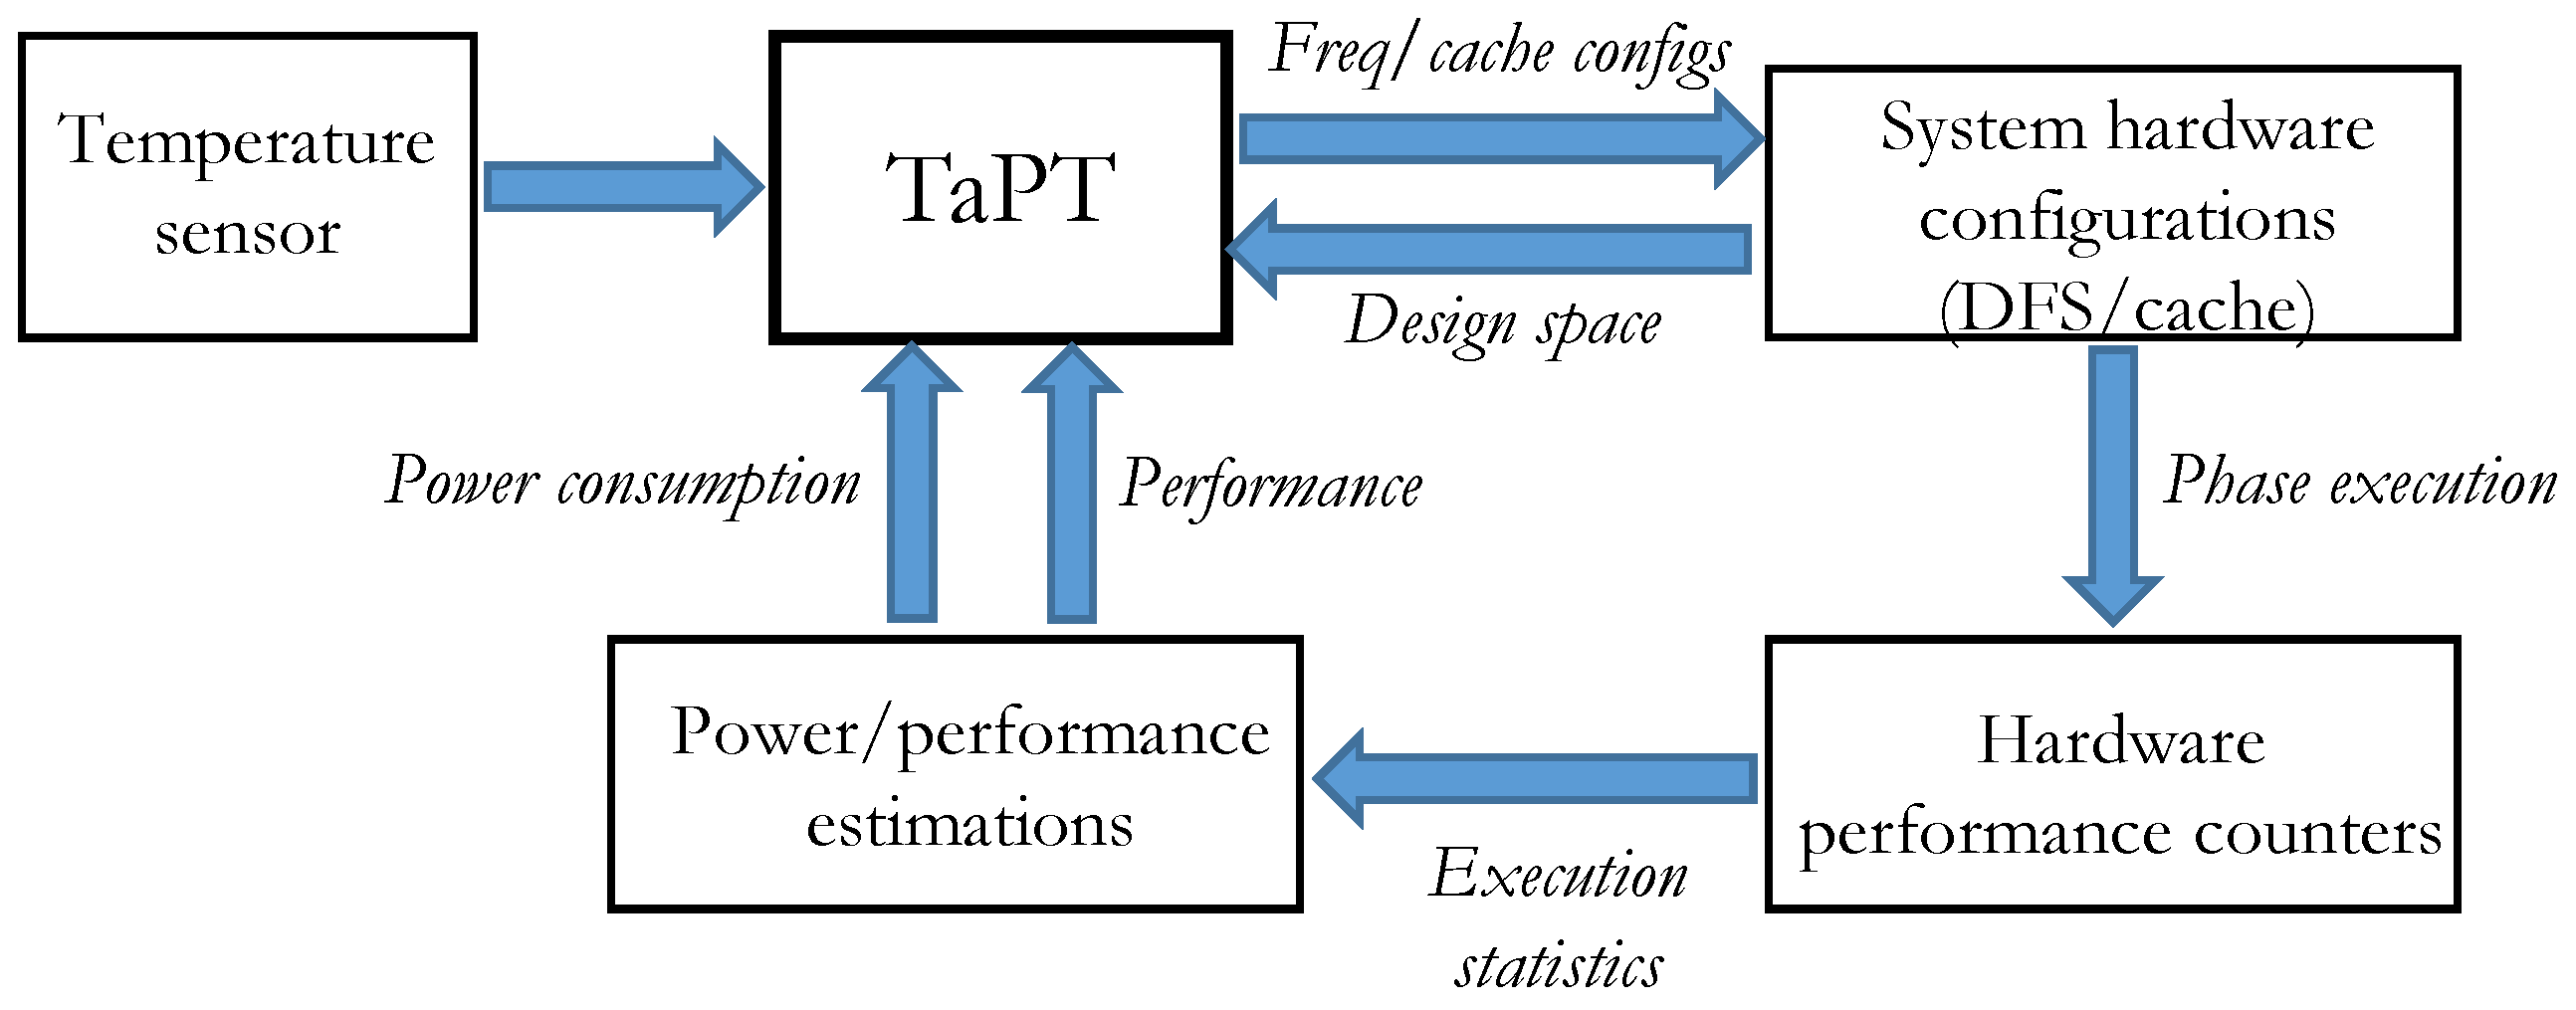
TaPT leverages several fundamental assumptions based on mechanisms that have been widely studied and implemented in embedded systems [11,26]. Figure 2 depicts TaPT’s synergistic interactions with different system components to dynamically optimize the system. We assume that DFS is enabled, and the system features a configurable cache with tunable size, associativity, and line size. We also assume that the system has temperature sensors that can be read by a continuous system telemetry mechanism for collecting and analyzing sensor data. Most current microprocessors contain hardware performance counters that generate execution statistics, such as cache miss rates, instructions per cycle, etc. These statistics are used in combination with low-overhead analytical models to estimate the power/energy consumption and performance [26], which are used by the TaPT characterization algorithm for determining the best configurations.
TaPT can be implemented as a software subroutine using the system’s microprocessor, which enables easy system integration with state-of-the-art microprocessors. However, a software implementation can affect the system cache and applications’ runtime behaviors due to context switching. These effects can cause TaPT to choose non-optimal, inferior configurations. Alternatively, TaPT can be implemented using non-intrusive, low-overhead custom hardware, with minimal negative impact on the system’s area, energy, and performance. Due to the advantages of the hardware implementation, we assume the hardware approach for implementing TaPT. In this section, we present an overview of TaPT and details of the TaPT architecture and algorithm.
3.1. TaPT Overview
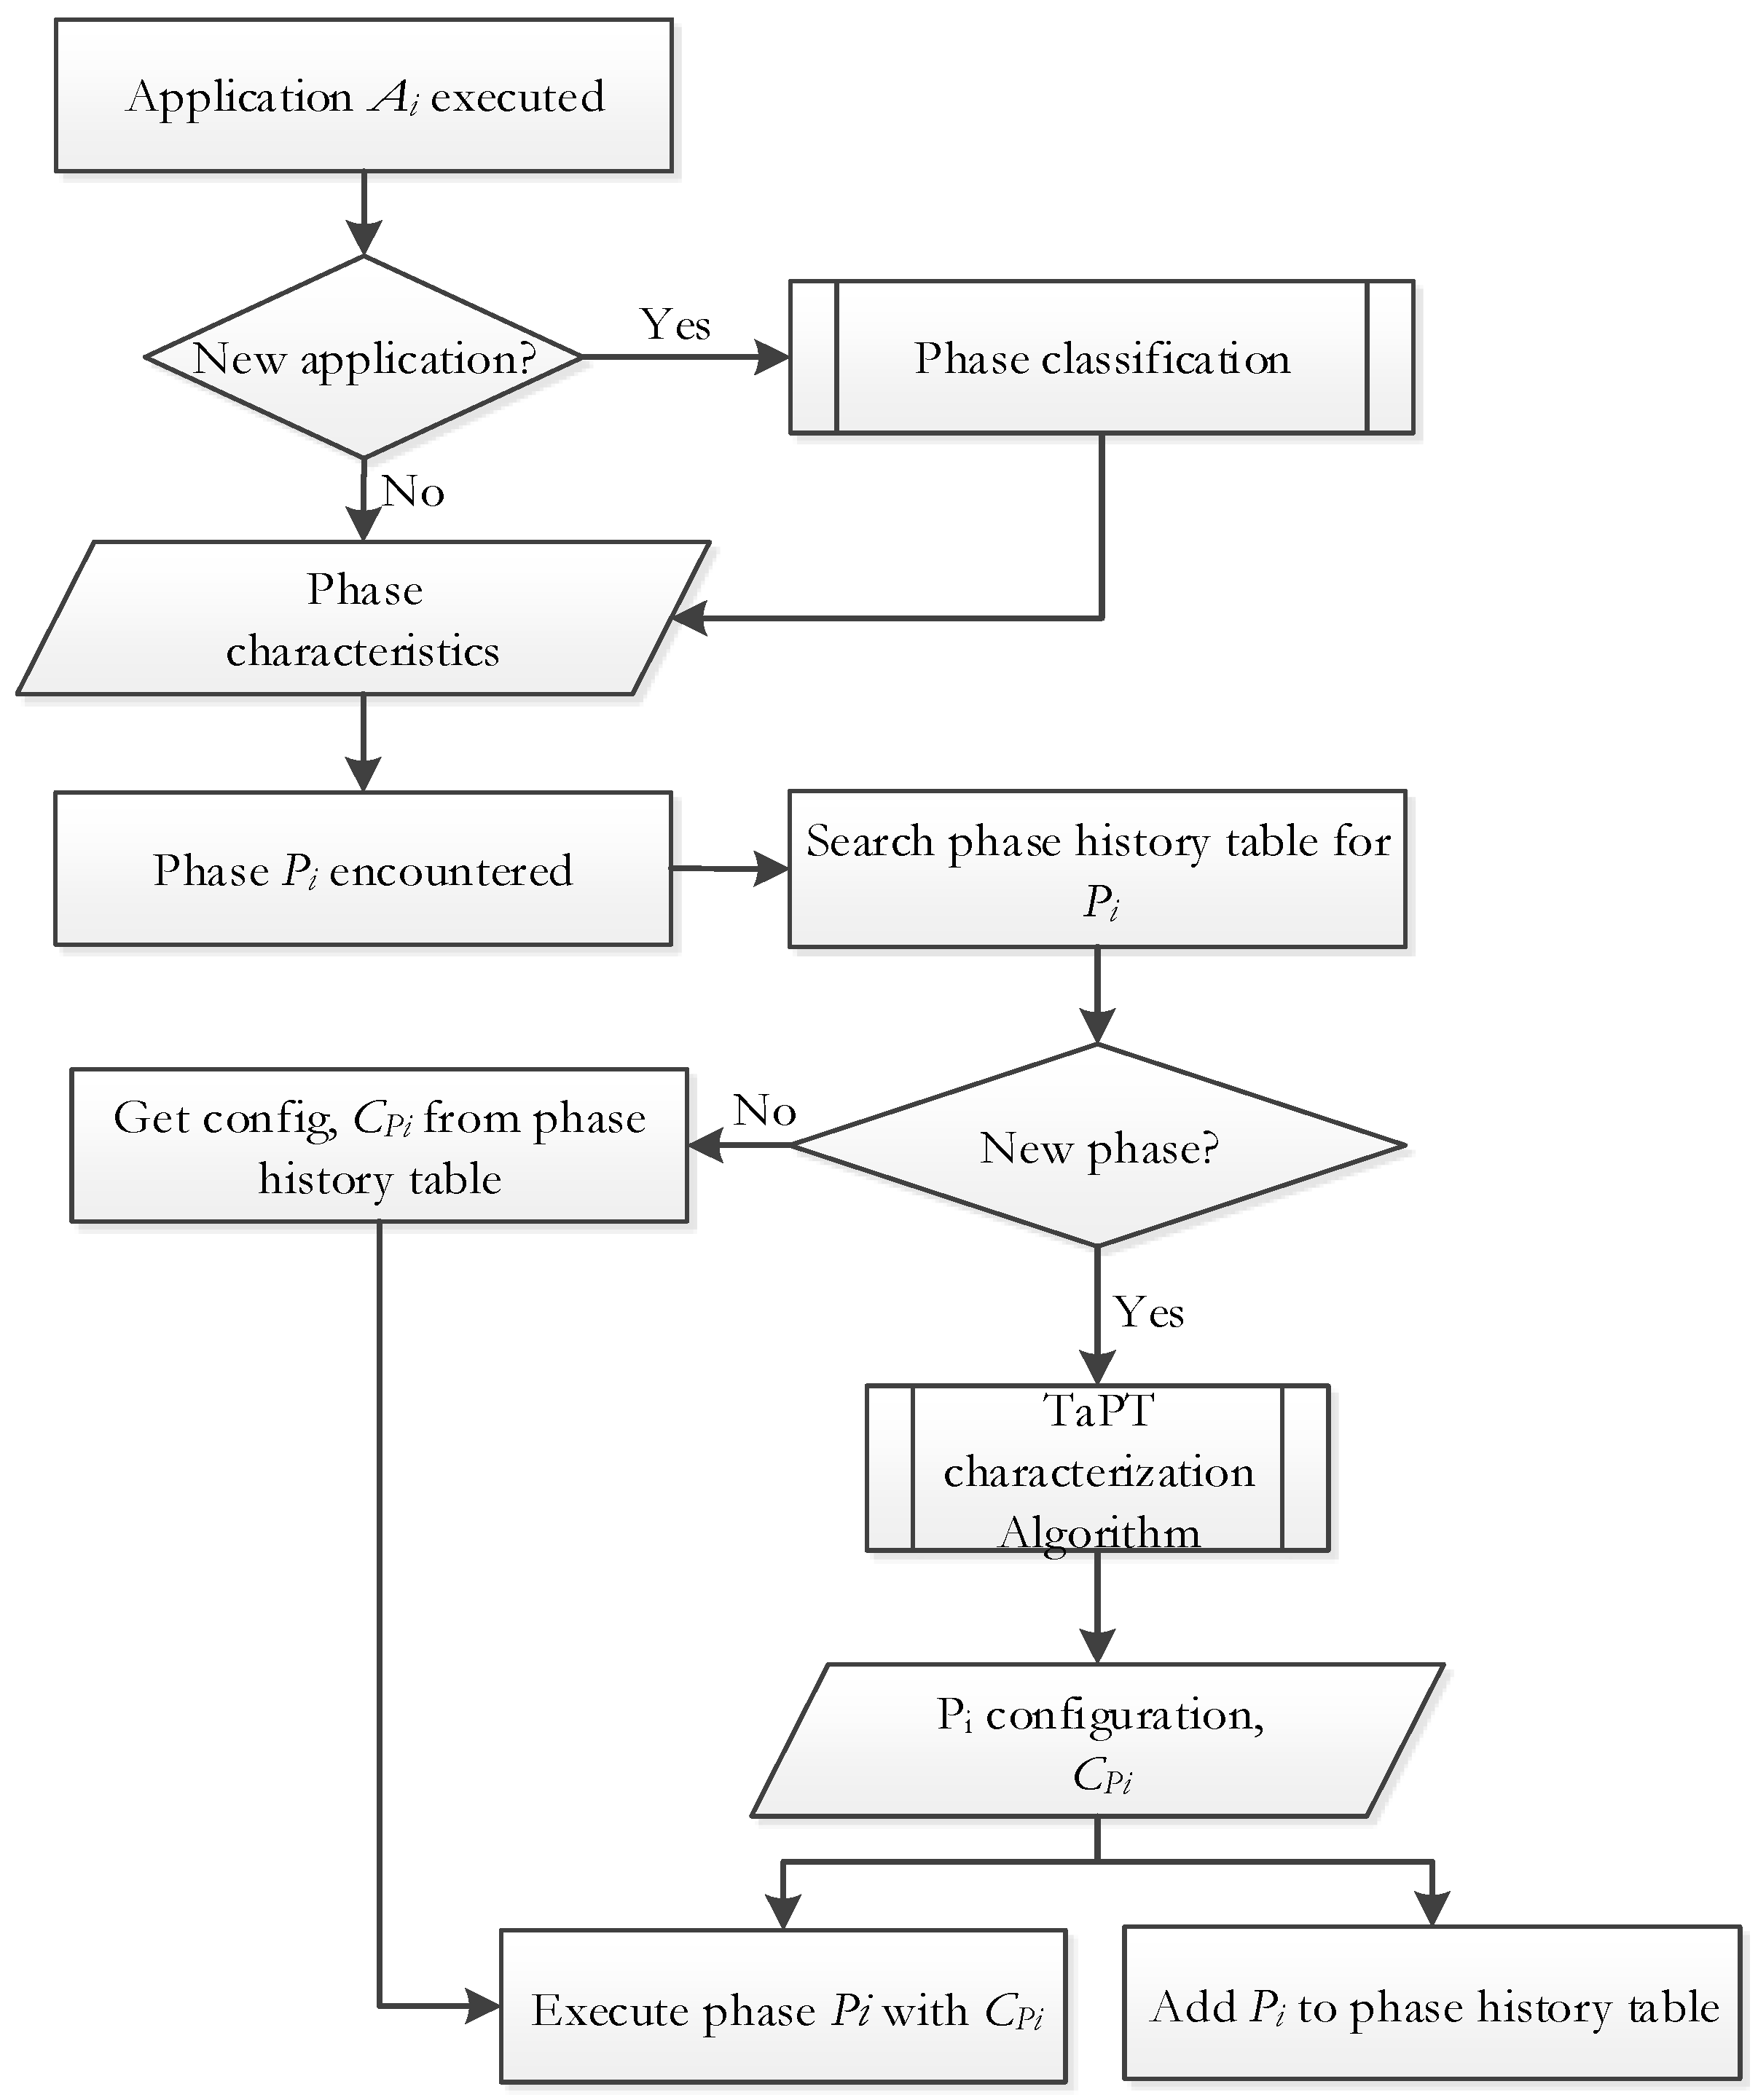
Figure 3 depicts an overview of TaPT. When an application is executed, TaPT determines whether or not the application has been previously characterized (i.e., the best configurations for the application’s phases have been determined). If the application is new, TaPT classifies the application’s phases. TaPT classifies the phases by montoring application execution on the base configuration, during which the application execution statistics (e.g., IPC, instruction and data cache miss rates, etc.) are gathered at tuning intervals from the microprocessor’s hardware performance counters. The tuning interval can be measured in number of executed instructions (e.g., 1 million instructions) or in time. For our experiments, we used tuning intervals of 10 ms, which we empirically determined to be sufficient to gather stable execution statistics. Execution lengths with similar execution characteristics are clustered [27] to form phases, and these phases’ characteristics are then used in the rest of the algorithm to determine the phases’ best configurations.
To minimize tuning overhead, TaPT only tunes distinct phases and uses the determined configurations for re-occurrences of that phase. To store information about previously executed phases, including their best configurations, TaPT features a low-overhead phase history table. When a phase is executed, if is in the phase history table, has been previously executed— is a not new phase—and the system is reconfigured to the stored best configuration , which is then used to execute . Otherwise, if there is no entry for in the phase history table—i.e., is a new phase—TaPT determines ’s best system configuration using the characterization algorithm (Section 3.3). is then stored in the phase history table for subsequent executions of , and is executed using .
3.2. TaPT Architecture
Figure 4 depicts the TaPT architecture for a sample dual-core system, which can be extended to any n-core system. The on-chip components include processing cores that are connected to the L1 caches and the TaPT module. Without loss of generalization, we assume that the L1 caches are directly connected to off-chip main memory, and since this hierarchy implies that there is no dependence between the caches, the caches can be tuned independently. We note that this is a viable assumption with respect to current state-of-the-art microprocessors [4].
The TaPT module includes a cache tuner, a DFS controller, a phase classification module, and a phase history table. The cache tuner [15] and DFS controller [28] interface with the caches and processing cores to set cache configurations and clock frequencies, respectively, as determined by the TaPT algorithm (Section 3.3). The phase classification module uses execution statistics from the cores’ hardware counters to classify an application’s execution into phases at runtime, and the phase history table stores cache configurations and clock frequencies of previously executed phases for subsequent execution of those phases. We discuss details of the hardware overheads in Section 3.4.
3.3. TaPT Characterization Algorithm
The characterization algorithm determines each phase’s best configuration that emphasizes designer-specified optimization priorities. Alternatively, when no priority is specified, the algorithm determines Pareto optimal configurations that automatically emphasize the energy delay product (EDP), to account for both energy consumption and execution time, while also reducing the temperature and/or preventing significant temperature increase.
TaPT allows the designer to prioritize optimization of execution time, energy, and temperature through priority settings and respectively. When a priority setting is selected, TaPT efficiently determines the best system configuration for a phase while adhering to designer-specified constraints. The priority settings trade off the non-prioritized design objective in favor of the prioritized design objective. For example, N, which prioritizes energy optimization, trades off increased execution time and increased temperature for minimized energy. Alternatively, X trades off energy consumption and temperature to prioritize execution time. If the designer does not specify a priority, the priority setting defaults to S, which prioritizes the EDP. To increase optimization flexibility, TaPT also allows the designer to associate a peak temperature threshold with each priority setting. Thus, when the designer specifies a temperature threshold, TaPT determines Pareto optimal configurations that do not exceed the threshold while optimizing other optimization goals.
To ensure equal probability of selection for all configurations when generating the population, TaPT uses random uniform distribution. On system startup, since there are no previously executed phases, the initial archive is an empty set. TaPT generates ’s archive from ’s population’s and archive’s non-dominated configurations (Equation (1)) using the configurations’ fitness and stores ’s final archive in the phase history table. A configuration ’s fitness is the sum of ’s dominators’ strengths, and a configuration’s ’s strength is the number of configurations dominated by that configuration such that:
where P and A are ’s population and archive, respectively. ’s fitness is:
where indicates that is non-dominated.
To implement phase-based tuning, TaPT calculates the phase distances [29] between the currently executing phase and all of the previously executed phases . The phase distance is the difference between two phases’ characteristics. In previous work, where we used phase distances for tuning cache configurations, we used the normalized difference between two phases’ cache miss rates to calculate the phase distance between those phases. Using a single execution characteristic (e.g., cache miss rates) to calculate phase distances suffices when only one hardware parameter (e.g., cache configurations) is being tuned. However, when multiple hardware parameters that affect multiple execution characteristics are tuned, the phase distance must be computed using a multidimentional distance metric for accurate representation.
Since TaPT tunes multiple hardware parameters (instruction and data cache configurations, and clock frequency), TaPT calculates the phase distance using the Euclidean distance between the instruction cache miss rate (iMR), data cache miss rate (dMR), and the instruction per cycle (IPC). The phase distance D between two phases and is:
TaPT uses the most similar phase’s archive as the currently executing phase ’s initial archive. The most similar phase is the phase with the minimum distance D from . Our premise for using the most similar phase’s archive as ’s initial archive is based on the fact that phases with stable characteristics require similar configurations. Thus, rather than starting with an archive from a randomly generated initial population, ’s initial archive starts the TaPT algorithm with solutions that are presumably closer to ’s Pareto optimal solutions.
Algorithm 1 depicts the TaPT algorithm, which executes for each new phase . The inputs to the algorithm are the number of previously executed phases n, a designer-specified population size s, archive size , number of generations G, and priority setting Q. The algorithm’s output is ’s best system configuration. The maximum number of configurations explored during tuning is defined as the product of s and G; specifies the archive size, and ensures that only the most fit configurations (Equations (2) and (3)) are stored in the archive.
Due to the nature of evolutionary algorithms, the archive may not necessarily contain the actual Pareto optimal solutions. In general, larger s and G values determine solutions that are closer to the Pareto optimal solutions, at the expense of increased tuning overhead. Alternatively, smaller s and G values reduce tuning overhead, at the expense of less accurate configurations that are farther from the Pareto optimal solutions. We extensively analyzed different values of s, G, and , and observed that s and G values that explored 4% of the design space and yielded an efficient balance between determining Pareto optimal solutions and reduced tuning overhead.
As shown in Algorithm 1, TaPT first generates an initial population from the configuration space, after which it calculates the phase distance D between the currently executing phase and all of the previously executed phases (lines 2–8). After determining the most similar phase (i.e., the phase with the minimum distance D from ), TaPT initializes ’s archive to the most similar phase’s archive, (line 9). At system startup (), there are no previously executed phases (), and the archive is initialized to an empty set (lines 10–11). For each generation, TaPT uses the previous generation’s Pareto optimal set as the current generation’s initial archive (line 15). TaPT calculates the fitness of the configurations in each population and archive using Equations (2) and (3), and updates the current generation’s archive with the non-dominated configurations (lines 17–21). To maintain the size of ’s archive at , TaPT discards the least fit configurations or adds the most fit configurations from the population (line 22).
| Algorithm 1 TaPT Algorithm |
| Input: |
Output: ’s best configuration
|
When the final generation is reached, TaPT selects the best configuration from the archive that optimizes the designer-specified priority setting (line 24). Finally, TaPT stores in the phase history table (Figure 4) for ’s subsequent executions.
3.4. Computational Complexity and Hardware Overhead
TaPT calculates and with worst-case time complexity , where m is the sum of the population and archive sizes. TaPT calculates D with worst-case time complexity , where n is the number of previously executed phases. Since these calculations dominate TaPT, TaPT results in minimal computation overhead. Furthermore, TaPT utilizes previously proposed and implemented hardware, such as the phase history table [30] and the DFS controller [28], which have been shown to incur insignificant hardware overhead with respect to the microprocessors. To further evaluate TaPT’s hardware overhead, we also designed a scalable and efficient cache tuner using synthesizeable VHDL and synthesized with Synopsys Design Compiler [31]. Our cache tuner constitutes an average area overhead of 4.73% with respect to a MIPS32 M4K microprocessor [32] and less than 1% with respect to the ARM Cortex-A15.
4. Experiments
4.1. Experimental Setup
We evaluated TaPT’s execution time, energy, EDP, and temperature savings by comparing the results obtained using TaPT’s configuration to those obtained by a base with a fixed system configuration. The base system had 32 Kbyte, 4-way private level one (L1) instruction and data caches with 64 byte line sizes, and a 2 GHz operating core frequency. This configuration provides a good base comparison to commercial off-the-shelf (COTS) system, due to its similarity to current embedded systems [4].
We modeled an embedded processor architecture consisting of a 4-width out-of-order issue processor with 8 pipeline stages. Our experiments represent state-of-the-art embedded systems, and our results and analyses extend to future and/or more complex systems (e.g., n-core processors, heterogeneous systems, etc.) because TaPT is independent of these system characteristics. The processor’s configurable instruction and data caches featured 8 to 32 Kbyte sizes, 16 to 64 byte line sizes, and 1- to 4-way set associativity, all in power-of-two increments. The processor offered seven clock frequencies ranging from 800 MHz to 2 GHz in 200 MHz increments. Given these parameter values, the design space contains 1701 configurations.
We used GEM5 [33] to model the processor and generate execution statistics (e.g., cache miss rates, execution cycles, etc.), which we used to calculate the execution time. We used McPAT [34] to calculate the system’s total energy consumption and EDP based on the execution statistics obtained from GEM5. We modeled the system temperature using Hotspot 5.0 [2], a popular thermal modeling tool. Using this tool, we measured the average temperature using a floorplan and silicon chip area similar to the ARM Cortex A9 processor [4]. We ran thermal simulations and sampled the application’s power consumption at 10 ms intervals, similar to modern operating systems (e.g., Linux) [35]. Previous work showed that this fine-grained sampling accurately depicted the application’s temperature characteristics during execution [35]. To model an embedded system without cooling mechanisms, such as a heat sink and/or spreader, we set the convection resistance to 4K/W and the heat sink and spreader thickness to 1 mm and 0.1 mm, respectively; these values are considered negligible in Hotspot.
To represent a variety of real-world embedded system applications, we used seventeen benchmarks: twelve EEMBC Automotive benchmarks [36] and five MiBench benchmarks [37] selected to represent different application domains. The benchmarks were specific compute kernels performing specific tasks in different application domains, such as networking, image processing, security, etc. To implement phase classification, we ran execution trace simulations on each benchmark using GEM5 to generate cache miss rates and IPC statistics, and grouped intervals with similar characteristics as phases using variable-length intervals, which previous work found to be effective for phase classification [38]. Since the benchmarks were specific compute kernels, our experiments revealed that the benchmarks’ characteristics were relatively stable throughout execution. Without loss of generality, this stability enabled us to consider each kernel/benchmark as a different execution phase.
4.2. Temperature Impact of Cache Configurations
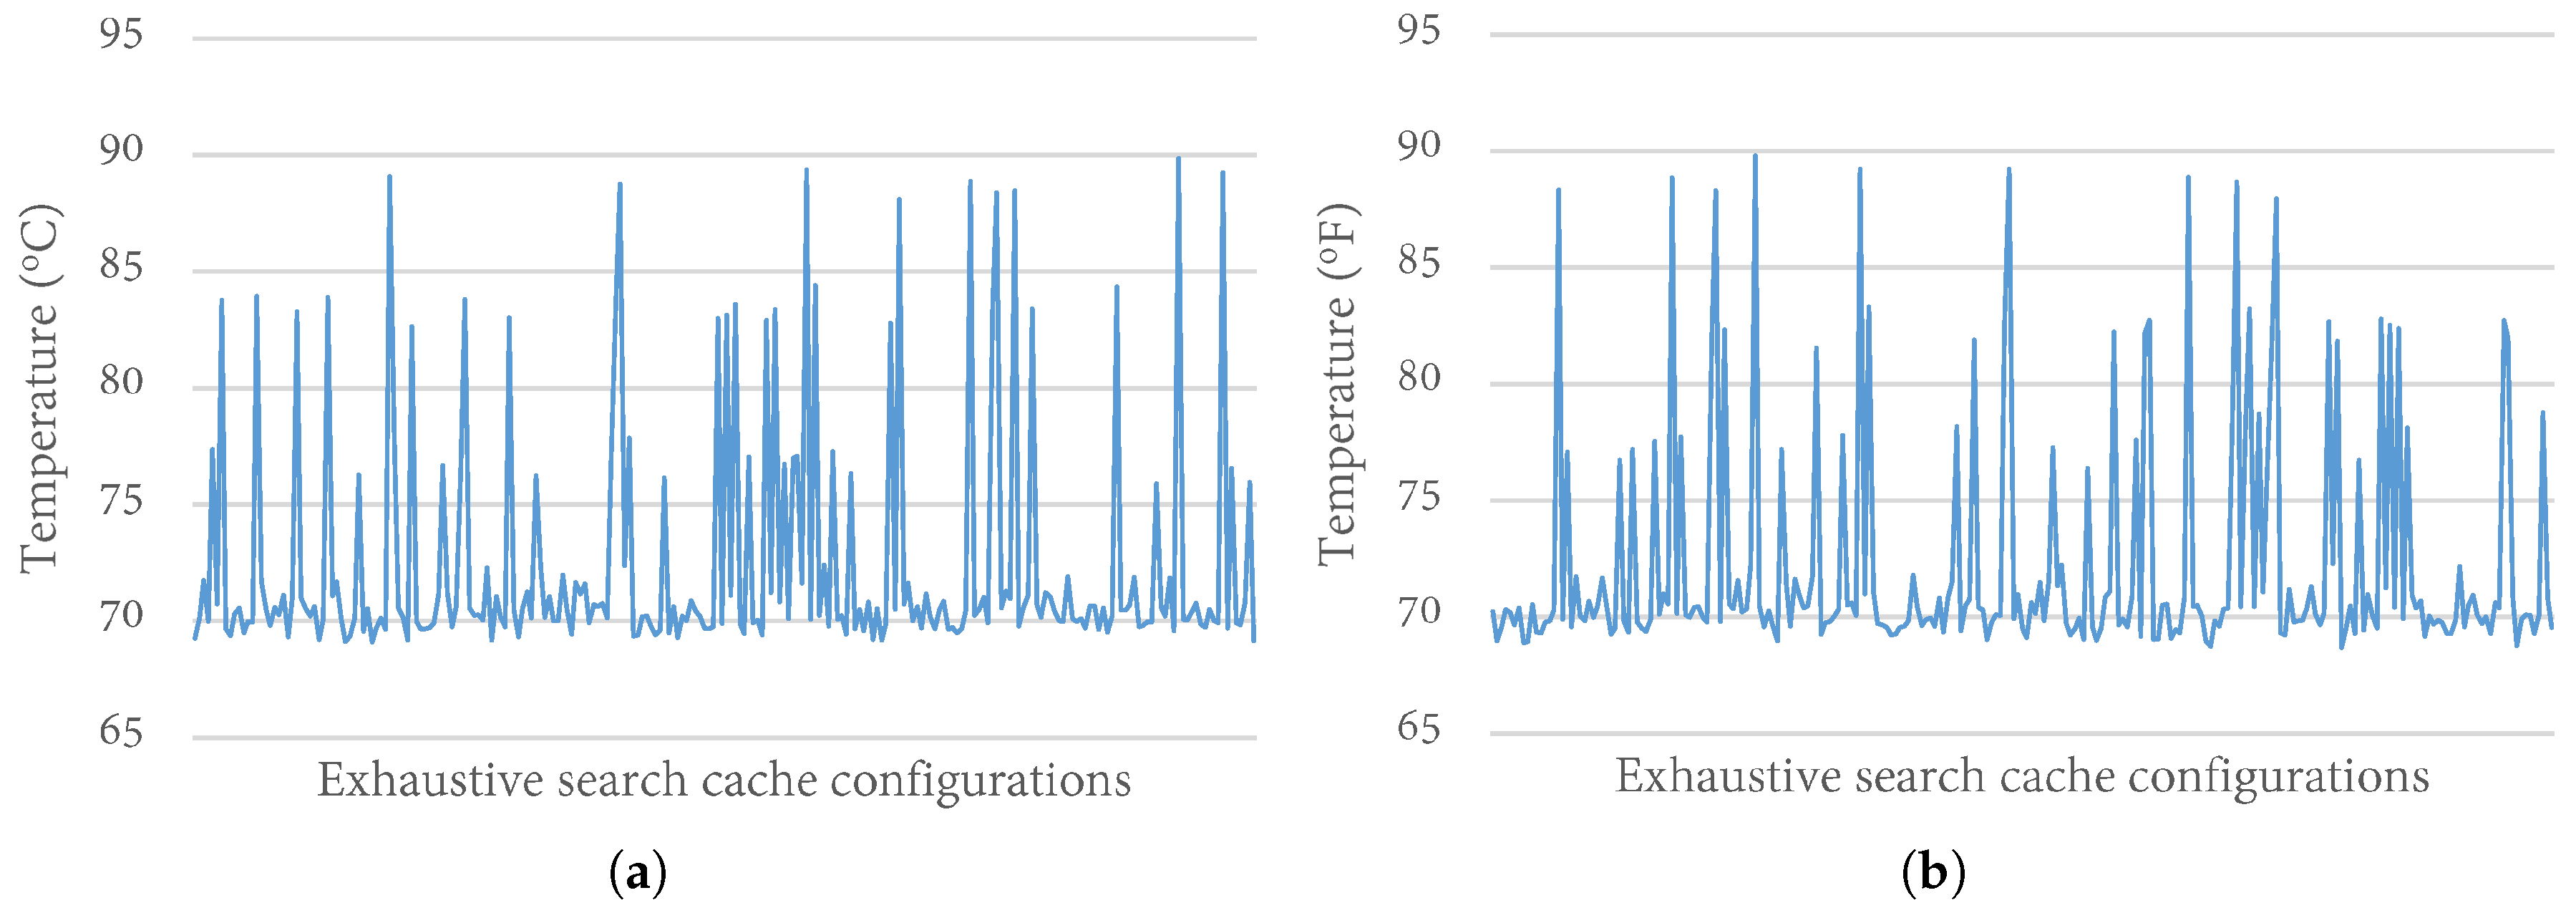
To evaluate the impact of variable cache configurations on the system’s temperature, we extensively analyzed the temperature variations over exhaustive executions of the cache configurations in our design space (Section 4.1). We executed all seventeen benchmarks for 240 possible cache configurations. For brevity, we only present results for exhaustive executions from one benchmark each from the EEMBC and MiBench benchmark suites— and , respectively. The benchmarks represent variations of compute intensity, where and represent applications with low and high compute intensity, respectively. We observed similar trends across the other benchmarks.
Figure 5 depicts the temperature variations over all the cache configurations in the design space for and with the clock frequency set at 2 GHz. In general, the peak temperatures ranged from 69 °C to 90 °C, with a standard deviation of 5. As expected, the base configuration, with the largest cache configuration had the highest temperature. Since the impact order of cache parameters on energy consumption has been widely used for developing cache tuning heuristics for energy consumption [11,39], we also analyzed the trend in temperature changes as the cache configurations changed. We observed that the temperature changes did not follow the same trend as energy changes. This observation implies that previous knowledge of the impact order of cache parameters on energy consumption does not apply to temperature optimization.
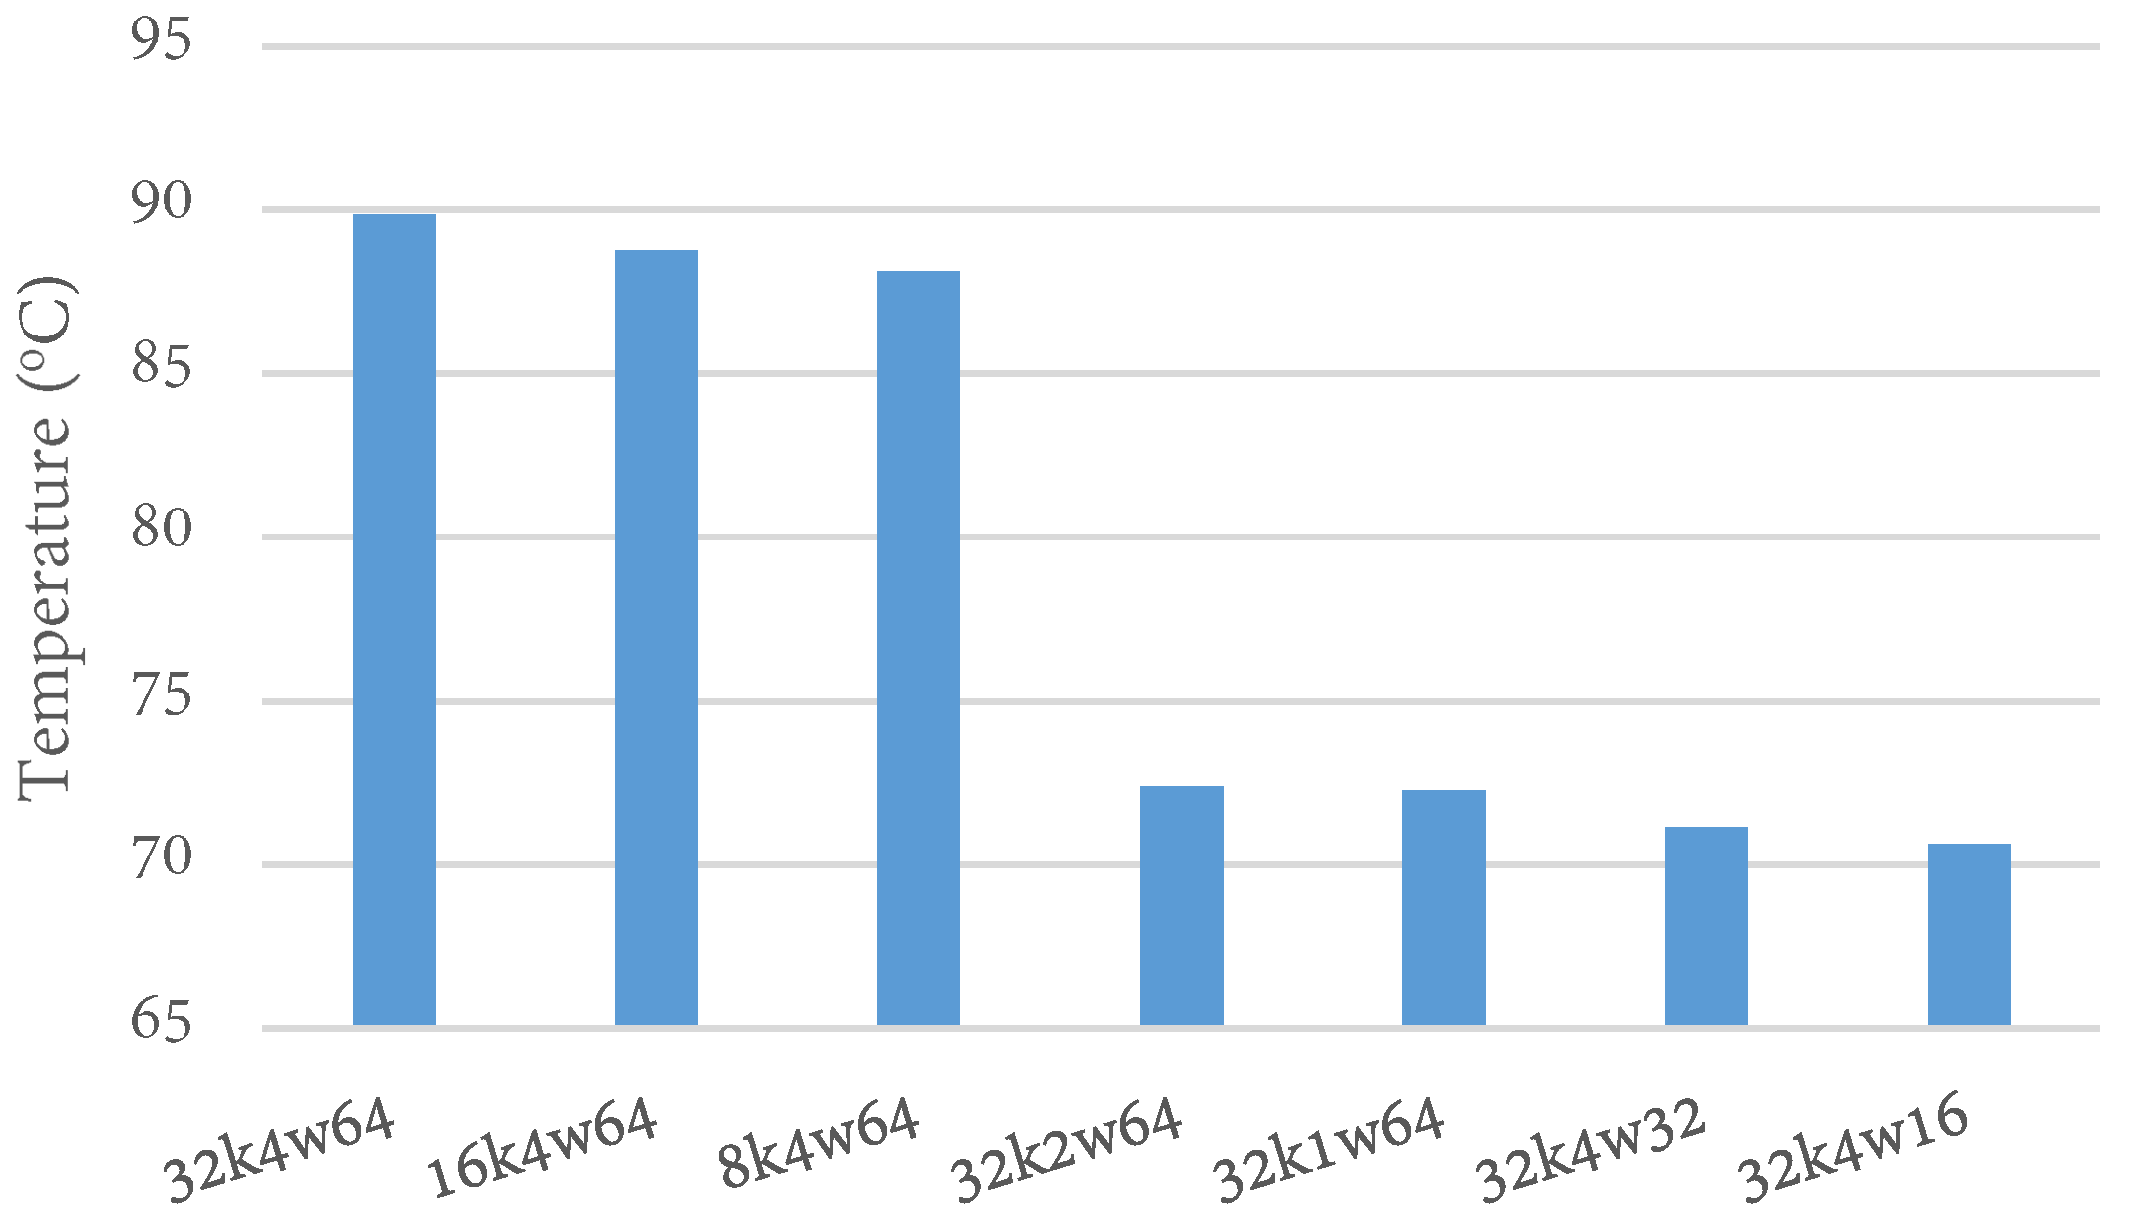
Thus, we explored how changes in cache parameter values (cache size, line size, and associativity) affected the temperature with respect to the base configuration. To provide a clearer picture of the impact of each cache parameter value, we varied each parameter value while keeping the others constant. Figure 6 shows the temperatures when the cache parameter values were changed from the base configuration. Surprisingly, reducing the cache size from 32 KB to 16 KB and 8 KB only marginally reduced the temperature by 1.1 °C (1% reduction) and 2 °C (1.7% reduction), respectively. While these apparently insignificant reductions may be impactful over a long period of time, the small change was unexpected, especially since the cache size usually has the largest impact on other optimization goals, such as energy and execution time.
Unlike the cache size, the associativity and line size had much larger impacts on the temperature. Reducing the associativity from 4-way to 2-way and 1-way (with all other parameters at the base values) reduced the temperature by 15.7 °C (18% reduction) and 15.8 °C (18% reduction), respectively. Reducing the line size from 64B to 32B and 16B reduced the temperature by 16.9 °C (19% reduction) and 17.5 °C (20% reduction), respectively. Reducing the associativity and line size from 2-way to 1-way and from 32B to 16B yielded marginal temperature reductions in both cases (less than 1 °C). Our results reveal that the cache line size has the largest impact on temperature, followed by the associativity, and then the cache size. The parameter with the largest impact would likely be the best to tune first. Furthermore, this insight can inform the tradeoffs involved in developing heuristics that tune multiple parameters.
4.3. TaPT Parameters
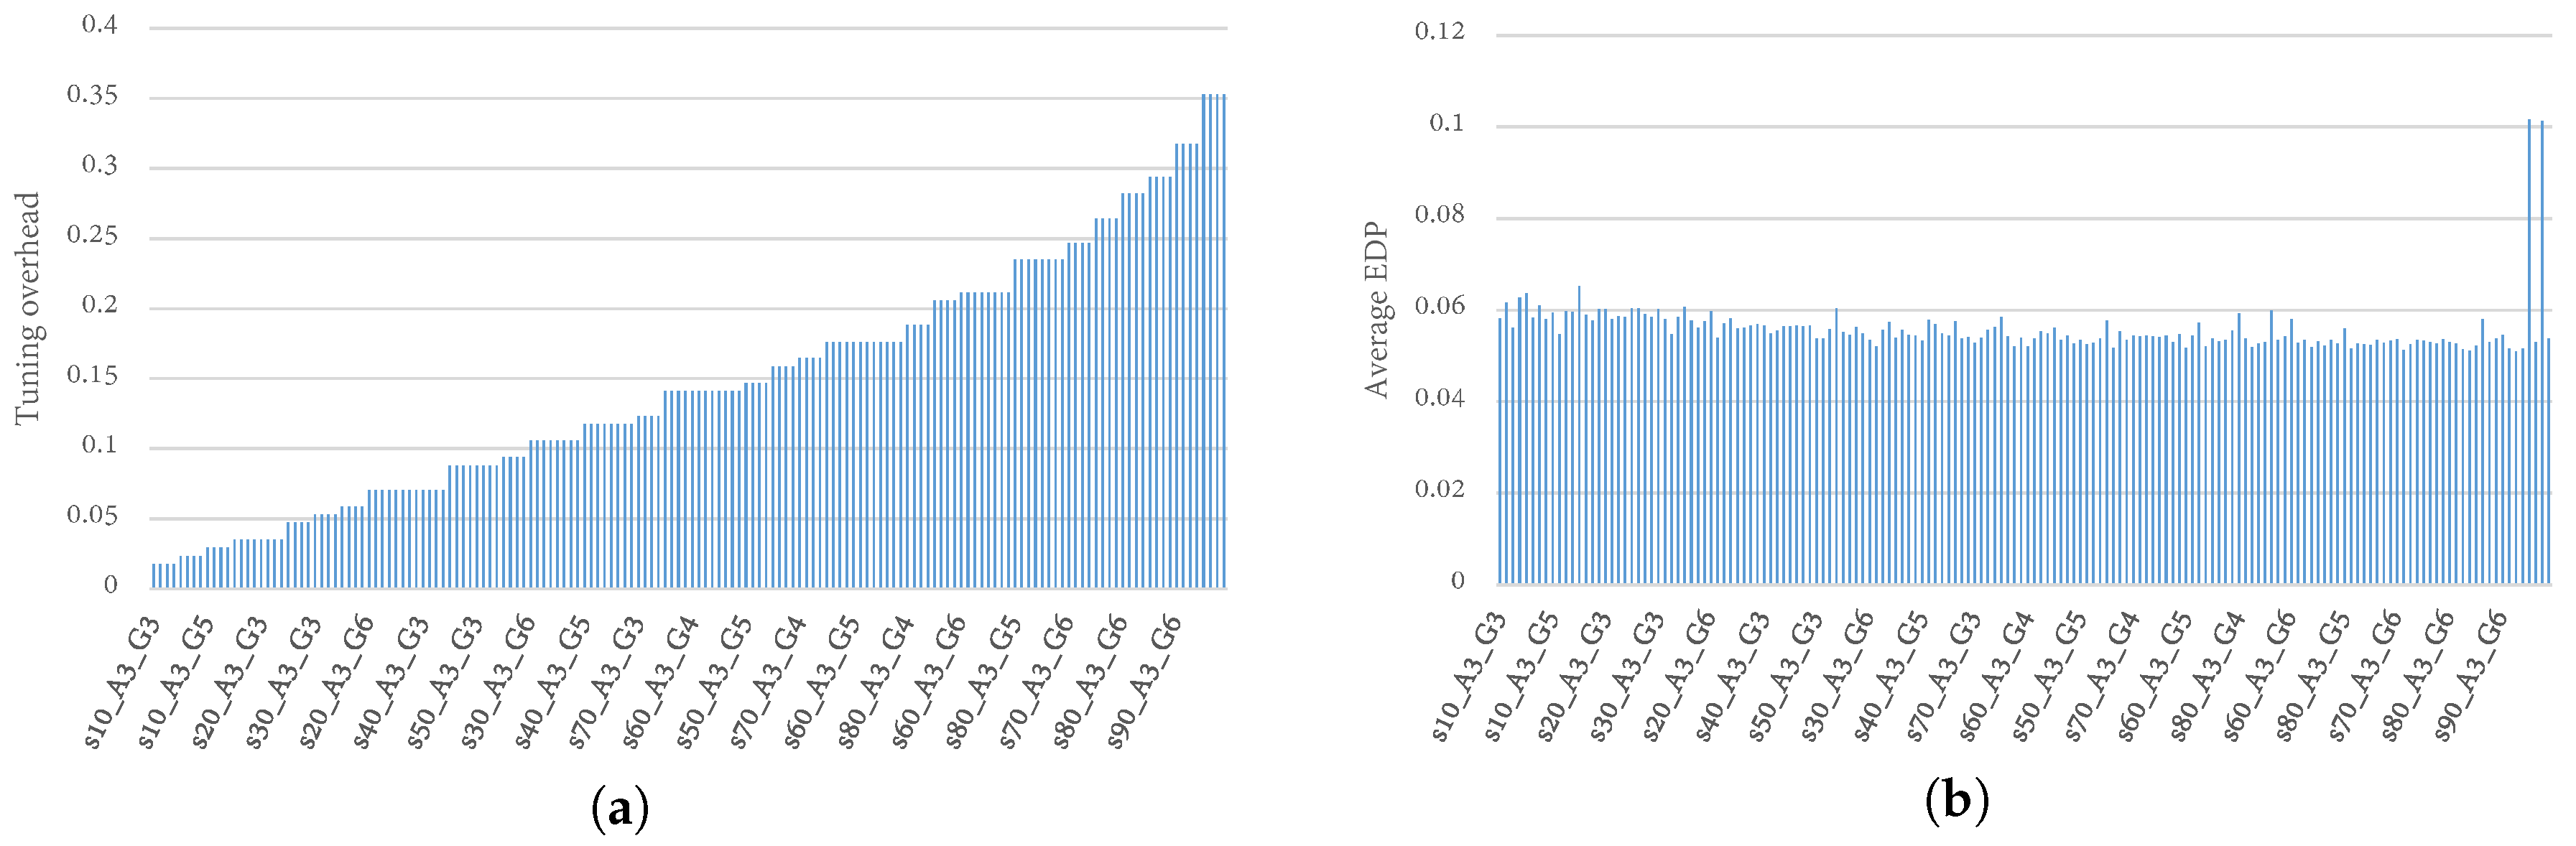
To determine appropriate values for , and , we conducted a sensitivity study to quantify the impacts of different values of , and on optimization efficiency. We explored a design space comprised of s ranging from 10 to 100 in increments of 10, and G and ranging from 3 to 6 in increments of 1, resulting in a total of 160 possible combinations. To represent optimization efficiency, we used the average energy delay product (EDP) achieved by the TaPT parameters while executing all our experimental benchmarks.
Figure 7a,b illustrates the relationships between the TaPT parameters, and the tuning overhead and EDP, respectively. The x axes represent the TaPT parameters, denoted as “”, where and z represent the population size, number of generations, and archive size, respectively. For brevity, not all the TaPT parameters are shown on the figures, however, the shown parameters are representative of all the TaPT parameters. Figure 7a shows that the tuning overhead increased steadily for the TaPT parameters, ranging from 2% to 35% tuning overhead. However, Figure 7b shows that an increase in tuning overhead did not necessarily result in EDP reduction. The EDP achieved by different TaPT parameters did not change significantly as the design space increased. Thus, we performed additional analysis to identify TaPT parameters that achieved sufficient tradeoffs between tuning overhead and optimization efficiency.
Our analysis revealed that s = 20, G = 3, and = 5 provided a good balance between Pareto optimal solutions and tuning overhead by exploring less than 4% of the design space. Larger values increased the tuning overhead without any substantial improvements to the Pareto optimal solutions. On the other hand, smaller values reduced tuning overhead, but achieved less accurate solutions. s and G are system dependent and can be scaled appropriately for different design spaces.
To explore several diverse design objectives, we modeled all of TaPT’s priority settings using s = 20, G = 3, and = 5. To evaluate the impact of designer-specified temperature thresholds lower than the base configuration’s average peak temperature of 89 °C (determined by simulation), we evaluated empirically-determined high and low temperature thresholds set at 82 °C and 65 °C, based on the range of temperatures observed during simulation. The high 82 °C threshold represents a system where the primary concern is for the temperature to be maintained below 82 °C to prevent damage from overheating; the low 65 °C threshold represents a system with strict temperature constraints, and illustrate how maintaining a low temperature impacts the other objective functions.
4.4. TaPT Optimization Results
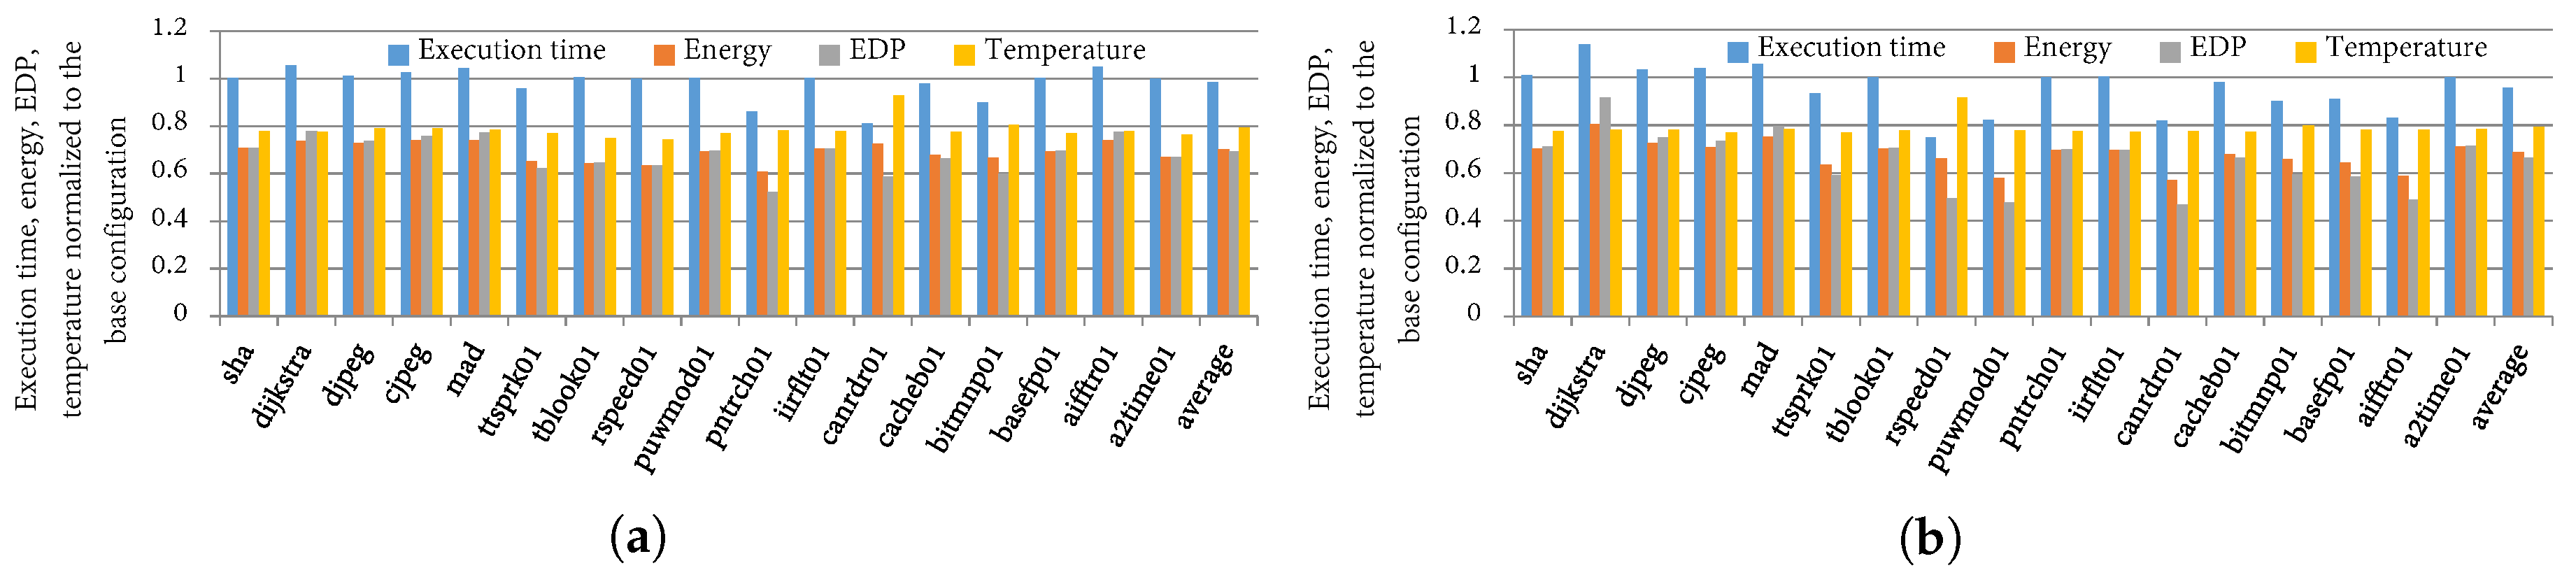
Figure 8 and Figure 9 depict the execution time, energy, EDP, and temperature of the best configurations as determined by TaPT normalized to the base system configuration for a single execution of each benchmark/phase for the different priority settings. Figure 8a illustrates the optimization benefits from TaPT’s default setting of S (EDP prioritization), which represents a system with no designer-specified priority or temperature threshold. On average over all the phases, the EDP, energy, execution time, and temperature reduced by 31%, 30%, 2%, and 21%, respectively. In the best cases, the EDP, energy, execution time, and temperature reduced by 48%, 35%, 19%, and 5%, respectively. For some phases, prioritizing EDP minimization only slightly reduced the temperature. For example, ’s EDP, energy, and execution time reduced by 40%, 27% and 18%, respectively, while reducing the temperature by only 8%. However, prioritizing EDP minimization increased the execution time for other phases by up to 6%, but significantly reduced the energy and temperature. For example, ’s EDP, energy, and temperature reduced by 23%, 26%, and 21%, respectively, while increasing the execution time by 4%. In general, priority setting S minimized the EDP, and reduced the energy consumption and temperature for all phases, with only minor increases in execution time for some phases.
Figure 8b depicts the average execution time, energy, EDP, and temperature savings for a priority setting N (energy prioritization) and an 82 °C temperature threshold. The execution time, energy, EDP, and temperature reduced by 4%, 31%, 34%, and 20%, respectively. We also evaluated TaPT’s optimization behavior within a temperature specified temperature constraint. We evaluated this behavior using an 82 °C temperature threshold, indicating that energy is minimized as long as the temperature does not exceed the threshold. Figure 10 depicts the phases’ peak temperatures with respect to the threshold temperature of 82 °C. TaPT maintained the temperature at or below 82 °C for all the phases, but did not minimize the temperature. The 82 °C threshold allowed for greater execution time, energy, and EDP reduction than a system that prioritized the temperature or one with a lower temperature threshold. This option is suitable for situations where the temperature constraints are known and can be specified by the designer.
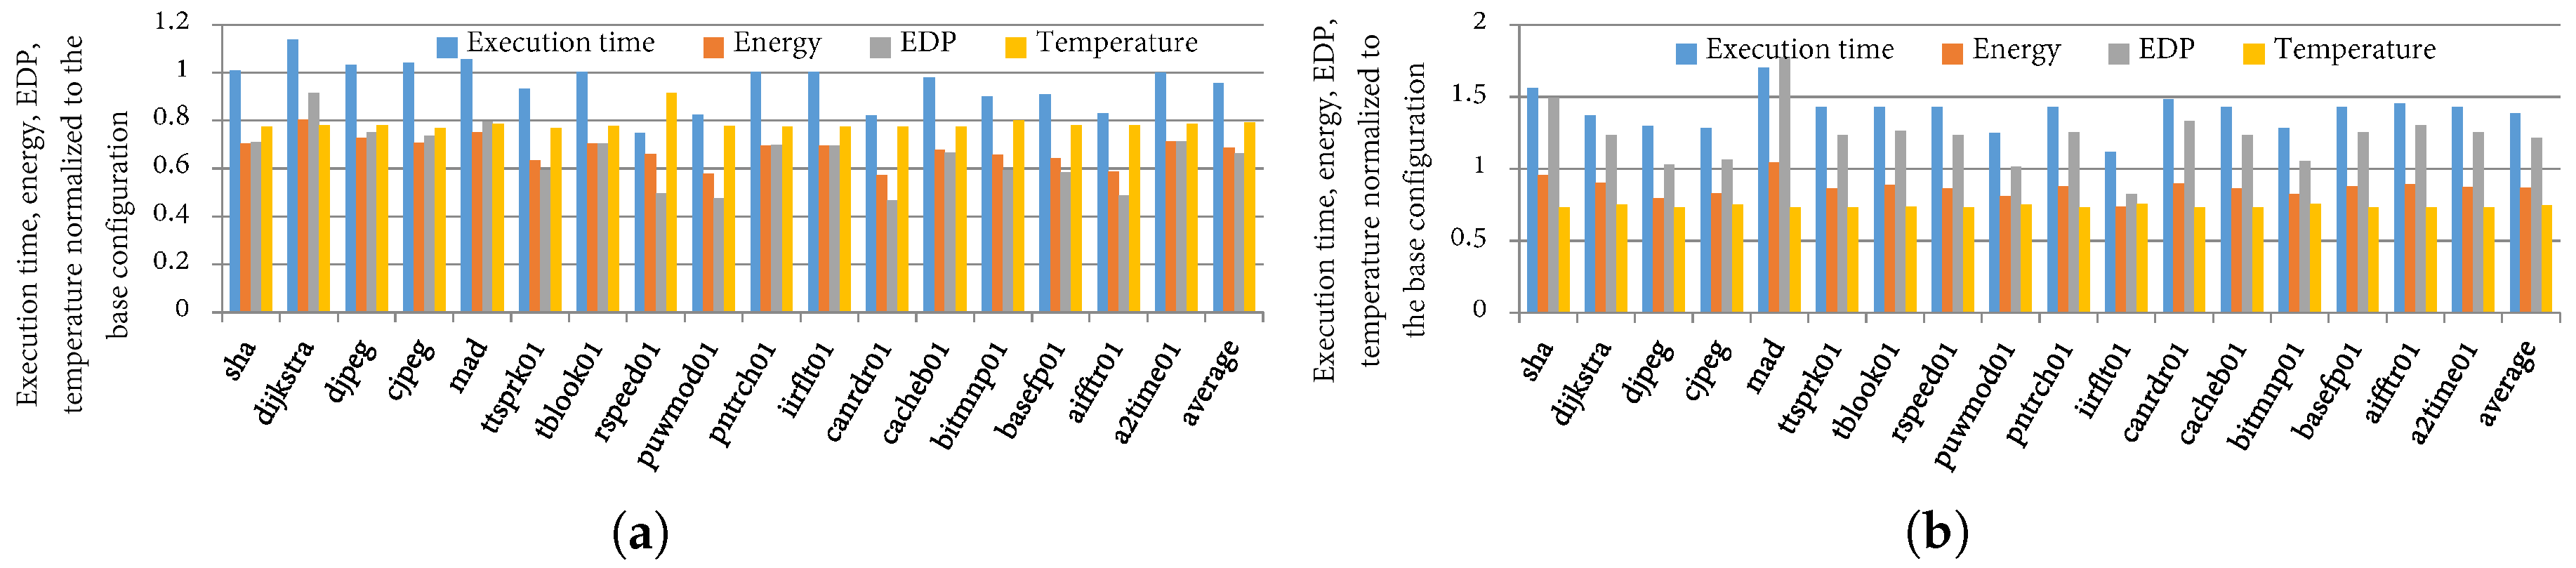
To illustrate TaPT’s optimization capabilities with a low temperature threshold and priority setting T (prioritize temperature), Figure 9a depicts the execution time, energy, EDP, and temperature savings with a 65 °C temperature threshold and priority setting T. On average, over all the phases, the energy and temperature decreased by 13% and 25%, respectively. However, as a result of the low temperature threshold, the execution time and EDP significantly increased by 39% and 22%, respectively. TaPT maintained the peak temperature within 65 to 68 °C for all the phases. However, TaPT traded off execution time and energy consumption in order to maintain this low peak temperature. Increasing the temperature threshold to 70 °C (results omitted for brevity) decreased the energy, EDP, and temperature by 27%, 26%, and 21%, respectively, while the execution time only increased by 2%. These results illustrate TaPT’s ability to trade off optimization goals in order to adhere to design constraints. The results also illustrate the potential conflict between different optimization goals; some optimization goals may be adversely affected in a multi-objective optimization scenario where one of the objective functions is significantly constrained.
Figure 9b shows that when using priority setting X (execution time prioritization) with no temperature threshold, TaPT reduced the execution time, energy, EDP, and temperature by 5%, 26%, 29%, and 16%, respectively. For some phases, the reductions were more significant. For example, TaPT significantly reduced ’s execution time, energy, EDP and temperature by 24%, 47%, 60%, and 22%, respectively. However, for some phases the execution time did not reduce. For example, ’s execution time increased by 5% while the energy, EDP, and temperature decreased by 36%, 32%, and 27%, respectively. We observed that even though TaPT achieved significant execution time improvement for some phases, the base configuration was the best for execution time optimization for most phases. Thus, TaPT attempted to reduce energy and temperature without significantly degrading the execution time. Overall, TaPT succeeded in trading off optimization goals, where necessary, in order to satisfy designer specified optimization priorities, without significantly degrading the other optimization goals.
4.5. Comparison to Prior Work
To further evaluate TaPT’s effectiveness, we compared TaPT to prior work using DFS or cache tuning in isolation. For both DFS and cache tuning, we used exhaustive search to determine the best configurations for each benchmark to represent the optimal configurations (i.e., best-case optimization scenarios). Similar to the previous experiments, we assumed priority settings, and X, where the prioritized setting was the optimal for both DFS and cache tuning.
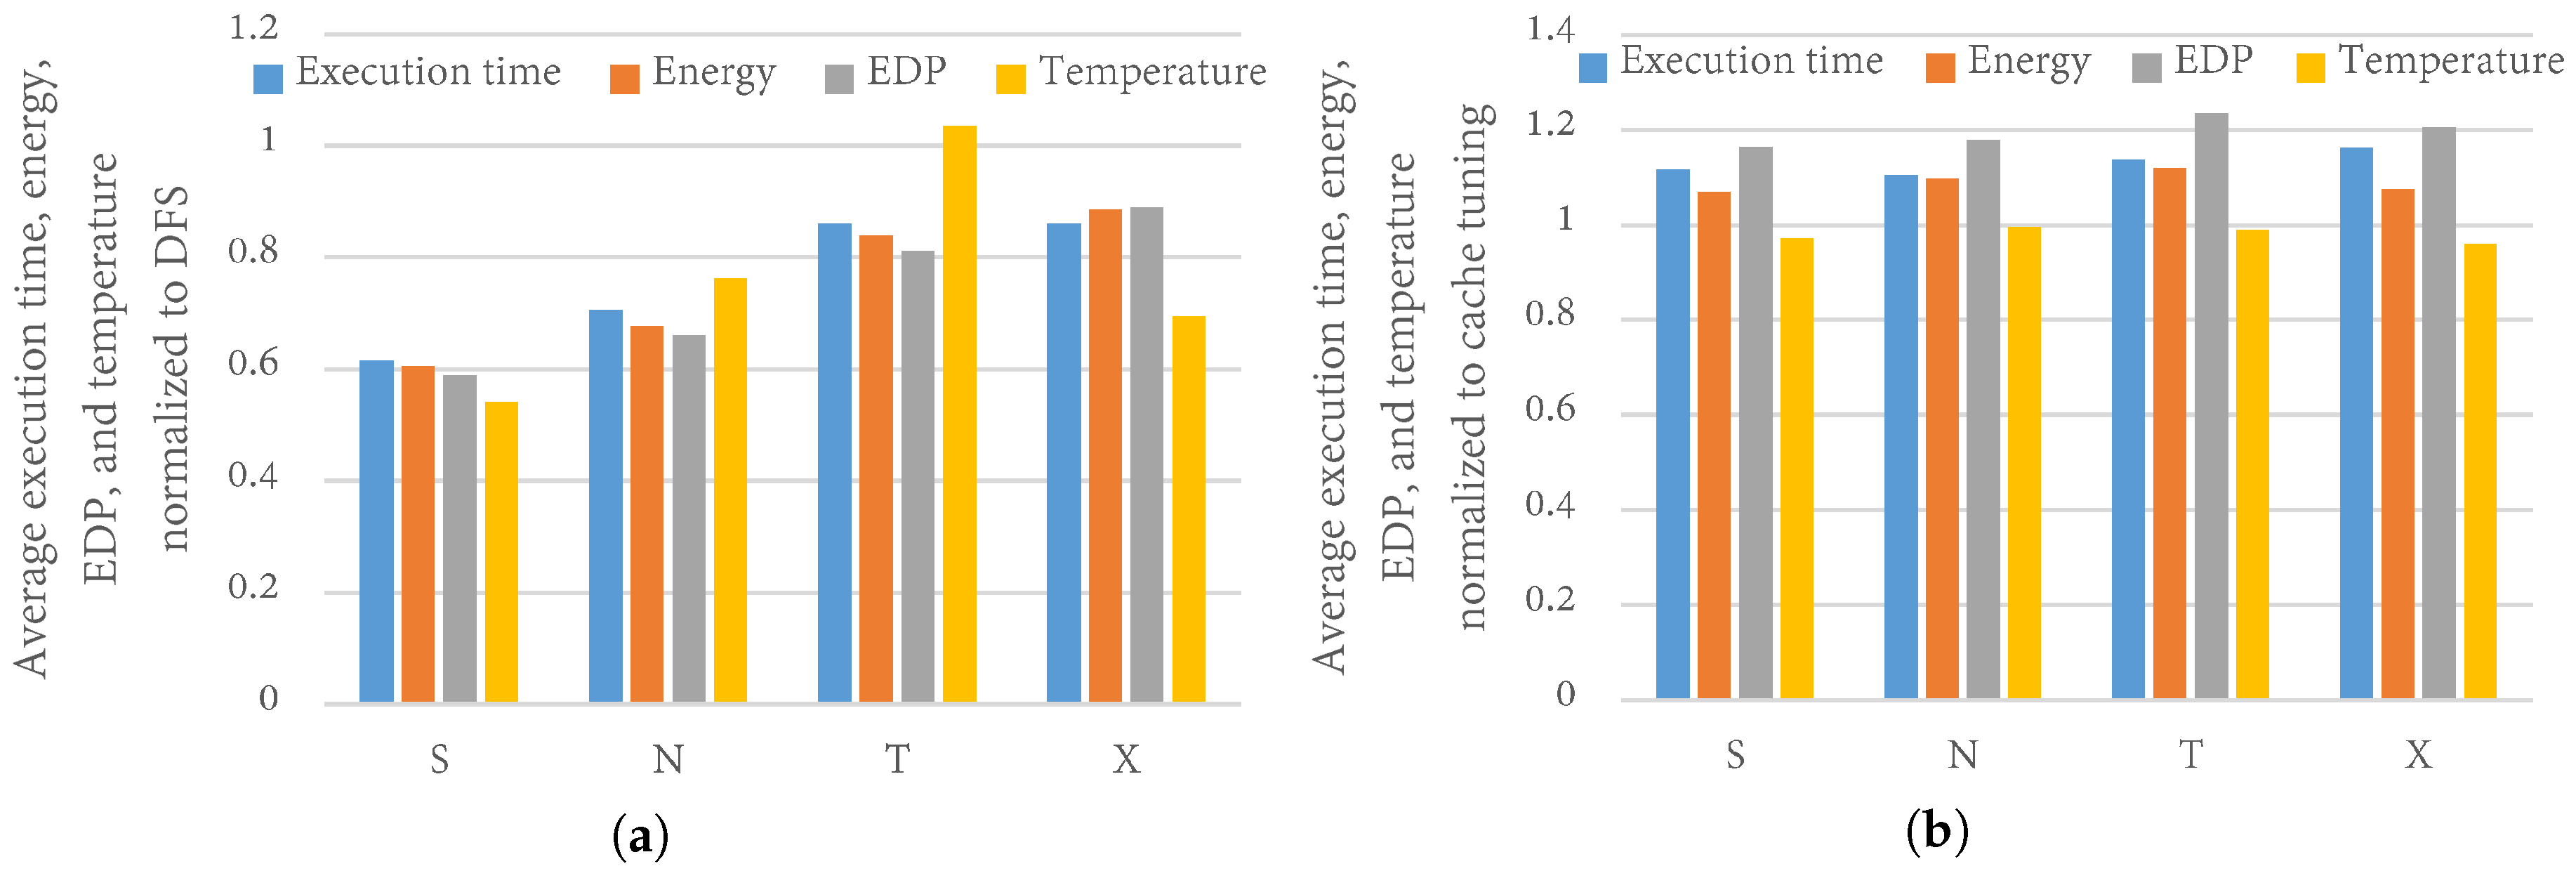
Figure 11a depicts the average execution time, energy, EDP, and temperature of the best configurations as determined by TaPT normalized to the best DFS configurations (best frequency), using the base cache configuration for priority settings and X. With the default priority setting S, TaPT reduced the average EDP, energy, execution time, and temperature by 41%, 39%, 38%, and 46%, respectively, as compared to DFS. With priority setting N, TaPT reduced the average EDP, energy, execution time, and temperature by 34%, 32%, 29%, and 24%, respectively, as compared to DFS. With priority setting T, TaPT reduced the average EDP, energy, and execution time by 19%, 16%, and 14%, respectively, as compared to DFS. However, TaPT increased the average temperature by 3% as compared to DFS. This temperature increase was due to TaPT’s optimization of other design objectives while prioritizing the temperature. DFS achieved lower temperature than TaPT because of the significant impact of the clock frequency on temperature. Finally, with priority setting X, TaPT reduced the average EDP, energy, execution time, and temperature by 11%, 11%, 14%, and 31%, respectively, as compared to DFS. These results illustrate TaPT’s ability to optimize multiple objectives while prioritizing the designer’s selected priority setting.
Figure 11b depicts the average execution time, energy, EDP, and temperature of the best configurations as determined by TaPT normalized to the best cache configurations as determined by exhaustive search, using the base clock frequency for priority settings and X. Unlike when comparing to DFS, cache tuning outperformed TaPT in all priority settings for all optimizations except temperature optimization. We note that this result was expected since we used exhaustive search to determine the best configurations from the complete design space afforded by cache tuning. These configurations represent the best-case scenarios and do not reflect a real-world multi-objective optimization scenario. With priority setting S, TaPT increased the average EDP, energy, and execution time by 16%, 7%, and 12%, respectively, and reduced the temperature by 3%, as compared to cache tuning. With priority setting N, TaPT increased the average EDP, energy, and execution time by 18%, 10%, and 10%, respectively, and did not change the temperature, as compared to cache tuning. With priority setting T, TaPT increased the average EDP, energy, and execution time by 24%, 12%, and 14%, respectively, and reduced the temperature by 1%, as compared to cache tuning. Finally, with priority setting X, TaPT increased the average EDP, energy, and execution time by 20%, 8%, and 16%, respectively, and reduced the temperature by 4%, as compared to cache tuning. Thus, TaPT determined relatively similar configurations as the optimal cache tuning configurations while exploring only 4% of the design space.
4.6. Tuning Overhead
TaPT’s tuning overhead comprises of the time it takes to determine the best cache configuration and clock frequency, and the time it takes to switch to the determined configurations. Specifically, we computed the tuning overhead in terms of the total cache tuning time, the cache configuration overhead, frequency tuning time, and the DFS transition delay overhead, which is the time it takes to switch from one frequency level to another. We assumed an average transition delay overhead of 18.24 μs, similar to that of the ARM Cortex A9 [40]. On average over all the benchmarks, TaPT’s tuning overhead was 0.145 s. Due to the brief duration of most of the benchmarks, and our 10 ms tuning interval, TaPT required multiple iterations to determine the Pareto optimal configurations for most of the benchmarks. However, in embedded systems with persistent applications that execute multiple times throughout the systems’ lifetime, this tuning overhead amortizes very rapidly.
To put TaPT’s tuning overhead in perspective, we also compared TaPT’s tuning overhead with how much time was required to determine the benchmarks’ Pareto optimal configurations using exhaustive search of the design space. On average over all the benchmarks, TaPT reduced the tuning overhead from 3.62 s to 0.145 s, representing an average reduction of 96% or a 25× tuning speedup.
5. Conclusions
Phase-based tuning specializes a system’s tunable parameters to the varying runtime requirements of an application’s different execution phases in order to meet optimization goals, which typically involve minimizing energy consumption and/or maximizing performance. However, due to embedded systems’ resource constraints, and the absence of dedicated cooling mechanisms, temperature is a growing issue in these systems. Several dynamic thermal management techniques, such as dynamic frequency scaling (DFS), task migration, etc., have been used for managing embedded systems’ temperature. However, these techniques could adversely affect other optimization objectives, such as energy consumption and/or performance.
In this paper, we extensively analyzed the impacts of different cache configurations on system temperature, and showed that the cache parameters’ impacts on temperature differs from the impacts on other optimization goals (e.g., energy and execution time). Our analysis revealed that the line size has the largest impact on temperature, followed by the associativity, and then the cache size. We also presented temperature-aware phase-based tuning, TaPT, which combines phase-based cache tuning and dynamic frequency scaling (DFS) to determine Pareto optimal configurations for different execution phases. We show TaPT’s effectiveness in determining Pareto optimal configurations that significantly reduce execution time, energy, EDP, and temperature, with minimal computational complexity and low hardware overhead, while adhering to specified design constraints. Results reveal that TaPT reduces execution time, energy consumption, and temperature by up to 5%, 30%, and 25%, respectively. We also show that TaPT is easy to implement, constitutes minimal hardware overhead, and can be seamlessly incorporated in resource-constrained embedded systems.
For future work, we plan to evaluate and verify TaPT’s scalability to more complex systems with much larger design spaces (e.g., heterogeneous multi-/many core systems). We also intend to develop additional low-overhead heuristics that leverage the insights developed in this work for multi-objective optimization.
Acknowledgments
This work was support in part by the National Science Foundation (CNS-0953447). Any opinions, findings, and conclusions or recommendations expressed in this material are those of the authors and do not necessarily reflect the views of the National Science Foundation.
Author Contributions
Tosiron Adegbija and Ann Gordon-Ross conceived of and designed the experiments. Tosiron Adegbija performed the experiments and analyzed the results. Both authors wrote the paper. All authors have read and approved the final manuscript.
Conflicts of Interest
The authors declare no conflict of interest.
References
- Brooks, D.; Martonosi, M. Dynamic thermal management for high-performance microprocessors. In Proceedings of the Seventh International Symposium on IEEE High-Performance Computer Architecture (HPCA), Monterrey, Nuevo Leon, Mexico, 19–24 January 2001; pp. 171–182. [Google Scholar]
- Skadron, K.; Stan, M.R.; Sankaranarayanan, K.; Huang, W.; Velusamy, S.; Tarjan, D. Temperature-aware microarchitecture: Modeling and implementation. ACM Trans. Archit. Code Optim. (TACO) 2004, 1, 94–125. [Google Scholar] [CrossRef]
- Heo, S.; Barr, K.; Asanović, K. Reducing power density through activity migration. In Proceedings of the 2003 International Symposium on Low Power Electronics and Design, Seoul, Korea, 25–27 August 2003; ACM: New York, NY, USA, 2003; pp. 217–222. [Google Scholar]
- ARM. Available online: http://www.arm.com (accessed on 21 December 2016).
- Pedram, M.; Nazarian, S. Thermal modeling, analysis, and management in VLSI circuits: Principles and methods. Proc. IEEE 2006, 94, 1487–1501. [Google Scholar] [CrossRef]
- Yeo, I.; Kim, E.J. Temperature-aware scheduler based on thermal behavior grouping in multicore systems. In Proceedings of the Conference on Design, Automation and Test in Europe, Nice, France, 20–24 April 2009; European Design and Automation Association: Leuven, Belgium, 2009; pp. 946–951. [Google Scholar]
- Jayaseelan, R.; Mitra, T. Temperature aware task sequencing and voltage scaling. In Proceedings of the 2008 IEEE/ACM International Conference on Computer-Aided Design, San Jose, CA, USA, 10–13 November 2008; IEEE Press: Piscataway, NJ, USA, 2008; pp. 618–623. [Google Scholar]
- Gordon-Ross, A.; Lau, J.; Calder, B. Phase-based cache reconfiguration for a highly-configurable two-level cache hierarchy. In Proceedings of the 18th ACM Great Lakes Symposium on VLSI, Orlando, FL, USA, 4–6 May 2008; ACM: New York, NY, USA, 2008; pp. 379–382. [Google Scholar]
- Gordon-Ross, A.; Vahid, F.; Dutt, N.D. Fast configurable-cache tuning with a unified second-level cache. IEEE Trans. Very Large Scale Integr. (VLSI) Syst. 2009, 17, 80–91. [Google Scholar] [CrossRef]
- Khaitan, S.K.; McCalley, J.D. Optimizing cache energy efficiency in multicore power system simulations. Energy Syst. 2014, 5, 163–177. [Google Scholar] [CrossRef]
- Zhang, C.; Vahid, F.; Najjar, W. A highly configurable cache architecture for embedded systems. In Proceedings of the IEEE 30th Annual International Symposium on Computer Architecture, San Diego, CA, USA, 9–11 June 2003; pp. 136–146. [Google Scholar]
- Homayoun, H.; Rahmatian, M.; Kontorinis, V.; Golshan, S.; Tullsen, D.M. Hot peripheral thermal management to mitigate cache temperature variation. In Proceedings of the IEEE Thirteenth International Symposium on Quality Electronic Design (ISQED), Santa Clara, CA, USA, 19–21 March 2012; pp. 755–763. [Google Scholar]
- Rohbani, N.; Ebrahimi, M.; Miremadi, S.G.; Tahoori, M.B. Bias Temperature Instability Mitigation via Adaptive Cache Size Management. IEEE Trans. Very Large Scale Integr. (VLSI) Syst. 2017, 25, 1012–1022. [Google Scholar] [CrossRef]
- Zitzler, E.; Laumanns, M.; Thiele, L. SPEA2: Improving the Strength Pareto Evolutionary Algorithm; Eurogen: Athens, Greece, 2001; Volume 3242, pp. 95–100. [Google Scholar]
- Adegbija, T.; Gordon-Ross, A.; Rawlins, M. Analysis of cache tuner architectural layouts for multicore embedded systems. In Proceedings of the IEEE International Performance Computing and Communications Conference (IPCCC), Austin, TX, USA, 5–7 December 2014; pp. 1–8. [Google Scholar]
- Hajimiri, H.; Mishra, P. Intra-task dynamic cache reconfiguration. In Proceedings of the IEEE 25th International Conference on VLSI Design (VLSID), Hyderabad, India, 7–11 January 2012; pp. 430–435. [Google Scholar]
- Salami, B.; Baharani, M.; Noori, H. Proactive task migration with a self-adjusting migration threshold for dynamic thermal management of multi-core processors. J. Supercomput. 2014, 68, 1068–1087. [Google Scholar] [CrossRef]
- Sherwood, T.; Calder, B. Time Varying Behavior of Programs; UCSD Technical Report CS99-630; UCSD: La Jolla, CA, USA, 1999. [Google Scholar]
- Balasubramonian, R.; Albonesi, D.; Buyuktosunoglu, A.; Dwarkadas, S. Memory hierarchy reconfiguration for energy and performance in general-purpose processor architectures. In Proceedings of the 33rd Annual ACM/IEEE International Symposium on Microarchitecture, Monterey, CA, USA, 10–13 December 2000; ACM: New York, NY, USA, 2000; pp. 245–257. [Google Scholar]
- Dhodapkar, A.S.; Smith, J.E. Comparing program phase detection techniques. In Proceedings of the 36th Annual IEEE/ACM International Symposium on Microarchitecture, San Diego, CA, USA, 3–5 December 2003; IEEE Computer Society: Washington, DC, USA, 2003; p. 217. [Google Scholar]
- Sembrant, A.; Eklov, D.; Hagersten, E. Efficient software-based online phase classification. In Proceedings of the 2011 IEEE International Symposium on Workload Characterization (IISWC), Austin, TX, USA, 6–8 November 2011; pp. 104–115. [Google Scholar]
- Huang, W.; Stan, M.R.; Skadron, K.; Sankaranarayanan, K.; Ghosh, S.; Velusam, S. Compact thermal modeling for temperature-aware design. In Proceedings of the 41st Annual Design Automation Conference, San Diego, CA, USA, 7–11 June 2004; ACM: New York, NY, USA, 2004; pp. 878–883. [Google Scholar]
- Liu, Z.; Xu, T.; Tan, S.X.D.; Wang, H. Dynamic thermal management for multi-core microprocessors considering transient thermal effects. In Proceedings of the IEEE 2013 18th Asia and South Pacific Design Automation Conference (ASP-DAC), Yokohama, Japan, 22–25 January 2013; pp. 473–478. [Google Scholar]
- Kong, J.; Chung, S.W.; Skadron, K. Recent thermal management techniques for microprocessors. ACM Comput. Surv. (CSUR) 2012, 44, 13. [Google Scholar] [CrossRef]
- Malik, A.; Moyer, B.; Cermak, D. A low power unified cache architecture providing power and performance flexibility. In Proceedings of the IEEE 2000 International Symposium on Low Power Electronics and Design (ISLPED), Rapallo, Italy, 26–27 July 2000; pp. 241–243. [Google Scholar]
- Singh, K.; Bhadauria, M.; McKee, S.A. Real time power estimation and thread scheduling via performance counters. ACM SIGARCH Comput. Archit. News 2009, 37, 46–55. [Google Scholar] [CrossRef]
- Kanungo, T.; Mount, D.M.; Netanyahu, N.S.; Piatko, C.D.; Silverman, R.; Wu, A.Y. An efficient k-means clustering algorithm: Analysis and implementation. IEEE Trans. Pattern Anal. Mach. Intell. 2002, 24, 881–892. [Google Scholar] [CrossRef]
- Herbert, S.; Marculescu, D. Variation-aware dynamic voltage/frequency scaling. In Proceedings of the IEEE 15th International Symposium on High Performance Computer Architecture (HPCA), Raleigh, NC, USA, 14–18 February 2009; pp. 301–312. [Google Scholar]
- Adegbija, T.; Gordon-Ross, A.; Munir, A. Phase distance mapping: A phase-based cache tuning methodology for embedded systems. Des. Autom. Embed. Syst. 2014, 18, 251–278. [Google Scholar] [CrossRef]
- Sherwood, T.; Sair, S.; Calder, B. Phase tracking and prediction. In ACM SIGARCH Computer Architecture News; ACM: New York, NY, USA, 2003; Volume 31, pp. 336–349. [Google Scholar]
- Design Compiler. Synopsys Inc. Available online: https://www.synopsys.com/ (accessed on 21 January 2017).
- MIPS32 M14K Processor Core Family. Available online: https://imagination-technologies-cloudfront-assets.s3.amazonaws.com/documentation/MD00668-2B-M14K-SUM-02.04.pdf (accessed on 21 April 2017).
- Binkert, N.; Beckmann, B.; Black, G.; Reinhardt, S.K.; Saidi, A.; Basu, A.; Hestness, J.; Hower, D.R.; Krishna, T.; Sardashti, S.; et al. The gem5 Simulator. Comput. Archit. News 2012, 40, 1–7. [Google Scholar] [CrossRef]
- Li, S.; Ahn, J.H.; Strong, R.D.; Brockman, J.B.; Tullsen, D.M.; Jouppi, N.P. The mcpat framework for multicore and manycore architectures: Simultaneously modeling power, area, and timing. ACM Trans. Archit. Code Optim. (TACO) 2013, 10, 5. [Google Scholar] [CrossRef]
- Sharifi, S.; Coskun, A.K.; Rosing, T.S. Hybrid dynamic energy and thermal management in heterogeneous embedded multiprocessor SoCs. In Proceedings of the 2010 Asia and South Pacific Design Automation Conference, Taipei, Taiwan, 18–21 January 2010; pp. 873–878. [Google Scholar]
- The Embedded Microprocessor Benchmark Consortium. Available online: http://www.eembc.org/ (accessed on 21 January 2017).
- Guthaus, M.R.; Ringenberg, J.S.; Ernst, D.; Austin, T.M.; Mudge, T.; Brown, R.B. MiBench: A free, commercially representative embedded benchmark suite. In Proceedings of the IEEE International Workshop on Workload Characterization (WWC), Austin, TX, USA, 2 December 2001; pp. 3–14. [Google Scholar]
- Gordon-Ross, A.; Vahid, F. A self-tuning configurable cache. In Proceedings of the 44th annual Design Automation Conference, San Diego, CA, USA, 4–8 June 2007; ACM: New York, NY, USA, 2007; pp. 234–237. [Google Scholar]
- Rawlins, M.; Gordon-Ross, A. An application classification guided cache tuning heuristic for multi-core architectures. In Proceedings of the IEEE 17th Asia and South Pacific Design Automation Conference (ASP-DAC), Sydney, NSW, Australia, 30 January–2 February 2012; pp. 23–28. [Google Scholar]
- Park, S.; Park, J.; Shin, D.; Wang, Y.; Xie, Q.; Pedram, M.; Chang, N. Accurate modeling of the delay and energy overhead of dynamic voltage and frequency scaling in modern microprocessors. IEEE Trans. Comput.-Aided Des. Integr. Circuits Syst. 2013, 32, 695–708. [Google Scholar] [CrossRef]
Figure 1.
Configurable cache architecture.
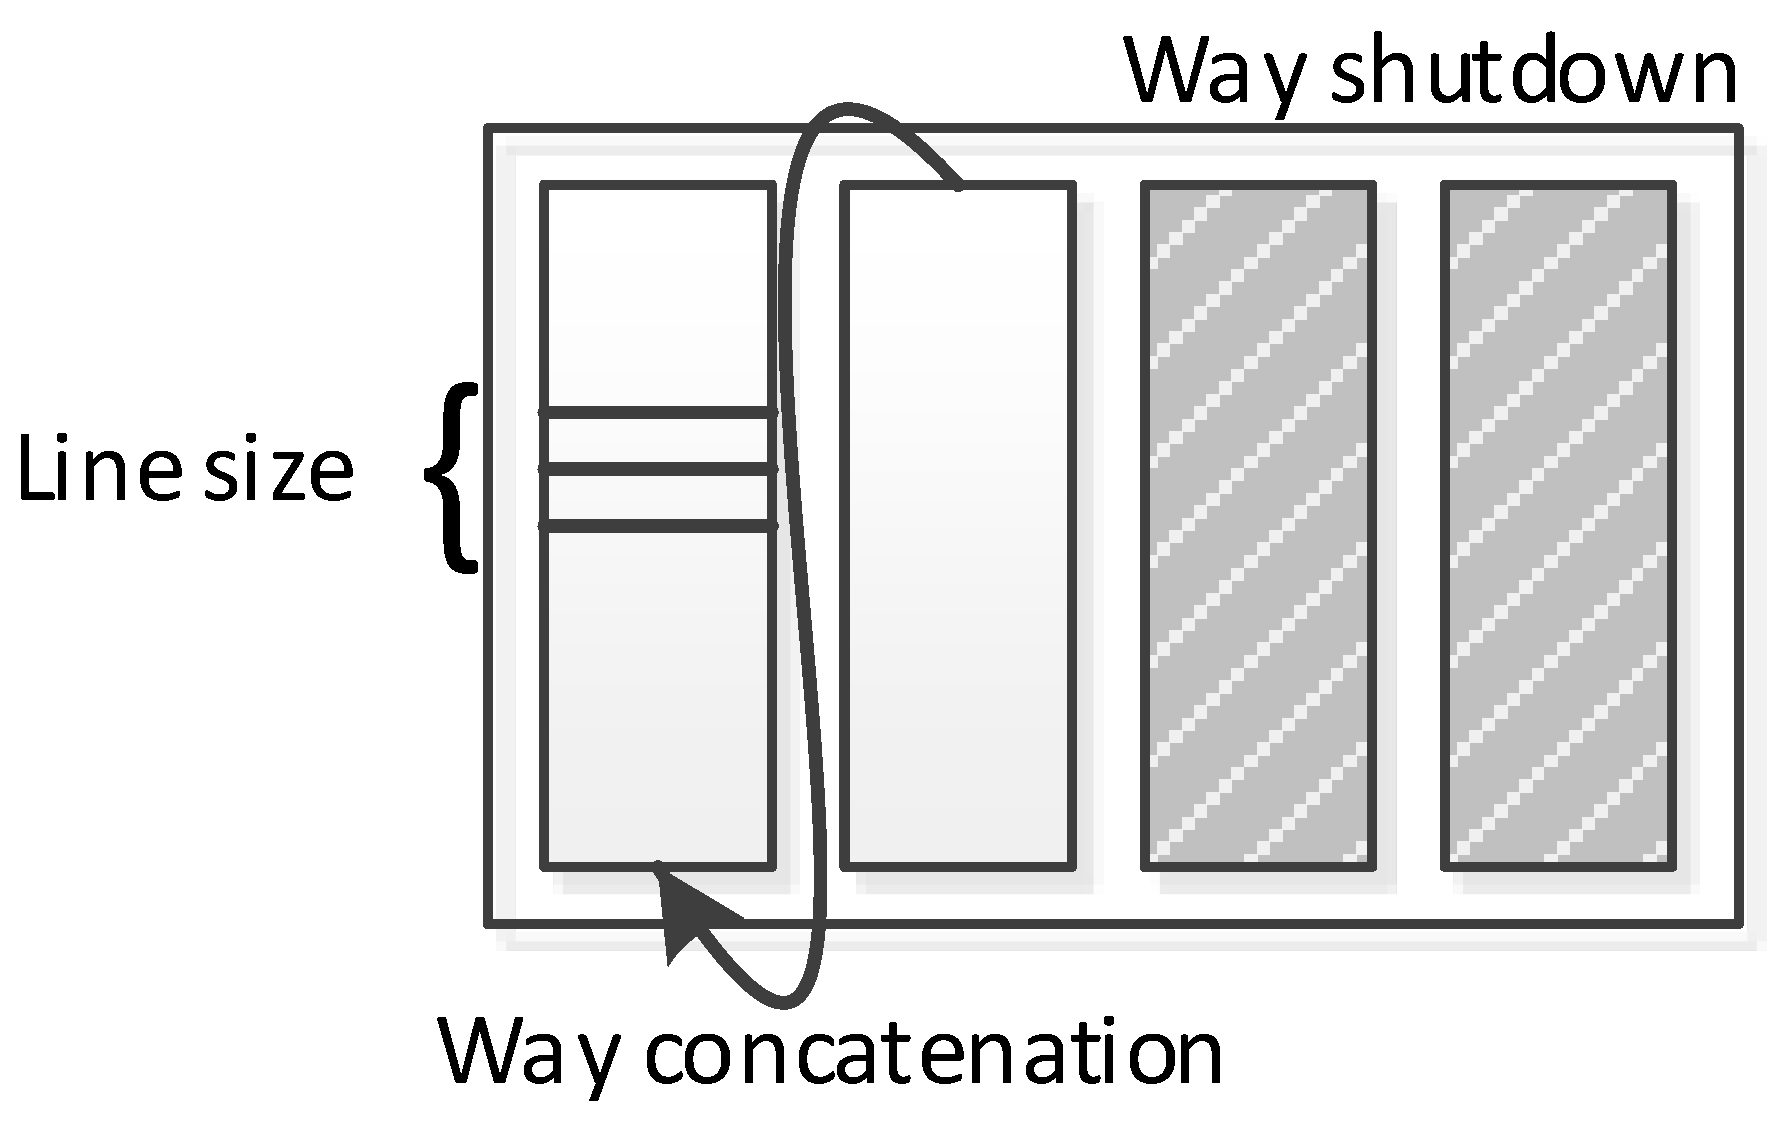
Figure 2.
TaPT interactions with other system components and functions.

Figure 3.
TaPT overview.

Figure 4.
TaPT overview.
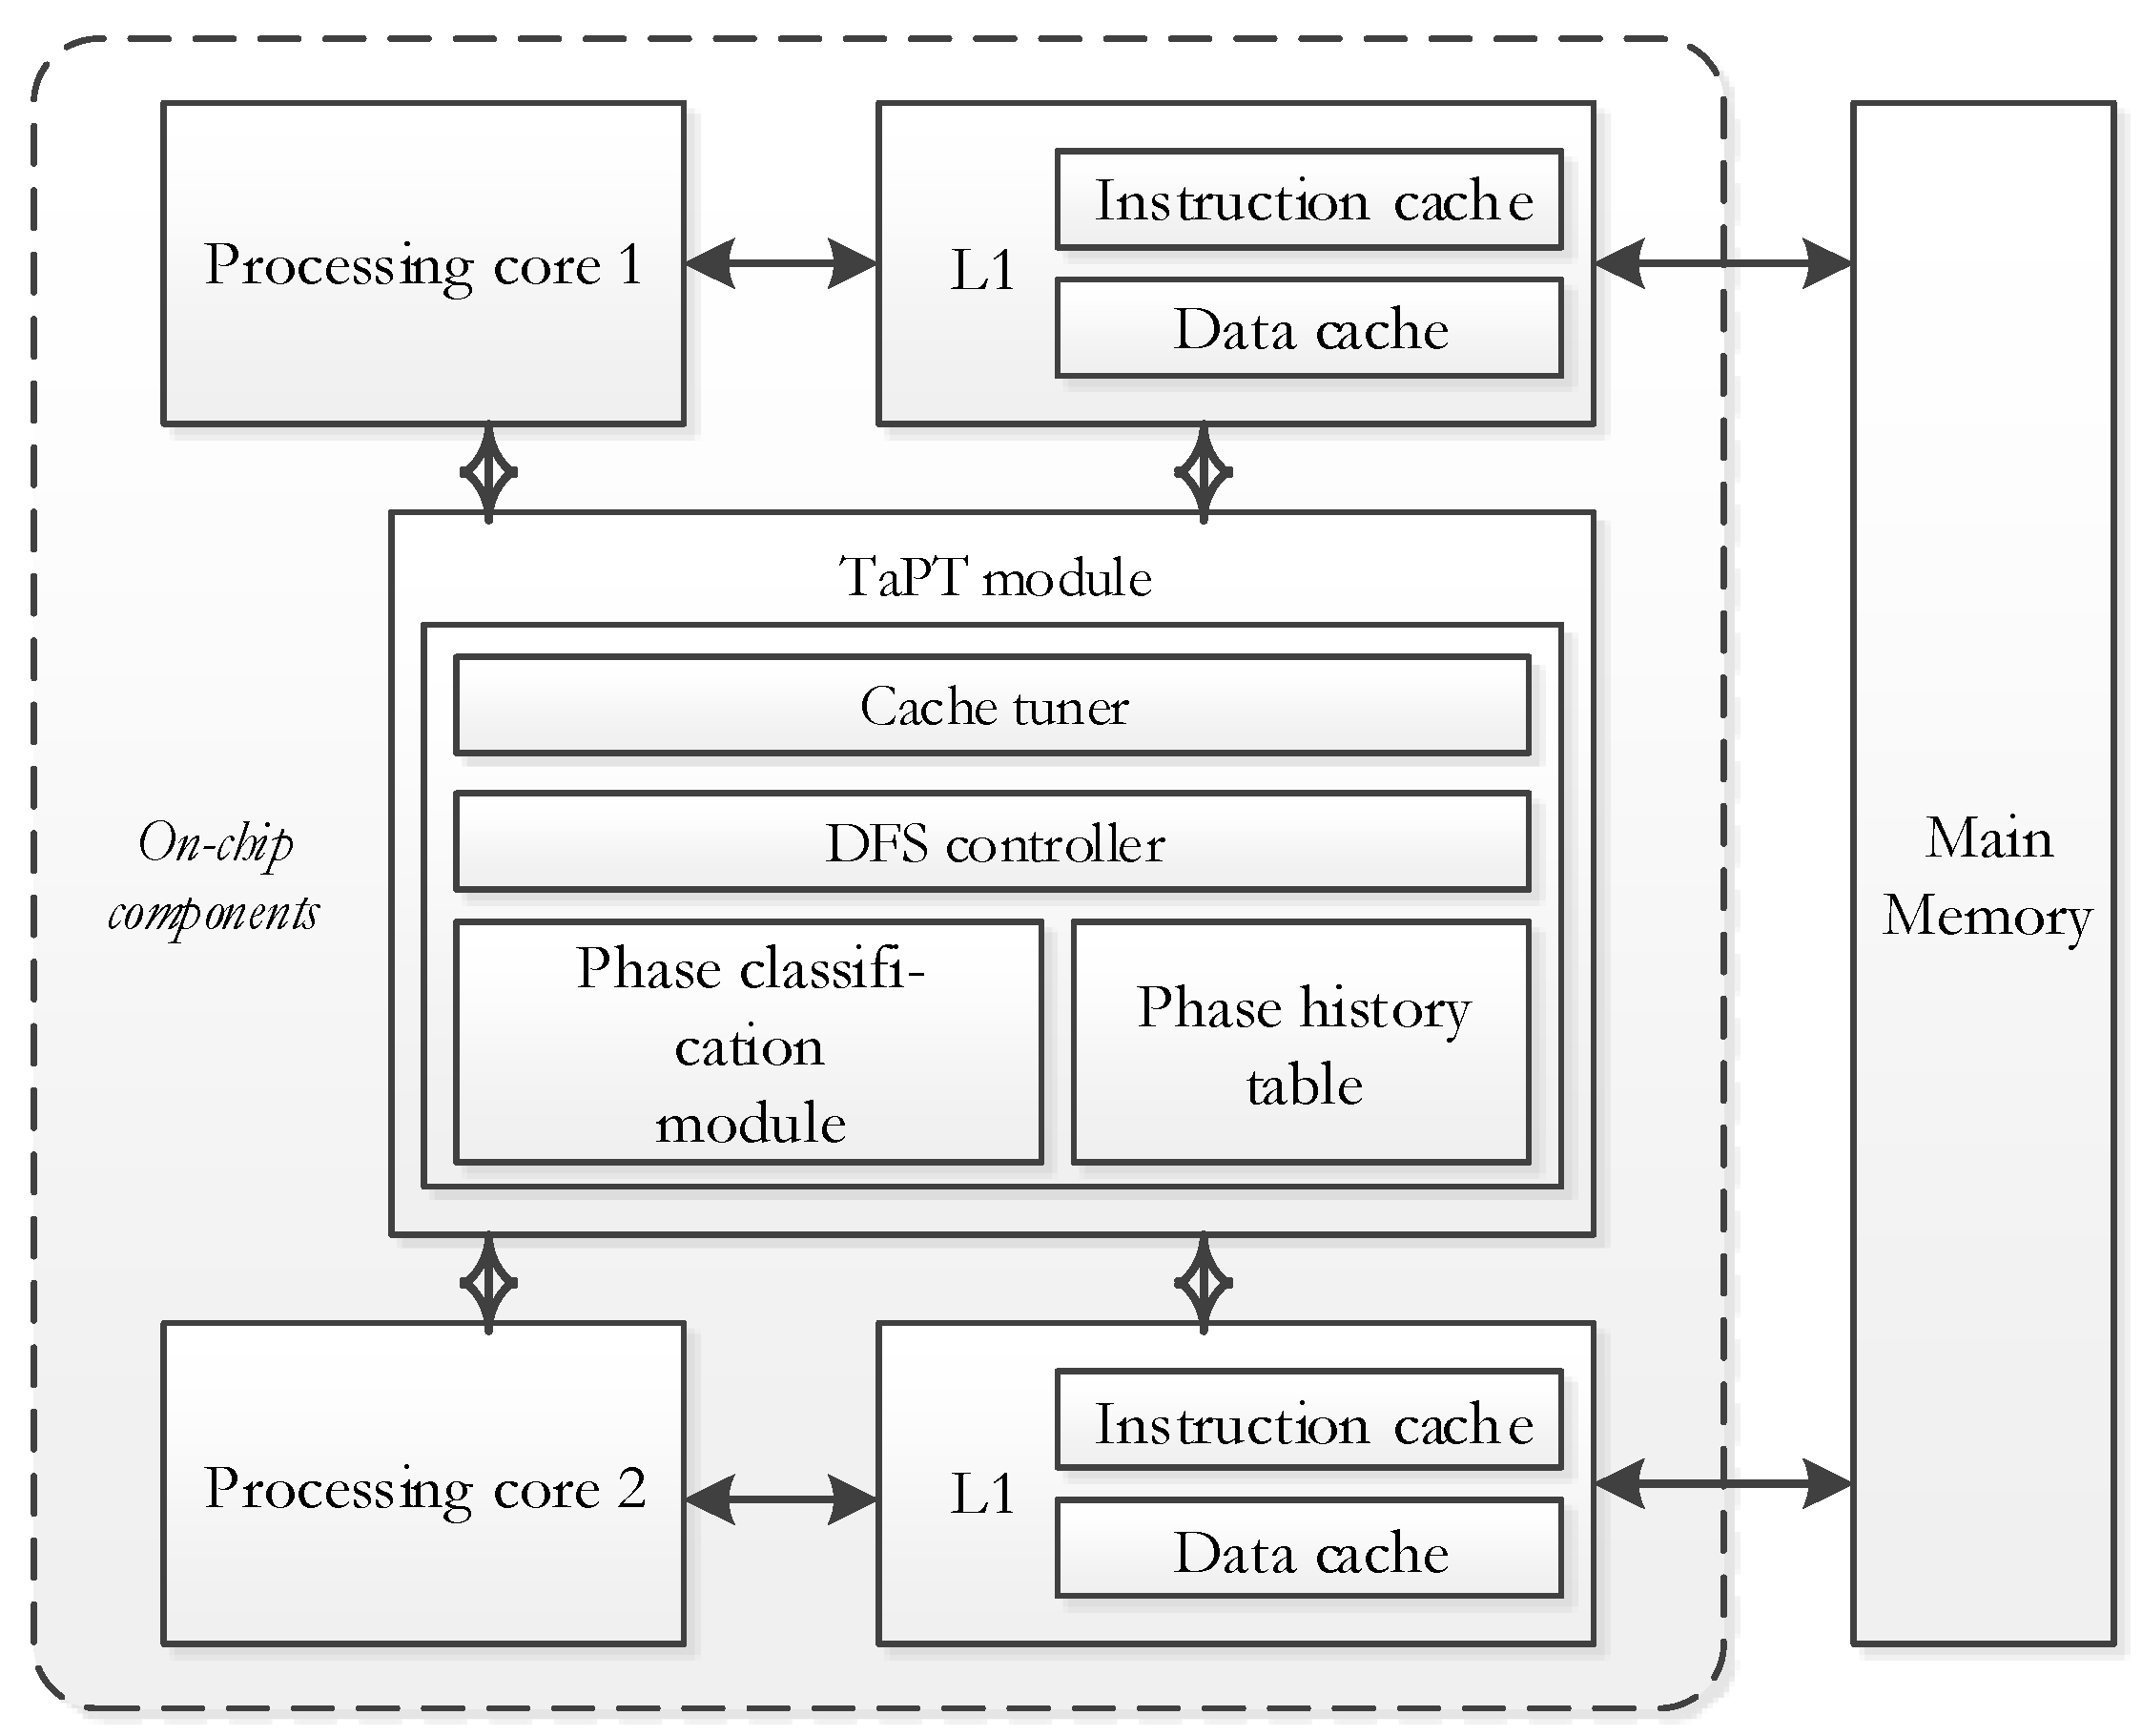
Figure 5.
Temperature variations for cache configurations in the design space. (a) a2time01; (b) sha.
Figure 5.
Temperature variations for cache configurations in the design space. (a) a2time01; (b) sha.
Figure 6.
Impacts of cache parameter values on temperature.
Figure 7.
(a) Tuning overhead incurred and (b) average EDP achieved by different TaPT parameters.
Figure 8.
Execution time, energy, EDP, and temperature normalized to the base configuration for priority settings (a) S and (b) N.
Figure 8.
Execution time, energy, EDP, and temperature normalized to the base configuration for priority settings (a) S and (b) N.

Figure 9.
Execution time, energy, EDP, and temperature normalized to the base configuration for priority settings (a) T and (b) X.
Figure 9.
Execution time, energy, EDP, and temperature normalized to the base configuration for priority settings (a) T and (b) X.

Figure 10.
Peak temperatures with respect to a temperature threshold of 82 °C (broken horizontal lines).
Figure 10.
Peak temperatures with respect to a temperature threshold of 82 °C (broken horizontal lines).
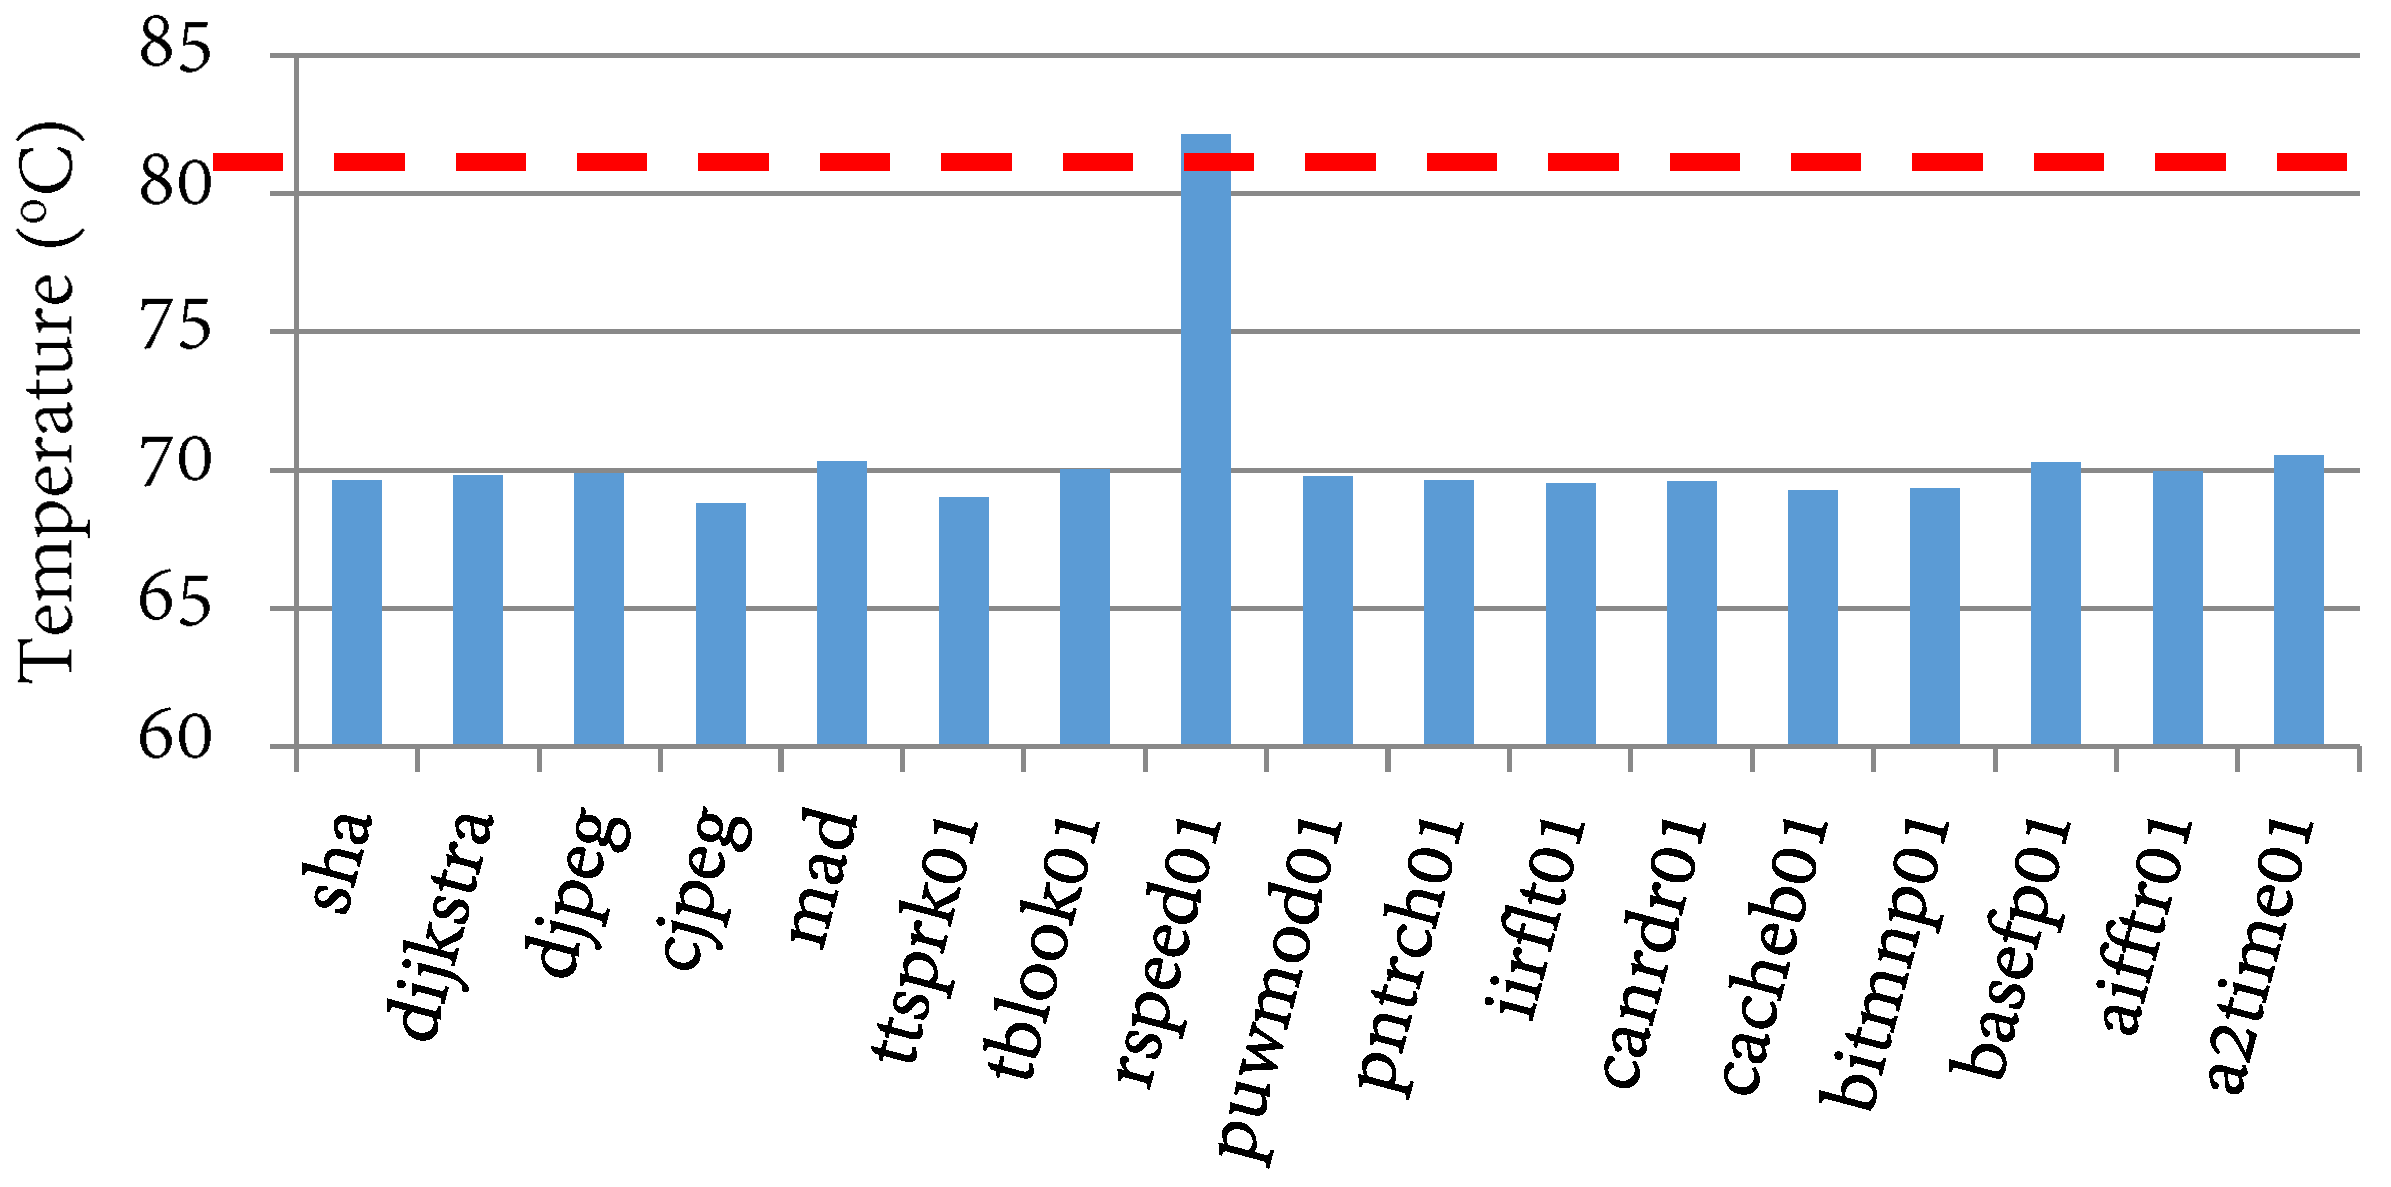
Figure 11.
Average execution time, energy, EDP, and temperature normalized to (a) DFS and (b) Cache tuning, for priority settings and N.
Figure 11.
Average execution time, energy, EDP, and temperature normalized to (a) DFS and (b) Cache tuning, for priority settings and N.
© 2017 by the authors. Licensee MDPI, Basel, Switzerland. This article is an open access article distributed under the terms and conditions of the Creative Commons Attribution (CC BY) license (http://creativecommons.org/licenses/by/4.0/).
Share and Cite
MDPI and ACS Style
Adegbija, T.; Gordon-Ross, A. TaPT: Temperature-Aware Dynamic Cache Optimization for Embedded Systems. Computers 2018, 7, 3. https://doi.org/10.3390/computers7010003
AMA Style
Adegbija T, Gordon-Ross A. TaPT: Temperature-Aware Dynamic Cache Optimization for Embedded Systems. Computers. 2018; 7(1):3. https://doi.org/10.3390/computers7010003
Chicago/Turabian StyleAdegbija, Tosiron, and Ann Gordon-Ross. 2018. "TaPT: Temperature-Aware Dynamic Cache Optimization for Embedded Systems" Computers 7, no. 1: 3. https://doi.org/10.3390/computers7010003
Note that from the first issue of 2016, this journal uses article numbers instead of page numbers. See further details here.