1. Introduction
Skin cancer is one of the most common cancers that is widespread throughout the world. In 2016 [
1], about 76,380 new cases and 10,130 deaths are identified. At an early stage, if it is detected [
2], then it can be cured 100%. However, the cost to recognize skin lesions is very high and diagnostic accuracy is less than 80% from clinical experts (dermatologists). In particular, it is very hard to identify among different types of melanomas and pigmented skin lesions (PSLs), and even experienced dermatologists [
3] have accuracy below 85%. Due to this reason, many melanoma cases are not diagnosed properly. The experienced dermatologist relies initially on pattern recognition, second on history, and later laboratory parameters. Generally, physicians such as dermatologists used clinical ABCD [
4] (A: Asymmetry, B: Border, C: Color, D: Differential structures); Menzies’s method; seven-point checklist and patterns classification (CASH) methods to diagnosis and classify the lesions.
The dermatologist utilized the above-mentioned clinical methods and must follow a two-step [
5] method for the categorization of PSLs. The two-level procedure shows that first assessment of dermatologists depends upon the decision, whether the skin lesion is of melanocytic or non-melanocytic origin. When it is identified, then the physician must follow the next level procedure. In the second-level process, the melanocytic lesion as benign, suspect or malignant is characterized. According to different skin regions of humans, malignant melanomas [
6] are categorized as: (1) superficial spreading melanoma (SSM); (2) Lentigo malignant melanoma (LMM); (3) Acral lentiginous melanoma (ALM); (4) nodular melanoma (NM); (5) mucosal melanoma (UM) and (6) desmoplastic melanoma (DM).
Table 1 demonstrates their diameter, border irregularity and early diagnosis levels for the human skin. This table is formulated using a domain expert knowledge of dermatologist about melanoma types, and this information is also derived from [
6]. From this
Table 1, it can be noticed that the ABCD rule is not accurate to classify among all types of malignant melanomas because of fuzzy border irregularity and diameter of lesions. However, in the literature, it was suggested that the ABCD rule and CASH [
7] both were good enough to classify skin lesions. Therefore, different kind of computer-aided diagnosis (CAD) systems [
8] are developed by researchers to automatically classify melanocytic or non-melanocytic PSL skin lesions. According to the author’s knowledge, the differentiation between melanocytic and non-melanocytic PSLs system is not still developed. The melanocytic PSLs are benign, blue nevus, Junctional nevus, compound nevus and malignant melanomas. However, the non-melanocytic PSLs are classified as Seborrheic keratosis (SK), Basal cell carcinomas (BCC) and Markel cell carcinomas (MCC).
The refinement of current approaches and development of new techniques [
9] will help in improving the ability to diagnose skin cancer and achieving the goal of significant reduction in melanoma mortality rate. Thus, the detection of lesions by clinical rules such as ABCD and the overall appearance of color, architectural order, symmetry of pattern and homogeneity (CASH) in dermoscopy images are still challenging tasks from CAD systems. To measure the texture patterns of lesions by using the overall appearance of color, architectural order, symmetry of pattern and homogeneity (CASH) [
10] instead of just the clinical ABCD rule is also challenging tasks for developing of CAD tools. On the whole, the appearance of color, architectural order, symmetry of pattern, and homogeneity (CASH) are significant parts in distinguishing these two groups. Benign melanocytic lesions tend to have few colors, an architectural order and a symmetry of patterns. These patterns are homogeneous.
Malignant melanoma often has many colors, architectural disorder and asymmetry of pattern. This pattern is heterogeneous, as melanoma or Clark nevus lesions often contained multicomponent patterns. Especially, melanoma on Acral skin shows an irregular pigment distribution and parallel ridge pattern (PRP). The presence of pigmented networks, globules or dots characterizes the melanocytic lesions, whereas the blue nevus has a homogeneous blue-grayish area that determines its diagnosis. If the lesion presents none of the dermoscopy features mentioned above, it is a non-melanocytic lesion. Therefore, specific criteria are used for diagnosis, which include findings of Seborrheic keratosis, hemangiomas and Angiokeratomas, pigmented basal cell carcinomas and Dermatofibromas. The melanocytic lesions are identified by their general dermoscopy features, defining their global pattern, or by specific dermoscopy criteria that determine their local pattern (when it is not possible to define a global pattern).
The specific dermoscopy criteria used include regular pigmented network, irregular pigmented network, dots, globules, pseudopods, branched streaks, blue-whitish veil, and regression areas. To recognition, these categories of lesions, the patterns of skin lesions are detected. In practice, there are seven classes of dermoscopy patterns presented such as starburst, globular, cobblestone, multi-component, pigmented or reticular, parallel and homogeneous as shown in
Table 2. This table is contained information about the relationship between seven classes according to the different dermoscopy patterns. The information presented in
Table 2 is also shown in [
10] in different format to show the benefit of automatic pattern analysis algorithms for clinical experts.
2. Review and Background
Differentiation between melanocytic and non-melanocytic PSLs by CAD systems depend on CASH or ABCD clinical rules. These CAD systems utilized ineffective color and texture features [
11] and outdated computer vision [
12] methods. Particularly, in this paper, the seven classes of dermoscopy patterns are determined by using effective methods to increase the diagnostic accuracy of PSLs. To clear this point, the literature is surveyed in details below.
To classify skin lesions, there are many automatic computerized [
13,
14,
15,
16,
17,
18,
19,
20] systems. By using automatic systems, the dermatologists can classify between nevus and melanoma skin lesions. Both of these automatic and clinical analysis systems are focused more on defining color and texture features [
13] that are directly related to the field of pattern recognition of dermoscopy images. Accordingly, the literature is reviewed that is related to the definition of color and texture features for classification of PSLs.
In [
14], bag-of-visual and local features were extracted for classification of dermoscopy images. They have also tested the role of color and texture features and determined the most powerful set of features. In their system, they showed sensitivity for global methods of 96% and Specificity of 80% against the sensitivity of 100% and Specificity of 75% for local methods. In [
15], however, they analyzed 463 skin cancer images to improve the diagnostic accuracy of non-melanocytic through recognition of patterns. They concluded that the pattern analysis is the best technique to classify skin lesions. A different approach was adopted in [
16] to recognize melanocytic lesions by logic regression analysis. After experiments on 837 images, they demonstrated that the diagnostic accuracy was 82%, the same as the ABCD rule, Menzies’ score, and the seven-point checklist. In contrast to these approaches, Acral melanoma was classified in [
17] that was mostly misdiagnosed as the melanocytic nevus. In that study, the parallel ridge patterns are detected from 22 Acral lesions. Similarly, in [
18], the 231 Acral lesions of dermoscopy images are utilized in which 176 were nevi and 37 were melanomas. In that paper, they utilized color and texture features to derive pattern detectors and achieved the sensitivity of 100% and specificity of 95.9%.
In [
19], Celebi et al. presented a system to classify PSLs of dermoscopy images by using various color and texture features. These different features are fed into an optimized framework for selection of features, and are finally classified using an SVM (Support Vector Machine) classifier. They tested the developed method on a set of 564 dermoscopy images and achieved a specificity of 92.34% and a sensitivity of 93.33%. The automatic melanoma recognition system (MRS) is proposed in [
20] using CASH recognition techniques. The impact on 120 melanoma–nevus lesions is recorded by the area under the receiver operating characteristics curve (AUC). They obtained a sensitivity of 88.2%, specificity of 91.3%, and an AUC of 0.880. Although in ref. [
21], they used grayscale images to classify the type of skin lesions instead of utilizing color images.
In [
22], melanoma is recognized using image enhancement, segmentation, and 15 features are derived that are fed into the deep learning and hybrid AdaBoost-Support Vector Machine (SVM) algorithms. This developed system was tested on 992 images to differentiate between malignant and benign lesions. They obtained a high 93% of classification accuracy compared to other systems. However, in [
23], the authors developed a new melanoma recognition system based on combined approach of deep learning, sparse coding, and support vector machine (SVM) learning algorithms. They have tested this approach on 2624 clinical cases of melanoma (334), atypical nevi (144), and benign lesions (2146). They obtained 91.2% of accuracy compared to other state-of-the-art classification systems of dermoscopy images. Likewise, in [
24], the authors have presented a different model for recognition of melanoma based on advanced bag-of-visual-words and deep learning algorithms. They reached an AUC of 87.9 value for recognition of melanoma images. Furthermore, they determined that the current literature was outdated for computer vision models.
Since these CAD or automatic systems for classification of pigmented skin lesions (PSLs) are focused on pattern recognition techniques. In fact, those systems were devoted for differentiation between melanoma and nevus skin lesions using machine learning methods. As advised in [
22,
23,
24], the outdated features and classification methods provided accuracy recognition of melanocytic or non-melanocytic PSLs at less than 90%. Moreover, the extraction of color and texture features is computationally expensive for previously developed systems. Despite these facts, the deep learning algorithms [
22,
23,
24] have also been used with bag-of-visual-words to combine local and global features of lesions. However, the deep learning algorithms have achieved very impressive results for solving the problems of image classification, and it has many applications in computer vision [
25] and medical domain in practice.
A few studies utilized this deep learning algorithm to classify melanocytic or non-melanocytic skin lesions. Those methods were developed to classify the specific category of pigmented skin lesions (PSLs). Accordingly, they did not focus on seven pattern classes to skin lesions, which can be used to classify all types of skin lesions. Therefore, in this paper, an alternative method was proposed based on majority voting and support vector machine (MV–SVM) algorithms to classify all seven classes of patterns instead of using deep learning algorithms. Moreover, this melanocytic and non-Melanocytic skin lesions (MnM–SK) system can be used to classify all types of PSLs.
3. Methodology
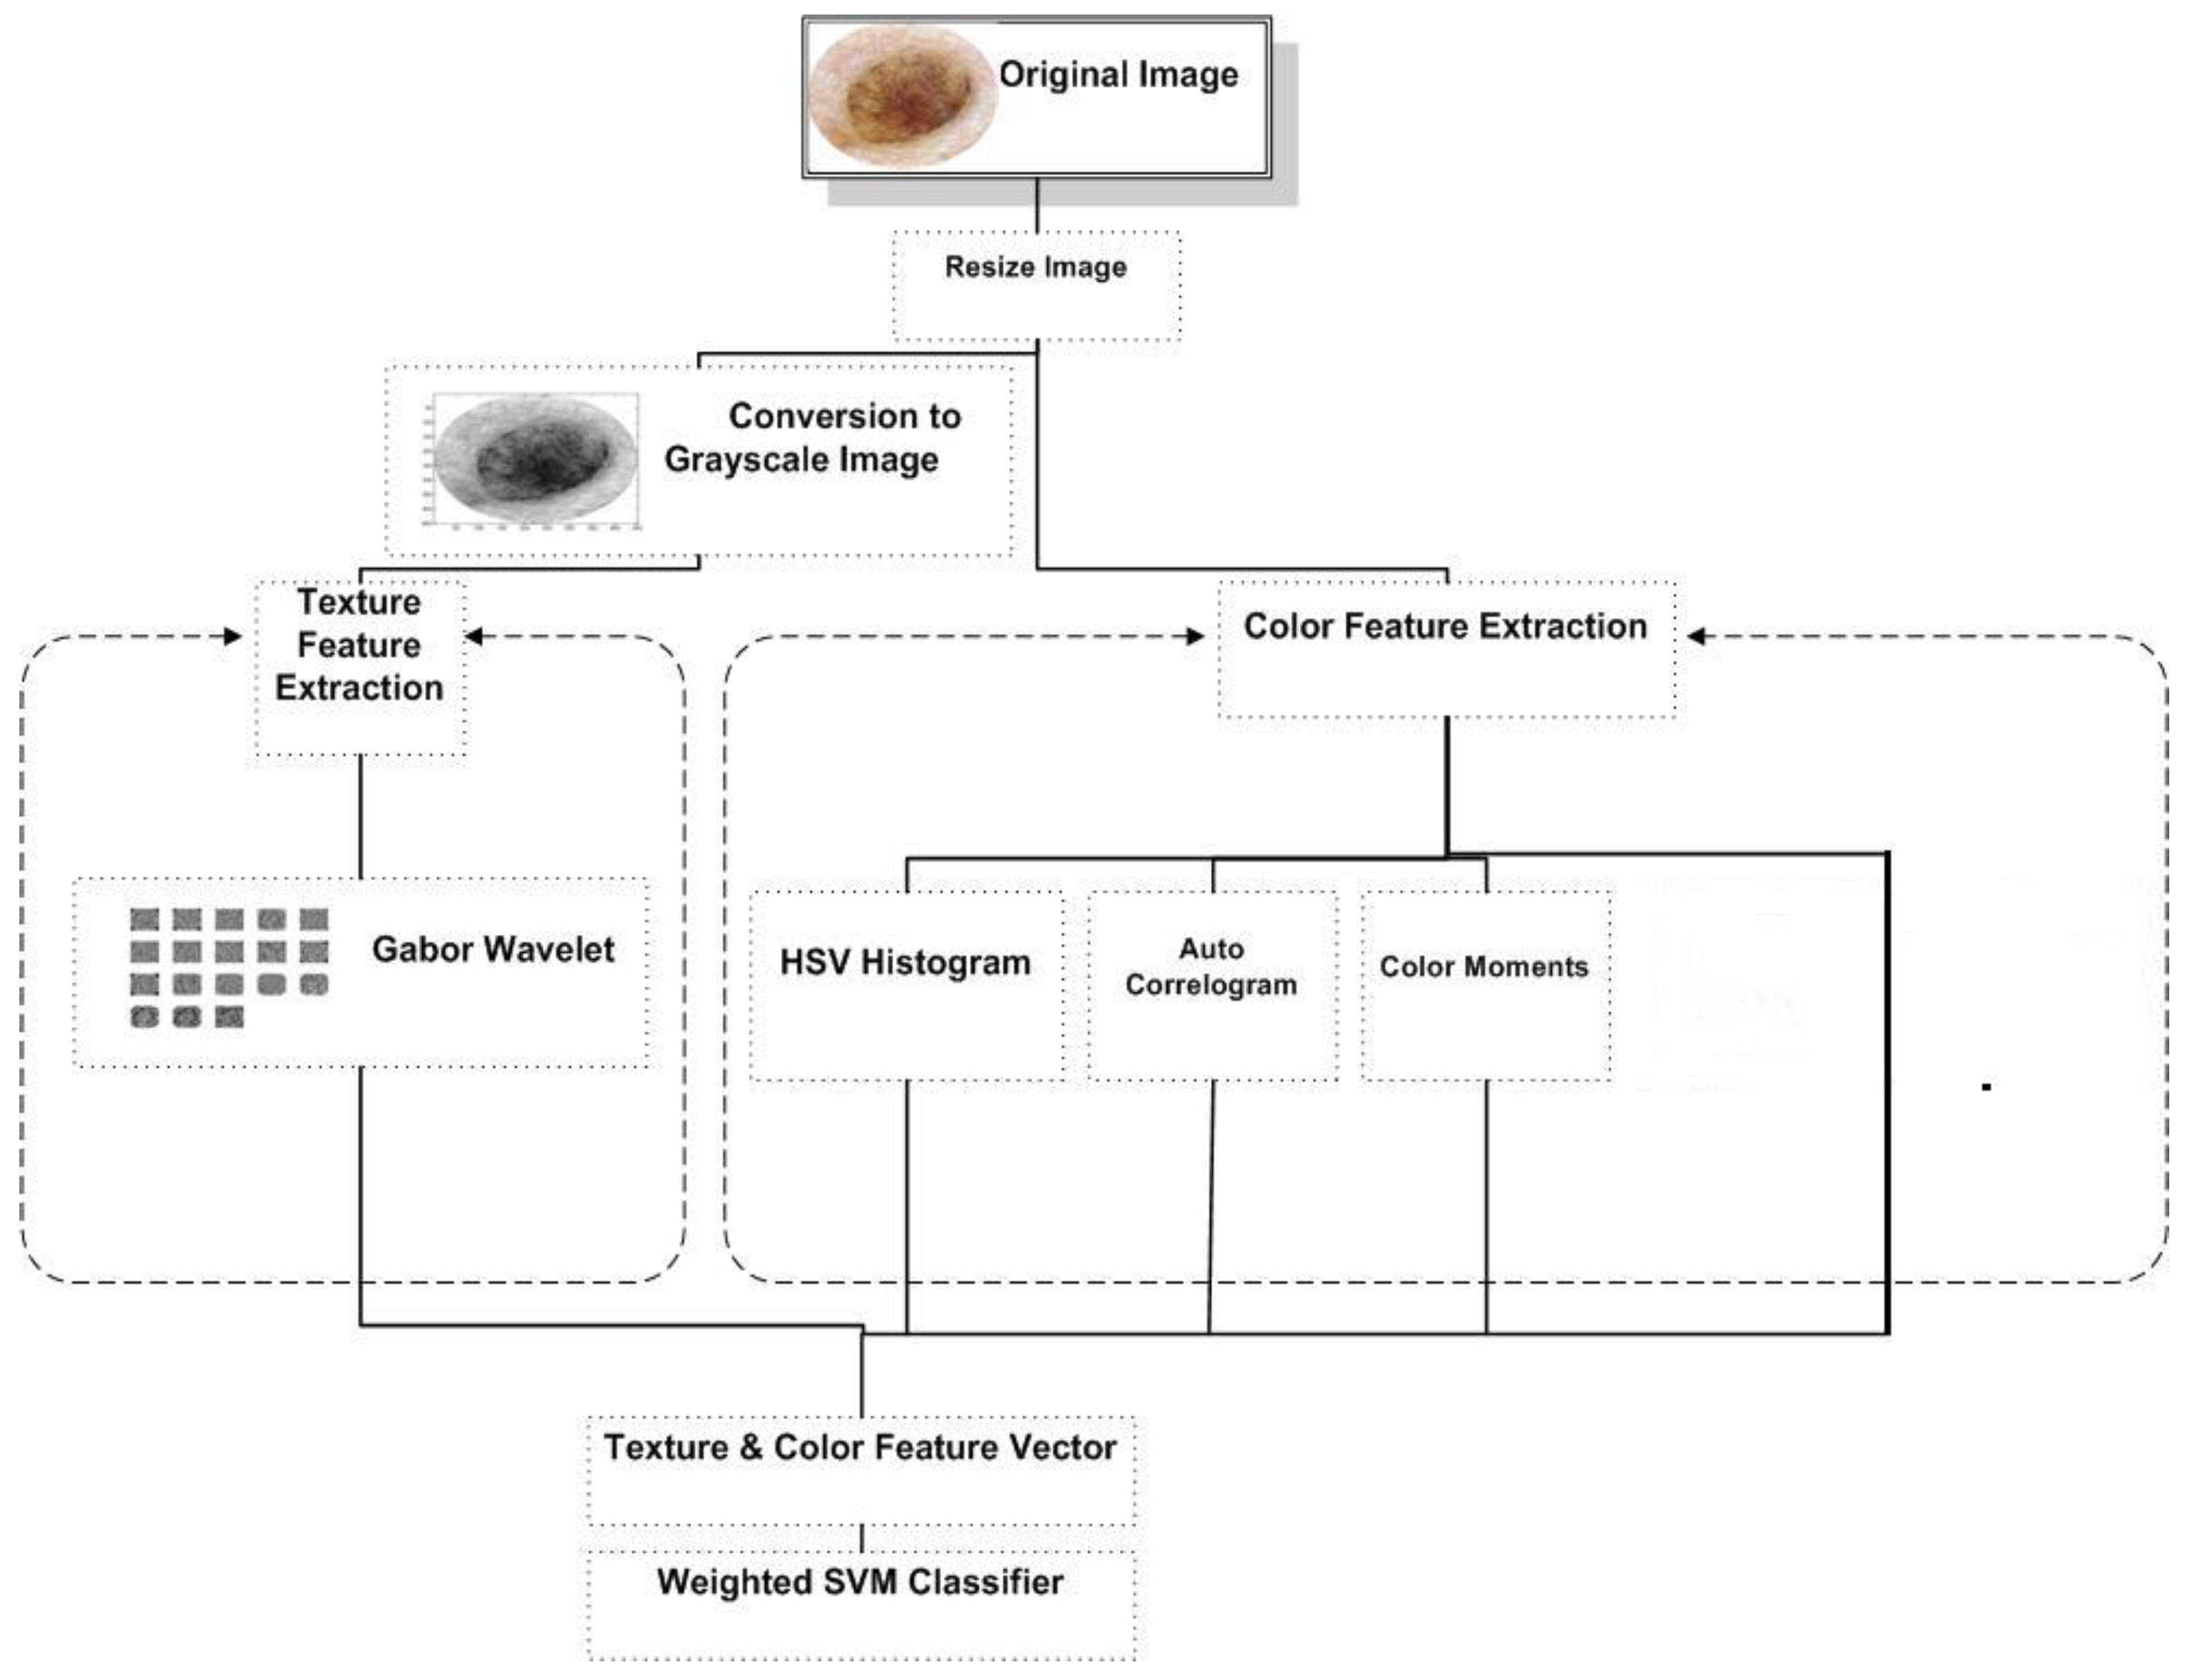
The major steps of the proposed melanocytic and non-Melanocytic skin lesions (MnM–SK) system consist of segmentation of region-of-interest (ROI), extraction of color and texture features and then prediction of patterns. All these stages are visually represented by
Figure 1.
In the first phase, automatic segmentation of the region-of-interest (ROI) step is performed by taking the circular center of each PSLs images. The second phase is devoted for color and texture feature extraction. An optimal set of color features is extracted using more effective techniques to predict dermoscopy patterns. To extract color-related features from ROI lesion, color moments, hue-saturation-value (HSV) histogram and auto-correlogram features are defined. The Gabor wavelets technique is then utilized to define texture features. After extracting optimal color and texture features, a feature vector is constructed based on these features, which is used in the prediction of dermoscopy images. Afterwards, these features are recognized by integration the majority voting scheme to support vector machine (MV–SVM) in the third phase.
3.1. Selection of Dataset
The MnM–SK system is tested on a selected dataset of total 350 dermoscopy images. The selected images were collected from different resources but mostly obtained as a CD resource from the two European university hospitals as part of the EDRA-CDROM, 2002 [
26]. In this dataset, seven classes of pigmented skin lesions (PSLs) with different patterns are stored. In each pattern class of dermoscopy images, there are 50 images. The seven patterns are of type starburst, globular, cobblestone, multi-component, pigmented or reticular, parallel and homogeneous in this dataset. All the images were of size (768 × 512) pixels.
In total, 350 images are verified by the dermatologist to avoid confusion or misclassification in the classification process. For further processing, the center circular region of size (384 × 256) is automatically segmented from the images to find the region-of-interest (ROI). Light specular reflection and hair artifacts have mostly appeared in most of the images in the dataset. However, we have selected those images, which do not have the hairs because the aim of this paper is to define the best color and texture features and recognition algorithm for prediction of patterns.
3.2. Region-of-Interest (ROI) Segmentation
To define color and texture features, the region-of-interest (ROI) is segmented from each skin lesion images. For processing, the center circular region of interest (ROI) of size (384 × 256) is automatically segmented from all 350 dermoscopy images. After that, the potential color and texture features are defined that are explained in the subsequent paragraphs.
3.3. Color and Texture Features
The color and texture features are provided very much important characteristics to differentiate among seven patterns of skin lesions. The literature review suggested that those studies have not focused on color features such as color scattering, the spatial correlation of pixels. In previous techniques, they just focused on extracting numerous color features. In contrast of color features, it is very difficult to analyze different types of skin lesions by just considering texture features. Therefore, the proposed system is developed based on optimal and effective color and texture features as presented in the following sub-sections.
3.3.1. Color Features
Color scattering, spatial correlation and color moments methods are used to define differentiation among different patterns. To analyze the color scattering feature, the first red-green-blue (RGB) image is simply transformed to HSV (Hue, Saturation, Value) color space. The HSV color space is selected because of its simplicity and it is also less computational expensive compared to other state-of-the-art color spaces. Then, the HSV histogram is utilized to extract the hue, saturation and value in each input ROI lesion. In fact, the HSV histogram represents how colors are distributed in an image. Basically, it checks how many colors are in the image and in which range they have scattered in the image. The input to determine HSV histogram is the RGB image to be quantized in the HSV color space and output is the vector that indicates the features that are extracted from the HSV color space. HSV space is split into H, S and V plane and quantizes each plane into matrix form using Equation (1). After specifying quantization levels, the quantize values are specified by finding the maxima of each plane using Equation (2):
and normalized of HSV is performed by:
These three quantized values are utilized to calculate color scattering level. To express the spatial correlation between pairs of colors and checks the randomness of color in the image, an auto-correlogram [
27] technique is utilized. An auto-correlogram has analyzed how different colors are correlated in the specific type. The input to determine auto-correlogram is the ROI image in RGB format. This RGB image is converted into the indexed image by using “no dither” specification to get the resultant new map required for finding correlogram. Then an indexed image is converted into again RGB color space and distances are defined between neighborhood pixels. For each column in z-plane calculate the final correlogram by using distances formula of Equation (3). The eighteen mean values of this correlogram are extracted from each channel of RGB image:
Subsequently, color moments are calculated to check global color variation in an image. It is also used to measure the color correspondence between images. We calculated two color moments for each channel. The input to determine color moment is the RGB image. The first moment is the average color in the image, also known as the mean moment. The second color moment is the standard deviation, which is the square root of the variance. The mean and standard deviation features are extracted from each channel of the RGB images. In total, the six color moments features are extracted.
3.3.2. Texture Features
Color-related features are just focused on color properties of the image and these color features do not provide important characteristics to quantify the texture/pattern. In the literature, there are several studies that focused on extract texture feature from the skin lesion. However, in this paper, texture features are extracted using Gabor wavelets transform (GWT) [
28] technique to measure the pixels interaction.
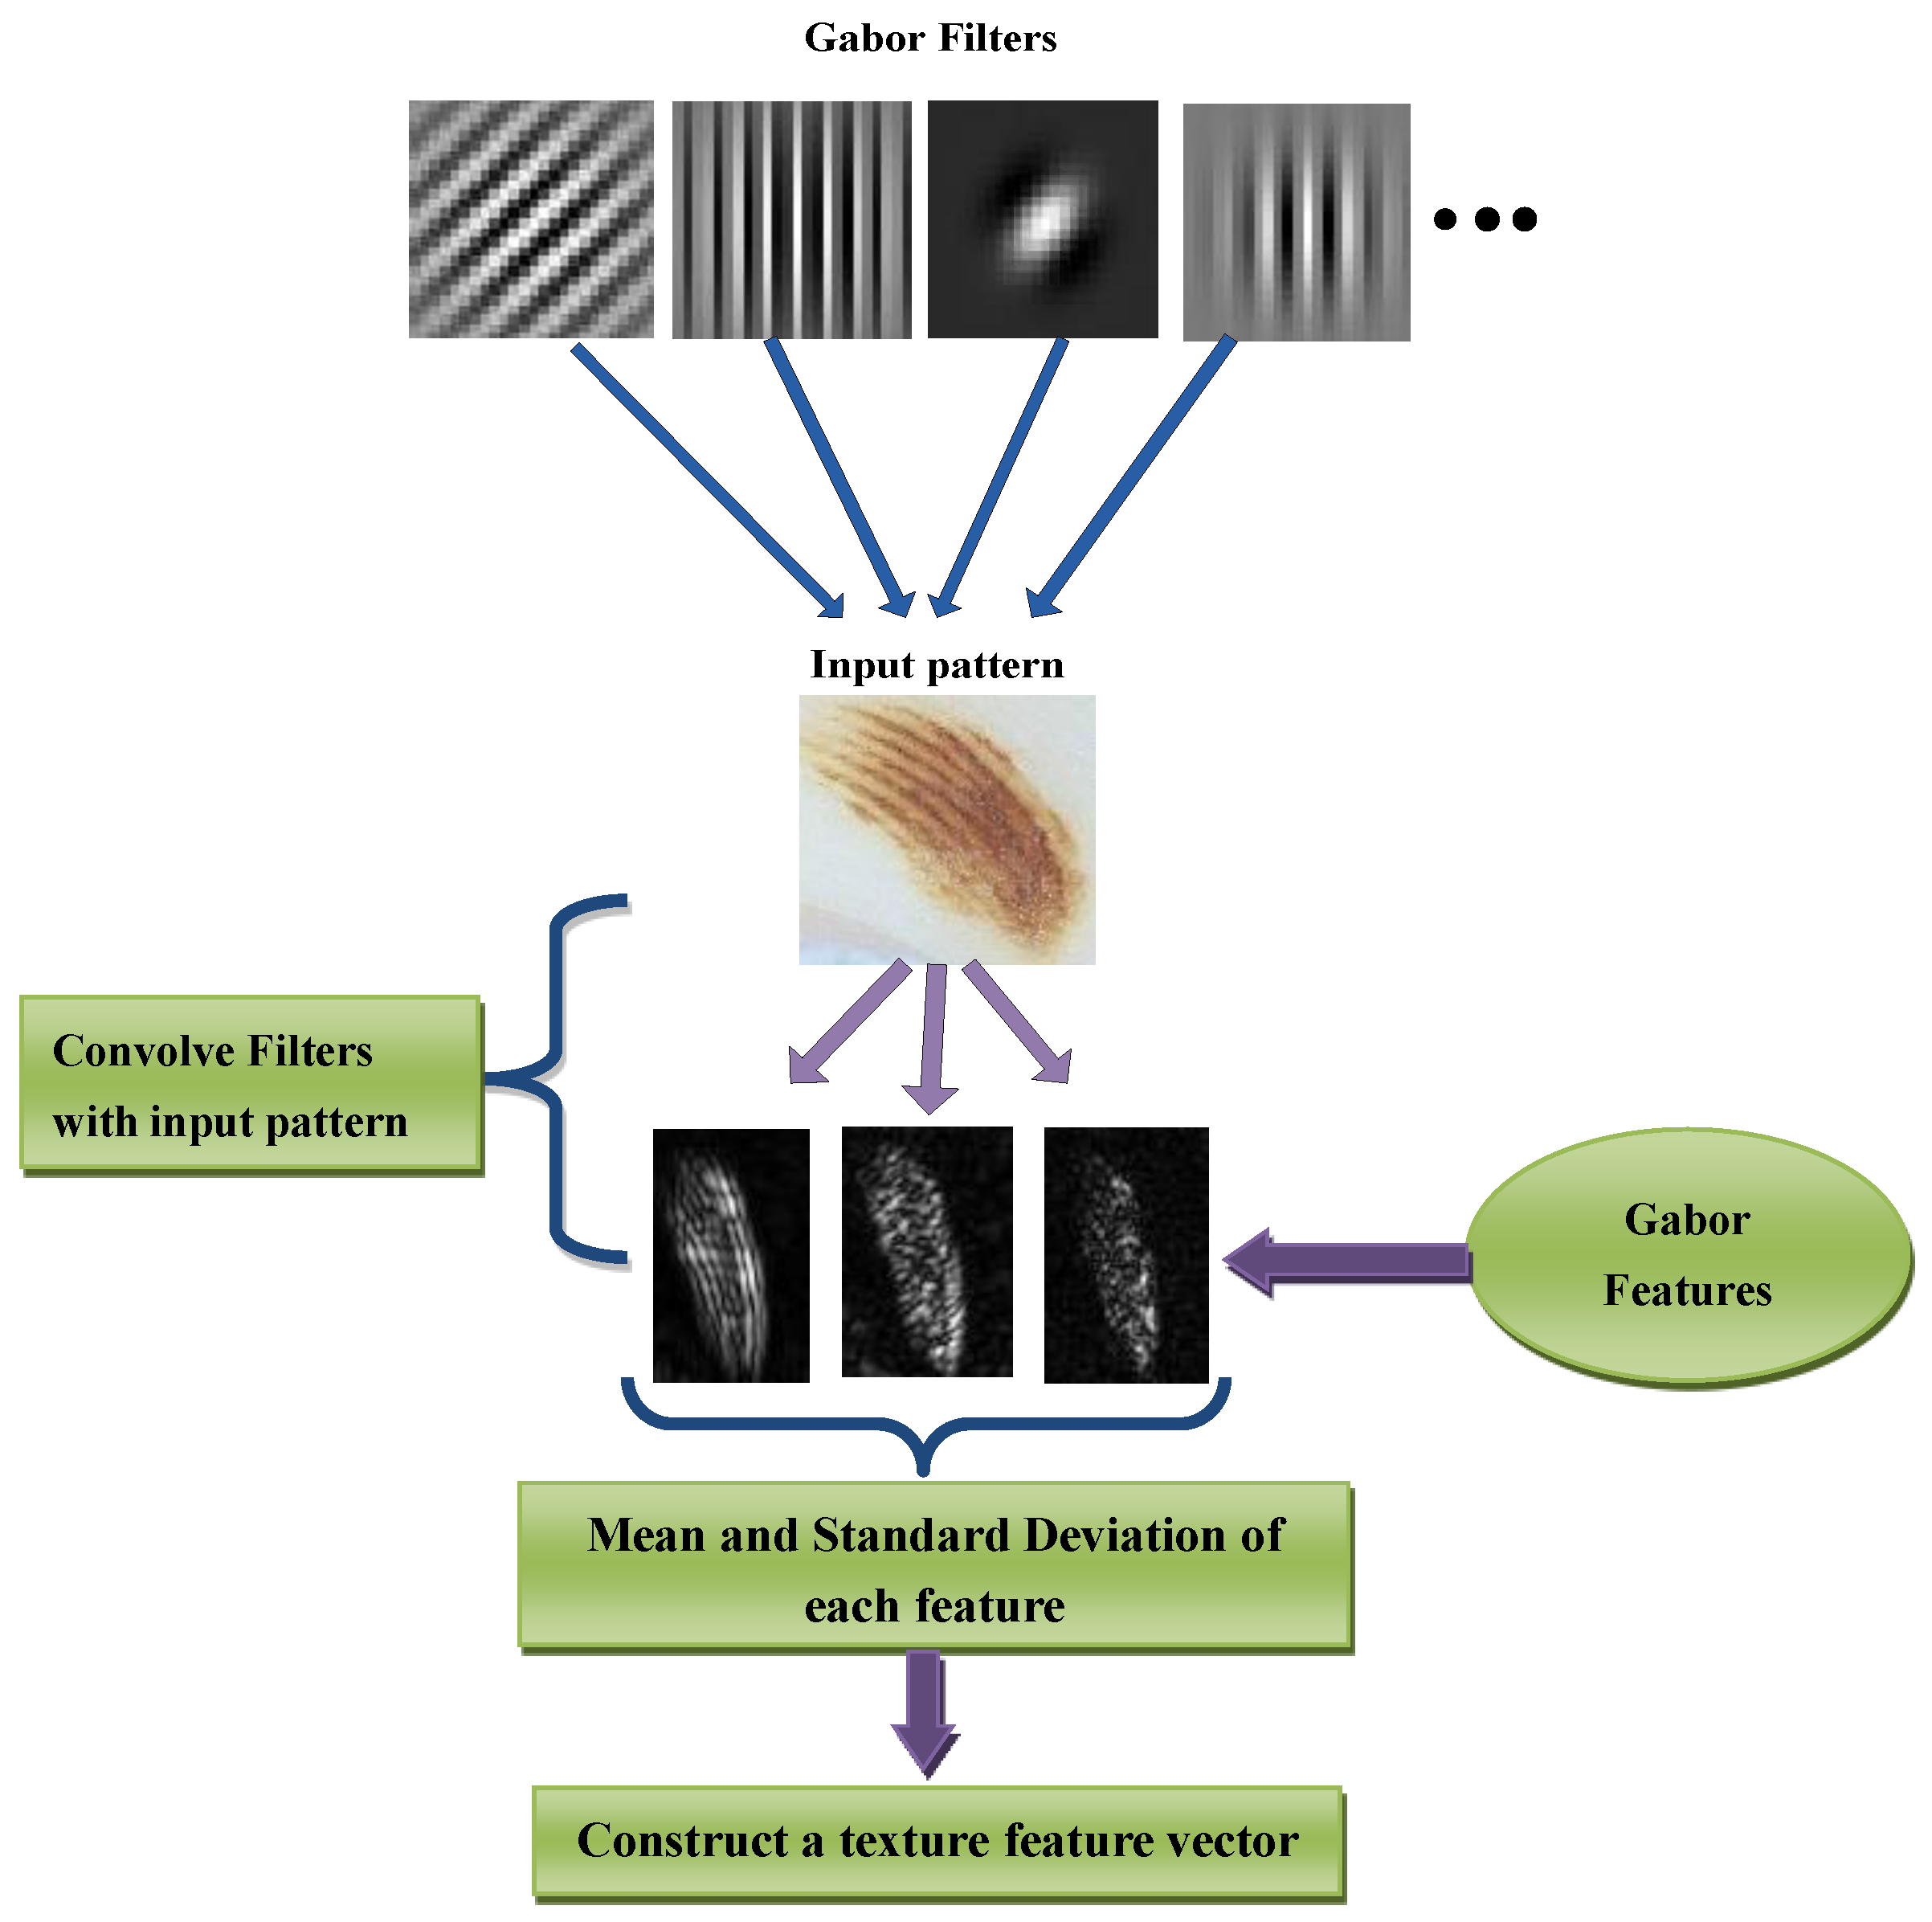
For pattern analysis, Gabor wavelet transform (GWT) is used because it has properties of both multi-resolution and multi-orientation and also optimal for measuring local spatial frequencies. It is also an important technique for extracting features, and these are also very helpful in the representation of images in a good sway. A Gabor filter is obtained by multiplying a sinusoid with a Gaussian kernel. In this study, 2D Gabor filters are utilized. The Gabor filters consist of the real component and imaginary components. By doing experiments, it was concluded that the imaginary response of the Gabor filter has a better recognition result than real response because the imaginary component has zero means, and the real component has a non-zero mean. In the 2D Gabor filter, there are several parameters such as centers, orientations, frequencies, and standard deviations. Different combinations of these parameters produce a set of Gabor filters, and we have to select the filters that are best for feature extraction. The eight features are included of four orientations (0, 45, 90, 135) at local and high frequencies. The windows size of the Gabor transform is fixed as (17 × 17). These eight features are extracted based on mean values at each orientation. The extraction of texture features is visually displayed in
Figure 2.
3.4. Prediction
The feature vector is generated, which consists of three values of HSV histogram, 18 values of auto correlogram, six values of color moments, and eight values of Gabor wavelets transform (GWT) features. In total, 29 optimal features are used to define color and texture vector of each ROI skin lesion. These color and texture features are combined into a feature vector using concatenation and afterwards, the feature vector is normalized via a normal probability-density function (PDF). This PDF technique is used to transform this vector into zero mean and unit variance:
The normalized set of feature vectors (Fv) is fed into a machine learning algorithm to differentiate seven classes of dermoscopy patterns. This vector (Fv) contains relevant features that 100% do not affect classification accuracy. It was empirically observed by doing cross-validation test experiments on these color and texture features. Therefore, there is no need to perform feature selection steps. Already, the 29 are the minimum set of color and texture features to classify dermoscopy patterns.
For prediction of these features, the majority voting based multi-class support vector machine (MV–SVM) algorithm is developed to solve this multi-class problem. The majority voting scheme is integrated to SVM multi-class because the predictor is selected based on the maximum occurrence during the classification step. The SVM algorithm is utilized because it is based on the structural risk minimization (SRM) principle, which minimizes the upper bound on the generalization error. As a result, SVMs are less prone to overfitting when compared to the algorithms that implement the back propagation neural networks (NNs). Another advantage of SVMs is that they provide a unified framework in which different learning machine architectures can be generated through an appropriate choice of kernel. In general, the SVM [
29] belongs to the Kernel methods category. Among all the ensemble classification methods, the majority-vote algorithm required a very simple implementation and it can easily integrate the classifiers. However, the basic majority-vote scheme needed prior domain-expert knowledge of individual classifiers to combine them. As a result, the prior-weights are automatically calculated based on mean and variance of labelled data in seven dermoscopy classes. By the addition of prior-weights into the majority-vote scheme, effective classification results are obtained that can improve the recognition rate. It has been also noticed that a few dermoscopy samples are utilized in the training dataset so the majority-voting scheme is the most important and appropriate option in this scenario.
In this MV–SVM method, the one-versus-all approach and RBF Kernel method is used because they provide more stable results than any of the other kernel functions. Another advantage of the RBF function is that it requires setting less hyper parameters
when being compared to the polynomial that needs
to be determined and the sigmoid kernel
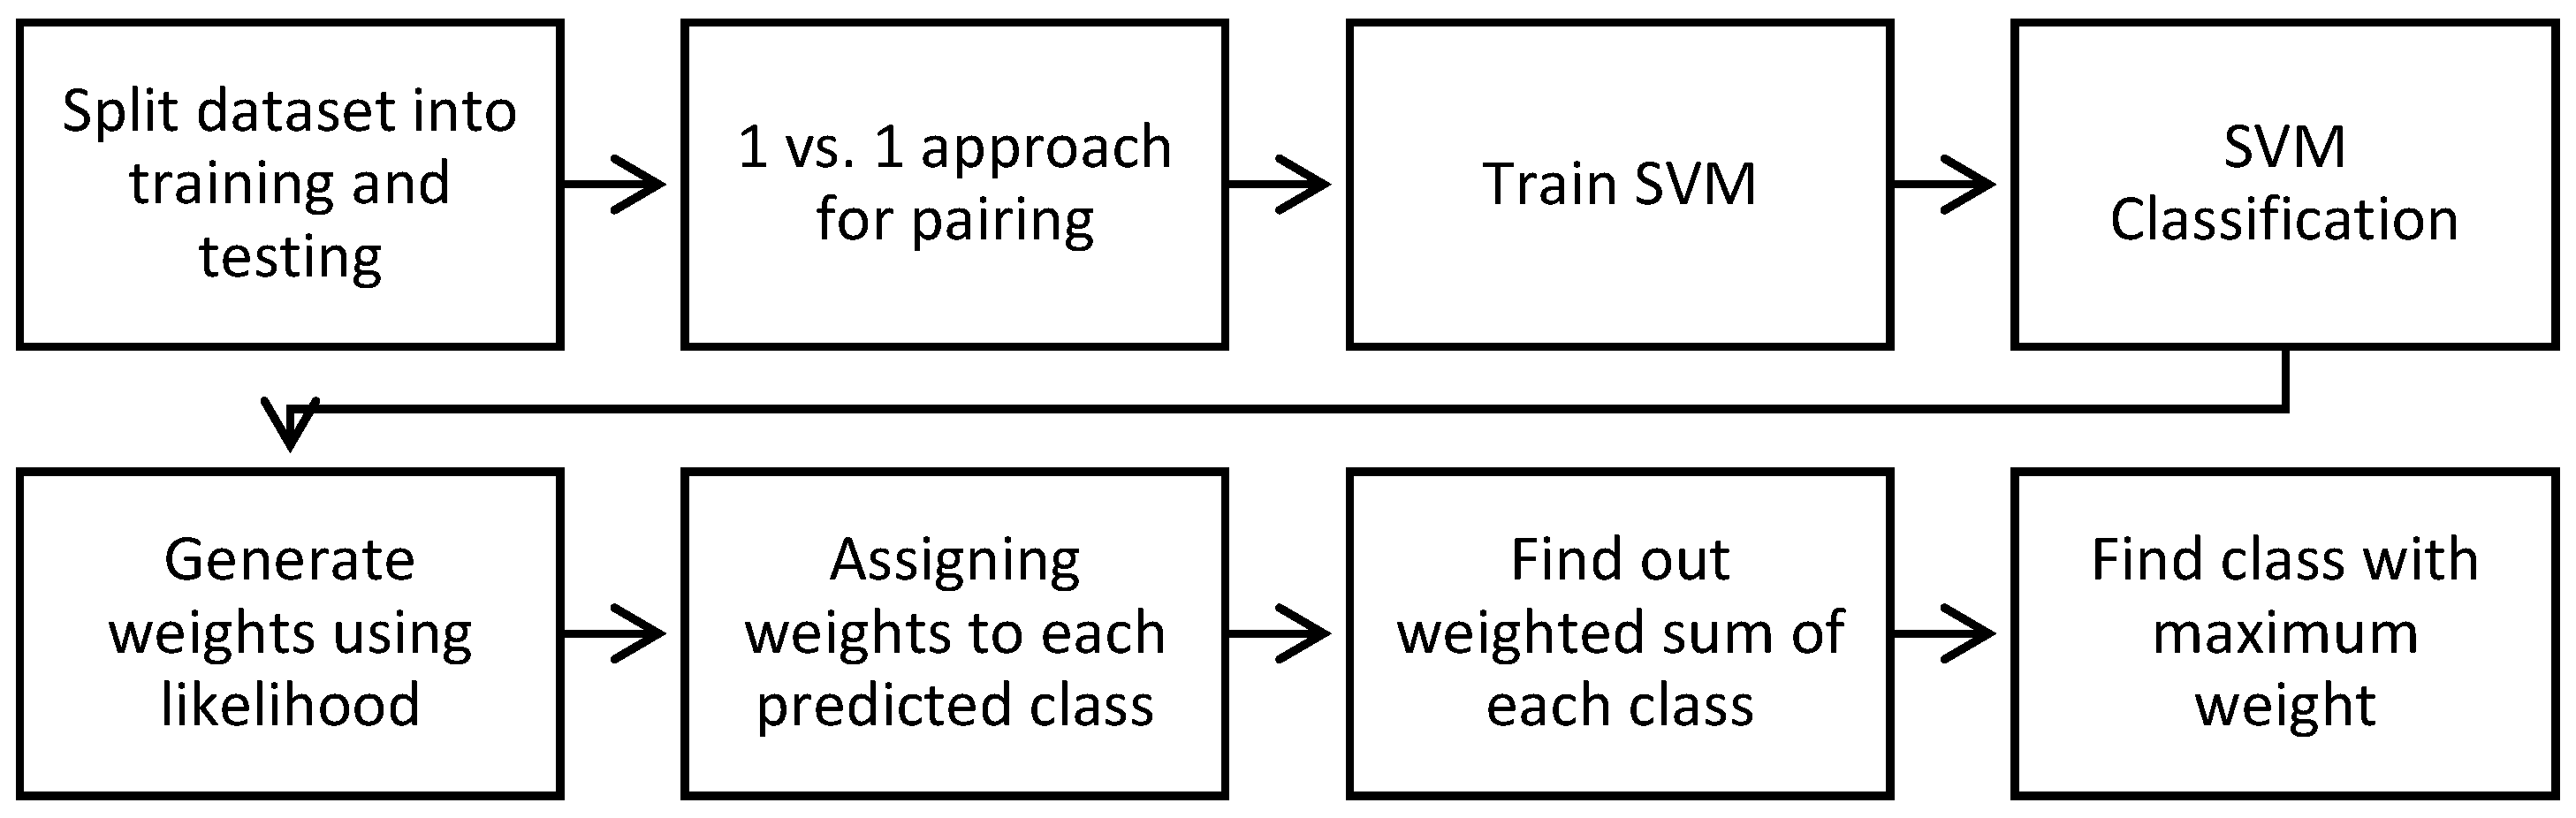
. The complete algorithm for creating prediction seven classes of skin lesions by MV–SVM classifiers is shown in Algorithm 1. Algorithm 1 as pseudocode format and the algorithmic steps are visually given in
Figure 3.
| Algorithm 1: MV–SVM (Majority Voting based Support Vector Machines) Algorithm for prediction of skin lesion patterns. |
| Inputs: Let dataset is {} } where m = 7 and Query image feature vector is QFV |
| Set Training: SVM training (dataset, QFV) |
| 1. Perform labeling for each image in the dataset |
| 2. Set [training, testing] = Partition (dataset) |
| 3. Testing: [Perform 1 vs. all pairing of classes to build SVM model] |
Repeat For k = 1 to 7 do
Get those training instances that belong to specific pairs
Compute_Training_SVM (Native SVMs, RBF kernel, weights)
[End For Loop] |
| 4. Training: [Y] = Predict (QFV) |
| 5. Prior-weights are calculated through the likelihood method for each class with respect to their features mean and variance values as shown in Step 6 |
| 6. Calculate weight for each class by using the following likelihood formula:
where, μ is the mean value of X associated with class C and σ^2 is the variance of the values in X associated with class C |
| 7. Assign weights to each class |
| 8. Compute the weighted sum for every class occurrence during SVM classification |
| 9. Perform majority voting technique to predicted classes |
| Output: Find the class with maximum occurrence as an output i.e., [Y] = Predict (QFV) |
4. Experimental Analysis
The total 350 digital dermoscopy images are used by the proposed melanocytic and non-Melanocytic skin lesions (MnM–SK) system to classify seven categories (each pattern class consists of total 50 images) such as starburst, reticular, globular, cobblestone, multi-component, pigmented network, parallel and homogeneous. All the images were of size (768 × 512) pixels, and from the center, the region of size (384 × 256) is automatically segmented from all 210 images to find region-of-interest (ROI). From each ROI lesion, the color and texture features are extracted and then normalize using the probability density function (PDF). These normalize features total 29 altogether and are the most discriminate features that are selected by the proposed MnM–SK system. These dominant 29 features are fed into an ensemble of majority-voting and multiclass support vector machines (MV–SVM) algorithms to predict the patterns of dermoscopy images.
The MnM–SK system was preliminarily implemented in Matlab 15® (The Math works, Natick, MA, USA) using a core i7 Quad core system with Windows 7 operating system. The overall system running time depends on how each component of the system is performing and how much time it takes to perform their jobs. Accordingly, the system on average takes almost 1.6 s for the process to the query image to match with the seven categories of dermoscopy patterns. However, the extraction of features step takes 8.5 s on average. Therefore, the proposed system is computationally inexpensive compared to the state-of-the-art prediction system.
To evaluate the performance of MnM–SK system, the sensitivity, specificity, classification accuracy and area under the receiver operating characteristics (AUC) curve statistical measures are used. The sensitivity (SN), specificity (SP) and accuracy (AC) of the system are calculated by using the following statistical formulas:
where sensitivity represents that the images are correctly classified as they belong to a specific pattern class, and specificity represents that the images are correctly classified as they do not belong to a specific class, whereas the TP, FP, TN, FN represent the number of true positives, false positives, true negatives and false negatives, respectively. Moreover, to judge the general discrimination power of the MnM–SK system, the area under the receiver operating characteristic (AUC) curve is the approximately used index. The value of AUC is ranges from 0.50 to 1.0 and the greater AUC value indicates that the system has a higher level of classification accuracy.
The 320 total ROI images features are separated into five groups via a random-wise method. Therefore, the evaluation performance of the MnM–SK system is measured five times with the other state-of-the-art classification systems. The state-the-art classification systems such as neural networks (NNs) and support vector machines (SVMs) are utilized to compare the significance of the proposed MnM–SK system. This performance is evaluated by using the one-versus-all technique and 10-fold cross-validation test.
In
Table 3, the pattern classification results of the proposed MnM–SK system are presented by using SN, SP, AC and AUC statistical measures. From this table, it can be observed that, on average, the best pattern classification results are obtained such as SN of 94%, SP of 84%, AC of 93% and AUC of 0.94. As represented in
Table 3, the MV–SVM (Majority Voting based Support Vector Machine) system obtains the most accurate results overall by calculating sensitivity (SN), specificity (SP), accuracy (AC) and AUC measures. It happens due to use of new color features and adding of the majority voting concept to SVM classifier. It was also observed that the Parallel patterns of Acral melanoma (melanocytic lesions) achieved higher pattern classification results (SN of 92.5%, SP of 84.5%, and AC of 96% and AUC of 0.96) compared to other patterns, whereas, in the case of homogeneous patterns, an SN of 88%, SP of 75%, AC of 87% and AUC of 0.90 values are achieved. This shows that this class of dermoscopy patterns obtained less classification results compared to other patterns.
On the other hand, the significance of proposed (MnM–SK) systems are compared with two other machine learning algorithms such as support vector machines (SVMs) and neural network (NN) methods.
Table 4 represents the results in terms of SE, SP and AUC statistical metrics. In the case of the NN classification algorithm, the statistical values are obtained as Cobblestone (SE: 72, AC: 70, AUC: 0.75), globular (SE: 63.2, AC: 60, AUC: 0.64), homogeneous (SE: 72, SP: 71, AUC: 0.72), multicomponent (SE: 50, SP: 45, AUC: 0.55), parallel (SE: 77, SP: 72, AUC: 0.72), pigmented network or reticular (SE: 68, SP: 65, AUC: 0.66) and starburst (SE: 70, SP: 65, AUC: 0.67). However, the SVM algorithm achieved relatively better performance than the NN approach as Cobblestone (SE: 78, AC: 73, AUC: 0.76), globular (SE: 68, AC: 71, AUC: 0.70), homogeneous (SE: 74, SP: 80, AUC: 0.76), multicomponent (SE: 64, SP: 68, AUC: 0.60), parallel (SE: 79, SP: 83, AUC: 0.80), pigmented network or reticular (SE: 62, SP: 65, AUC: 0.64) and starburst (SE: 74, SP: 78, AUC: 0.72).
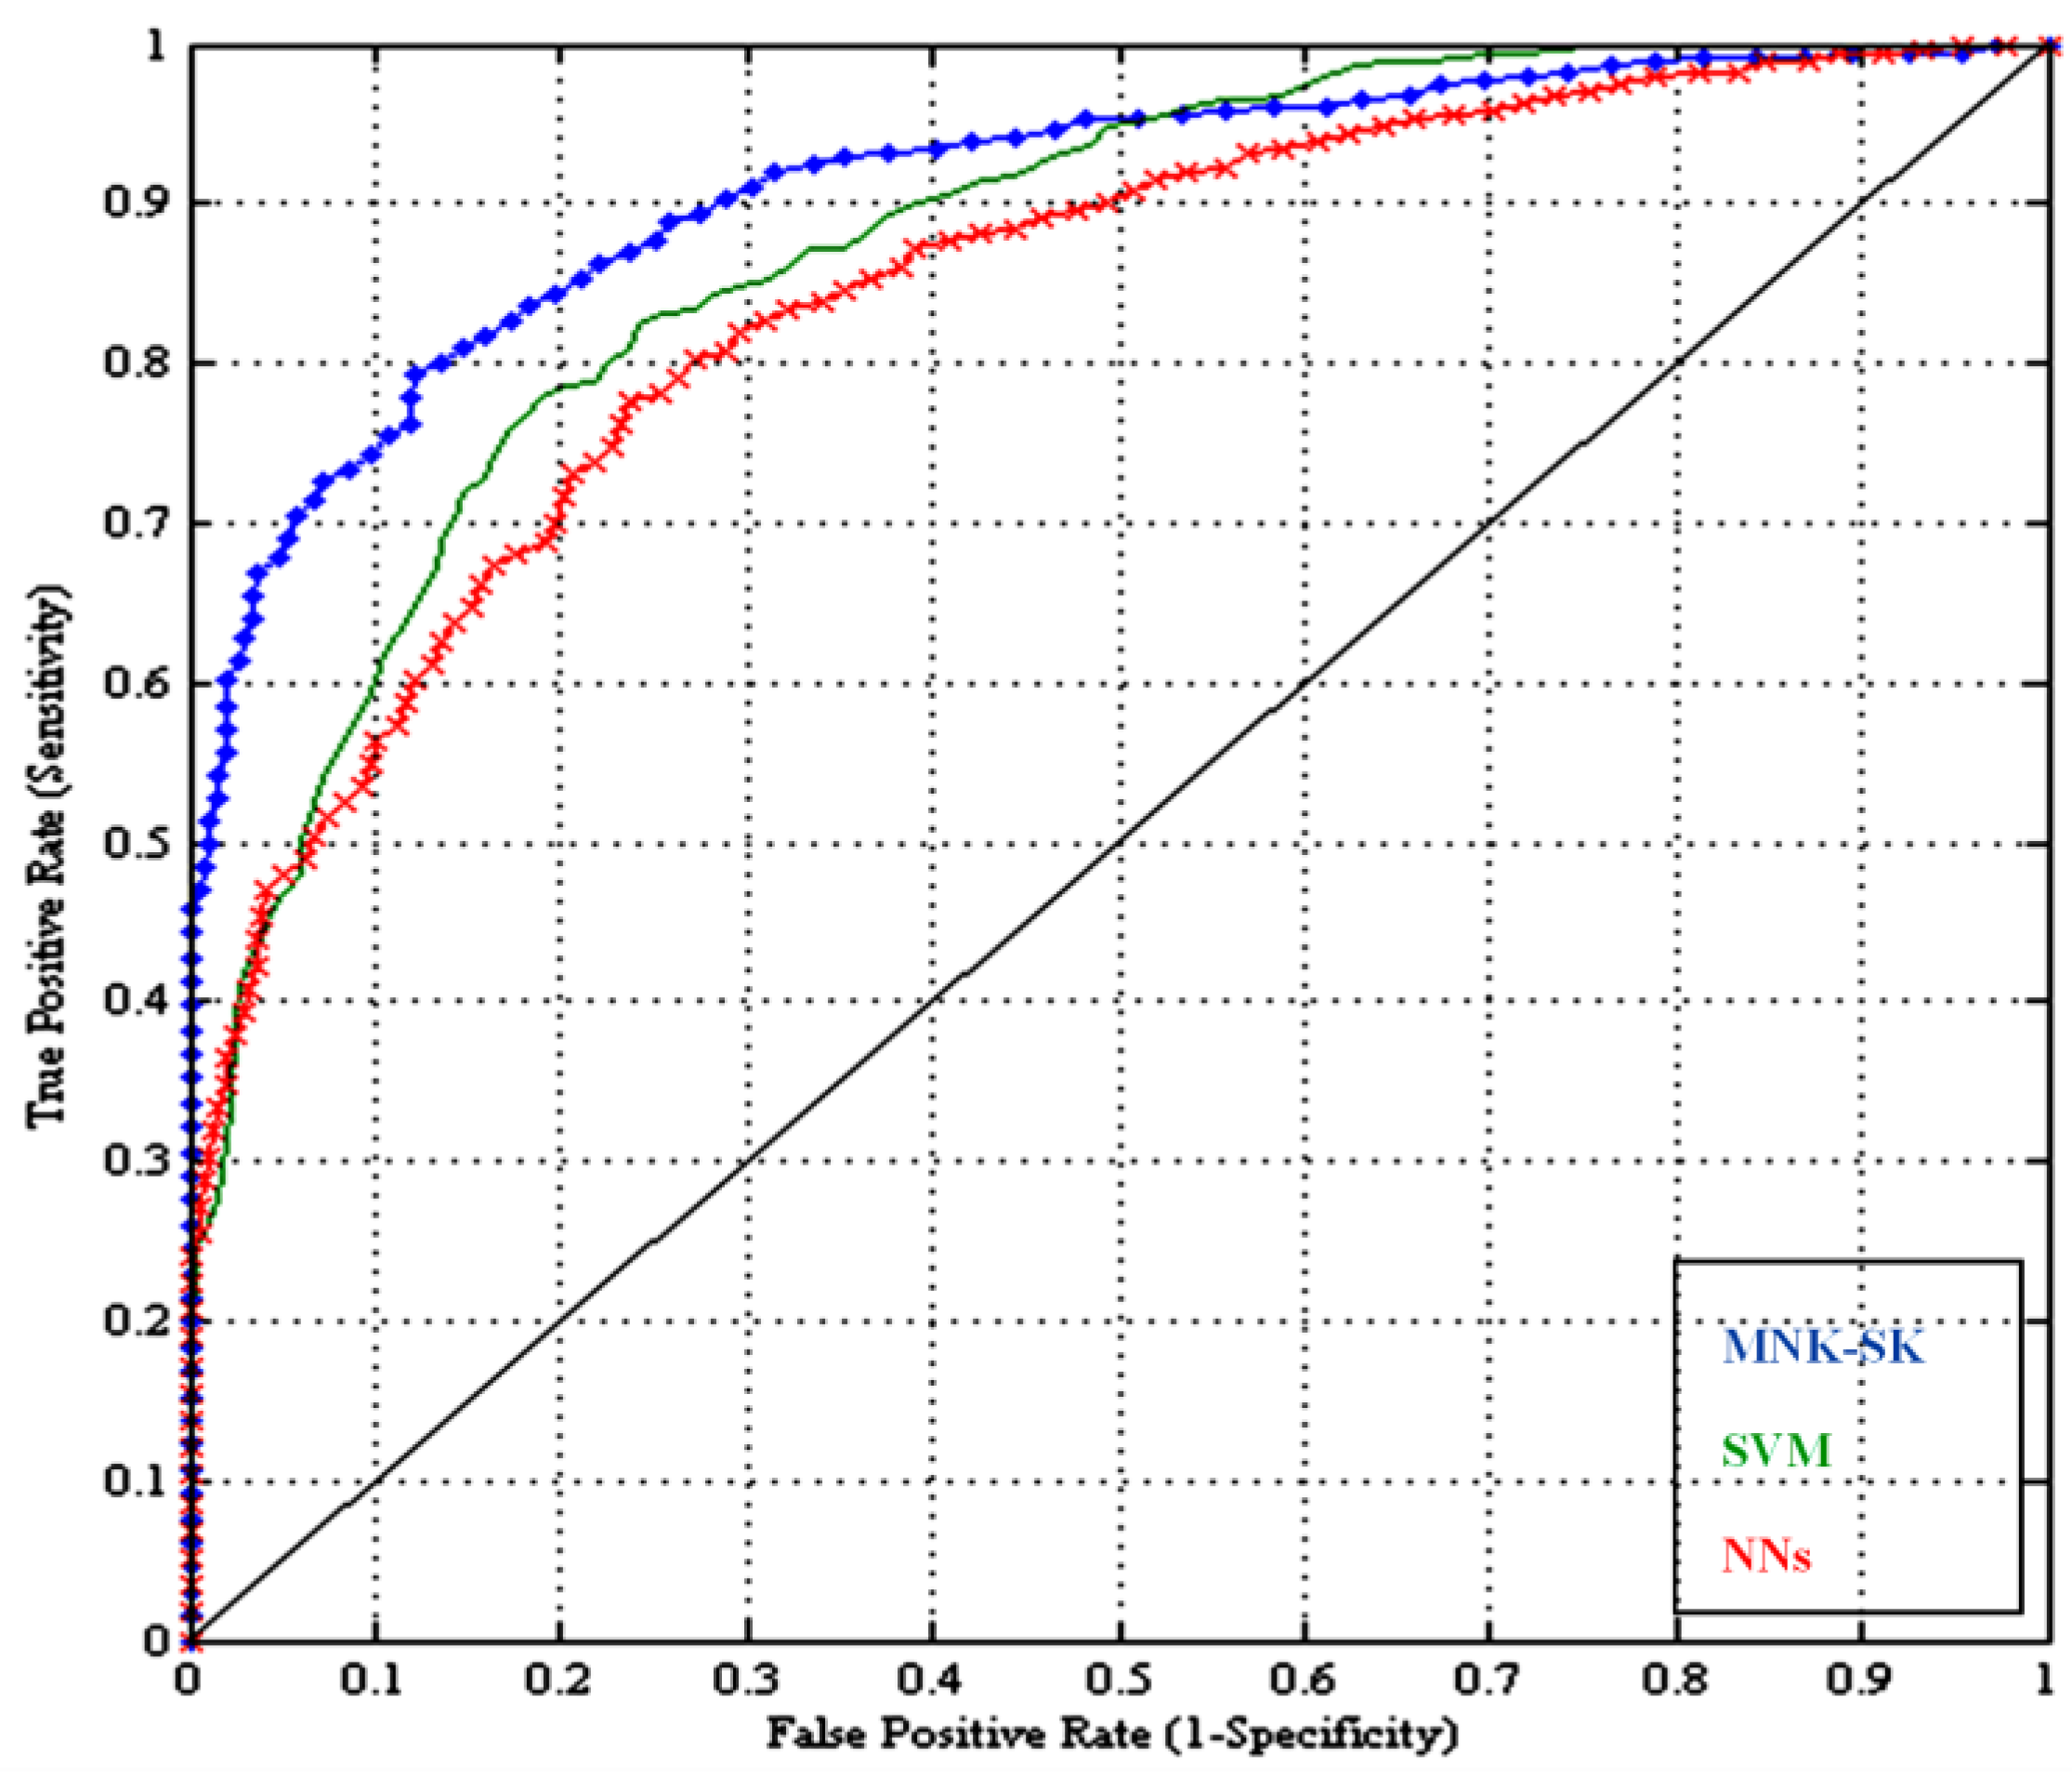
The significance results of the MnM–SK system is also displayed in terms of area under the receiving operating characteristic curve (AUC) in
Figure 4. As shown in this figure, the AUC curve of the proposed MnM–SK has significantly advanced the performance of the differentiation of dermoscopy patterns as compared to the other two NN and SVM classifiers. On average, an area under the receiver operating curve (AUC) of 0.94 is achieved by the MnM–SK that is better than the other two systems, due to integration of the majority-weighting concept in multiclass support vector machine with optimal color and texture features.
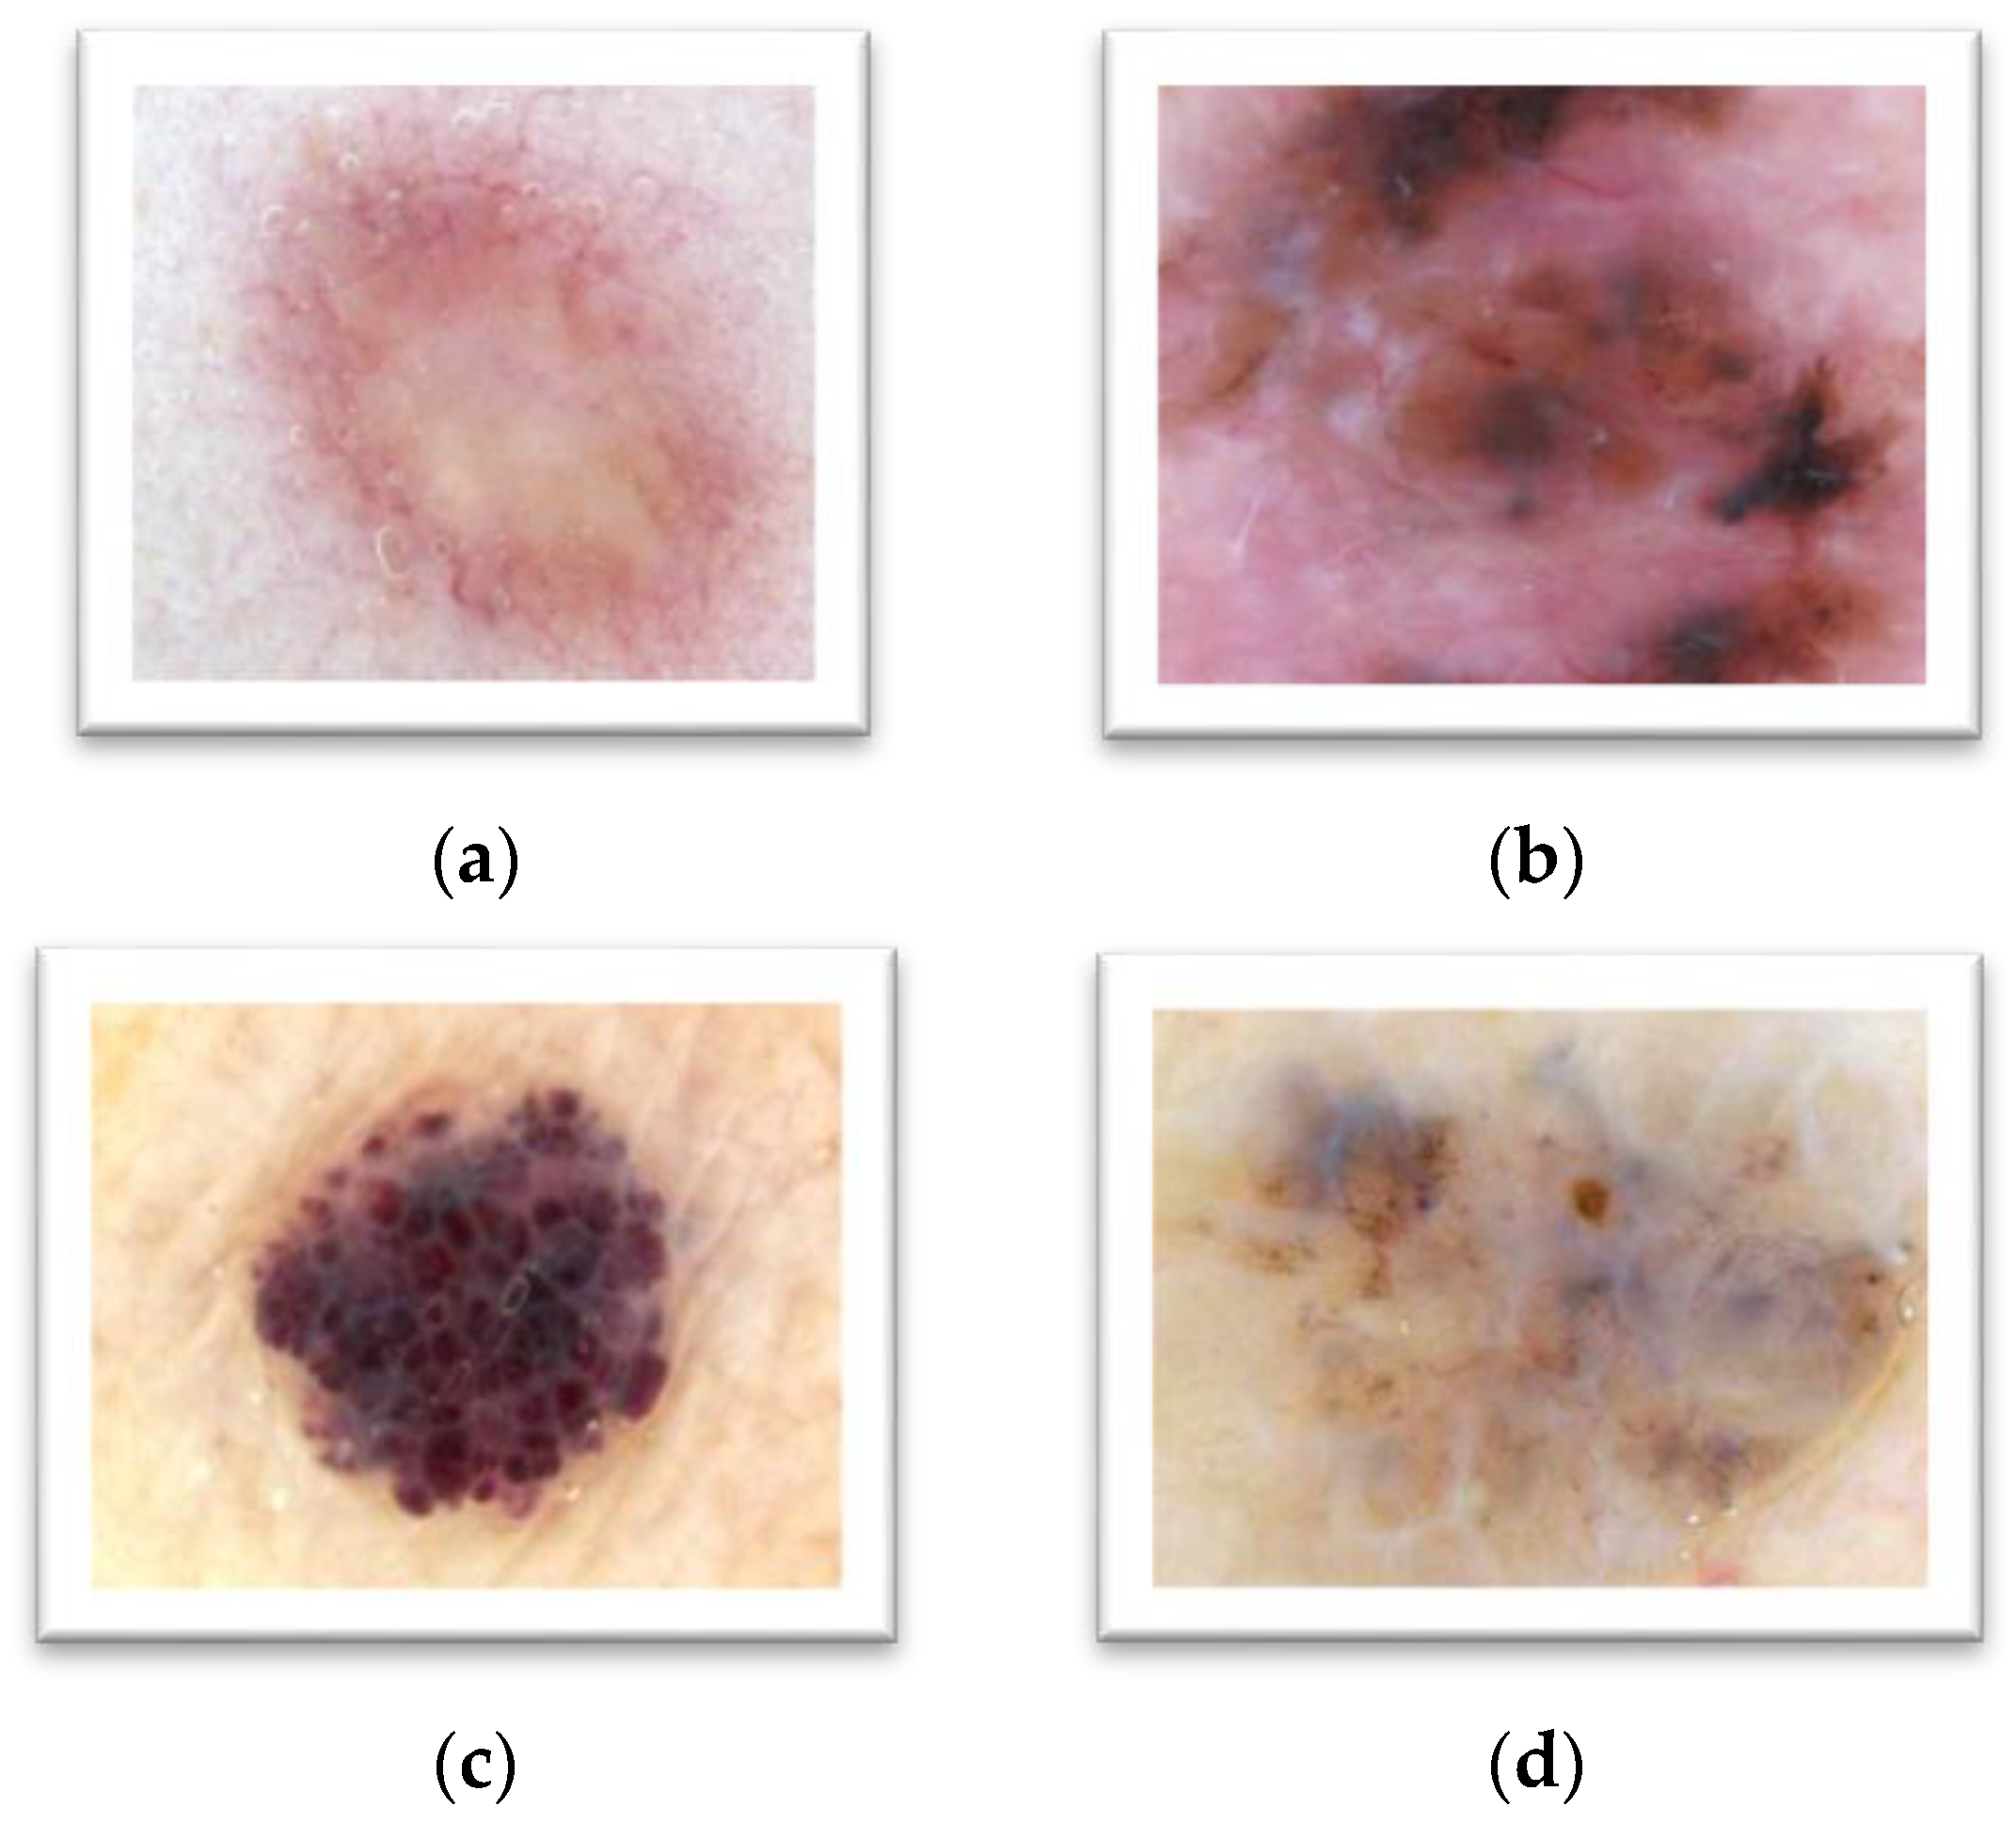
To differentiate between melanocytic and non-melanocytic skin lesions, a distinct experiment is also performed to notice the usage of the pattern classification system. The melanocytic pigmented skin lesions (PSLs) are benign, blue nevus, Junctional nevus, compound nevus and many malignant melanoma as displayed in
Table 2. On the other hand, the non-melanocytic PSLs are classified as Hemangiomas, Dermatofibroma, Basal cell carcinomas (BCC) and Markel cell carcinomas (MCC) etc. (as shown in
Figure 5). In this type of experiment, the ABCD rule is combined with the CASH rule, which is developed by the proposed MnM–SK system. To perform this kind of analysis, 10 images of ROIs of each category are obtained. From this experiment, it was noticed that the classification accuracy on average of non-melanocytic lesions are is 90% as compared to melanocytic PSLs, i.e., 94%.
5. Discussion
The primary aim of this research paper is to develop another pattern classification system with effective color and texture features. These features are then fed into the machine learning algorithm. In this paper, the multiclass support vector machine (MV–SVM) is used with the majority voting scheme to automatically recognize the seven classes of dermoscopy patterns. This MV–SVM system can help clinical experts to recognize melanoma versus nevus skin lesions by accurate analysis of patterns. This kind of pattern analysis is used to differentiate between melanocytic and non-melanocytic skin lesions. As a result, this MV–SVM system could potentially increase the performance level of computer-aided detection (CAD) or content-based image retrieval (CBIR) systems for automatic diagnosis of skin cancer. In the clinical diagnostic system, the dermatologists are using ABCD or CASH methods to differentiate between different classes of skin lesions. However, the obtained results of MV–SVM system indicate that it provides effective feedback to experts as a second opinion for categorizing dermoscopy images.
It is clear that high clinical accuracy has achieved more than 91% in terms of starburst, globular, reticular and parallel patterns compared to homogeneous, multicomponent and cobblestone patterns. In the case of homogeneous, multicomponent and cobblestone patterns, the sensitivity is below 95% because of multicomponent pattern lesions consisting of homogeneous and cobblestone patterns. In the research paper [
10], this problem was focused on recognizing the multicomponent patterns.
Alternatively, the performance of MnM–SK is also compared with neural networks (NNs) and support vector machines (SVMs) by 10-fold cross-validation test by the one-versus-all approach. The experimental results are displayed in
Table 4 on 350 ROI dermoscopy images. Hence, the performance of the MnM–SK proposed a system for pattern classification that obtained significantly improved performance compared to NN and SVM algorithms. On average, the SN of 94%, SP of 84%, AC of 93% and AUC of 0.94 are achieved by the proposed MnM–SK system. It happens due to the use of new color features and adding of majority voting concept to the SVM classifier. It was also observed that the parallel patterns of Acral melanoma (melanocytic lesions) achieved higher pattern classification results (SN of 92.5%, SP of 84.5%, and AC of 96% and AUC of 0.96) compared to other patterns, whereas, in the case of homogeneous patterns, the SN of 88%, SP of 75%, AC of 87% and AUC of 0.90 values are achieved. This shows that this class of dermoscopy patterns obtained fewer classification results compared to other patterns. In case of the NN classification algorithm, the statistical values are obtained as Cobblestone (SE: 72, AC: 70, AUC: 0.75), globular (SE: 63.2, AC: 60, AUC: 0.64), homogeneous (SE: 72, SP: 71, AUC: 0.72), multicomponent (SE: 50, SP: 45, AUC: 0.55), parallel (SE: 77, SP: 72, AUC: 0.72), pigmented network or reticular (SE: 68, SP: 65, AUC: 0.66) and starburst (SE: 70, SP: 65, AUC: 0.67). However, the SVMs algorithm achieved relatively better performance than the NN approach as Cobblestone (SE: 78, AC: 73, AUC: 0.76), globular (SE: 68, AC: 71, AUC: 0.70), homogeneous (SE: 74, SP: 80, AUC: 0.76), multicomponent (SE: 64, SP: 68, AUC: 0.60), parallel (SE: 79, SP: 83, AUC: 0.80), pigmented network or reticular (SE: 62, SP: 65, AUC: 0.64) and starburst (SE: 74, SP: 78, AUC: 0.72).
Significant improvement is achieved by the proposed MnM–SK system using multi-class SVM and majority-voting scheme. This happens due to the fact that the basic majority-vote algorithm requires a prior domain expert knowledge of individual classifiers to combine them. However, in this paper, the prior-weights are automatically calculated based on mean and variance of labelled data in seven dermoscopy classes. By the addition of prior-weights into the majority-vote scheme, effective classification results are obtained that can improve the recognition rate.
6. Conclusions
This paper presents an alternative pattern classification for recognizing of melanocytic and non-melanocytic skin lesions (MnM–SK). The MnM–SK system can be used to classify all categories of pigmented skin lesions (PSLs). In this research paper, the neural networks (NNs) and support vector machines (SVMs) are also utilized to show the performance of the proposed MnM–SK system. The MnM–SK system is estimated by means of a dataset of 350 dermoscopy images (50 ROIs per class). On average, sensitivity of 94%, specificity of 84%, 93% of accuracy and area under the receiver operating curve (AUC) of 0.94 are achieved by the MnM–SK system compared to state-of-the-art methods (NNs and SVMs). The proposed MnM–SK system is better in performance than the neural network (NN) approach as the NN method is designed for only binary classification decision tasks. Therefore, it was not suitable for the multi-class problem such as identifying seven classes of patterns. Compared to the NN methods, the support vector machines (SVMs) are needed to adjust the static weights for multi-class problems. Thus, it was difficult to manually tune the weights for every type of pattern class. As a result, the classification algorithm must adjust the weights at runtime for every class of patterns. This problem is controlled by integrating the majority-vote algorithm in the proposed MnM–SK system.
In this paper, an important contribution is done to extract optimal color and texture features, and runtime weights are adjusted into the multiclass SVM. The majority-vote algorithm is also integrated to vote on seven dermoscopy pattern classes in which the prior-weights are automatically calculated based on mean and variance of labelled data. By the addition of prior-weights into the majority-vote scheme, effective classification results are obtained that can improve the recognition rate. It has also been noticed that a few dermoscopy samples are utilized in the training dataset, so the majority-voting scheme is the most important and appropriate option in this scenario. Accordingly, the new approaches to visual features and learning algorithms will support improvement of the diagnosis process of skin lesions and definitely decrease the mortality rate of melanoma skin cancer.
In future work, this pattern classification system will be combined with the ABCD clinical rule to differentiate the melanocytic and non-melanocytic skin lesions. The new features like bag-of-visual-words and machine learning algorithms (deep learning) will also be tested and compared. These new methodologies will be firstly addressed and integrated into this system to improve the classification accuracy of the non-melanocytic skin lesions. Moreover, a new dataset will also be collected to resolve the problem of classification of melanocytic and non-melanocytic skin lesions. The computation time will be also increased if the proposed MnM–SK system will be implemented in C/C++ languages as compared to the Matlab tool. Therefore, the thousands of lines of code (KLOC) parameter will be measured and time complexity will be re-calculated to judge this argument.


