1. Introduction
Cancer is a result of uncontrolled cell-proliferation, invasion and destruction of healthy tissue. A defective apoptotic program is characteristic of all cancers. One of the main anticancer treatment strategies is to induce apoptosis in cancer cells. To achieve this goal, metal-based anti-cancer drugs have been developed (e.g., platin- and gold-compounds) [
1]. Today, cisplatin is widely used for treatment of a broad spectrum of malignancies [
2]. Unfortunately, the use of platinum based drugs is limited by their toxicity. There is significant risk of emerging drug resistance and nephrotoxicity linked to the use of cisplatin [
3,
4]. Therefore, the search for drugs which have a different mechanism to combat cancer growth and which can evade the resistance mechanism is in progress. Therapeutic value of gold compounds is known since ancient times [
1]. While originally gold salts were clinically used for treating rheumatoid arthritis [
5] over the past decade, they have emerged as a promising class of cytotoxic agents for anti-cancer therapy. Over the past decades, studies have demonstrated the anti-proliferative activity of Auranofin at very low concentrations [
6,
7].
The mechanism of antitumor activity of gold compound is “DNA-independent”, and different from those of platinum drugs [
8]. Marzano and coworkers reported an induction of apoptosis by Auranofin in cisplatin-resistant human ovarian cancer cells [
9]. Thioredoxin reductase a mitochondrial enzyme, which is overexpressed in most cancer cells, was identified as one of the major target for Auranofin [
10].
Apoptosis is also regulated by intracellular calcium signaling ([Ca
2+]
i) and there are considerable amounts of evidence on the central role of [Ca
2+]
i in proliferation and cell death. An increase in [Ca
2+]
i was shown to induce cell death in HeLa-S3 treated with cisplatin [
11]. Generally, an elevation of [Ca
2+]
i, which could occur through an influx of Ca
2+ through Ca
2+-selective channels at the plasma membrane or by release from intracellular stores, is a key factor to trigger apoptosis. Boehning and coworkers emphasized the role of InsP
3R-mediated calcium release from the endoplasmic reticulum in inducing apoptosis in response to specific stimuli [
12]. A recent study reported that clinically relevant concentration of Auranofin evoked Ca
2+-response by specifically activating TRPA1 channels expressed in human differentiated neuroblastoma cell lines (nIMR-32). This mechanism is independent of the inhibition of the thioredoxin reductase [
13]. Wong and colleagues reported that Auranofin, in addition to inhibiting Protein Kinase C, modulated [Ca
2+]
i by mobilizing calcium from multiple storage sites, in a study done in neutrophils [
14]. The present study was aimed to investigate the role of [Ca
2+]
i in the induction of apoptosis by Auranofin in the breast cancer cell line MCF-7.
3. Discussion
Auranofin is a clinically established gold(I) based anti-arthritic drug. Here we examine its ability to induce cell death in a human breast cancer cell-line (MCF-7) and whether its cytotoxicity is related to a drug induced modulation of [Ca2+]i.
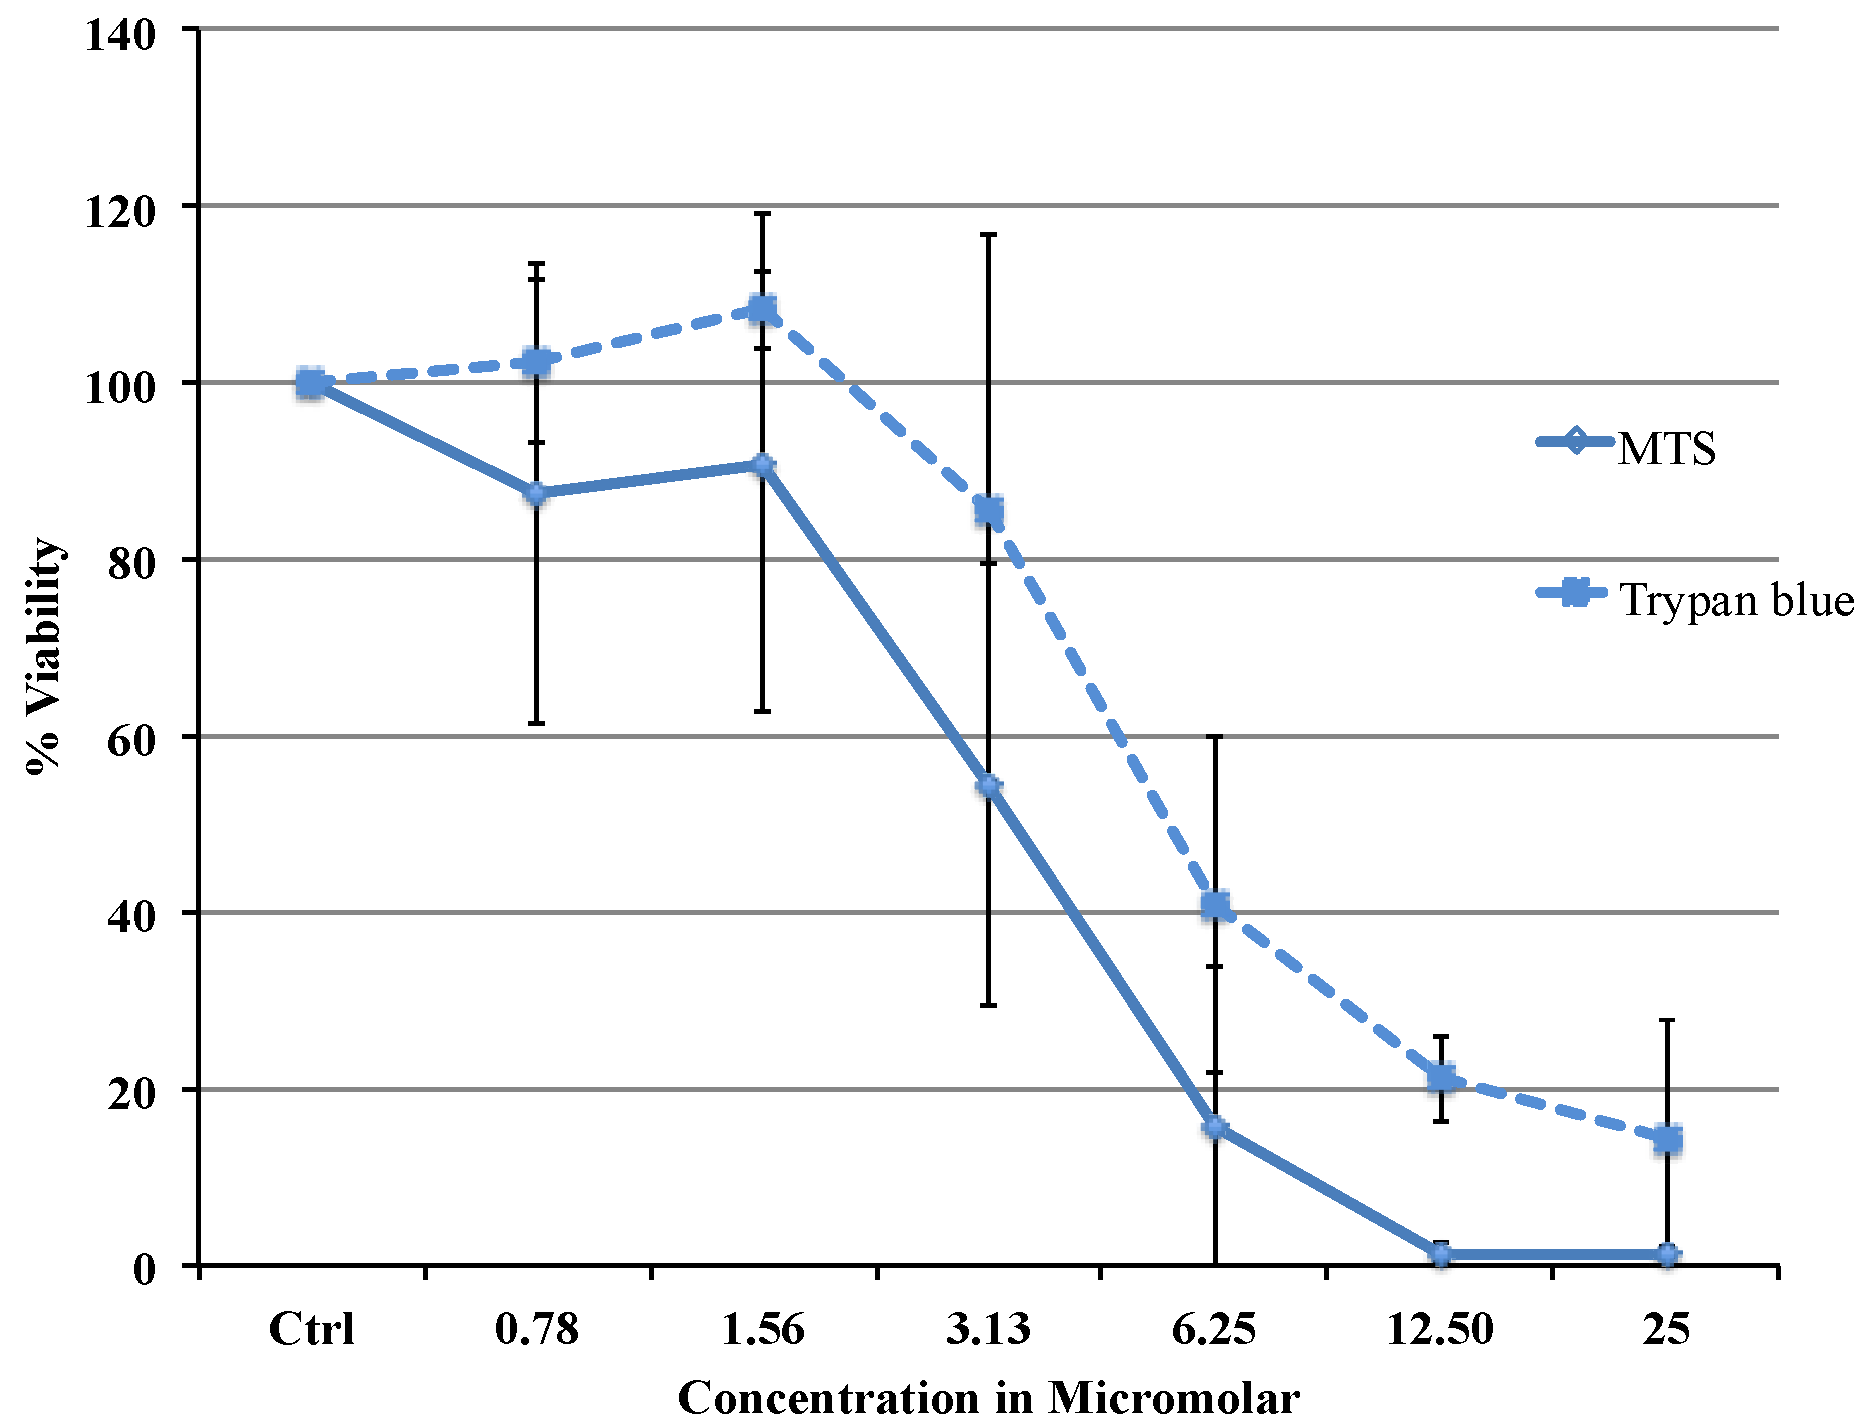
Viability data from MTS assay were very similar to the results obtained with flow cytometry. Cytotoxicity studies show a concentration dependent decrease in viability in the range between 0.78 and 25 µM with an IC
50 of 3.37 μΜ (MTS) or 5.08 μΜ (flow cytometry data). The difference in IC
50 obtained from two different assays is most likely due to the different markers as the MTS assay uses mitochondrial enzyme where as FACS method uses the caspase activity. Comparing our cytotoxicity data with the other published data, recently, Liu C Fau-Liu and co-workers reported slightly higher IC
50 value of 11.4 μΜ in MCF 7 cells [
15]. Cytotoxicity of Auranofin for 72 h were tested in a panel of cancer cell-lines by Valentina Gandin and coworkers which reported an IC
50 of 0.23 μΜ (HL-60), 0.75 μΜ (A549), 0.98 μΜ (MCF-7), 0.34 μΜ (A375), 0.11 μΜ (HCT-15), 0.15 μΜ (HeLa) [
16]. Auranofin appears to be 10 times more efficient in inducing cell death than cisplatin in this cell-line where an IC
50 of 43.7 μΜ was recently reported [
17]. Auranofin proves to be more potent than cisplatin to induce cell death in this MCF-7 breast cancer cell line and therefore might be the better choice for treatment.
Figure 3.
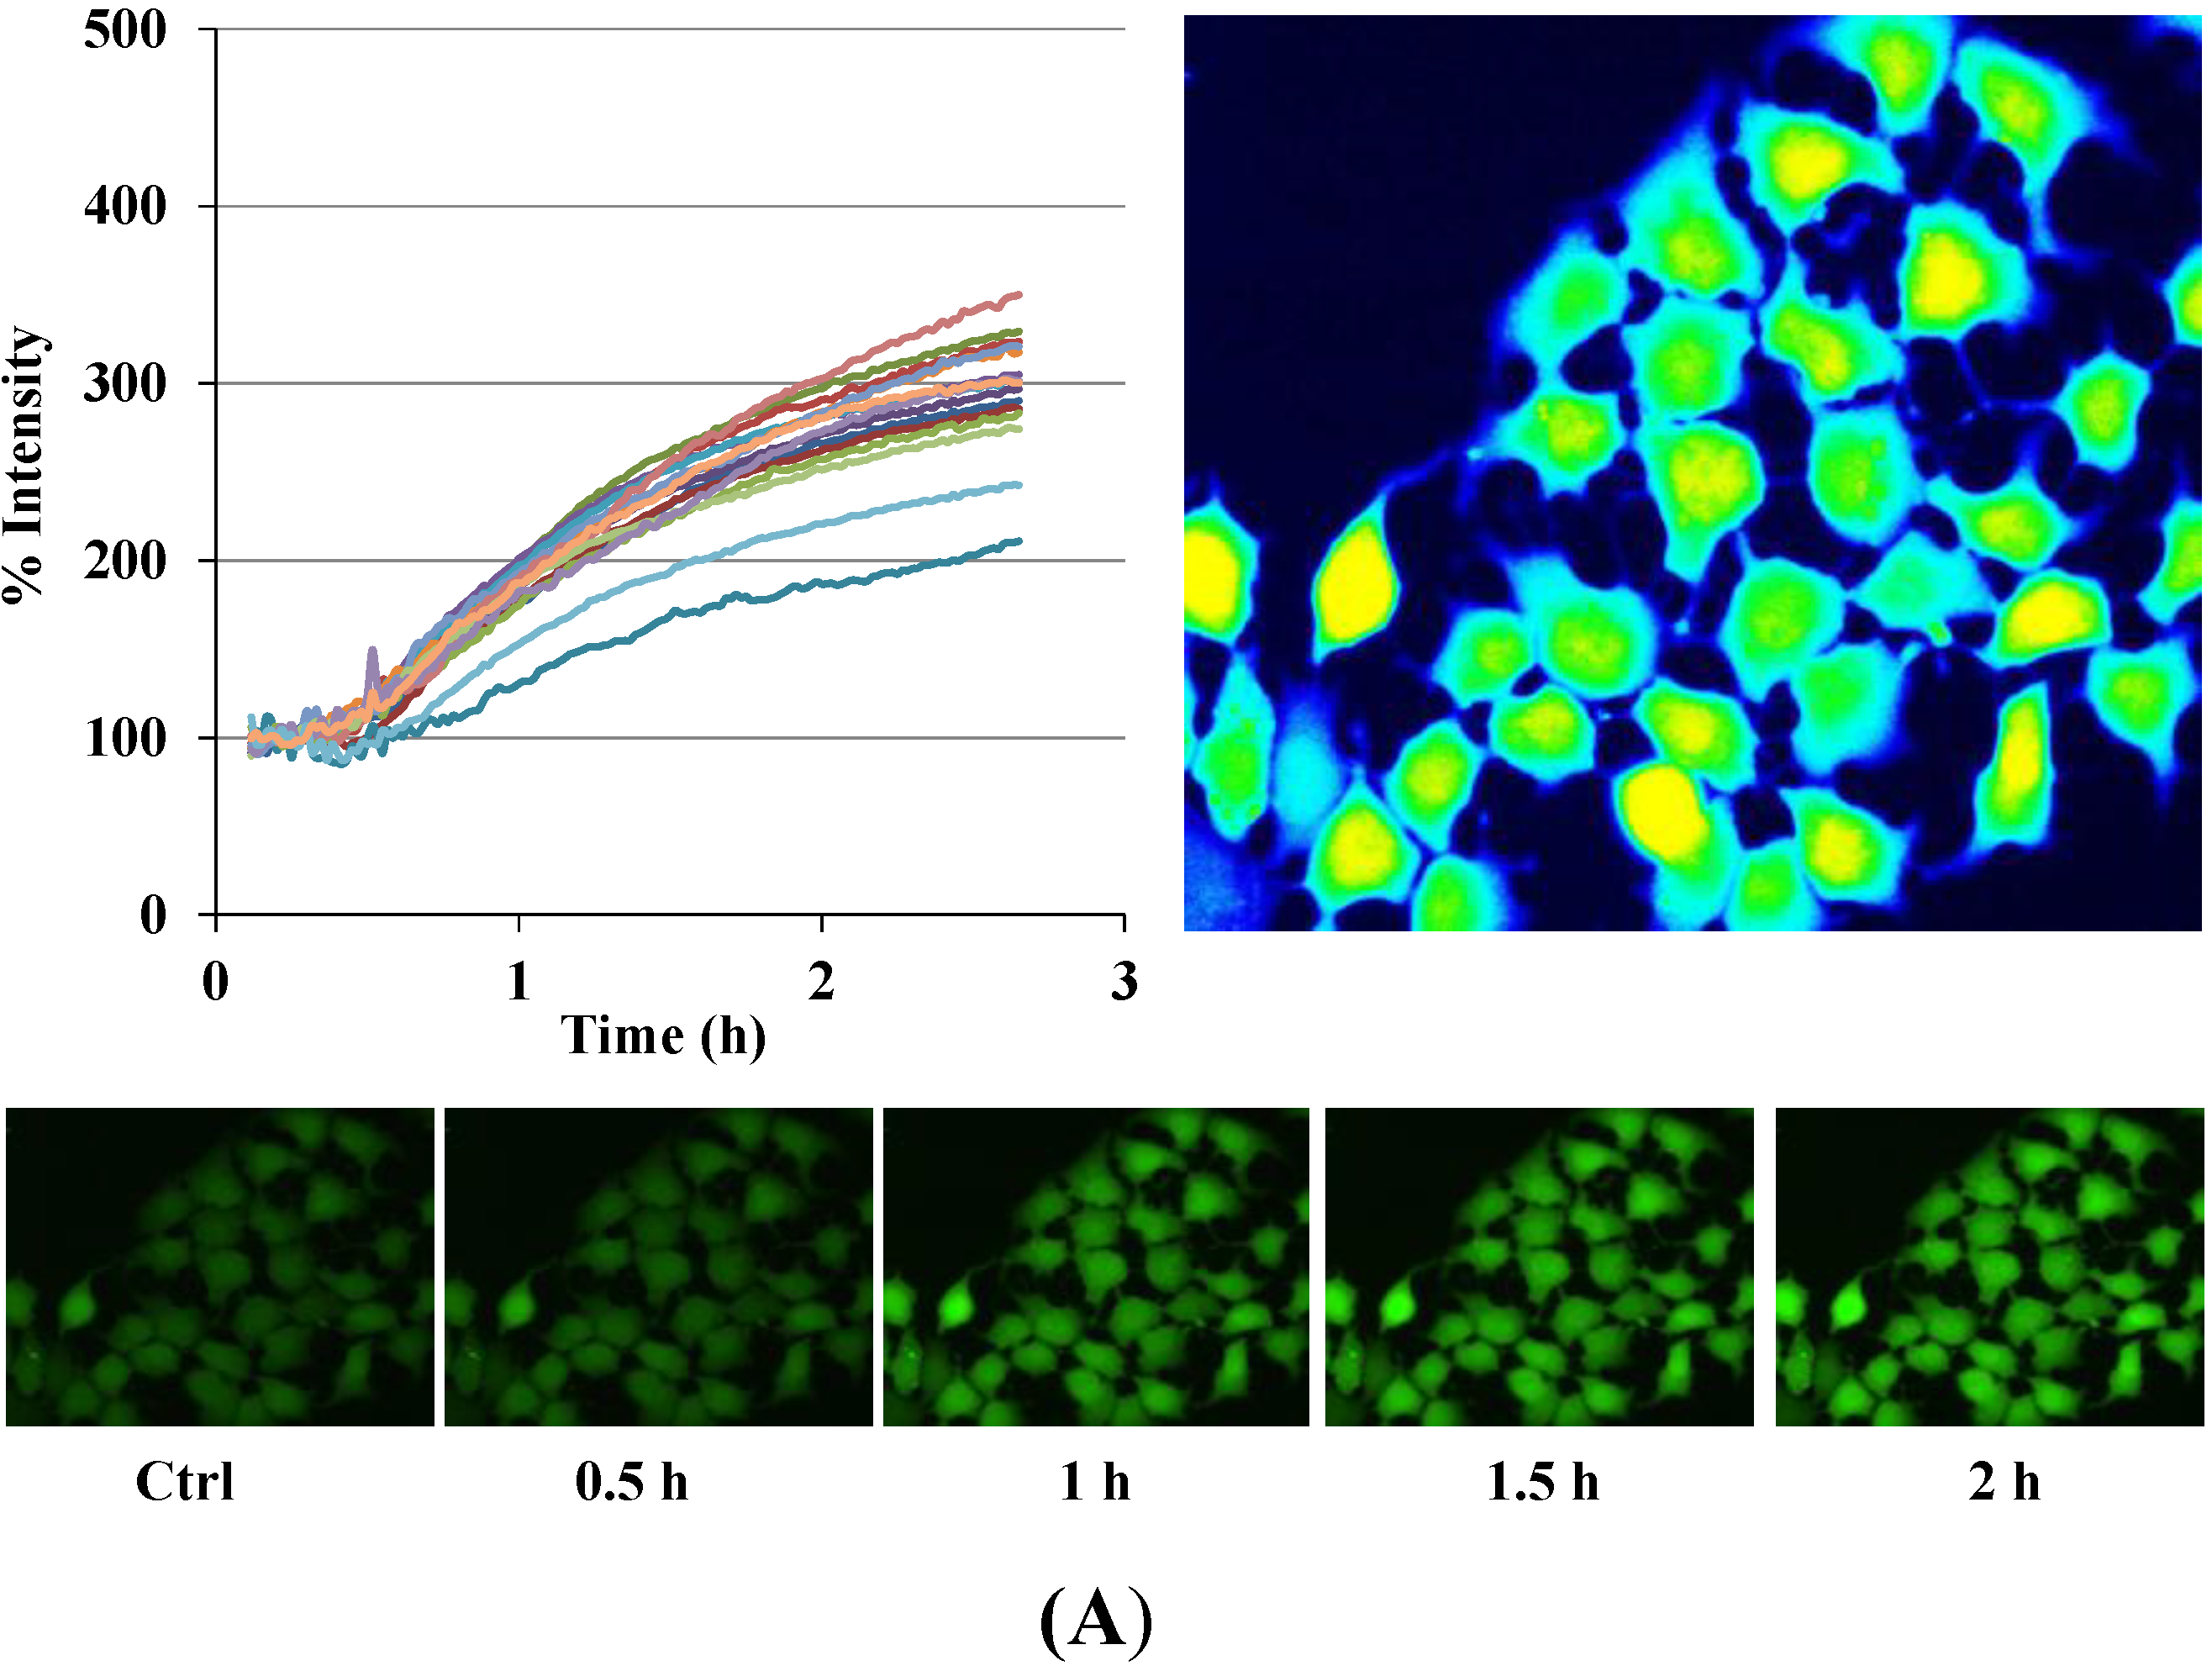
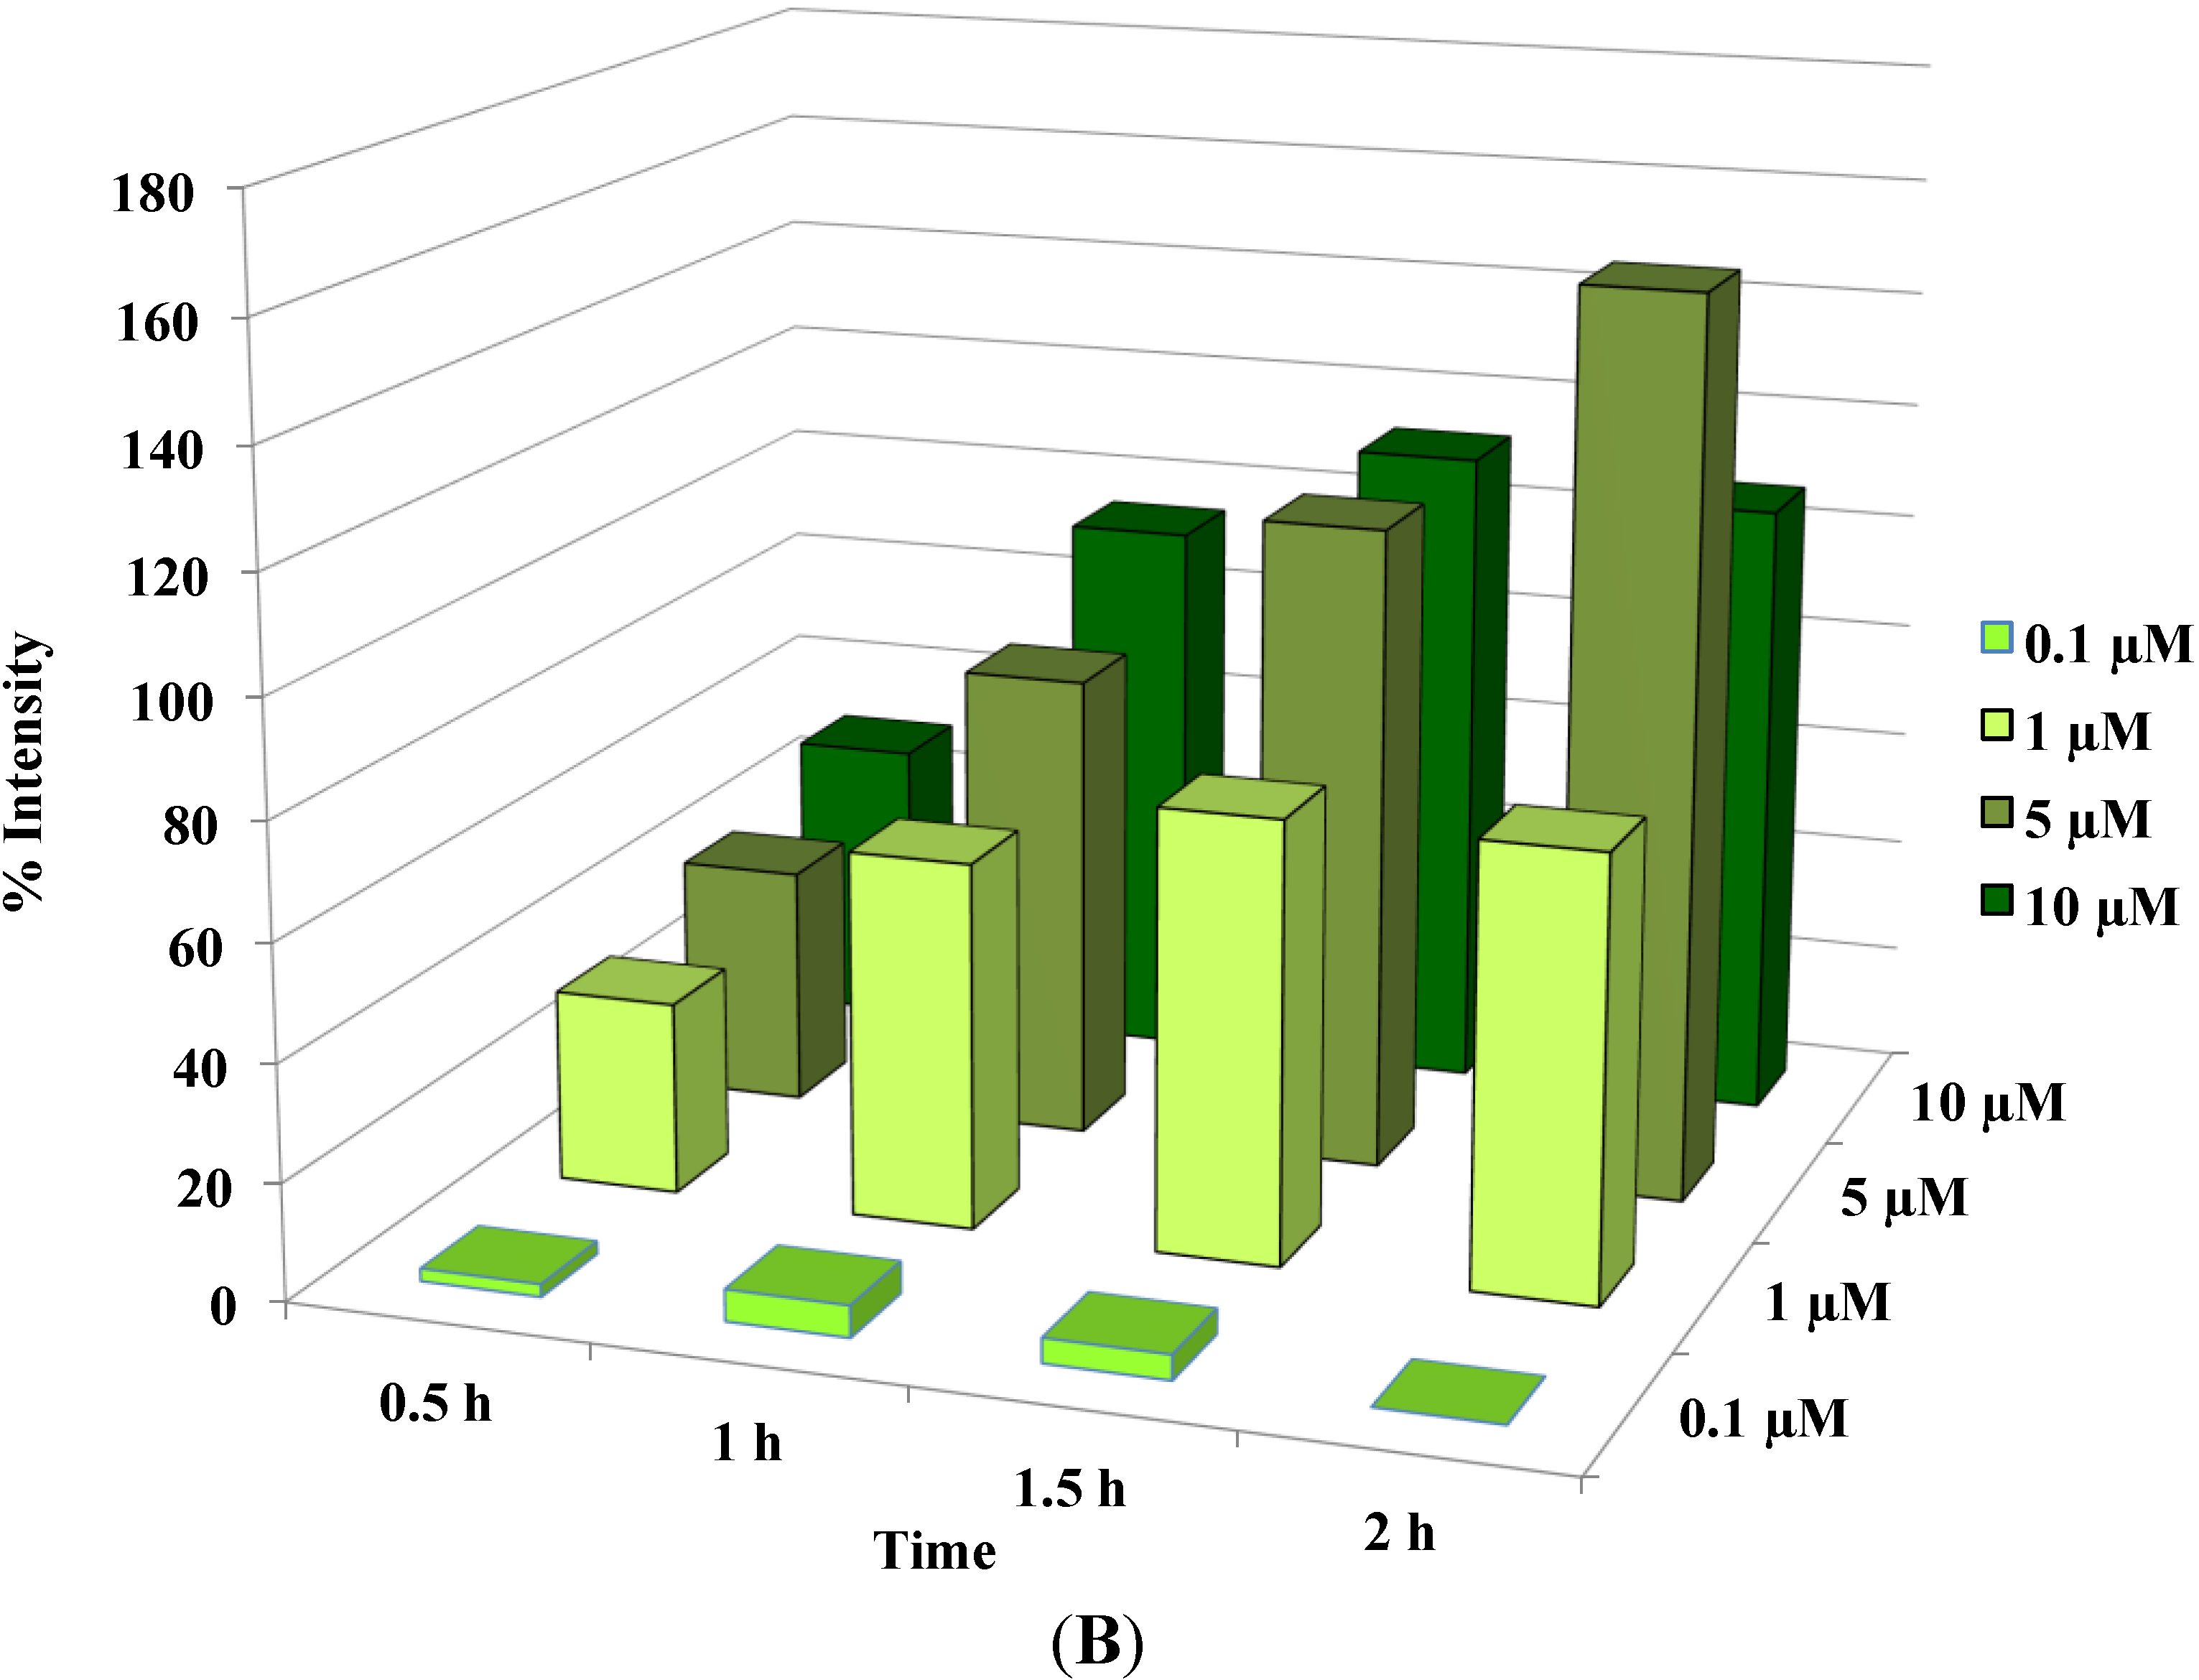
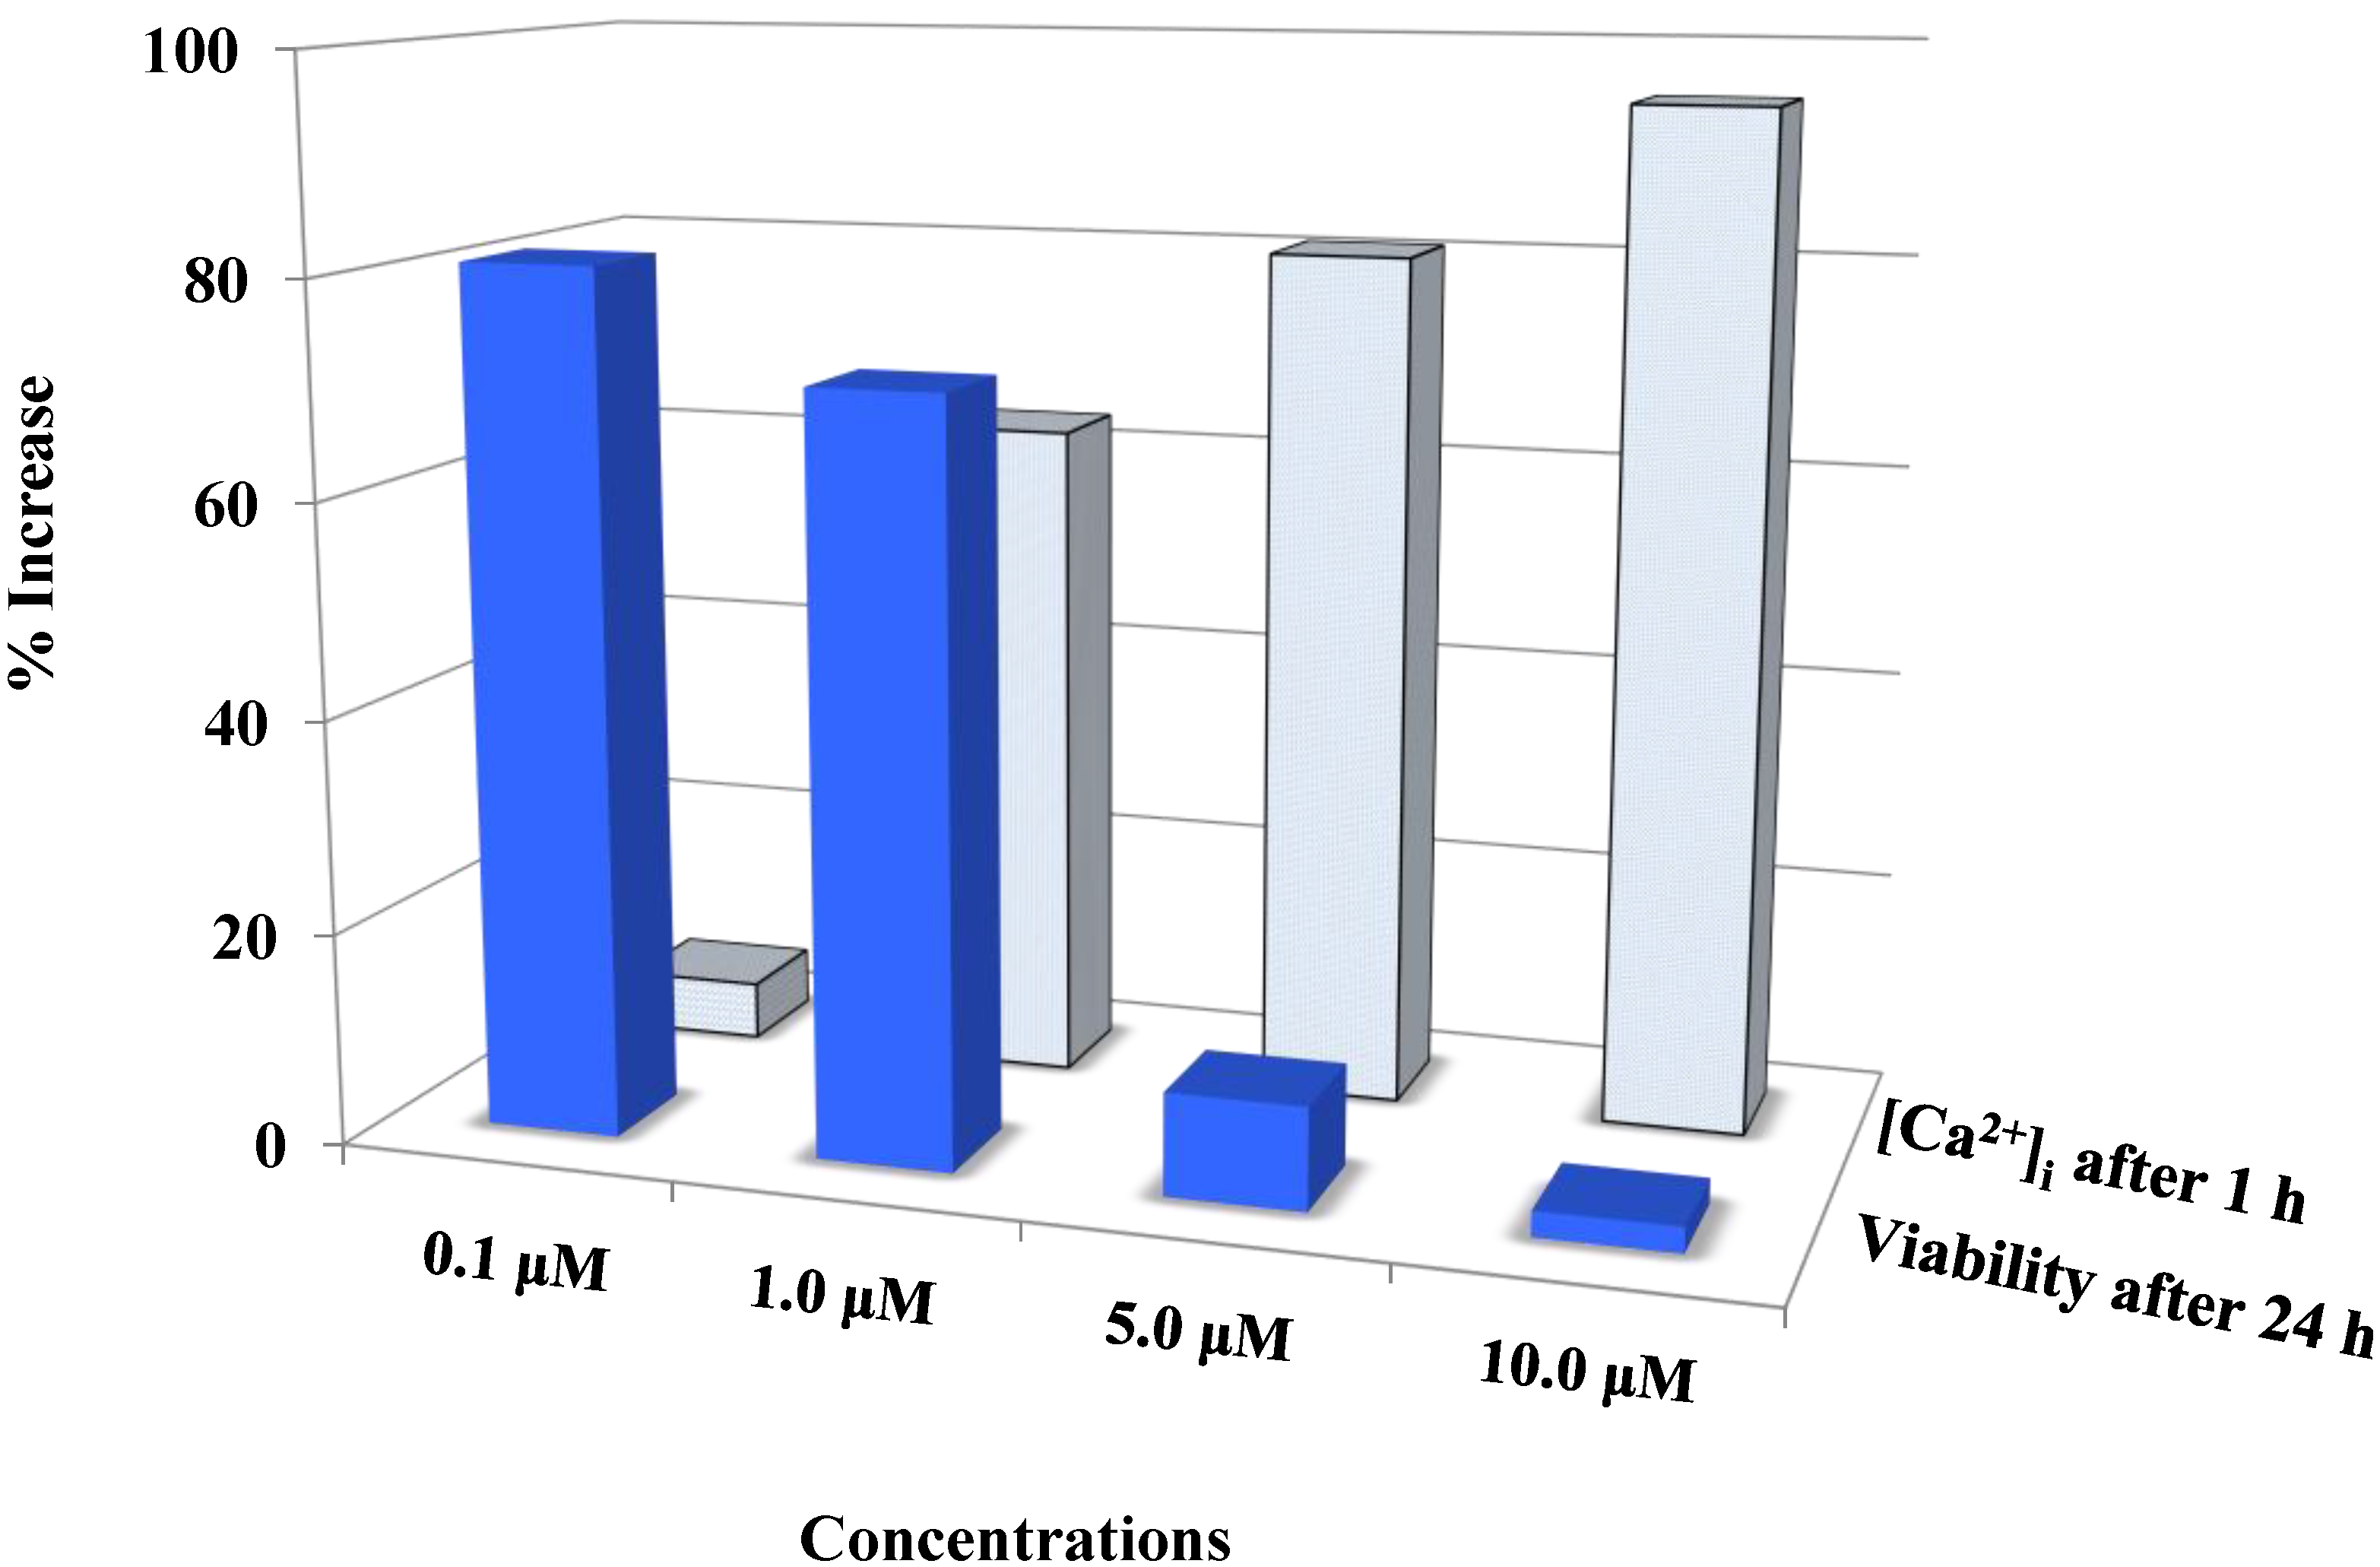
Disruption of [Ca2+]i in MCF-7 cells following treatment with Auranofin: (A) Auranofin induces a rise in intracellular calcium in MCF-7 breast cancer cell line: Cells loaded with Fluo-4 AM a calcium sensitive dye, with the application of Auranofin showed a time dependent increase in intracellular calcium [Ca2+]i. The rise of [Ca2+]i over time is demonstrated by increase in the fluorescence intensity after application of the drug. The histogram represents the intracellular calcium level of cells selected, from the start of the experiment followed by a gradual increase with the application of the drug. The false color image represents the varying intensities corresponding to calcium concentration in different cells. The lower panel shows images corresponding to different time points. Note: Auranofin was applied continuously for all calcium imaging experiments; (B) Auranofin induced a concentration and time dependent elevation in [Ca2+]i. Time and concentration dependent elevation in [Ca2+]i was recorded with 4 different concentrations (0.1, 1, 5, 10 μM). The calcium imaging experiments with Fluo-4 were repeated at least four times for each concentration and the values were averaged. Each concentration was plotted against time and percentage increase in intensity. The diagram shows a very clear time and concentration dependent increase of intracellular calcium. The statistical significance was calculated with Students t-test. All the concentrations were compared to control, concentrations above 0.1 μM showed significant increase in [Ca2+]i. Mean ± SD: 0.1 μM: (2 ± 8.89) 0.5 h, (5.45 ± 11.39) 1 h, (4.27 ± 16.61) 1.5 h, (4.89 ± 15.73) 2 h. 1 μM: (33.12 ± 22.73) 0.5 h, (62.92 ± 31.53) 1 h, (75.70 ± 22.37) 1.5 h, (75.59 ± 0.72) 2 h, 5 μM: (41.11 ± 27.39) 0.5 h, (80.52 ± 51.77) 1 h, (111.43 ± 70.02) 1.5 h, (154.92 ± 82.51) 2 h. 10 μM: (51.73 ± 20.47) 0.5 h, (97.08 ± 29.31) 1 h, (114.49 ± 25.09) 1.5 h, (107.18) 2 h.
Figure 3.
Disruption of [Ca2+]i in MCF-7 cells following treatment with Auranofin: (A) Auranofin induces a rise in intracellular calcium in MCF-7 breast cancer cell line: Cells loaded with Fluo-4 AM a calcium sensitive dye, with the application of Auranofin showed a time dependent increase in intracellular calcium [Ca2+]i. The rise of [Ca2+]i over time is demonstrated by increase in the fluorescence intensity after application of the drug. The histogram represents the intracellular calcium level of cells selected, from the start of the experiment followed by a gradual increase with the application of the drug. The false color image represents the varying intensities corresponding to calcium concentration in different cells. The lower panel shows images corresponding to different time points. Note: Auranofin was applied continuously for all calcium imaging experiments; (B) Auranofin induced a concentration and time dependent elevation in [Ca2+]i. Time and concentration dependent elevation in [Ca2+]i was recorded with 4 different concentrations (0.1, 1, 5, 10 μM). The calcium imaging experiments with Fluo-4 were repeated at least four times for each concentration and the values were averaged. Each concentration was plotted against time and percentage increase in intensity. The diagram shows a very clear time and concentration dependent increase of intracellular calcium. The statistical significance was calculated with Students t-test. All the concentrations were compared to control, concentrations above 0.1 μM showed significant increase in [Ca2+]i. Mean ± SD: 0.1 μM: (2 ± 8.89) 0.5 h, (5.45 ± 11.39) 1 h, (4.27 ± 16.61) 1.5 h, (4.89 ± 15.73) 2 h. 1 μM: (33.12 ± 22.73) 0.5 h, (62.92 ± 31.53) 1 h, (75.70 ± 22.37) 1.5 h, (75.59 ± 0.72) 2 h, 5 μM: (41.11 ± 27.39) 0.5 h, (80.52 ± 51.77) 1 h, (111.43 ± 70.02) 1.5 h, (154.92 ± 82.51) 2 h. 10 μM: (51.73 ± 20.47) 0.5 h, (97.08 ± 29.31) 1 h, (114.49 ± 25.09) 1.5 h, (107.18) 2 h.
![Cancers 06 02243 g003a]()
![Cancers 06 02243 g003b]()
Figure 4.
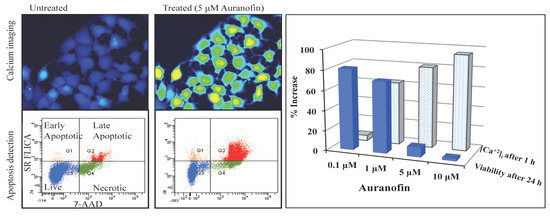
Auranofin induced cell death with the rise in intracellular calcium: The two data sets obtained from calcium imaging experiments and MTS assay were compared using Pearson’s correlation coefficient (2 tailed). Where, r = −0.731 and p = 0.005 (** correlation is significant at the 0.01 level). The comparison shows that viability and intracellular calcium have a strong negative correlation. This shows that an increase in [Ca2+]i occurred preceding the cell death. 0 < r < 0.3 weak correlation; 0.3 < r < 0.7 moderate correlation; r > 0.7 strong correlation.
Figure 4.
Auranofin induced cell death with the rise in intracellular calcium: The two data sets obtained from calcium imaging experiments and MTS assay were compared using Pearson’s correlation coefficient (2 tailed). Where, r = −0.731 and p = 0.005 (** correlation is significant at the 0.01 level). The comparison shows that viability and intracellular calcium have a strong negative correlation. This shows that an increase in [Ca2+]i occurred preceding the cell death. 0 < r < 0.3 weak correlation; 0.3 < r < 0.7 moderate correlation; r > 0.7 strong correlation.
Figure 5.
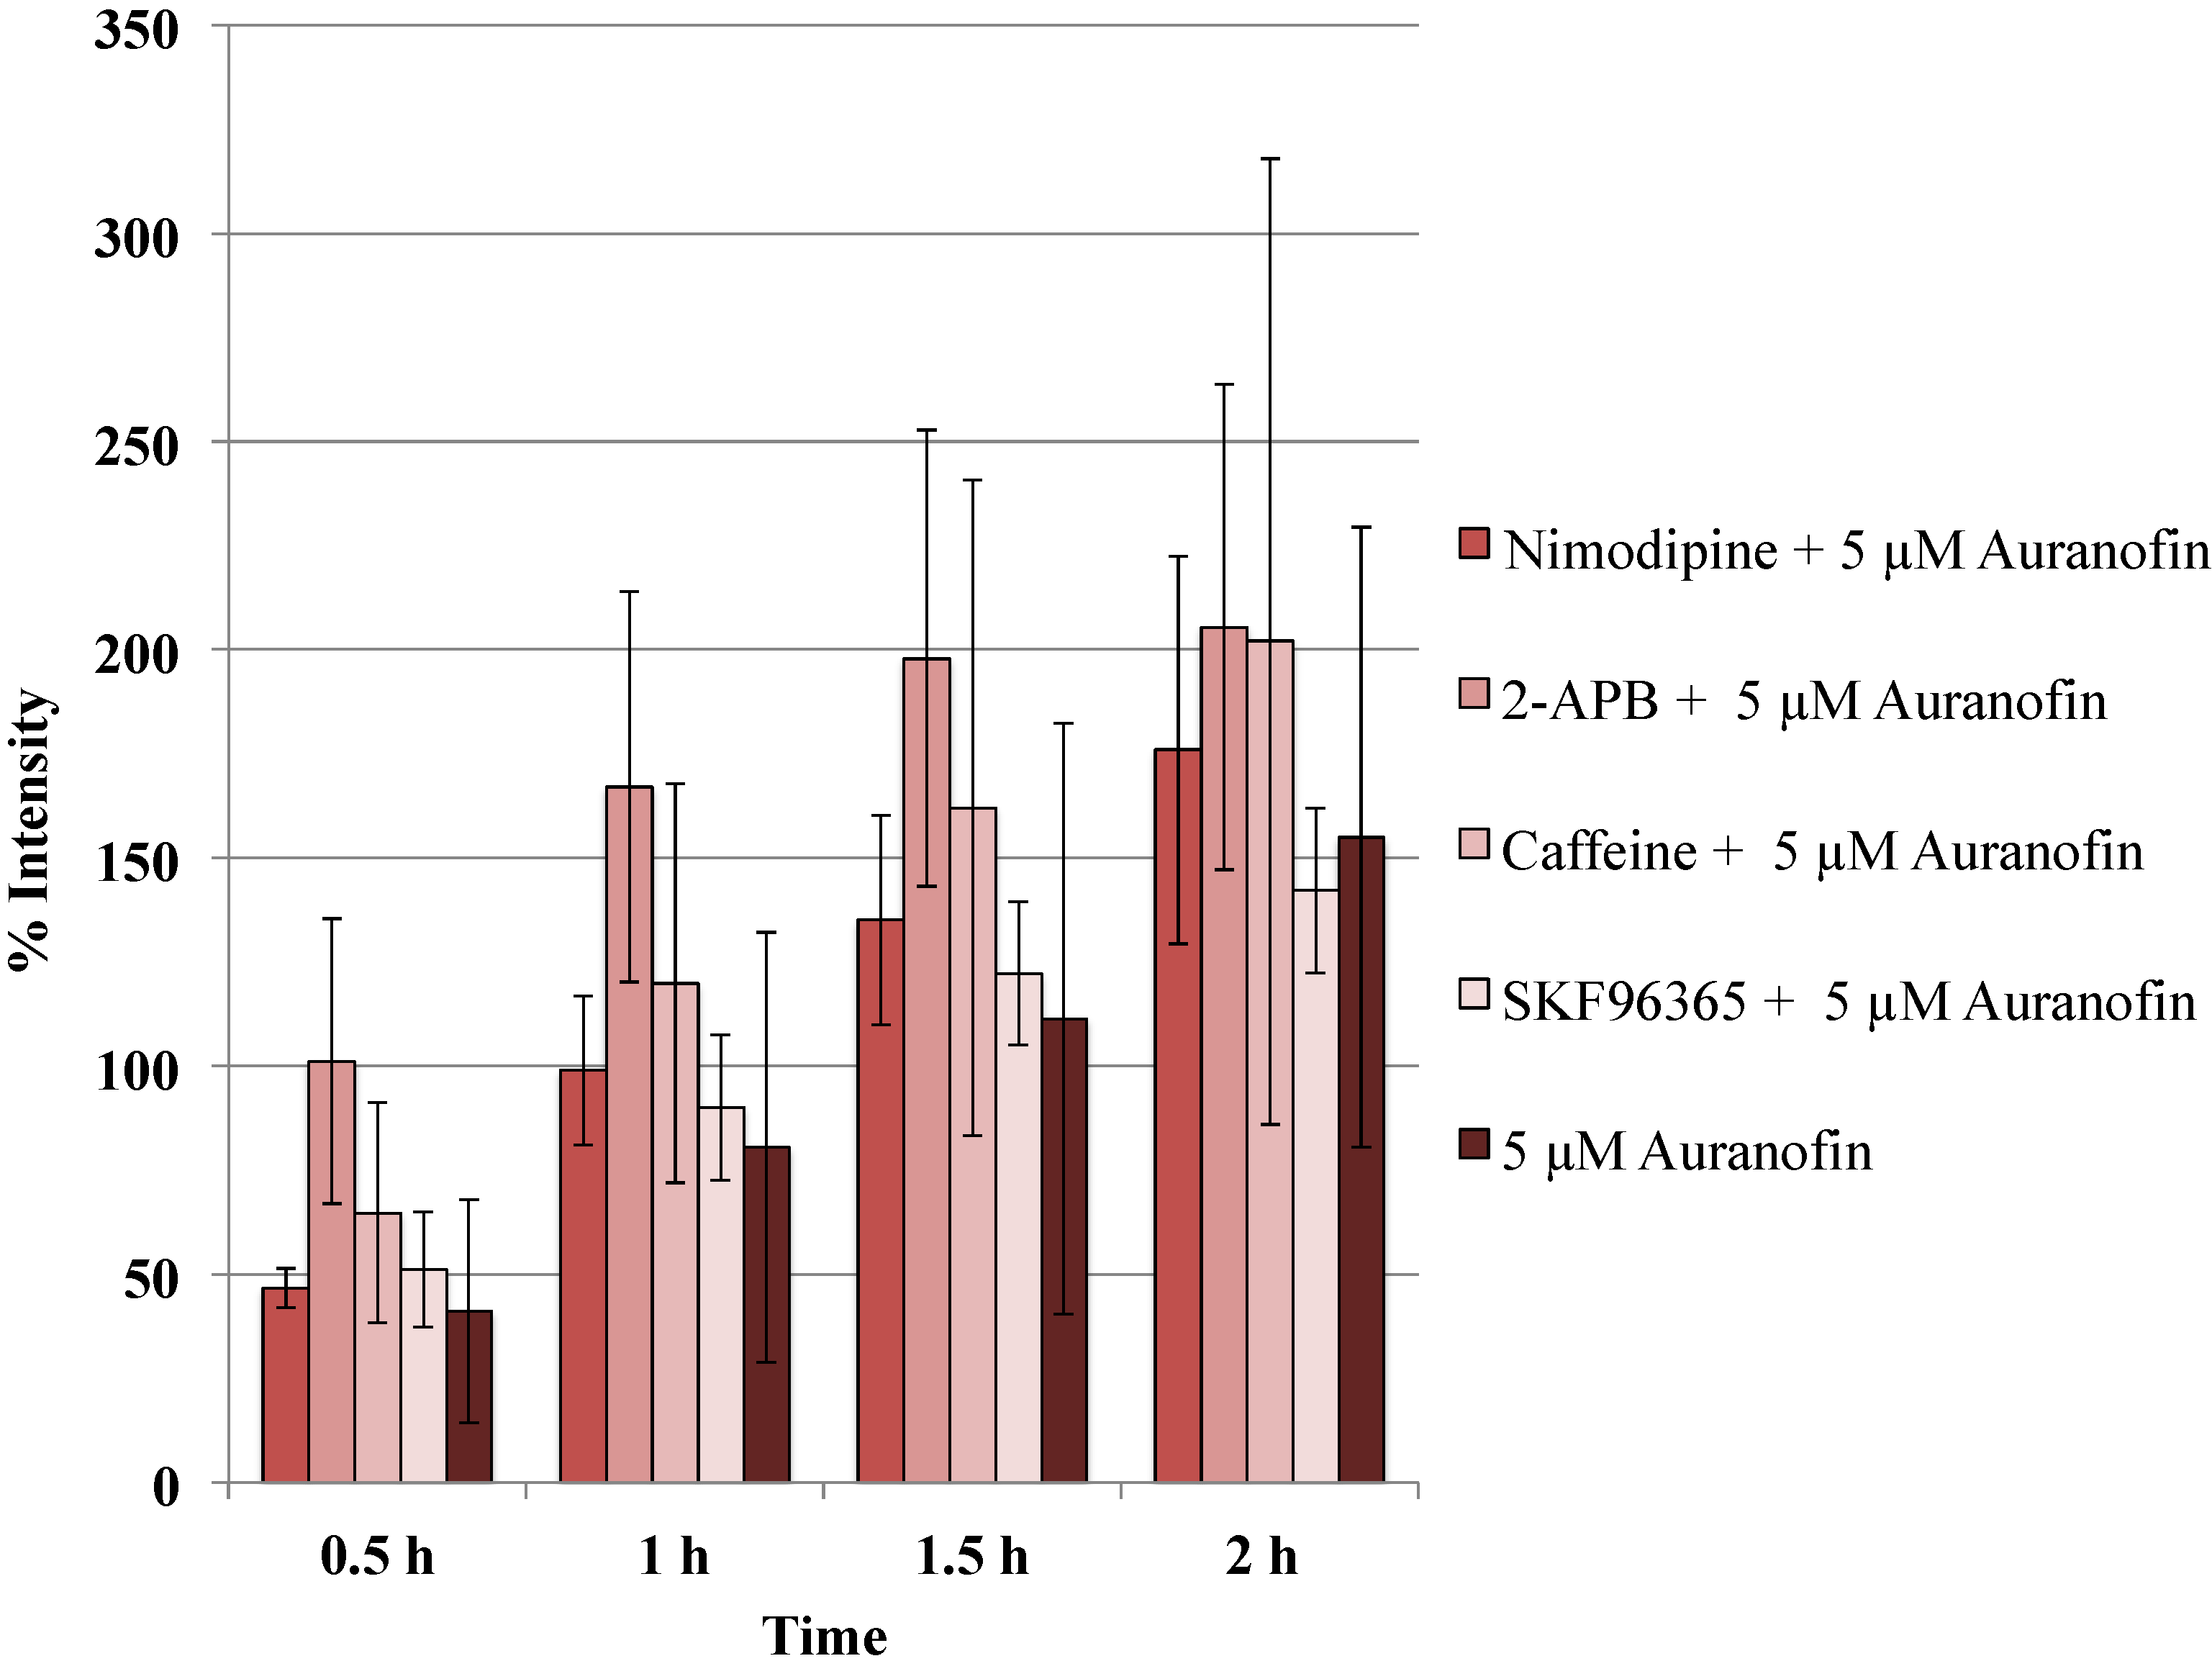
Blockers did not alter the action of Auranofin: Neither of the calcium channel modulators nimodipine 10 μM (L-type Blocker), 2-APB 50 μM (inhibits store operated calcium release) or caffeine (store release), SKF 96365 20 μM (inhibits store operated calcium release) change the effect of Auranofin significantly (p > 0.05).
Figure 5.
Blockers did not alter the action of Auranofin: Neither of the calcium channel modulators nimodipine 10 μM (L-type Blocker), 2-APB 50 μM (inhibits store operated calcium release) or caffeine (store release), SKF 96365 20 μM (inhibits store operated calcium release) change the effect of Auranofin significantly (p > 0.05).
Figure 6.
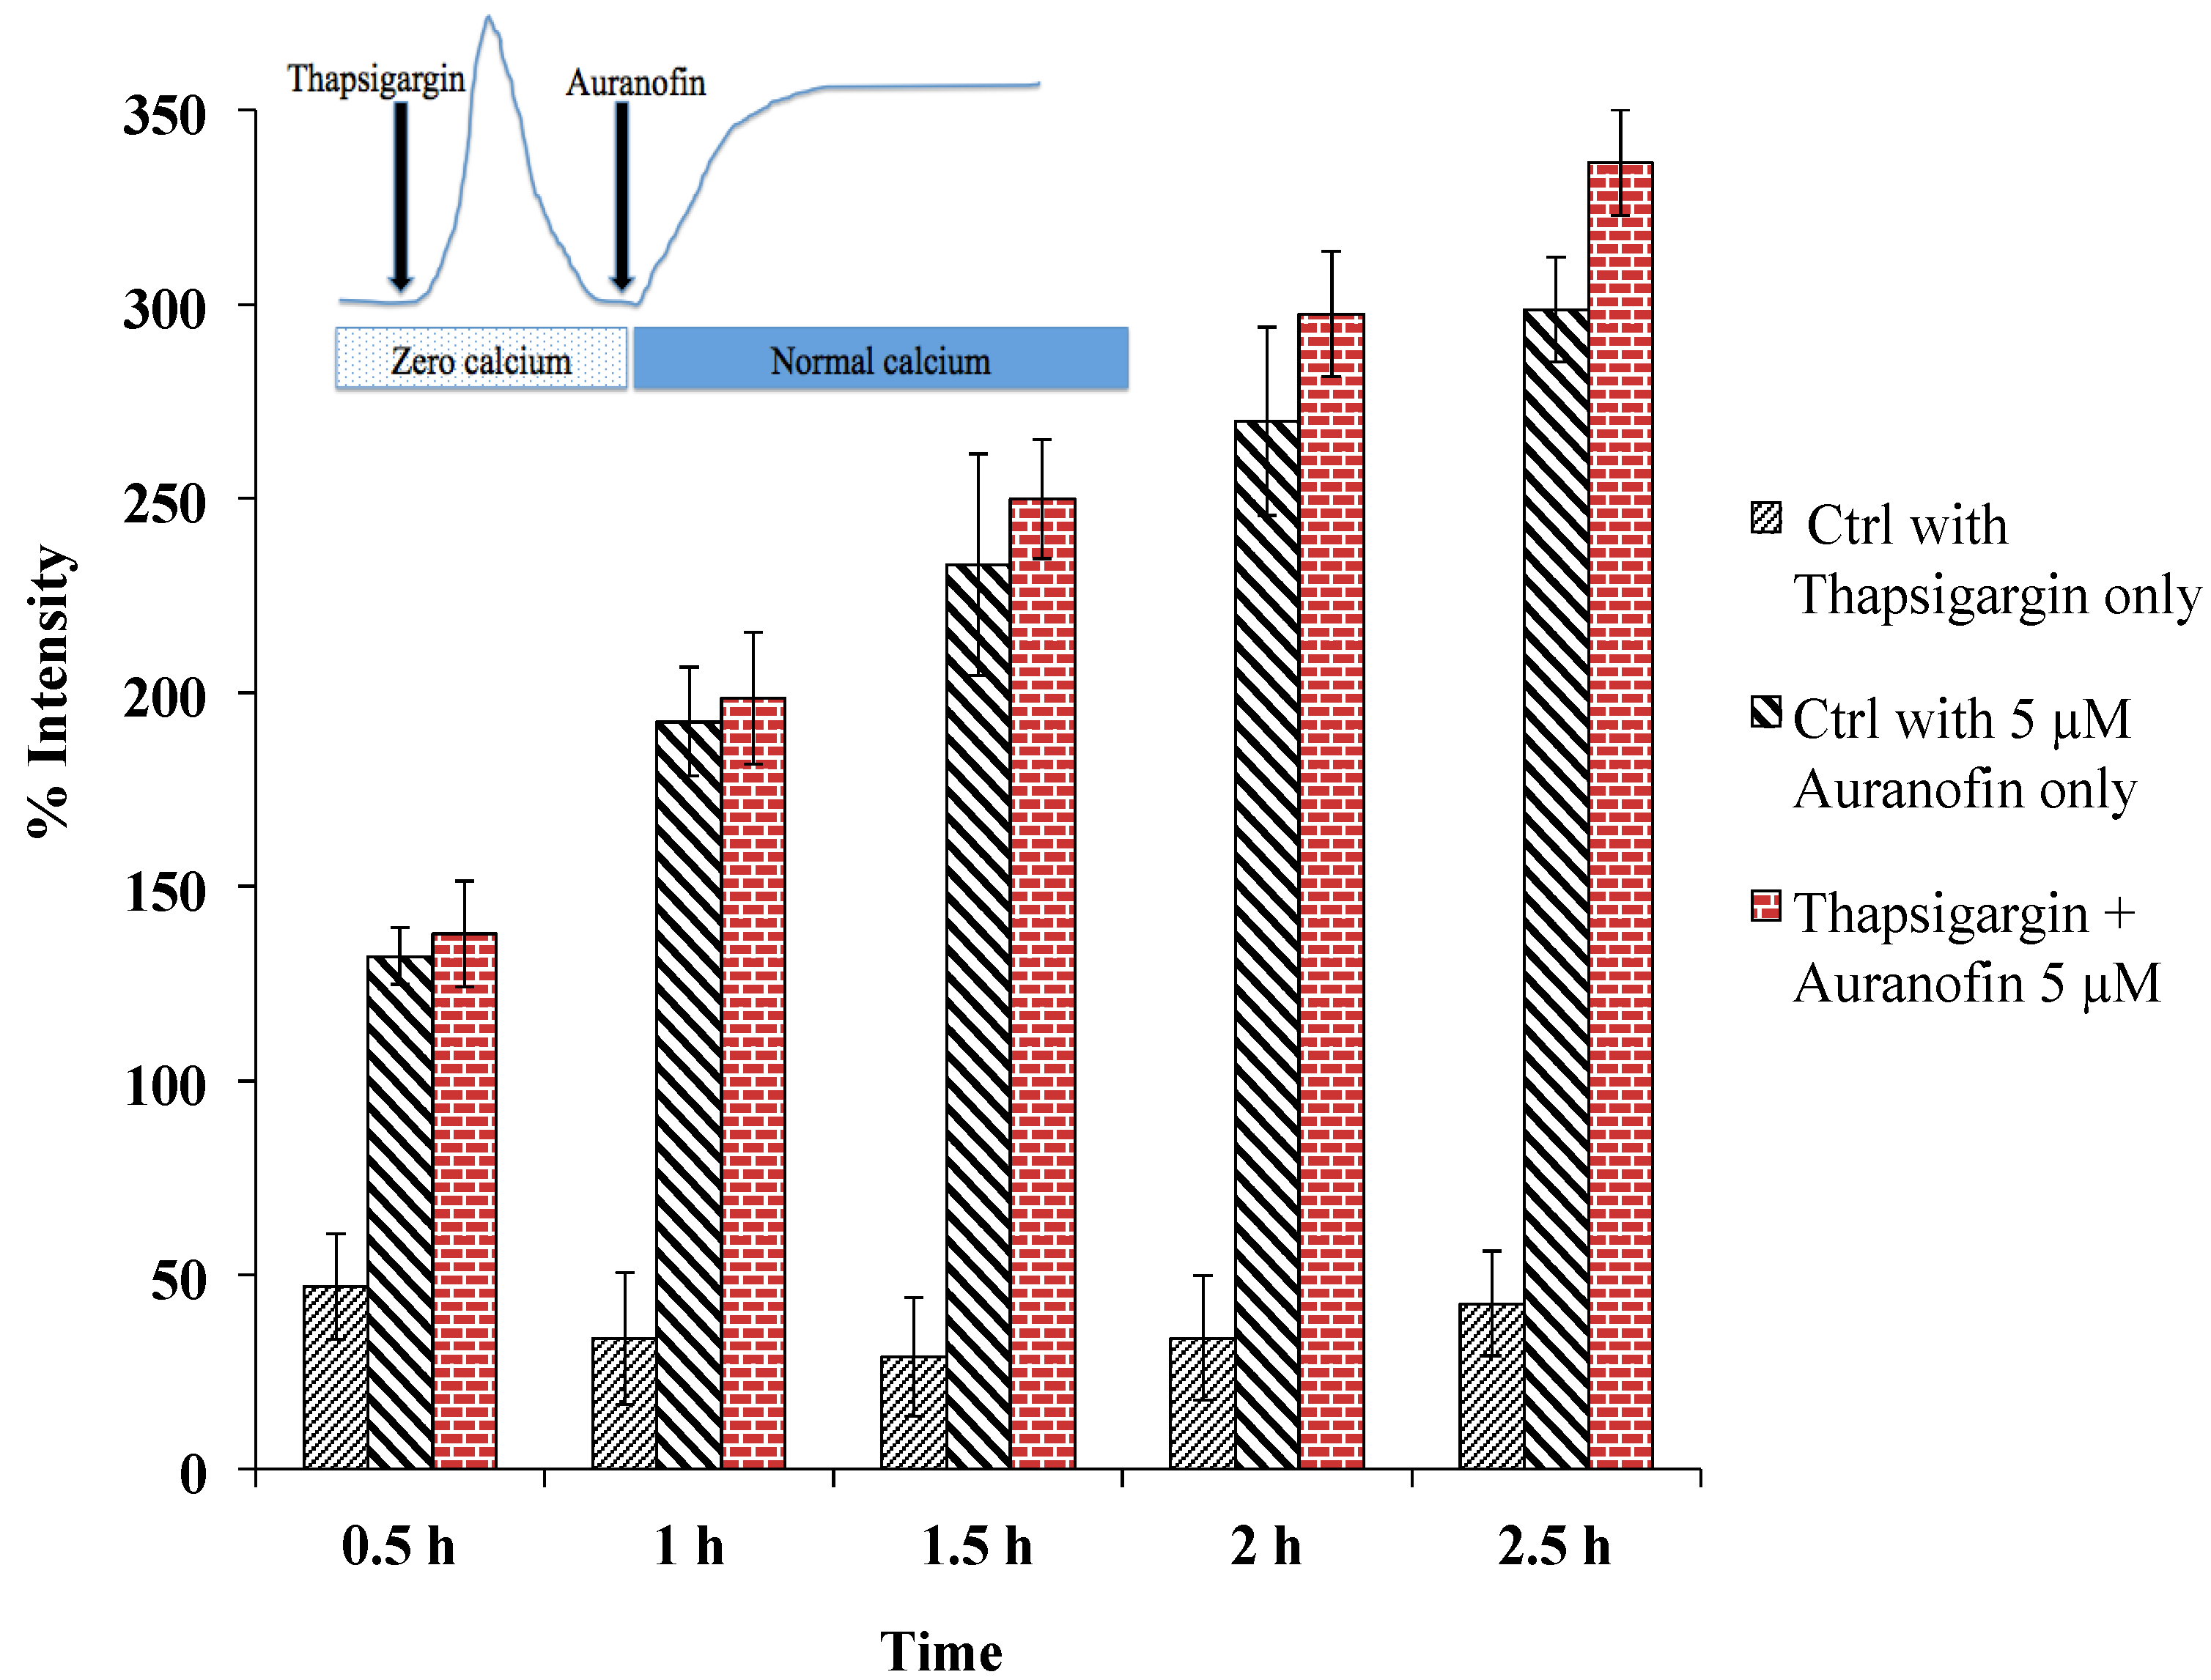
Rise of [Ca2+]i does not depend on SERCA, as pre-treatment with thapsigargin (under zero calcium condition followed by application of drug in normal buffer) did not alter the effect of Auranofin induced [Ca2+]i rise. Insert shows application protocol.
Figure 6.
Rise of [Ca2+]i does not depend on SERCA, as pre-treatment with thapsigargin (under zero calcium condition followed by application of drug in normal buffer) did not alter the effect of Auranofin induced [Ca2+]i rise. Insert shows application protocol.
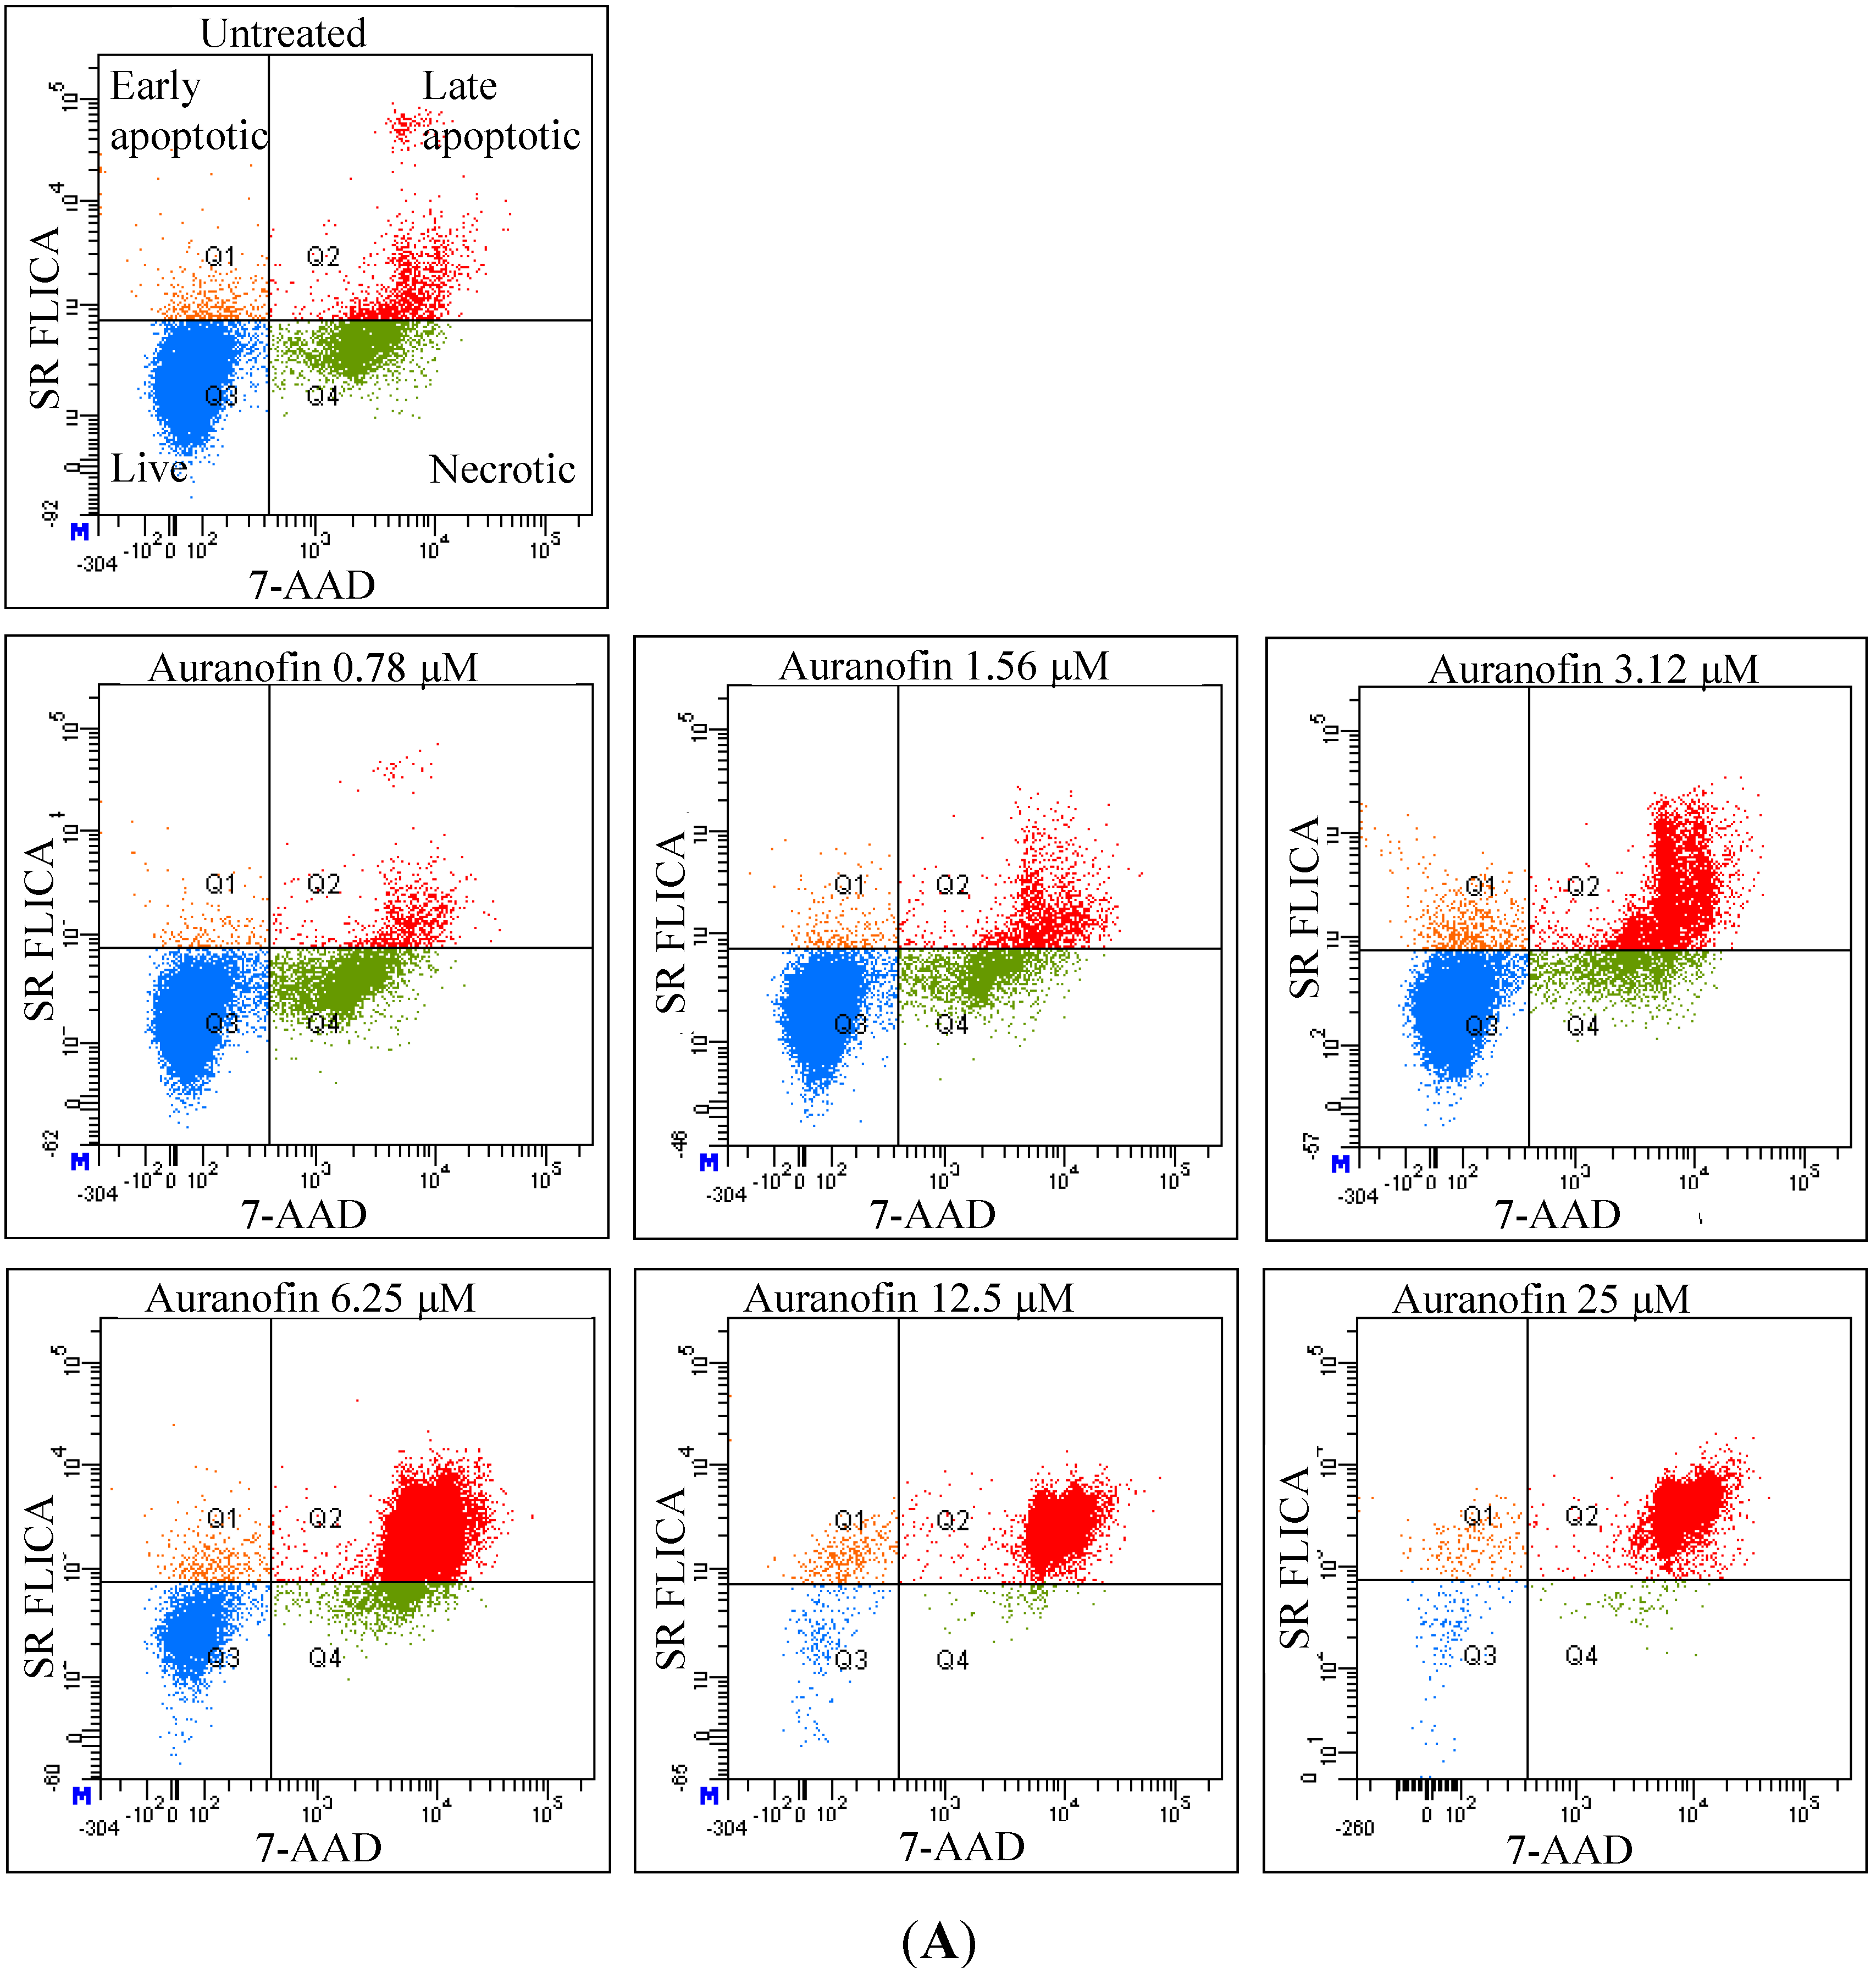
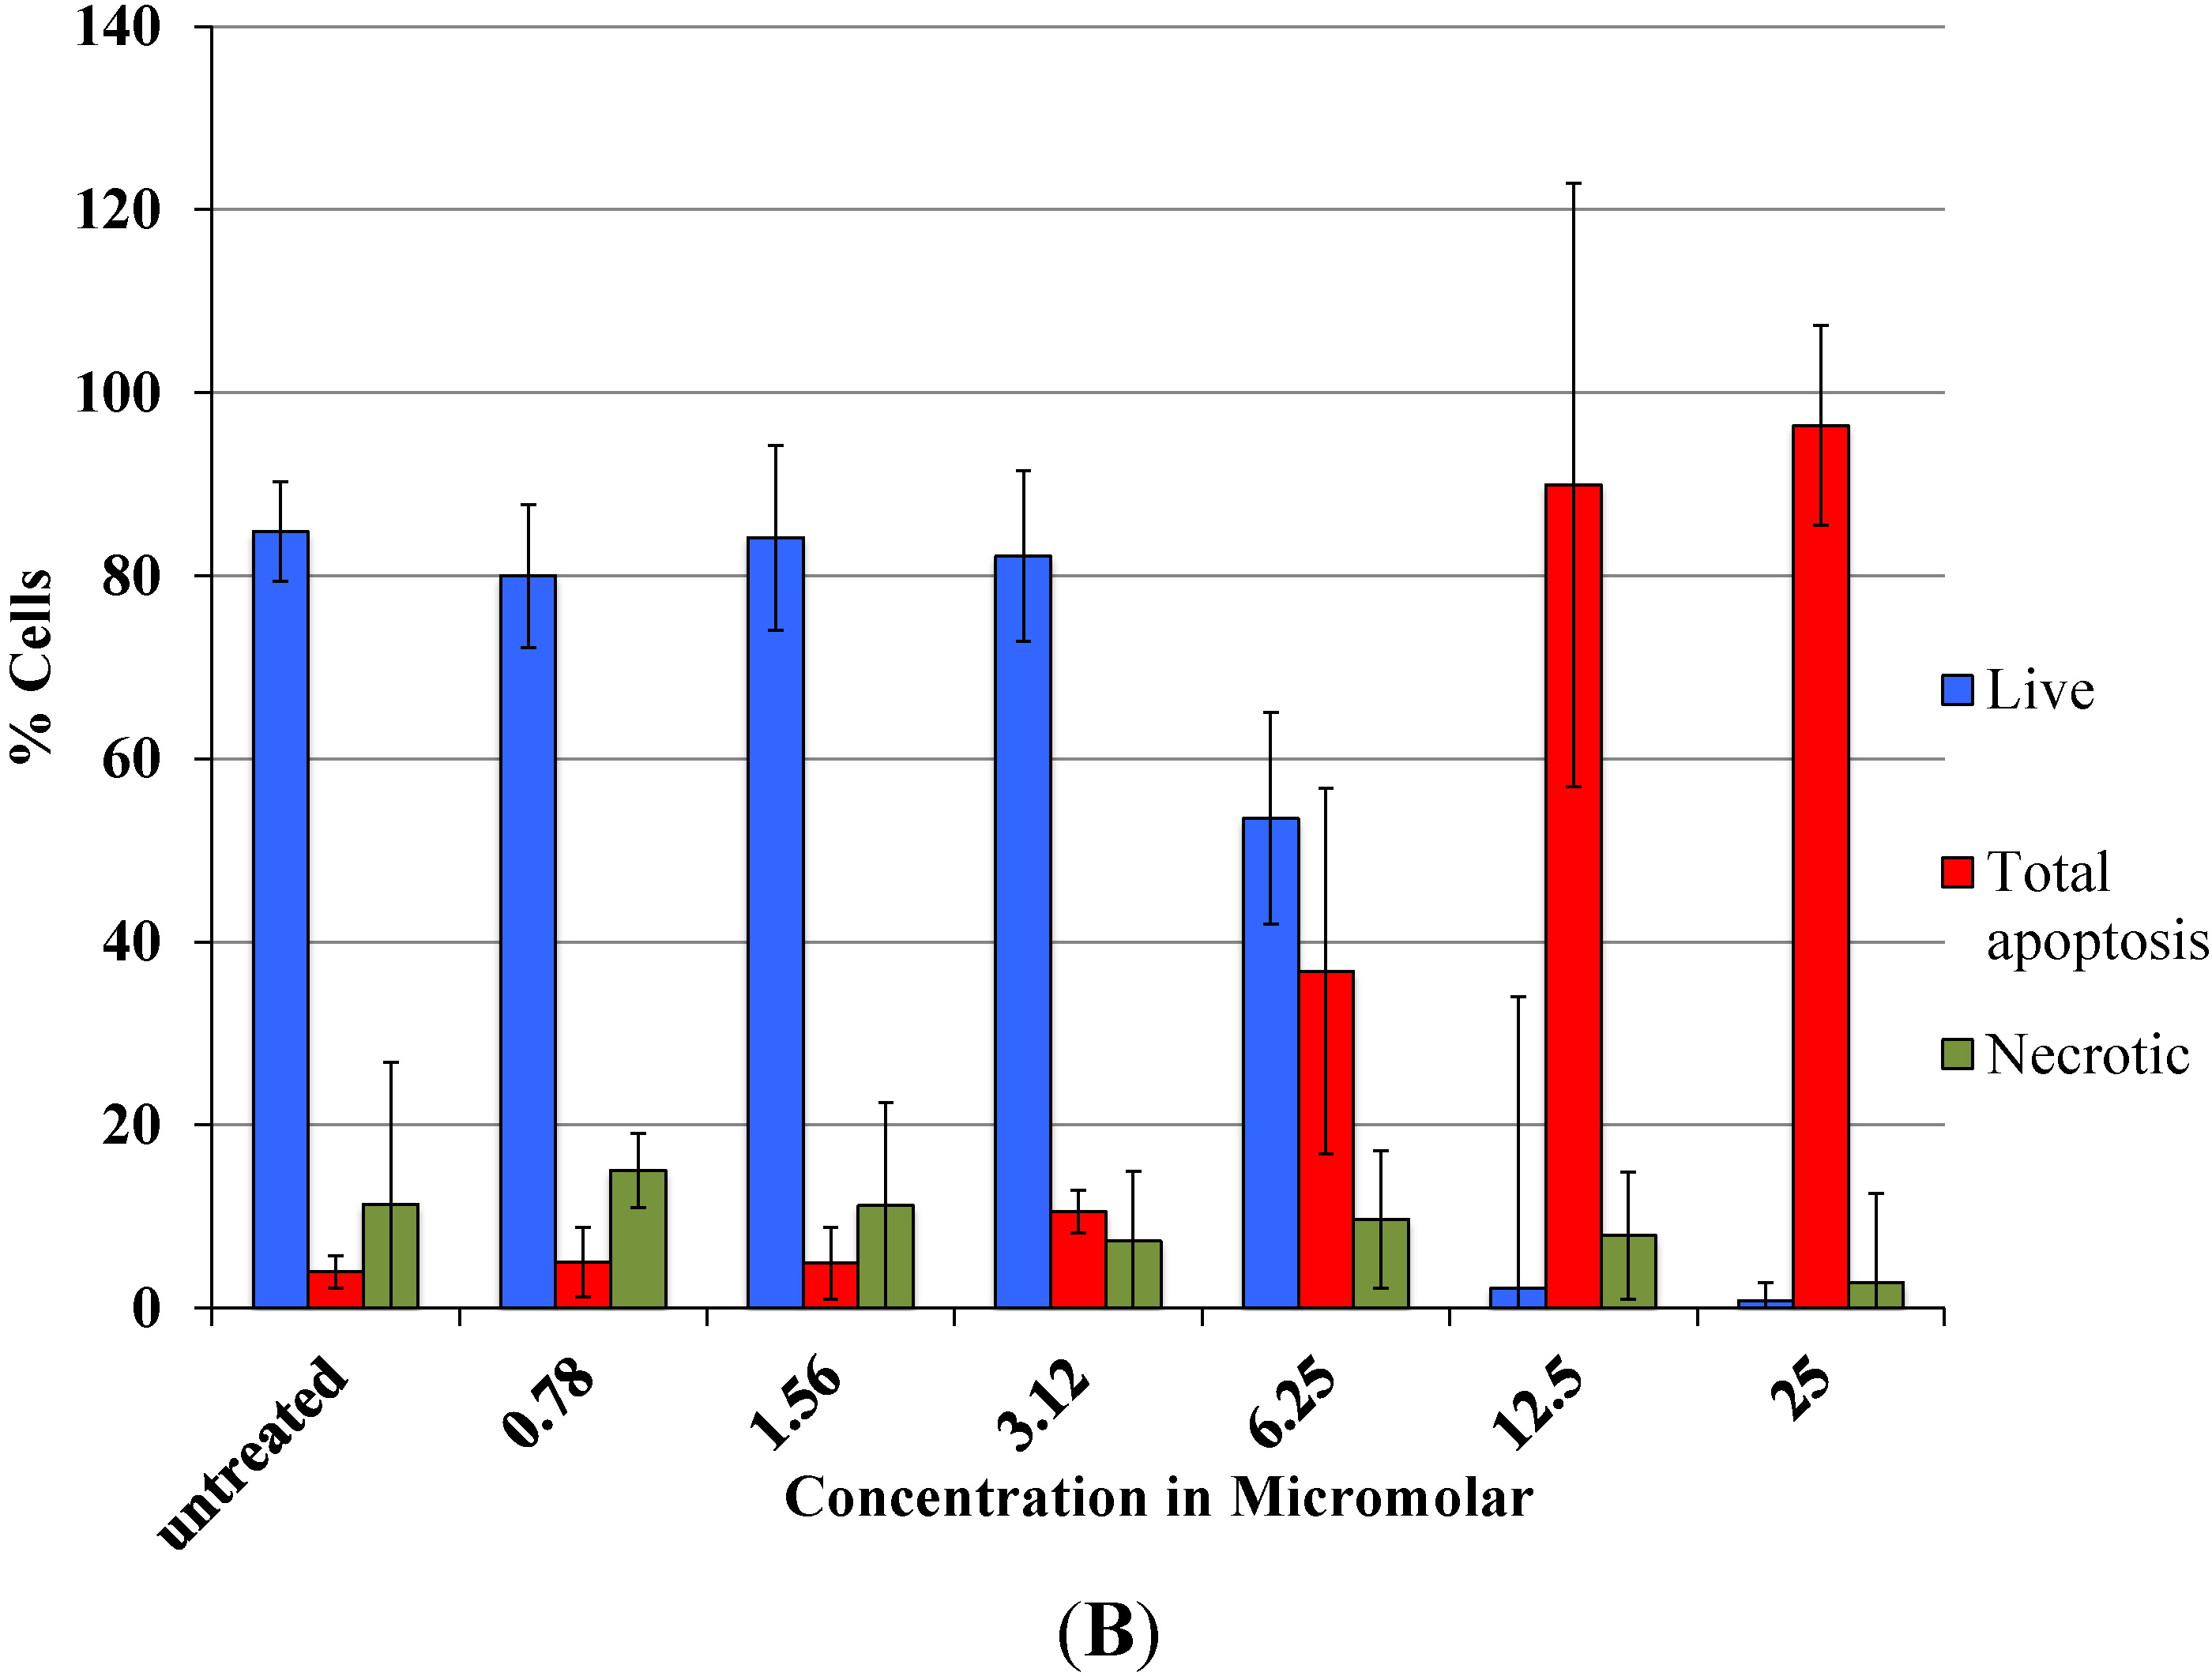
As revealed by flow cytometry analysis with SR FLICA, cell death is associated with caspase activation. Unfortunately our experiments were not sufficient to prove a direct or indirect involvement of caspase in the induction of cell death. We specifically observed an increase in late apoptotic population with an increase of the drug concentration. The number of cells in the early apoptotic (all treatment) group was not significantly different from the control group. This could be due to the fact that this event could have occurred in a short time interval. Distinct from our study, MCF-7cells treated with 0.25 μg/mL (equivalent to a concentration of about 0.4 μM) of doxorubicin showed a 49-fold increase in early apoptosis (stained with FITC-annexin V and PI) compared to control [
18].
A significant shift of the “viable” and “apoptotic” population of cells were observed with the increasing concentration of drug, while the “necrotic” population was not affected, which is a desirable characteristic expected in a potential anticancer drug. This finding indicates that Auranofin interferes with apoptotic pathways but less with the induction of necrosis. This could be an advantage for the use of Auranofin as cell death by necrosis additionally releases multiple inflammatory mediators which could be detrimental for the specific induction of cytotoxicity in cancer cell.
The cellular mechanisms behind triggering cell death in cancer cells could be multifactorial. Anticancer drugs target multiple sites as they can act by binding to DNA and stop replication, they also act by stopping mitosis, or can trigger apoptosis by extrinsic or intrinsic pathways [
3].
Anti-proliferative effects of Auranofin on other cancer cell lines were reviewed. Auranofin demonstrated to be potent
in vitro cytotoxicity against both B16 melanoma cells and P388 leukemia cells and
in vivo anti-tumor activity against P388 leukemia in mice [
7]. Liu C. and coworkers reported the involvement of ROS dependent pathways targeting the mitochondrial dysfunction [
15]. As for this study Auranofin was co-applied with selenosystine, the authors conclude that both drugs have synergistic effects on each other. A previous study in A2780 human ovarian carcinoma cells showed that Auranofin triggers caspase 3 activation and induces apoptosis [
19]. Auranofin induced a significant level of cell cycle arrest at G1 phase and subsequent apoptosis of myeloma cells [
20]. Another report showed that Auranofin decreases the expression of proteasome subunits [
21]. These proteins are responsible for protein degradation. A recent study revealed glutathione S-transferase P1-1 (GST P1-1) as a target for Auranofin [
22]. Furthermore, the expression of this protein was altered in several cancer cell-lines and it was linked to drug resistance [
23]. These and other studies point to numerous intracellular targets of Auranofin.
As calcium is an important signaling ion, which exerts effects on many enzyme and protein functions, it is likely that [Ca
2+]
i, also plays a vital role in modulating pathways involving any of the above mentioned targets. Multiple studies support the central role for [Ca
2+]
i in the initiation of apoptosis in cancer cells. Splettstoesser and coworkers have reported that cisplatin induces concentration dependent [Ca
2+]
i by IP
3-receptor mediated pathway in HeLa-S3 [
11]. A study by Günes and coworkers highlighted that a sustained [Ca
2+]
i elevation resulted in an increase of cytotoxicity and apoptosis in neuroblastoma cells treated with cisplatin and/or arsenic trioxide [
24]. Cytosolic Ca
2+ shift was regarded as an earlier marker of cytotoxicity in a study conducted with a panel of toxins tested in different mammalian cell lines [
25]. Our study supports the idea that [Ca
2+]
i is modulated by Auranofin, as the strong reciprocal relation of “[Ca
2+]
i”
versus “viability” indicates an important role of [Ca
2+]
i in inducing apoptosis.
The well-established anticancer drug cisplatin targets multiple intracellular sites resulting in cell death and calcium signaling is one among them [
26]. Previous studies describe that cisplatin opens a Ca
2+-conductance at the cell membrane [
11], whereas arsenic trioxide releases Ca
2+ from intracellular stores [
27]. Both mechanisms were independent of each other and a co-application of both drugs resulted in a further increase of [Ca
2+]
i and cell death [
24]. Preliminary data from our lab were compared with our cisplatin treatment group and both compounds were found to modulate calcium in MCF-7 breast cancer cell-line [
28,
29]. The authors on a study using promyelocytic leukemia cells (HL-60), stated that it is not just the elevation of [Ca
2+]
i but the additional release of calcium from TG-sensitive calcium stores of the endoplasmic reticulum that triggers apoptosis [
30]. Only a few publications focused on the intracellular calcium modifications caused by Auranofin. A similar study done in neutrophils by Wong and coworkers reported a pleotropic mode of action of the drug. They found that Auranofin initially induced a slow release of calcium from the stores followed by a delayed influx of extracellular calcium showing a biphasic effect. They also emphasized an indirect role of Protein kinase C in modifying [Ca
2+]
i [
14].
With our analysis, we could not conclusively answer the question whether Auranofin induced apoptosis was a direct effect of the rise of intracellular calcium or an indirect effect and whether the [Ca2+]i elevation directly caused an activation of caspases. Our studies with the blockers did not reveal the exact mechanism of [Ca2+]i elevation. Taking into consideration the complexity of Ca2+ signaling, at this juncture it remains difficult to elucidate the exact mechanism behind the apoptosis induced by elevation of [Ca2+]i. In addition the amount of calcium released from the ER or the mitochondria and the calcium entry through the plasma membrane for the observed elevations in [Ca2+]i needs further investigation in order to distinguish whether their functions are interconnected.
4. Experimental
4.1. Cell Culture
Human MCF-7 breast cancer cells were purchased from the American Type Culture Collection (Cat No. HTB-22, Manassas, VA, USA). Cells were grown in DMEM (Sigma, Virginia Beach, VA, USA) with 10% FBS (Sigma) and incubated at 37 °C in a humidified incubator containing 5% carbon dioxide.
4.2. Viability Test
Cytotoxic effect of Auranofin was evaluated by MTS assay (CellTiter 96(R) Aqueous One Solution from Promega, Madison, WI, USA). Untreated cells were taken as control and a range of concentrations from 0.78 to 100 μM were tested. MTS (3-(4,5-dimethylthiazol-2-yl)-5-(3-carboxymethoxy-phenyl)-2-(4-sulfophenyl)-2H-tetrazolium) in the presence of phenazine methosulfate (PMS), produces a formazan product that has an absorbance maximum at 490–500 nm in aqueous solution.
MCF-7 cells for the MTS assay were plated in 96 well plates. Phenol red free DMEM with 10% Foetal Bovine Serum was used throughout the procedure. 20,000 cells were plated in each well. The cells were left at 37 °C in a CO2 incubator overnight for equilibration and on the second day various dilutions of the drug were added. The cells were treated with the drug for 24 h and on the third day the plate was washed with saline and the MTS reagent was added. The absorbance was taken at 492 nm using an Envision spectrophotometer plate reader. The cell viability was expressed as percentage of viable cells compared to untreated control using the equation: (% Viable = Absorbancetest/Absorbancecontrol × 100). Untreated control was considered as 100% viable. IC50 was defined as the drug concentration that reduced the number of living cells by 50%. Trypan blue dye exclusion test was carried out with TC20 Automated cell counter (Bio-Rad, Hercules, CA, USA).
4.3. Flow Cytometry
Total cytotoxicity and apoptosis were assessed using a kit with two fluorescent dyes SR-FLICA and 7-AAD (immunochemistry technologies, Bloomington, MN, USA). The former permeates through the intact plasma membrane and binds covalently to active caspases which initiates a positive feed-back signal for apoptosis and the latter binds to DNA but does not pass through an intact cell membrane and therefore can only bind to the DNA of the compromised cell membrane. Four types of cell population were quantified: (1) early apoptotic; (2) late apoptotic; (3) live and (4) necrotic. SR-FLICA stains the apoptotic cells and 7-AAD binds to the necrotic/dead cells. Cells were treated with the drug for 24 h and harvested. The cells were trypsinized; the cell concentration was determined and adjusted to 1 × 10⁶ cells/mL. The cells were first incubated with SR-FLICA at 37 °C for 45 min followed by 7-AAD for 10 min in the ice. After the incubation, the cells were washed twice in PBS and re-suspended in 400 μL FACS buffer supplied along with the kit. The fluorescence was acquired using BD LSR Fortessa with 488 nM laser for excitation and emission with 2 filters 585/15 and 610/20 for SR-FLICA and 7-AAD respectively. Data was processed using FACSDiva 6.3. The non-aggregated single cells were selected through SSC (Area, Height, Width) and FSC (Area, Height, Width). PMT was defined on untreated unstained cells. Single stained samples were used for compensation and for gating. 50,000 events were recorded for each sample. Cells were sorted in four different types of cell population (indicated by four quadrants (Q) in the graph). Cells which are negative for both dyes are viable cells (Q3). The cells positive only for SR FLICA were early apoptotic (Q1) and that which were positive only for 7-AAD were necrotic (Q4). The cells positive for both dyes were considered late apoptotic cells (Q2). The double stained cells were analyzed offline in excel. The early and late apoptotic cells were combined and represented as total apoptosis. The results were illustrated as dot plots with the fluorescence corresponding to SR FLICA and 7-AAD plotted against x and y-axis and as histogram where, fluorescence was plotted against cell count.
4.4. Calcium Imaging
Cells were plated in a 35 mm “eazygrip” BD Falcon tissue culture plates (Franklin Lakes, NJ, USA). The plates were washed with Tyrode’s buffer (145 mM NaCl, 2.5 mM KCl, 10 mM HEPES, 10 mM Glucose, pH 7.4 by 1 M NaOH, 1.5 mM CaCl2 and 1.2 mM MgCl2) and incubated with the fluorescent dye Fluo-4 AM (Molecular Probes, Eugene, OR, USA) a calcium sensitive dye. These calcium indicators exhibit an increase in fluorescence upon binding Ca2+. The AM ester is colorless and non-fluorescent until hydrolyzed. The cells were loaded with Fluo-4 AM for 40 min and washed, incubated for an additional 15 min to complete the de-esterification process of the dye. Fluorescent images were taken with Olympus Microscope BX51 Wi with Xenon Arc Burner and “Xcellence rt” software (Olympus soft imaging solutions GMBH, München, Germany). A water immersion objective (40×) was used for recording. An excitation wavelength of 494 nm and an emission wavelength of 516 nm were used. Fluorescent images were taken once a minute for up to 3.5 h. The buffer in the dish was exchanged through a continuous flow system (2 mL/min). Auranofin was applied when cells attained a stable basal [Ca2+]i level for at least 30 min (control). The baseline for [Ca2+]i was obtained by averaging 20–25 frames at the beginning of the experiment (before drug application) and was considered as 100%. For each experiment at least 15–25 cells were recorded. Results were analyzed offline. For each experiment the Regions of Interest (ROI) were selected and only cells which were intact over the entire experiment were selected for analysis. Data (averaging the intensity of the fluorescent in the ROI) were exported to excel. Background values corresponding to each image were subtracted. The values obtained from the control conditions were averaged and set as control value (100%) to calculate the percentage change in intensity over time by the equation = (F/F0) × 100. Where, F is the intensity at a given time and F0 is the average intensity of the control window. The results were represented as 3D graph with time and concentration plotted against percentage increase in [Ca2+]i. Images were represented in “rainbow” scale (false color) to highlight the difference in fluorescent intensities. Blue color represents lowest [Ca2+]i and yellow-red shows regions of high [Ca2+]i).
4.5. Pharmacological Manipulations
The following calcium channel modulators were used (under normal calcium external concentration) to identify which mechanisms might be involved in the changes of [Ca
2+]
i: Caffeine (10 mM) for emptying the ER stores, 2-APB (50 μM) for inhibiting store-operated calcium (SOCE) release and a IP
3-receptor blocker [
31,
32], SKF 96365 (20 μM) for inhibiting store operated calcium release. Nimodipine (10 µM), a di-hydropyridine calcium channel blocker, to block the calcium entry through L-type channels (Tocris, Ascent Scientific, Bristol, UK). All of these substances were pre-applied before Auranofin and simultaneously with the anti-cancer drug. Pre-application of Thapsigargin (1 µM) was done under zero calcium condition followed by the application of drug in normal calcium containing buffer.
4.6. Data Analysis
Each experiment was replicated three to five times and the mean ± SD was calculated. Data were statistically analyzed using IBM-SPSS version 20 (IBM, Armonk, NY, USA) as well as Microsoft excel (2011) (Microsoft Corporation, WA, USA). To test the association between concentration and viability of the cells (MTS and Trypan blue assay) means and standard deviations were computed and the nonparametric Kruskal-Wallis test was used to test for the associations. To test the association between the concentrations and the different populations of cells (flow cytometry), we used the same methods of analysis as MTS Assay.
Post hoc analysis using Bonferroni correction (p < 0.007) was applied for the multiple comparisons in the different concentration groups. The letter represents whether there was a statistical significance on the Bonferroni multiple comparison test. t-Test was done for calcium imaging experiments. Pearson’s correlation was applied for comparing viability (live cells) to [Ca2+]i and viable cells to apoptotic cells. Differences were considered significant when p-values were smaller than 0.05.


