Article

High Throughput Molecular Characterization of Normal Karyotype Acute Myeloid Leukemia in the Context of the Prospective Trial 02/06 of the Northern Italy Leukemia Group (NILG)

by
Silvia Salmoiraghi
1,2,3,
Roberta Cavagna
1,
Pamela Zanghì
1,
Chiara Pavoni
1,
Anna Michelato
1,
Ksenija Buklijas
1,
Lara Elidi
1,
Tamara Intermesoli
1,
Federico Lussana
1,
Elena Oldani
1,
Chiara Caprioli
1,
Paola Stefanoni
1,
Giacomo Gianfaldoni
4,
Ernesta Audisio
5,
Elisabetta Terruzzi
6,
Lorella De Paoli
7,
Erika Borlenghi
8,
Irene Cavattoni
9,
Daniele Mattei
10,
Annamaria Scattolin
11,
Monica Tajana
12,
Fabio Ciceri
13,
Elisabetta Todisco
14,
Leonardo Campiotti
15,
Paolo Corradini
16,17,
Nicola Fracchiolla
18,
Renato Bassan
11,
Alessandro Rambaldi
1,17,* and
Orietta Spinelli
1
add Show full author list remove Hide full author list
1
Hematology Unit, Azienda Socio Sanitaria Territoriale (ASST), Ospedale Papa Giovanni XXIII, 24127 Bergamo, Italy
2
FROM Research Foundation, Papa Giovanni XXIII Hospital, 24127 Bergamo, Italy
3
PhD Program in Translational and Molecular Medicine, University of Milano-Bicocca, 20126 Milano, Italy
4
Hematology Unit, Azienda Ospedaliera Universitaria Careggi, 50134 Firenze, Italy
5
Hematology Unit A.O.U. Città della Salute e della Scienza di Torino, 10126 Torino, Italy
6
Hematology Unit, Azienda Ospedaliera San Gerardo, 20900 Monza, Italy
7
Hematology Unit, Azienda Ospedaliera SS. Antonio e Biagio e Cesare Arrigo, 15121 Alessandria, Italy
8
Hematology Unit, ASST-Spedali Civili, 25123, Brescia, Italy
9
Hematology Unit, Ospedale S. Maurizio, 39100 Bolzano, Italy
10
Hematology Unit, Azienda Ospedaliera S.Croce e Carle di Cuneo, 12100 Cuneo, Italy
11
Hematology Unit, Ospedale dell’Angelo and SS. Giovanni e Paolo, 30174 Venezia Mestre, Italy
12
Hematology Unit, Azienda Socio Sanitaria Territoriale (ASST) Ospedale di Cremona, 26100 Cremona, Italy
13
Hematology Unit, IRCSS Ospedale San Raffaele, 20132 Milano, Italy
14
Hematology Unit, IRCCS Istituto Clinico Humanitas di Rozzano, 20089 Rozzano (MI), Italy
15
Medicine and Surgery Department, University of Insubria, 21100 Varese, Italy
16
Hematology Unit, Fondazione IRCCS Istituto Nazionale dei Tumori, 20133 Milano, Italy
17
Oncology and Hematoncology Department, University of Milan, 20122 Milano, Italy
18
Hematology Unit, Fondazione IRCCS Ca’ Granda Ospedale Maggiore Policlinico, 20122 Milano, Italy
*
Author to whom correspondence should be addressed.
Cancers 2020, 12(8), 2242; https://doi.org/10.3390/cancers12082242
Submission received: 11 June 2020 / Revised: 20 July 2020 / Accepted: 27 July 2020 / Published: 11 August 2020
(This article belongs to the Special Issue Hematologic Malignancy)

Abstract

:
By way of a Next-Generation Sequencing NGS high throughput approach, we defined the mutational profile in a cohort of 221 normal karyotype acute myeloid leukemia (NK-AML) enrolled into a prospective randomized clinical trial, designed to evaluate an intensified chemotherapy program for remission induction. NPM1, DNMT3A, and FLT3-ITD were the most frequently mutated genes while DNMT3A, FLT3, IDH1, PTPN11, and RAD21 mutations were more common in the NPM1 mutated patients (p < 0.05). IDH1 R132H mutation was strictly associated with NPM1 mutation and mutually exclusive with RUNX1 and ASXL1. In the whole cohort of NK-AML, no matter the induction chemotherapy used, by multivariate analysis, the achievement of complete remission was negatively affected by the SRSF2 mutation. Alterations of FLT3 (FLT3-ITD) and U2AF1 were associated with a worse overall and disease-free survival (p < 0.05). FLT3-ITD positive patients who proceeded to alloHSCT had a survival probability similar to FLT3-ITD negative patients and the transplant outcome was no different when comparing high and low-AR-FLT3-ITD subgroups in terms of both OS and DFS. In conclusion, a comprehensive molecular profile for NK-AML allows for the identification of genetic lesions associated to different clinical outcomes and the selection of the most appropriate and effective treatment strategies, including stem cell transplantation and targeted therapies.

1. Introduction

Cytogenetic analysis has proved to be crucial for the prognostic stratification of acute myeloid leukemia (AML) patients [1]. However, nearly half of AML patients have a normal karyotype (NK). The identification of molecular mutations has dramatically improved our knowledge of AML molecular genetics and shed new light not only on the molecular pathogenesis of the disease but also on the prognostic significance of each mutation and their combination in NK-AML [2,3]. NPM1 mutations are found in approximately one third of AML and in about 50% of cases with a normal karyotype [1,4,5]. Alterations involving NPM1 often occur in combination with other genetic aberrations, which may contribute to determining the disease evolution [3]. Moreover, about 30% of NK-AML [6] is affected by FLT3-internal tandem duplication (ITD) resulting in the deregulation of flt3 kinase activity and determining a worse clinical outcome, even in the presence of NPM1 mutations [7,8]. Particularly, the evaluation of the FLT3 allelic ratio (AR) has been included in the European leukemia net (ELN) classification to further improve risk stratification in FLT3-ITD mutated AML patients [1], even if this remains a matter of debate [9]. The molecular characterization of AML, obtained by the application of high throughput sequencing, has led to a better classification of this disease and its prognostic profile [1,10]. However, most NK-AML belong to the broad intermediate prognostic subgroup in which the most appropriate treatment strategy remains to be defined. This seems particularly relevant when considering the new drugs targeting specific mutations [11] and the benefit potentially gained by allogeneic transplantation as post remission consolidation treatment in these patients.
In this context, the purpose of this study was to define the association of molecular mutations with the outcome of a cohort of 221 NK-AML patients treated according to a prospective trial comparing a standard vs. high-dose chemotherapy regimen for remission induction (ClinicalTrials.gov identifier: NCT00495287) [12].

2. Results

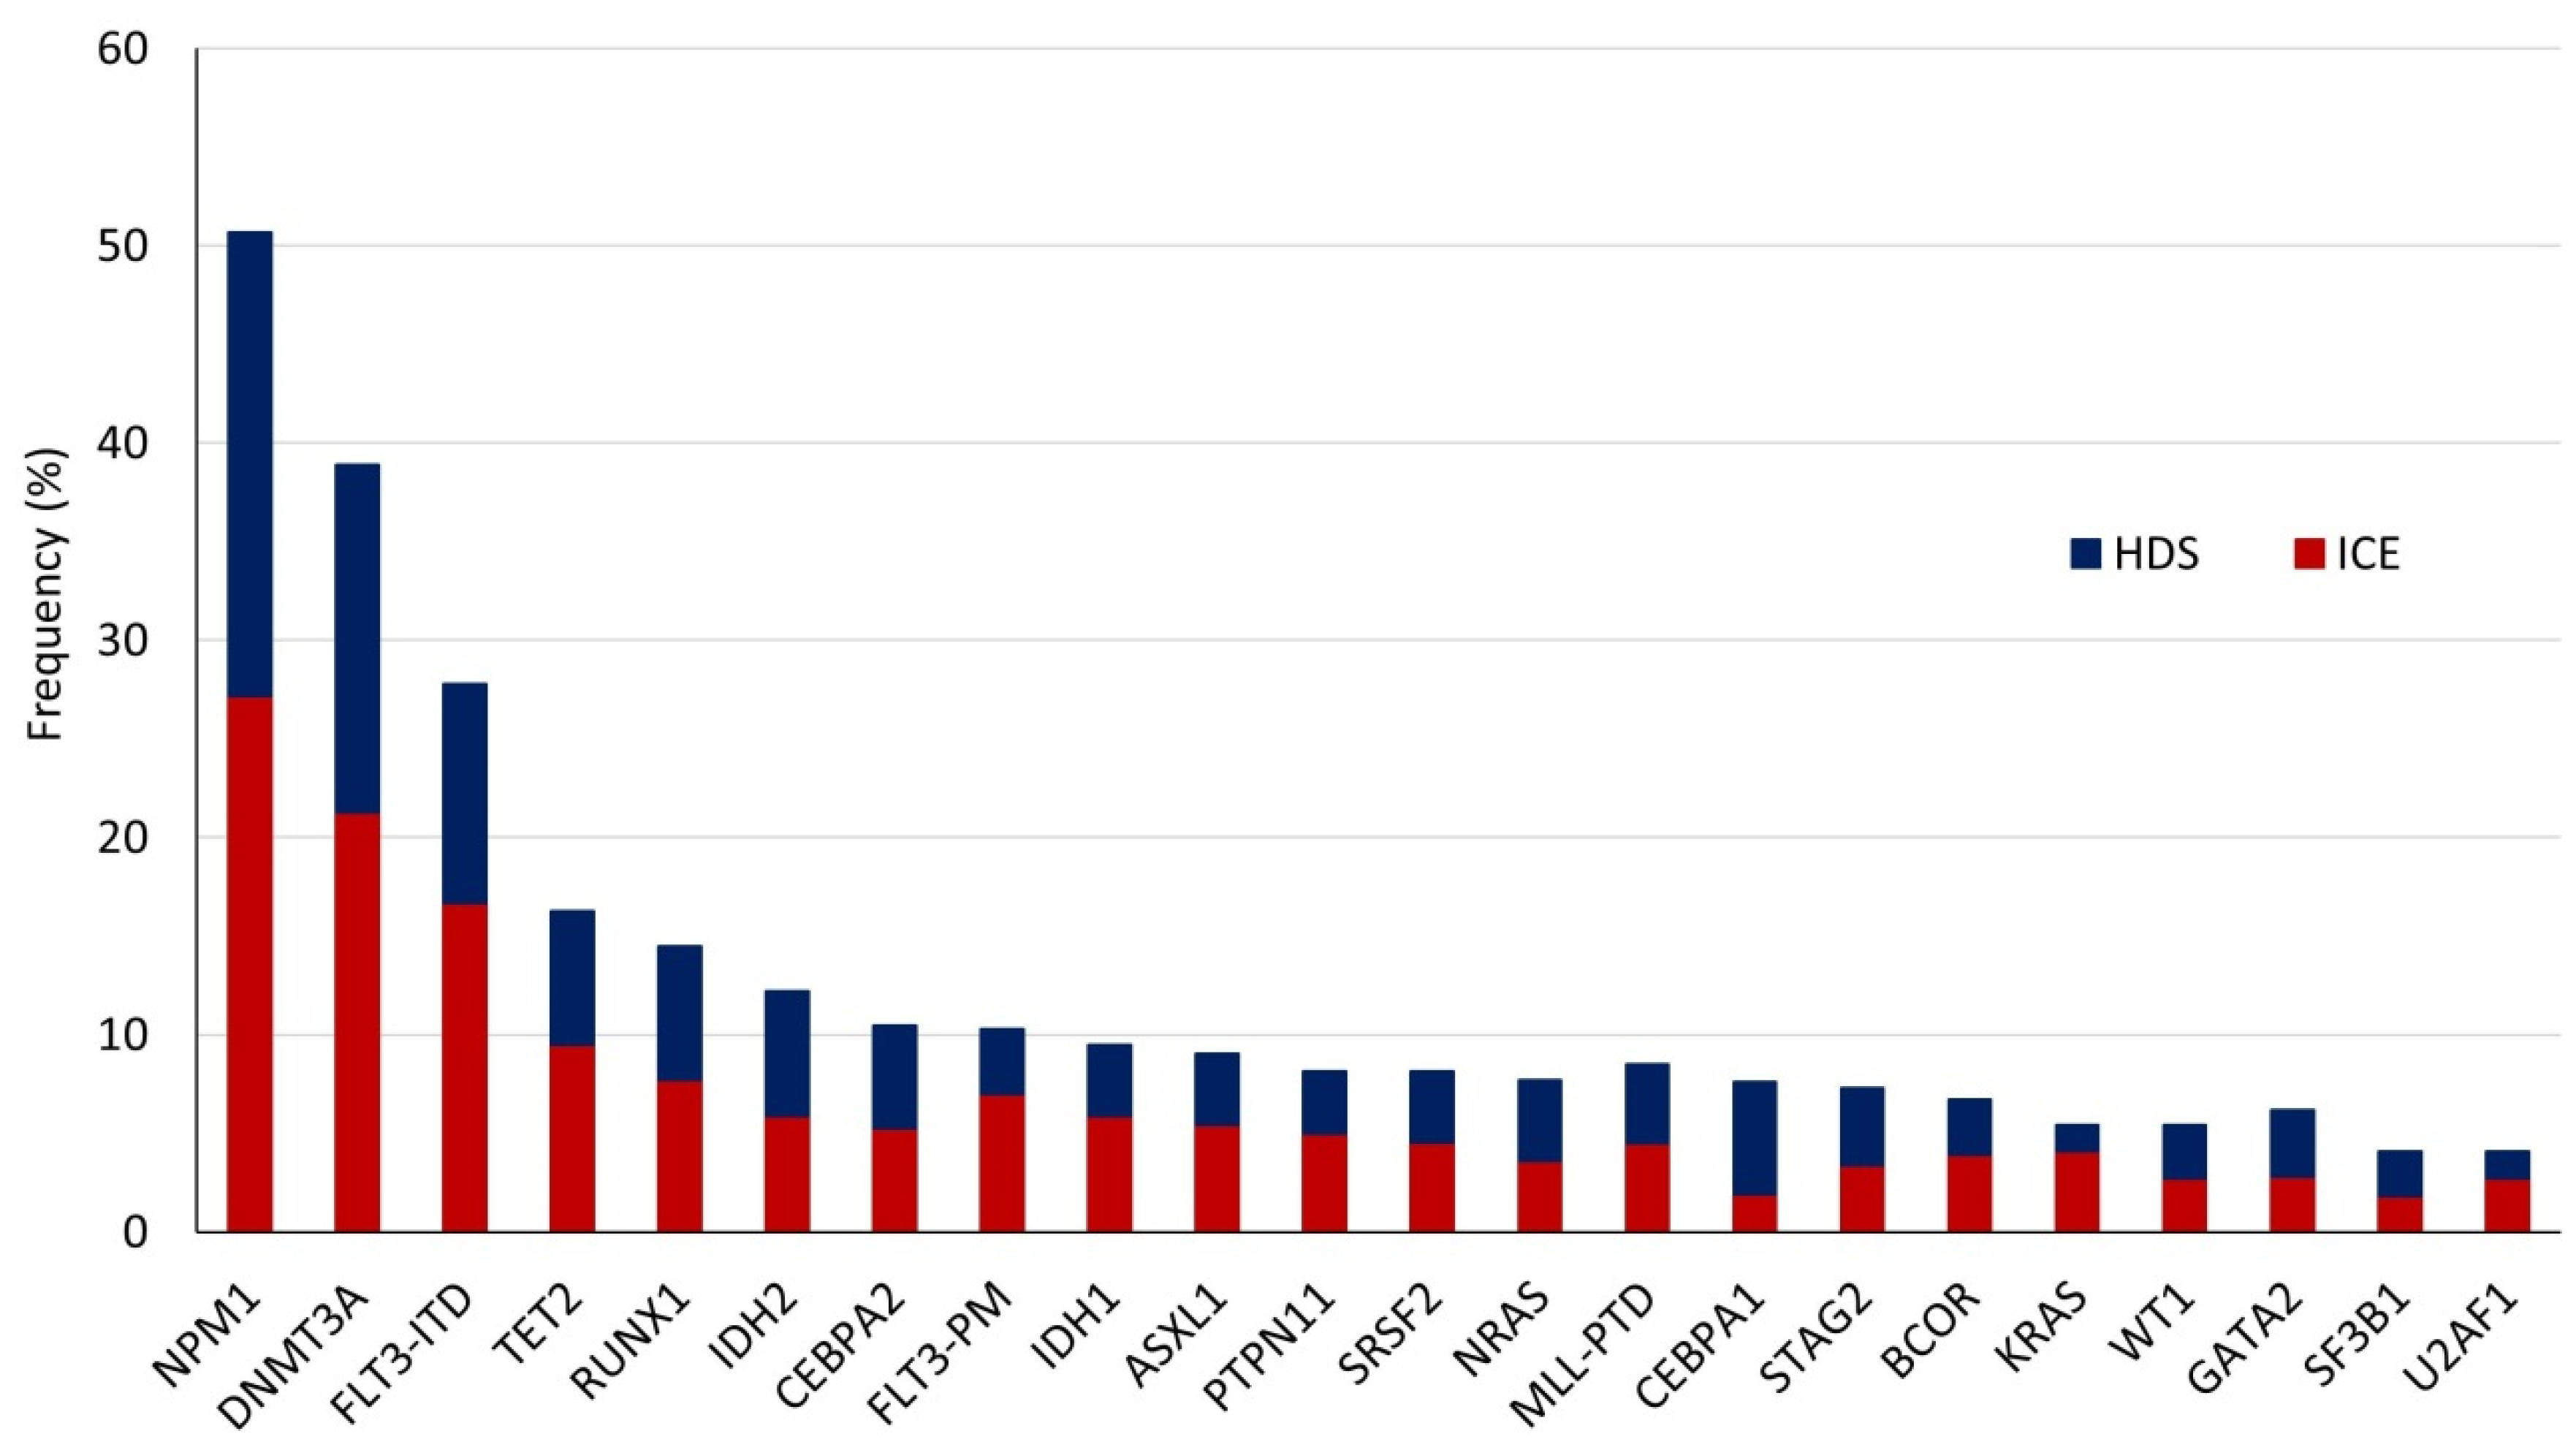
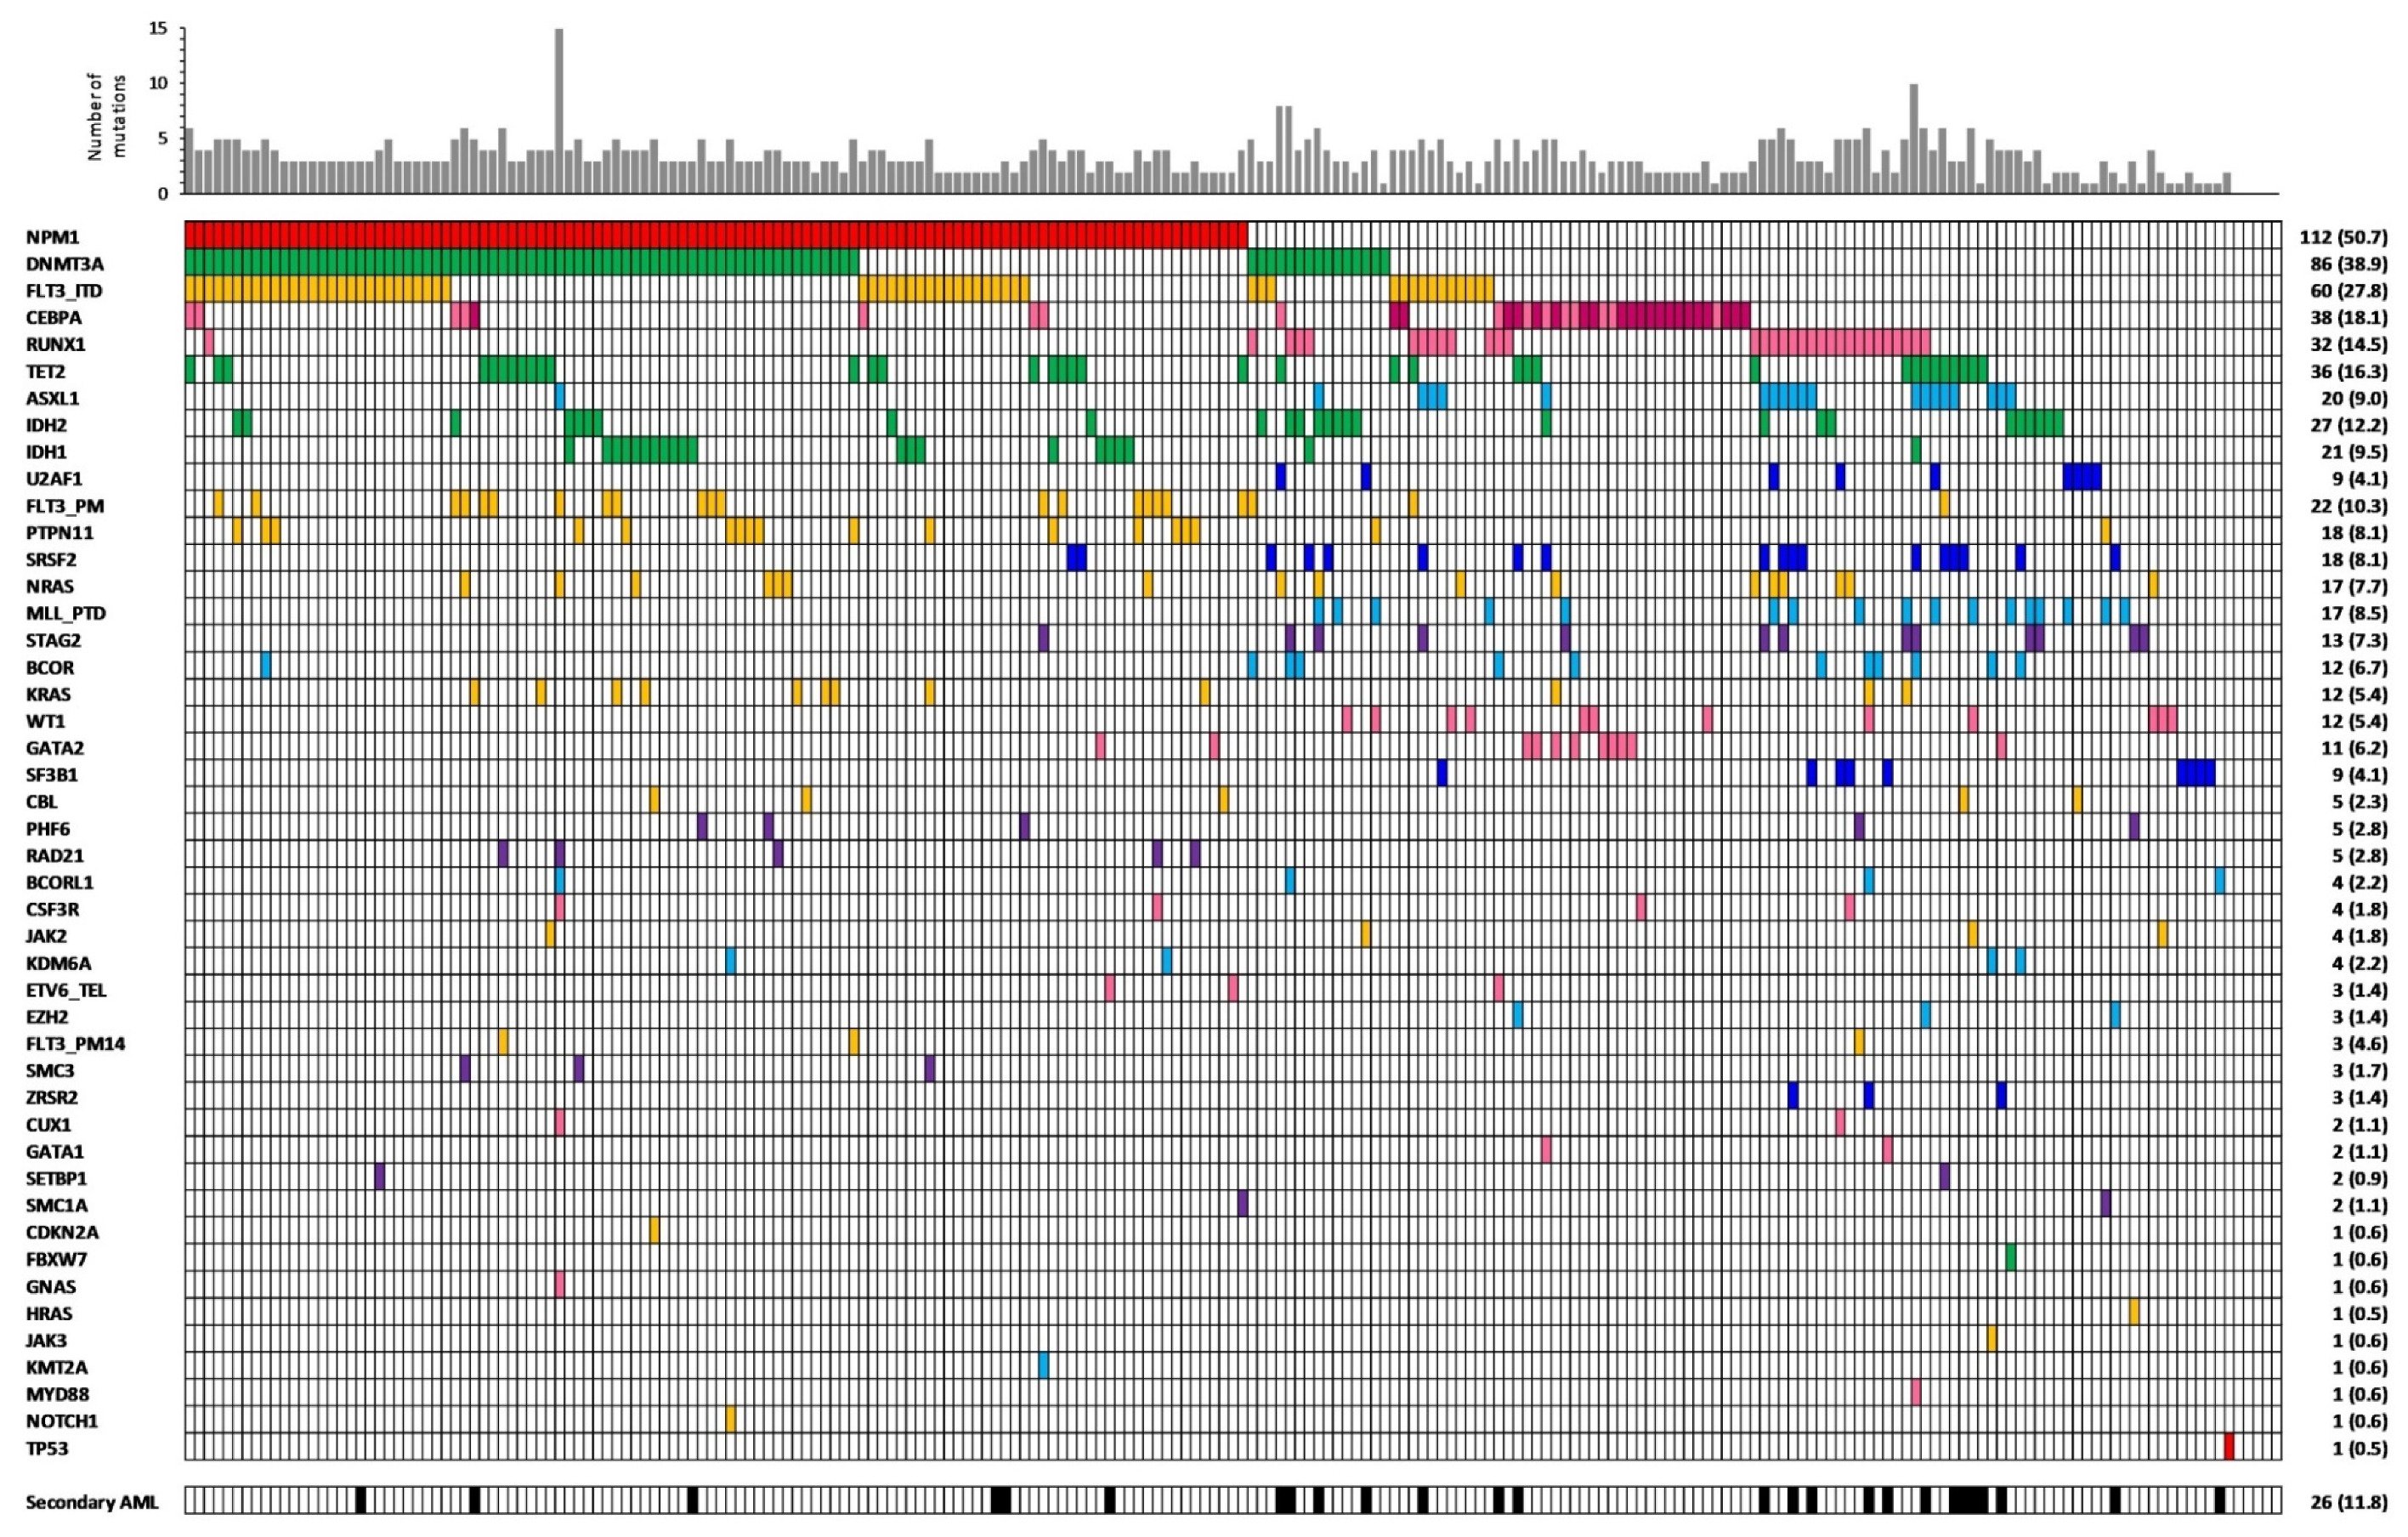
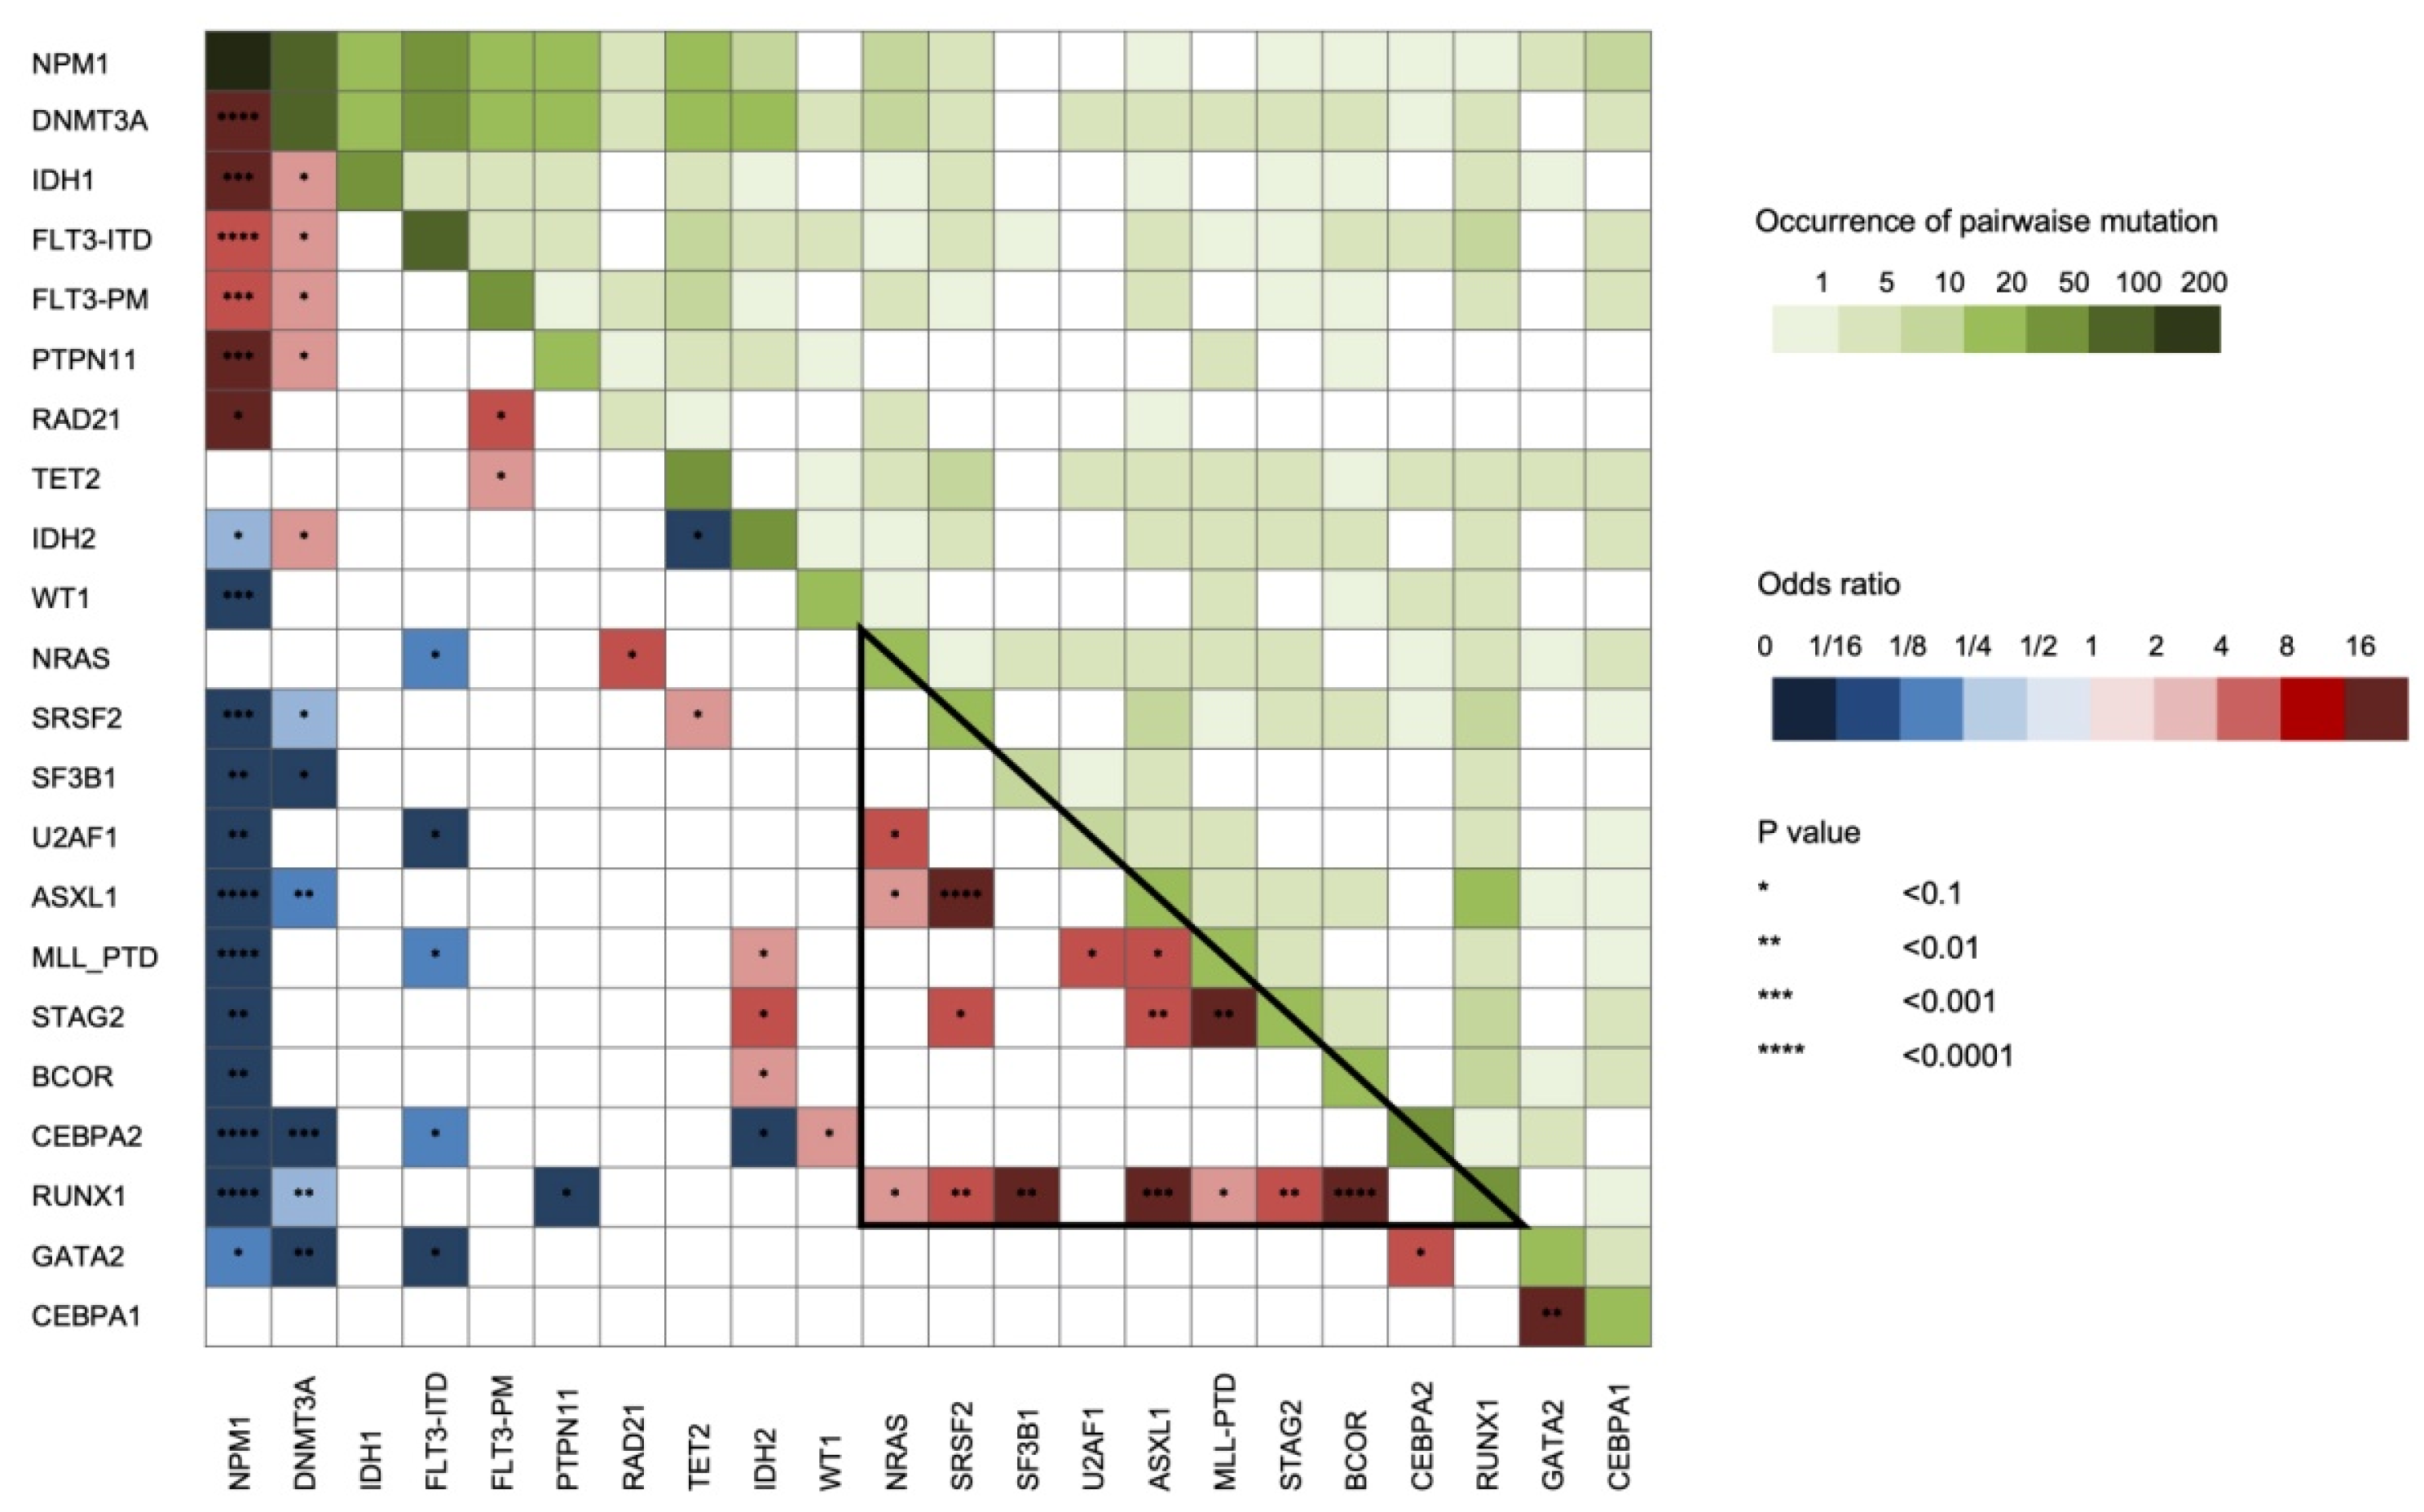
2.1. Clinical and Molecular Findings

The clinical characteristics of the 221 NK-AML patients included in this analysis are summarized in Table 1. The median age at diagnosis was 52 years (range, 19–74 years) and the majority of them (88%) had a de novo AML. The clinical and biological patient characteristics were generally well balanced between the induction arms of the study (Table 1).
According to trial indications [12], 71 out of 190 molecular profiled patients in first complete remission (CR) underwent alloHSCT (Figure 1).
The NGS analysis of the 221 patients identified a total of 738 mutations, including non-synonymous point mutations (missense (n = 334) and nonsense (n = 42)), insertions or deletions (indels) (in frame (n = 112) or causing a frameshift (n = 226)), and splicing sites mutations (n = 24). The number of molecular alterations per patient ranged from 0 to a maximum of 15, with a median of 3. Only five patients did not present mutations detectable by the applied gene panel. The mutation frequencies according to induction treatment are reported in Figure 2, whereas the number of alterations per patient and per gene are represented in Figure 3. Moreover, we measured the association between mutations in different genes, considering genes in pairs (Figure 4).
As expected, the most frequently mutated gene in our cohort of patients was NPM1, followed by DNMT3A and FLT3. We noticed that DNMT3A, FLT3, IDH1, PTPN11, and RAD21 mutations were more common in the NPM1 mutated patients (p < 0.05). In particular, IDH1 R132H mutation was strictly associated with NPM1 mutation and mutually exclusive with RUNX1 and ASXL1 while the R132C was not [13]. Alterations involving the IDH2 gene in specific amino-acids showed a different behavior regarding co-occurrence with other genes lesions. Particularly, IDH2 R140 mutation was associated with the presence of NPM1 alteration and rarely with RUNX1 mutations, while the amino-acid changes involving R172 presented the opposite combinations [14]. As expected, RUNX1 mutations often co-occurred with alterations in ASXL1, BCOR, SF3B1, SRSF2, STAG2, NRAS, and KMT2A-PTD [15], and within this latter group of genes, pathologic variants were also frequently present in combination (Figure 4). BCOR mutations were virtually mutually exclusive with NPM1 mutations while associated with RUNX1 alterations [16]. Lastly, TP53 mutations were revealed only in one NK-AML patient as solely identified genetic aberration (Figure 3). Interestingly, this patient harbored two point mutations probably affecting two different alleles, as commonly described for tumor suppressor genes.

2.2. Impact of Clinical and Molecular Profiling on CR Achievement

By univariate analysis, (Table 2) age, Eastern Cooperative Oncology Group (ECOG) performance status (PS), de novo AML nature and gene mutation profile at diagnosis had an impact on CR achievement.
In particular, achievement of CR was negatively affected by the presence of molecular alterations in TET2, ASXL1 and SRSF2 genes. On the contrary, the group of patients characterized by the presence of an NPM1 gene mutation in the absence of FLT3-ITD showed a significantly higher probability to achieve CR (Table 2). The presence of a double mutation in CEBPA gene was associated with a favorable hazard ratio (HR) for CR achievement. By multivariate analysis, the negative effect of the presence of an altered SRSF2 gene on CR achievement was confirmed (Table 3).
The probability to reach CR was not different according to the treatment allocation when a forest plot analysis was applied to each mutation (Figure S1).

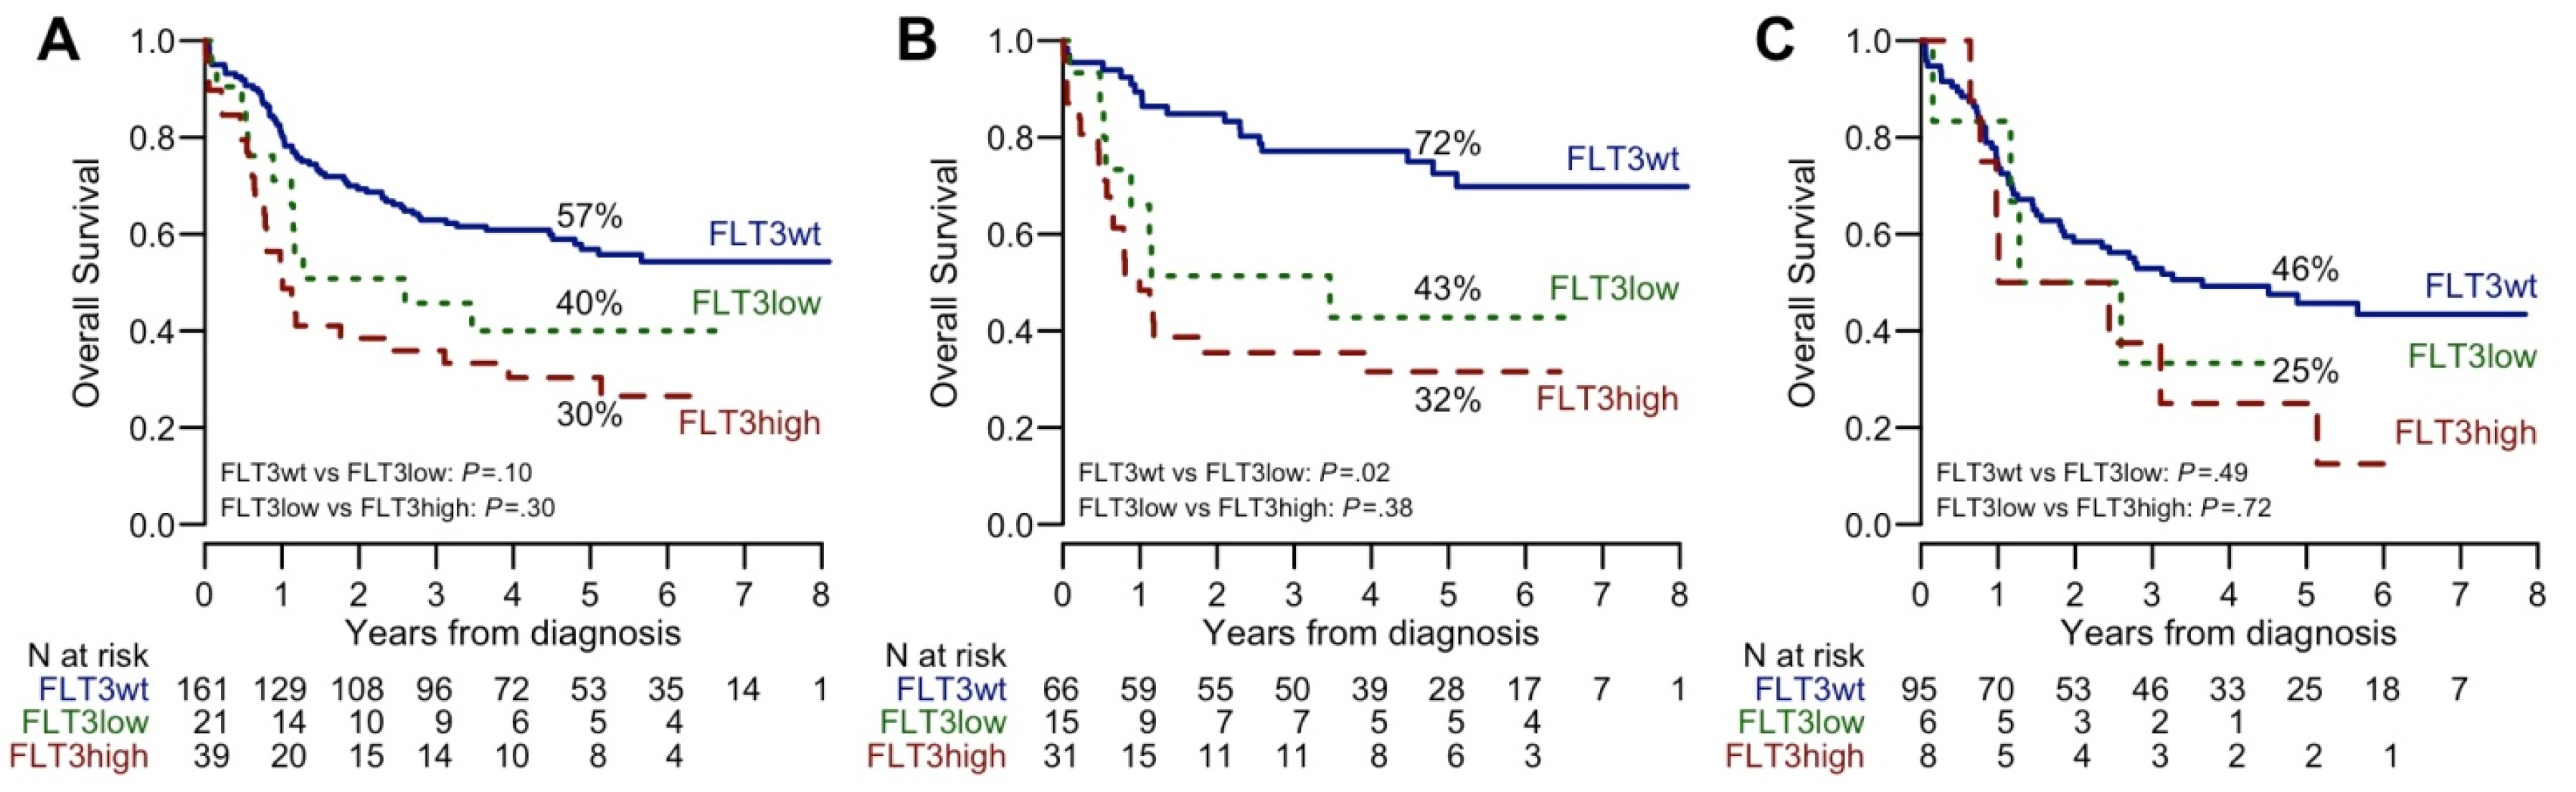
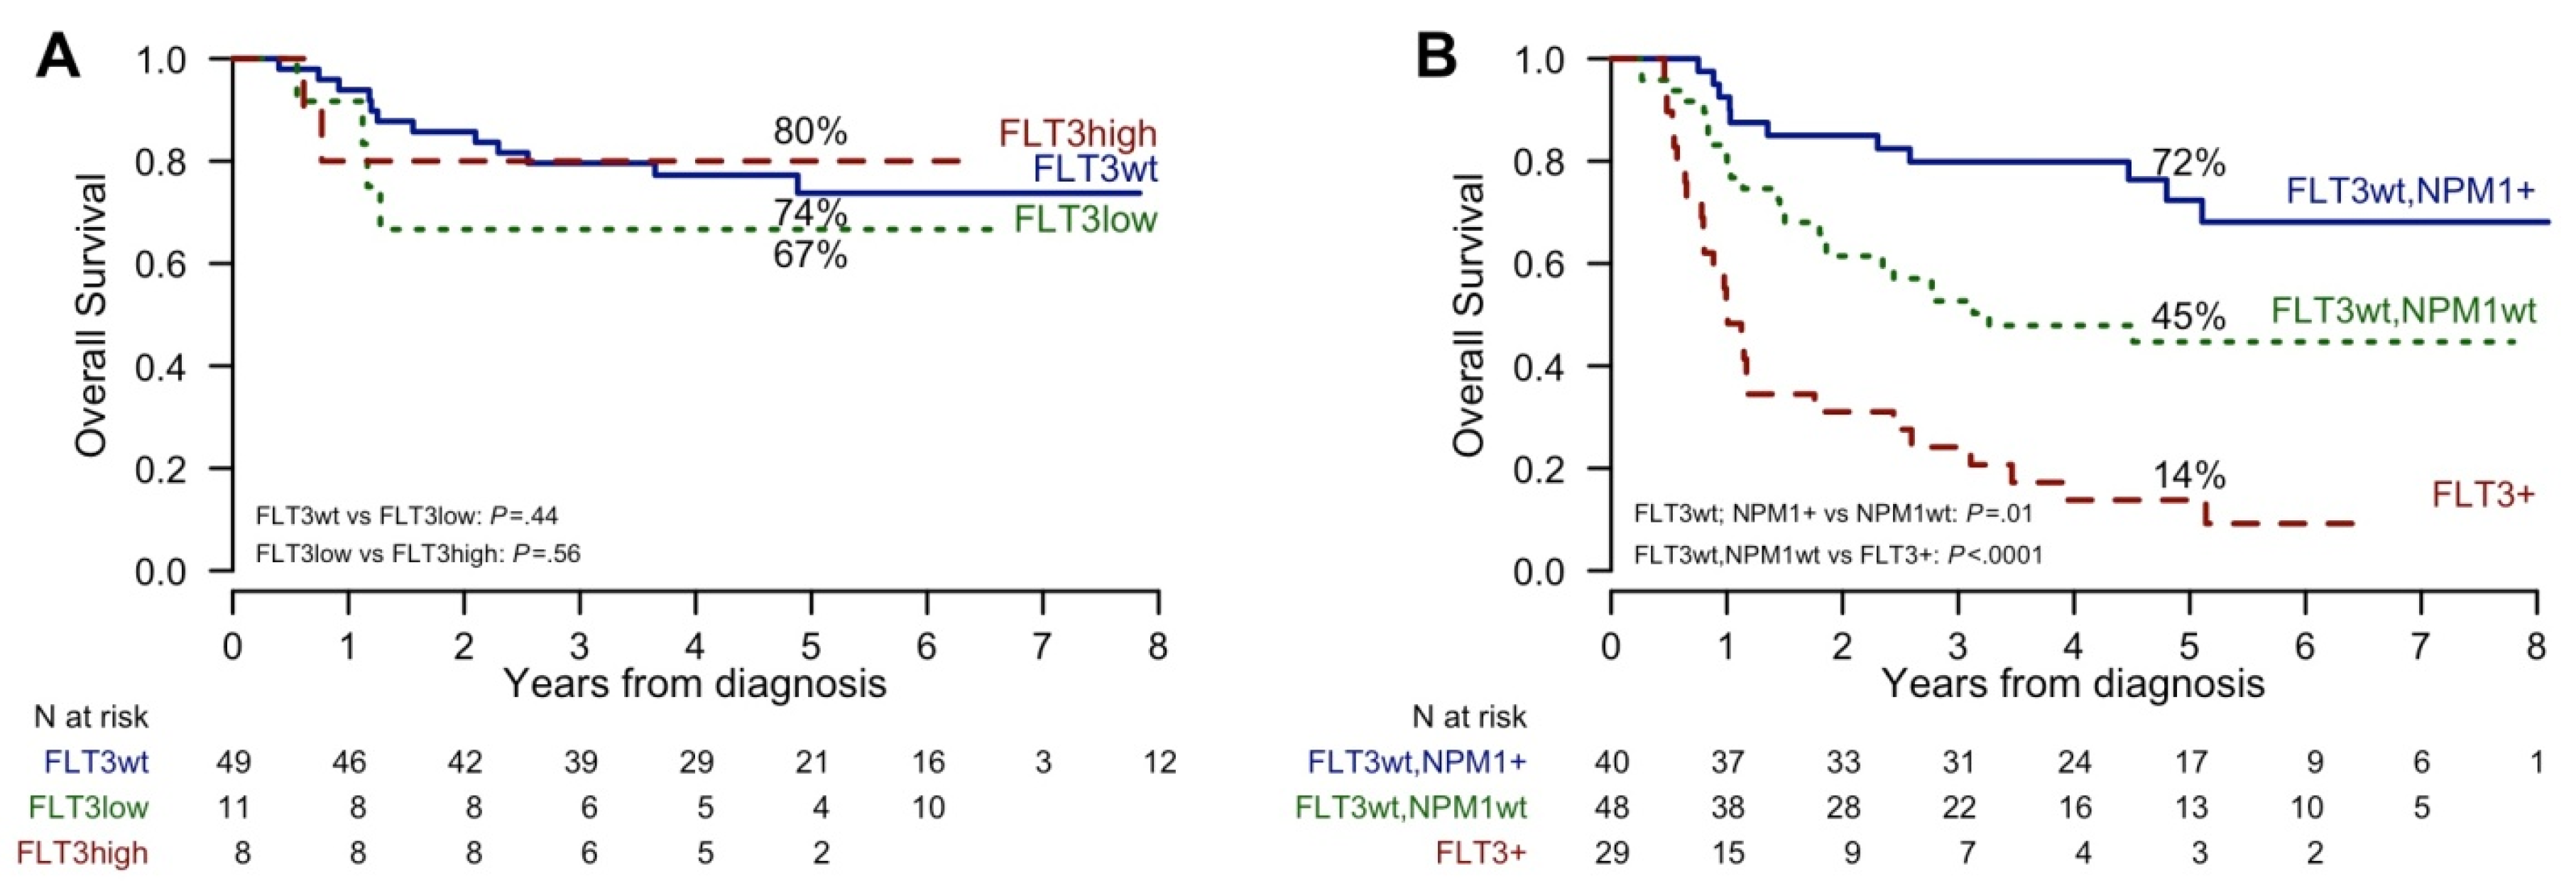
2.3. Impact of Clinical and Molecular Characteristics on Survival

Survival analysis showed that age, ECOG PS and white blood counts influenced the clinical outcome of NK-AML (Table 2). Mutations of FLT3 (FLT3-ITD), RUNX1, and U2AF1 were associated with a worse OS and DFS (p < 0.05) while double alterations involving CEBPA gene proved to have a favorable impact on clinical outcome, both in terms of OS and DFS (p < 0.05). Patients with NPM1 gene mutations but negative for FLT3-ITD had a better OS and DFS (p = 0.0001 and 0.0009, respectively) (Table 2 and Figure S2). This survival advantage was particularly evident in patients randomized to high-dose chemotherapy during the induction phase (Figure S3). Conversely, the presence of NPM1 gene mutations did not improve the clinical outcome of patients also bearing FLT3-ITD alteration. A gradient effect on survival was documented when FLT3-ITD positive patients were classified according to ELN guidelines 2017 as low-AR-FLT3-ITD (allelic ratio, AR < 0.5) or high-AR (AR ≥ 0.5) (Table 2, Figure 5).
We also verified if the allelic burden calculated for NPM1 mutations (variant allelic fraction, VAF ≤ 0.4 or > 0.4) could have an impact on outcome as recently reported [17] but we did not observe any correlation between NPM1 VAF and clinical outcome in our cohort of patients. By multivariate analysis (Table 3), the positive effect on survival of an aberrant NPM1 and a double mutated CEBPA was confirmed. In addition, the negative effect on survival related to FLT3-ITD as well as mutations involving U2AF1 gene remained statistically significant also by multivariate analysis.
The univariate analysis showed that the presence of FLT3-ITD abolished the prognostic impact of any other identified mutation. By contrast, in patients with no NPM1 or FLT3-ITD mutations, the presence of DNMT3A, TET2, RUNX1, NRAS, and U2AF1 negatively affected survival (Table 4).
In this subgroup, the unfavorable prognostic effect of U2AF1 mutations on survival remained significant also by multivariate analysis. The presence of a RUNX1 mutation was associated with an unfavorable, despite not statistically significant, HR for survival (Table 5).

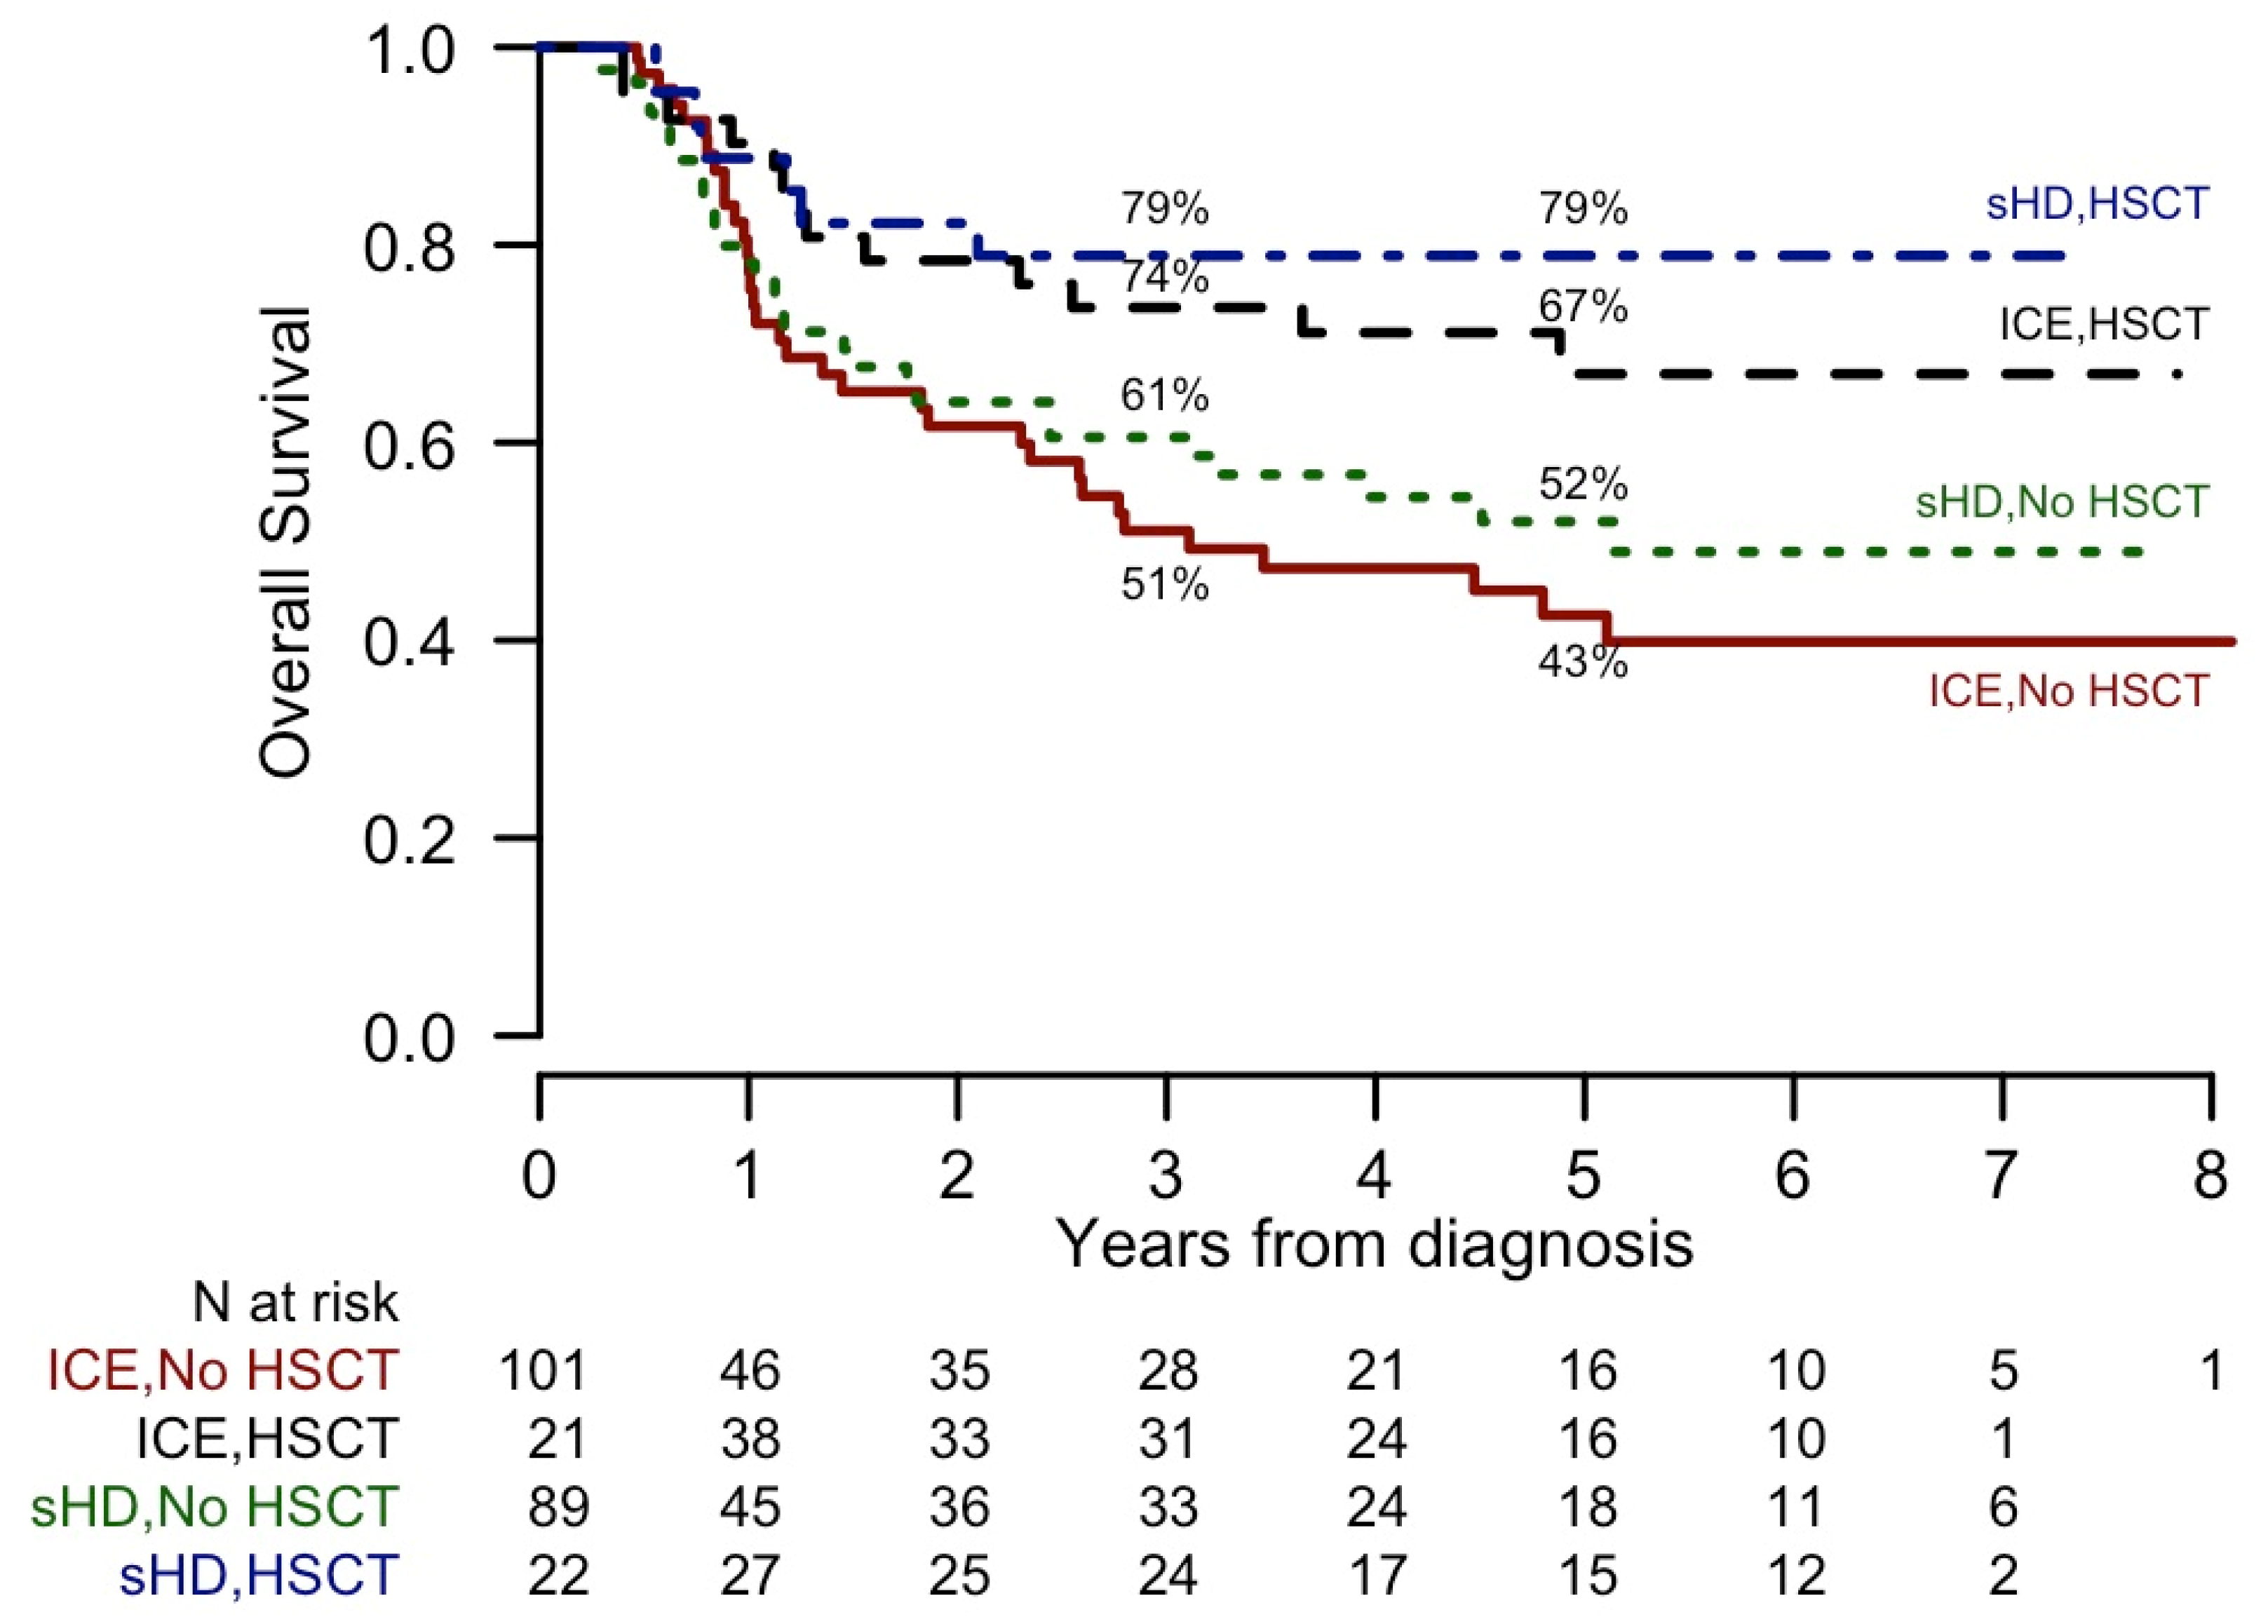
2.4. Impact of alloHSCT by Molecular Lesions

The 22 FLT3-ITD positive patients who could proceed to alloHSCT had a survival probability similar to FLT3-ITD negative patients. The transplant outcome was not different when comparing high and low-AR-FLT3-ITD subgroups both in terms of OS (Figure 6) and DFS. The OS of FLT3-ITD positive patients, no matter if NPM1 negative or positive, who did not receive alloHSCT for whatever reason showed quite a poor outcome (Figure 6B, p < 0.00001). The limited number of patients precluded the possibility to evaluate the ability of alloHSCT to modify the adverse outcome associated with other molecular alterations.

3. Discussion

In this study, we provide an accurate molecular characterization of 221 NK-AML patients included in a prospective clinical trial comparing the standard ICE induction chemotherapy to the high-dose regimen. By applying an NGS high throughput solution to sequence myeloid neoplasms related genes, we were able to identify at least one mutation in the great majority of patients (98%). Frequencies and co-occurrence of mutations are consistent with previous observations [3,14]. Our data confirm that the identification of CEBPA, NPM1, and FLT3-ITD mutations, alone or in combination, remains crucial to define patient subgroups with different prognoses. Double mutation in CEBPA gene identifies a subgroup of patient characterized by a particularly favorable outcome. On the contrary, FLT3-ITD mutations represent the most relevant marker of unfavorable prognosis in this setting, no matter the presence of NPM1 or other gene mutations. We observed a gradient effect played by FLT3-ITD allele burden on survival since, the low-AR-FLT3-ITD was still associated to a negative outcome. This correlation was not statistically significant probably due to the sample size of low-AR-FLT3-ITD subgroups (with or without mutant NPM1) which is relatively low. This observation is in line with other studies [9,18] and represents an open challenge as to the choice of the post-remission strategies. Within the limit of a modest number of patients so far analyzed, our results suggest that alloHSCT can abolish the adverse effect due to the FLT3-ITD mutation. For these reasons, at our institution, alloHSCT remains the preferred post remission option for patients with low-AR-FLT3-ITD. The role of innovative FLT3 inhibitors, either to improve the transplant outcome or to avoid it, will perhaps modify the therapeutic scenario of this AML subgroup [19,20,21]. The FLT3-ITD mutation exerts its negative influence also in NPM1 mutated patients. This observation supports the paradigm of how the presence of co-occurring mutations can modify the effect of a single mutation on the prognosis [22] and demonstrates the importance of refining molecular characterization of AML at disease presentation.
In patients with no mutations of both FLT3-ITD and NPM1, additional mutations in other leukemia-related genes proved to influence disease evolution. Therefore, the identification of specific mutations in this subgroup is mandatory to predict the clinical outcome and to select the most appropriate treatment approach. We found that molecular lesions in TET2, SRSF2, and U2AF1 were associated with negative outcomes. Our data are in line with recent studies showing that TET2 mutations and older age are independent prognostic factor in AML [23]. The U2AF1 adverse prognostic impact on survival has been already reported in a limited AML cohort [24]. To the best of our knowledge, the data on the impact of SRSF2 mutations on CR achievement were not previously reported in a cohort of patients with AML.
For the few patients (2%) with no evidence of DNA mutations, sequencing of a wider genome region, including regulatory and intronic sequences, and/or the use of an integrate analysis including other approach as comparative genomic hybridization arrays might identify rarer AML related genetic abnormalities and provide useful information for clinical decision making [25].

4. Patients and Methods

Out of 574 newly diagnosed AML patients enrolled into the NILG-AML 02/06 clinical trial, 270 subjects showed a normal karyotype. Molecular profile was performed on a total of 221 NK-AML with available diagnostic samples. Patients were affected by a de novo AML or by an AML secondary to chemo-radiotherapy or to a myelodysplastic/myeloproliferative syndrome (Table 1). This protocol was a randomized trial comparing ICE (idarubicin-cytarabine-etoposide) with sequential high dose (HD) chemotherapy in untreated patients with the intent to improve the early remission rate and to evaluate the impact on survival [12]. The trial protocol has been approved by the institutional review boards at each of the participating center (Comitato etico della provincia di Bergamo (CE150180), Comitato Etico Area Vasta Centro (CE150071), Comitato Etico città della salute e della scienza (CE150115), Comitato Etico Brianza (CE150179), Comitato Etico Interaziendale A.S.O. SS. Antonio e Biagio e C.Arrigo di Alessandria (CE150105), Comitato Etico di Brescia (CE150186), Comitato etico per la sperimentazione clinica - Comprensorio di Bolzano (CE150099), Comitato Etico Interaziendale Aso S.Croce E Carle (CE150123), CESC della Provincia di Venezia e IRCSS San Camillo(CE150073), Comitato Etico Val Padana (CE150177), Comitato Etico dell’IRCCS San Raffaele (CE150050), Comitato Etico Indipendente Istituto Clinico Humanitas (CE150081), Comitato Etico dell’Insubria (CE150185), Comitato Etico Indipendente della Fondazione IRCCS Istituto Nazionale dei Tumori di Milano (CE150053) and Comitato Etico Milano Area 2 (CE150176)).Informed consents for inclusion in the trial and for genetic analysis were obtained from all patients. Genomic DNA was isolated from mononuclear cells obtained from bone marrow or peripheral blood at diagnosis, containing at least 20% blasts. In the analysis of FLT3-ITD and D835 point mutations, KTM2A-PTD, NPM1, and CEBPA alterations were prospectively obtained with standard approaches (PCR analysis, enzymatic digestion, Sanger sequencing). In addition, we estimated the mutant to wild-type allelic ratio (AR) of FLT3-ITD using fragment length analysis technique [26]. Subsequently, on the same prospectively collected diagnostic samples, we obtained a more complete molecular profile by next generation sequencing (NGS) of targeted regions of a wide selection of myeloid neoplasms related genes. Two commercial NGS kits were applied to prepare DNA libraries for sequencing: Trusight Myeloid panel (Illumina, San Diego, CA, USA) and Sophia Myeloid Solution (SOPHiA GENETICS, SA, CH) investigating 54 and 30 gene regions, respectively (Table S1). The libraries were sequenced and demultiplexed on a MiSeq or MiniSeq instruments (Illumina, San Diego, CA). The median coverage was 6373 reads (range 44166–103) with 92% sequenced regions with > 500 and 87% with > 1000 reads. The limit of detection (LOD) for a reliable variant calling was down to 5% variant allele frequency (VAF), as recommended by both the producers. Frameshift and nonsense variants were always considered as relevant mutations. Single nucleotide variants were retained in the absence of description as genetic polymorphism into public databases of human polymorphisms (NCBI dbSNP (http://www.ncbi.nlm.nih.gov/snp; Build 137) and ExAC (http://exac.broadinstitute.org/)). Functional prediction for missense variants was derived from SIFT 1.03 (http://sift.jcvi.org) and PolyPhen2.0 (http://genetics.bwh.harvard.edu/pph2). For alterations of splicing sites and splicing related regions, we used the Human Splicing tool (Human Splicing Finder) to predict the effect on the splicing process. Finally, the description of other cancer specimens in terms of the identified mutations was checked against COSMIC database (http://cancer.sanger.ac.uk/cancergenome/projects/cosmic).
The clinical endpoints of the study were defined according to standard criteria [27]. Overall survival (OS) was defined as the probability of survival irrespective of disease state at any point in time from diagnosis. Patients alive at their last follow-up were censored. Disease free survival (DFS) was measured from the time of first CR until relapse or death. Baseline continuous characteristics were presented as median with range and compared using the Mann–Whitney U test. Categorical variables were reported with absolute and percentage frequencies and compared with Chi-squared test or Fisher’s exact test. OS and DFS were estimated by the Kaplan–Meier method and any differences were evaluated with a log-rank test. Cox models were used to estimate hazard ratios with 95% confidence intervals (CI) in univariate and multivariable analysis on survival outcomes. In this context, allogeneic hematologic stem cell transplantation (alloHSCT) was considered as a time-dependent event; Mantel–Byar tests and Simon–Makuch plots were used. In multivariable models, only factors with a p value < 0.2 in a corresponding univariate model were included. All reported p values are two-sided and a 5% significance level was set. All analyses were performed with R software, version 3.5.0.

5. Conclusions

In NK-AML, the accurate and in-depth molecular characterization did not lead to the recognition of a mutational profile associated with a different rate of response following an intensified induction chemotherapy program. No matter the induction chemotherapy, we identified mutations which are associated with different outcomes and which help to select the most appropriate consolidation strategies, namely alloHSCT. Finally, the identification of mutations that represent a potential treatment target for new drugs is now mandatory for offering patients new chemotherapy free therapeutic options.

Supplementary Materials

The following are available online at https://www.mdpi.com/2072-6694/12/8/2242/s1, Figure S1: Forest plot of induction treatment, Figure S2: Kaplan-Meier curves of Overall Survival and Disease-free Survival according to FLT3-ITD and NPM1 mutations, Figure S3: Kaplan-Meier curves of Overall Survival (OS) in different induction treatments, Table S1: Gene sequenced using Trusight Myeloid panel (Illumina, San Diego, CA, USA) and Sophia Myeloid Solution (SOPHiA GENETICS, SA, CH) (indicated with *).

Author Contributions

S.S. performed experiments, analyzed and interpreted data and wrote the manuscript. R.C., P.Z., A.M., K.B., and L.E. performed experiments and analyzed data. C.P. and E.O. analyzed data and performed the statistical analysis. T.I., F.L., C.C., P.S., G.G., E.A., E.T. (Elisabetta Terruzzi), L.D.P., E.B., I.C., D.M., A.S., M.T., F.C., E.T. (Elisabetta Todisco), L.C., P.C., and N.F. provided patients samples and clinical data. R.B. and A.R. performed clinical research and collected data. A.R. and O.S. designed the research, analyzed and interpreted data, supervised the study, and wrote the manuscript. All authors revised the manuscript and approved the final version before submission. All authors have read and agreed to the published version of the manuscript.

Funding

This work was partially supported by grants from Agenzia Italiana del Farmaco (Rome, Italy, Project FARM6YMY2N/2006) and Fondazione Guido Berlucchi-Onlus (Brescia, Italy, 2006).

Conflicts of Interest

The authors declare no conflict of interest.

References

  1. Döhner, H.; Estey, E.; Grimwade, D.; Amadori, S.; Appelbaum, F.R.; Büchner, T.; Dombret, H.; Ebert, B.L.; Fenaux, P.; Larson, R.A.; et al. Diagnosis and management of AML in adults: 2017 ELN recommendations from an international expert panel. Blood 2017, 129, 424–447. [Google Scholar] [CrossRef] [PubMed] [Green Version]
  2. Patel, J.P.; Gonen, M.; Figueroa, M.E.; Fernández, H.; Sun, Z.; Racevskis, J.; Van Vlierberghe, P.; Dolgalev, I.; Thomas, S.; Aminova, O.; et al. Prognostic Relevance of Integrated Genetic Profiling in Acute Myeloid Leukemia. N. Engl. J. Med. 2012, 366, 1079–1089. [Google Scholar] [CrossRef] [PubMed] [Green Version]
  3. Papaemmanuil, E.; Gerstung, M.; Bullinger, L.; Gaidzik, V.I.; Paschka, P.; Roberts, N.D.; Potter, N.E.; Heuser, M.; Thol, F.; Bolli, N.; et al. Genomic Classification and Prognosis in Acute Myeloid Leukemia. N. Engl. J. Med. 2016, 374, 2209–2221. [Google Scholar] [CrossRef] [PubMed]
  4. Heath, E.M.; Chan, S.M.; Minden, M.D.; Murphy, T.; Shlush, L.I.; Schimmer, A.D. Biological and clinical consequences of NPM1 mutations in AML. Leukemia 2017, 31, 798–807. [Google Scholar] [CrossRef] [PubMed]
  5. Thiede, C.; Creutzig, E.; Reinhardt, D.; Ehninger, G.; Creutzig, U. Different types of NPM1 mutations in children and adults: Evidence for an effect of patient age on the prevalence of the TCTG-tandem duplication in NPM1-exon 12. Leukemia 2006, 21, 366–367. [Google Scholar] [CrossRef] [Green Version]
  6. Patnaik, M.S. The importance ofFLT3mutational analysis in acute myeloid leukemia. Leuk. Lymphoma 2017, 59, 2273–2286. [Google Scholar] [CrossRef] [Green Version]
  7. Döhner, K.; Schlenk, R.F.; Habdank, M.; Scholl, C.; Rücker, F.G.; Corbacioglu, A.; Bullinger, L.; Fröhling, S.; Döhner, H. Mutant nucleophosmin (NPM1) predicts favorable prognosis in younger adults with acute myeloid leukemia and normal cytogenetics: Interaction with other gene mutations. Blood 2005, 106, 3740–3746. [Google Scholar] [CrossRef] [Green Version]
  8. Fröhling, S.; Schlenk, R.F.; Breitruck, J.; Benner, A.; Kreitmeier, S.; Tobis, K.; Döhner, H.; Döhner, K. Prognostic significance of activating FLT3 mutations in younger adults (16 to 60 years) with acute myeloid leukemia and normal cytogenetics: A study of the AML Study Group Ulm. Blood 2002, 100, 4372–4380. [Google Scholar] [CrossRef] [Green Version]
  9. Sakaguchi, M.; Yamaguchi, H.; Najima, Y.; Usuki, K.; Ueki, T.; Oh, I.; Mori, S.; Kawata, E.; Uoshima, N.; Kobayashi, Y.; et al. Prognostic impact of low allelic ratio FLT3-ITD and NPM1 mutation in acute myeloid leukemia. Blood Adv. 2018, 2, 2744–2754. [Google Scholar] [CrossRef] [Green Version]
  10. Arber, D.A.; Orazi, A.; Hasserjian, R.; Thiele, J.; Borowitz, M.J.; Le Beau, M.M.; Bloomfield, C.D.; Cazzola, M.; Vardiman, J.W. The 2016 revision to the World Health Organization classification of myeloid neoplasms and acute leukemia. Blood 2016, 127, 2391–2405. [Google Scholar] [CrossRef]
  11. Saultz, J.N.; Garzon, R. Acute Myeloid Leukemia: A Concise Review. J. Clin. Med. 2016, 5, 33. [Google Scholar] [CrossRef] [PubMed] [Green Version]
  12. Bassan, R.; Intermesoli, T.; Masciulli, A.; Pavoni, C.; Boschini, C.; Gianfaldoni, G.; Marmont, F.; Cavattoni, I.; Mattei, D.; Terruzzi, E.; et al. Randomized trial comparing standard vs sequential high-dose chemotherapy for inducing early CR in adult AML. Blood Adv. 2019, 3, 1103–1117. [Google Scholar] [CrossRef] [PubMed] [Green Version]
  13. Falini, B.; Spinelli, O.; Meggendorfer, M.; Martelli, M.P.; Bigerna, B.; Ascani, S.; Stein, H.; Rambaldi, A.; Haferlach, T. IDH1-R132 changes vary according to NPM1 and other mutations status in AML. Leukemia 2019, 33, 1043–1047. [Google Scholar] [CrossRef] [PubMed]
  14. Meggendorfer, M.; Cappelli, L.V.; Walter, W.; Haferlach, C.; Kern, W.; Falini, B.; Haferlach, T. IDH1R132, IDH2R140 and IDH2R172 in AML: Different genetic landscapes correlate with outcome and may influence targeted treatment strategies. Leukemia 2018, 32, 1249–1253. [Google Scholar] [CrossRef]
  15. Gaidzik, V.I.; Bullinger, L.; Schlenk, R.F.; Zimmermann, A.S.; Röck, J.; Paschka, P.; Corbacioglu, A.; Krauter, J.; Schlegelberger, B.; Ganser, A.; et al. RUNX1 Mutations in Acute Myeloid Leukemia: Results From a Comprehensive Genetic and Clinical Analysis From the AML Study Group. J. Clin. Oncol. 2011, 29, 1364–1372. [Google Scholar] [CrossRef]
  16. Grossmann, V.; Tiacci, E.; Holmes, A.B.; Kohlmann, A.; Martelli, M.P.; Kern, W.; Spanhol-Rosseto, A.; Klein, H.-U.; Dugas, M.; Schindela, S.; et al. Whole-exome sequencing identifies somatic mutations of BCOR in acute myeloid leukemia with normal karyotype. Blood 2011, 118, 6153–6163. [Google Scholar] [CrossRef] [Green Version]
  17. Patel, S.S.; Pinkus, G.S.; Ritterhouse, L.L.; Segal, J.P.; Cin, P.D.; Restrepo, T.; Harris, M.H.; Stone, R.M.; Hasserjian, R.P.; Weinberg, O.K. High NPM1 mutant allele burden at diagnosis correlates with minimal residual disease at first remission in de novo acute myeloid leukemia. Am. J. Hematol. 2019, 94, 921–928. [Google Scholar] [CrossRef]
  18. Harada, Y.; Nagata, Y.; Kihara, R.; Ishikawa, Y.; Asou, N.; Ohtake, S.; Miyawaki, S.; Sakura, T.; Ozawa, Y.; Usui, N.; et al. Prognostic analysis according to the 2017 ELN risk stratification by genetics in adult acute myeloid leukemia patients treated in the Japan Adult Leukemia Study Group (JALSG) AML201 study. Leuk. Res. 2018, 66, 20–27. [Google Scholar] [CrossRef]
  19. Stone, R.M.; Mandrekar, S.J.; Sanford, B.L.; Laumann, K.; Geyer, S.; Bloomfield, C.D.; Thiede, C.; Prior, T.W.; Döhner, K.; Marcucci, G.; et al. Midostaurin plus Chemotherapy for Acute Myeloid Leukemia with a FLT3 Mutation. N. Engl. J. Med. 2017, 377, 454–464. [Google Scholar] [CrossRef]
  20. Perl, A.E.; Martinelli, G.; Cortes, J.E.; Neubauer, A.; Berman, E.; Paolini, S.; Montesinos, P.; Baer, M.R.; Larson, R.A.; Ustun, C.; et al. Gilteritinib or Chemotherapy for Relapsed or Refractory FLT3-Mutated AML. N. Engl. J. Med. 2019, 381, 1728–1740. [Google Scholar] [CrossRef]
  21. Cortes, J.; Khaled, S.; Martinelli, G.; Perl, A.E.; Ganguly, S.; Russell, N.; Krämer, A.; Dombret, H.; Hogge, D.; Jonas, B.A.; et al. Quizartinib versus salvage chemotherapy in relapsed or refractory FLT3-ITD acute myeloid leukaemia (QuANTUM-R): A multicentre, randomised, controlled, open-label, phase 3 trial. Lancet Oncol. 2019, 20, 984–997. [Google Scholar] [CrossRef]
  22. Moarii, M.; Papaemmanuil, E. Classification and risk assessment in AML: Integrating cytogenetics and molecular profiling. Hematology 2017, 2017, 37–44. [Google Scholar] [CrossRef] [PubMed] [Green Version]
  23. Wang, R.; Gao, X.-N.; Yu, L. The prognostic impact of tet oncogene family member 2 mutations in patients with acute myeloid leukemia: A systematic-review and meta-analysis. BMC Cancer 2019, 19, 389. [Google Scholar] [CrossRef] [PubMed]
  24. Ohgami, R.S.; Ma, L.; Merker, J.D.; Gotlib, J.R.; Schrijver, I.; Zehnder, J.L.; Arber, D.A. Next-generation sequencing of acute myeloid leukemia identifies the significance of TP53, U2AF1, ASXL1, and TET2 mutations. Mod. Pathol. 2014, 28, 706–714. [Google Scholar] [CrossRef]
  25. Kanagal-Shamanna, R.; Loghavi, S.; Dinardo, C.D.; Medeiros, L.J.; Garcia-Manero, G.; Jabbour, E.; Routbort, M.J.; Luthra, R.; Bueso-Ramos, C.E.; Khoury, J.D. Bone marrow pathologic abnormalities in familial platelet disorder with propensity for myeloid malignancy and germline RUNX1 mutation. Haematology 2017, 102, 1661–1670. [Google Scholar] [CrossRef] [Green Version]
  26. Thiede, C.; Steudel, C.; Mohr, B.; Schaich, M.; Schäkel, U.; Platzbecker, U.; Wermke, M.; Bornhäuser, M.; Ritter, M.; Neubauer, A.; et al. Analysis of FLT3-activating mutations in 979 patients with acute myelogenous leukemia: Association with FAB subtypes and identification of subgroups with poor prognosis. Blood 2002, 99, 4326–4335. [Google Scholar] [CrossRef] [Green Version]
  27. Cheson, B.D.; Bennett, J.M.; Kopecky, K.J.; Büchner, T.; Willman, C.L.; Estey, E.; Schiffer, C.A.; Doehner, H.; Tallman, M.S.; Lister, T.A.; et al. Revised Recommendations of the International Working Group for Diagnosis, Standardization of Response Criteria, Treatment Outcomes, and Reporting Standards for Therapeutic Trials in Acute Myeloid Leukemia. J. Clin. Oncol. 2003, 21, 4642–4649. [Google Scholar] [CrossRef]
Figure 1. Kaplan-Meier curves of Overall Survival (OS), according to induction and consolidation treatments, in complete remission patients. 5-year OS estimates are reported. p values assessed comparing groups are: HSCT, sHD vs. ICE: p = 0.48; No HSCT, sHD vs. ICE: p = 0.52; sHD, HSCT vs. no HSCT: p = 0.03; ICE, HSCT vs. no HSCT: p = 0.01.
Cancers 12 02242 g001
Figure 2. Frequency of different mutated genes according to induction treatment. CEBPA2 and CEBPA1 indicate the presence of double or single mutation, respectively.
Cancers 12 02242 g002
Figure 3. Frequency of different mutated genes in our cohort of patients. In CEBPA line, dark pink indicates the presence of a double mutation.
Cancers 12 02242 g003
Figure 4. Pairwise association among gene mutations. The odds ratio of the association is color coded: blue colors indicate a negative association while red colors indicate a positive association. In addition, differential green intensity represent a different co-occurrence of mutations in terms of number of patients. Triangle indicates a group of genes which frequently co-mutate in NPM1 wild-type AML. CEBPA2 and CEBPA1 indicate the presence of double or single mutation, respectively.
Cancers 12 02242 g004
Figure 5. Kaplan-Meier curves of Overall Survival (OS), according to FLT3-ITD ratio. (A) All patients; (B) NPM1 positive patients; (C) NPM1 wild-type patients. 5-year OS estimates and p values are reported.
Cancers 12 02242 g005
Figure 6. Kaplan-Meier curves of Overall Survival (OS) in different consolidation programs. (A) Patients receiving allogeneic stem cell transplantation, according to FLT3-ITD ratio; (B) Patients receiving other consolidation program, according to FLT3-ITD and NPM1 mutations. 5-year OS estimates and p values are reported.
Cancers 12 02242 g006
Table 1. Patients characteristics according to induction treatment.
Patients Characteristics and MutationsAll patients,
N = 221
ICE,
N = 117
sHD,
N = 104
p
Median age, at diagnosis (range)52.5 (19.8–74.8)54.4 (23.6–74.8)49.5 (19.8–72.2)0.0324
≤60 years166 (75.1)81 (69.2)85 (81.7)0.0319
>60 years55 (24.9)36 (30.8)19 (18.3)
Sex 0.1765
Female119 (53.8)58 (49.6)61 (58.7)
Male102 (46.2)59 (50.4)43 (41.3)
AML category 0.0463
Non de novo26 (11.8)9 (7.7)17 (16.3)
De novo195 (88.2)108 (92.3)87 (83.7)
ECOG PS 0.4556
0-1201 (91)108 (92.3)93 (89.4)
2-320 (9)9 (7.7)11 (10.6)
Hepatomegaly17 (7.7)8 (6.8)9 (8.7)0.6130
Splenomegaly20 (9)9 (7.7)11 (10.6)0.4556
Extramedullary involvement34 (15.4)16 (13.7)18 (17.3)0.4550
WBC count (×109/L) 0.3677
≤50155 (70.1)79 (67.5)76 (73.1)
>5066 (29.9)38 (32.5)28 (26.9)
Hemoglobin (g/dL)9.5 (4.3–14.1)9.5 (5.1–14.1)9.5 (4.3–13.9)0.9144
Platelets(×109/L)59 (5–815)64 (5–815)57.5 (8–513)0.8752
Bone marrow blast cells, %80 (0–100)83 (10–100)80 (0–100)0.4519
Peripheral blood blasts cells, %52 (0–100)50 (0–100)55.5 (0–100)0.6909
Consolidation 0.3276
No alloHSCT119 (67.9)60 (59.4)59 (66.3)
alloHSCT71 (32.1)41 (40.6)30 (33.7)
FLT3 wt., NPM1 wt90/216 (41.7)42/112 (37.5)48/104 (46.2)0.1974
FLT3-ITD low ratio, NPM1 wt6/221 (2.7)6/117 (5.1)0/104 (0)0.0307
FLT3-ITD high ratio, NPM1 wt8/221 (3.6)4/117 (3.4)4/104 (3.8)1.0000
FLT3 wt, NPM1 +66/221 (29.9)34/117 (29.1)32/104 (30.8)0.7817
FLT3-ITD low ratio, NPM1 +15/221 (6.8)10/117 (8.5)5/104 (4.8)0.2700
FLT3-ITD high ratio, NPM1 +31/221 (14)16/117 (13.7)15/104 (14.4)0.8730
wt, wild type; ICE, standard idarubicin-cytarabine-etoposide chemotherapy; sHD, sequential high dose chemotherapy.
Table 2. Univariate analysis on patients outcome.
Patients CharacteristicsCROSDFS
HRpHRpHRp
HDS0.94 (0.44–2.03)0.87310.86 (0.59–1.26)0.43180.82 (0.54–1.23)0.3276
HSCT--0.31 (0.18–0.51)0.00000.29 (0.17–0.48)<0.0001
Age > 600.21 (0.09–0.45)0.00012.67 (1.81–3.95)0.00001.92 (1.22–3.02)0.0047
Sex male1.67 (0.77–3.79)0.20190.95 (0.65–1.39)0.79821.06 (0.7–1.58)0.7901
De novo2.62 (0.94–6.69)0.05030.73 (0.42–1.27)0.26650.76 (0.41–1.43)0.3975
ECOG PS 2–30.25 (0.09–0.73)0.00762.24 (1.25–4.01)0.00651.06 (0.46–2.43)0.886
WBC count > 500.74 (0.34–1.7)0.46211.61 (1.09–2.39)0.01791.37 (0.89–2.12)0.1533
NPM11.76 (0.82–3.92)0.15410.71 (0.48–1.04)0.07800.76 (0.51–1.14)0.1864
VAF ≤ 0.42.18 (0.87–6.27)0.11620.67 (0.42–1.05)0.07850.89 (0.57–1.39)0.6075
VAF > 0.41.3 (0.5–3.81)0.60310.8 (0.48–1.33)0.39240.59 (0.33–1.08)0.0866
FLT3-ITD0.79 (0.34–1.93)0.58112.23 (1.5–3.32)0.00012.18 (1.43–3.33)0.0003
FLT3-ITD low0.95 (0.29–4.29)0.93801.67 (0.9–3.08)0.10321.55 (0.8–3.04)0.1966
FLT3-ITD high0.87 (0.34–2.51)0.78132.43 (1.56–3.78)0.00012.6 (1.62–4.18)0.0001
DNMT3A1.01 (0.47–2.25)0.97991.25 (0.85–1.83)0.26061.49 (0.99–2.23)0.0553
TET20.23 (0.1–0.54)0.00061.38 (0.85–2.24)0.19260.94 (0.5–1.76)0.8357
RUNX10.42 (0.17–1.08)0.05902.25 (1.43–3.55)0.00051.95 (1.15–3.3)0.0132
IDH20.68 (0.25–2.17)0.47540.77 (0.4–1.47)0.42471.05 (0.56–1.97)0.8732
CEBPA2 *3.37 (0.66–61.69)0.24500.26 (0.1–0.71)0.00880.21 (0.06–0.65)0.007
FLT3_PM1.57 (0.42–10.17)0.56050.45 (0.2–1.04)0.06080.38 (0.16–0.94)0.0371
IDH10.98 (0.3–4.36)0.97140.95 (0.51–1.78)0.87810.98 (0.51–1.89)0.9575
ASXL10.25 (0.09–0.73)0.00761.54 (0.86–2.76)0.14341.3 (0.63–2.68)0.4827
CEBPA1 *2.32 (0.44–42.85)0.42430.56 (0.23–1.39)0.21330.63 (0.25–1.55)0.3141
PTPN112.95 (0.57–54.09)0.30220.46 (0.19–1.13)0.09080.58 (0.26–1.33)0.2018
SRSF20.12 (0.04–0.34)0.00011.43 (0.77–2.67)0.25960.8 (0.29–2.17)0.6553
NRAS0.74 (0.22–3.37)0.65571.46 (0.78–2.72)0.23871.31 (0.64–2.71)0.4607
KMT2A-PTD2.42 (0.46–44.57)0.40271.34 (0.67–2.67)0.40371.44 (0.72–2.88)0.298
STAG20.35 (0.1–1.36)0.09901.33 (0.61–2.88)0.47121.3 (0.52–3.23)0.5691
BCOR1.95 (0.36–36.43)0.53101.58 (0.73–3.44)0.24561.52 (0.66–3.51)0.3258
KRAS1.84 (0.34–34.31)0.56480.81 (0.33–2)0.65461.1 (0.48–2.52)0.8178
WT11.84 (0.34–34.31)0.56480.8 (0.32–1.95)0.61850.75 (0.28–2.04)0.5736
GATA2>99.99 (0–NA)0.98940 (0–Inf)0.99530 (0–Inf)0.9954
SF3B11.32 (0.23–24.91)0.79761.42 (0.66–3.06)0.36891.8 (0.83–3.9)0.1348
U2AF11.32 (0.23–24.91)0.79762.69 (1.3–5.55)0.00753.57 (1.64–7.74)0.0013
FLT3wt, NPM1 wt0.58 (0.26–1.28)0.17441.12 (0.76–1.65)0.56821.08 (0.71–1.63)0.726
FLT3-ITD low ratio, NPM1 wt0.81 (0.12–15.82)0.85051.55 (0.57–4.23)0.3881.3 (0.41–4.1)0.6572
FLT3-ITD high ratio, NPM1 wt>99.99 (0–NA)0.98612.09 (0.97–4.49)0.06022.47 (1.14–5.34)0.0214
FLT3wt, NPM1 +3.27 (1.21–11.42)0.03360.35 (0.21–0.59)0.00010.44 (0.27–0.71)0.0009
FLT3-ITD low ratio, NPM1 +1.06 (0.28–7.03)0.93611.27 (0.62–2.62)0.50891.25 (0.58–2.7)0.5683
FLT3-ITD high ratio, NPM1 +0.63 (0.25–1.83)0.36022.15 (1.33–3.47)0.00172.21 (1.31–3.75)0.0031
* CEBPA2 and CEBPA1 indicate the presence of double or single mutation, respectively.
Table 3. Multivariable analysis for patients characteristics, treatments and mutations in the complete cohort.
Patients CharacteristicsCROSDFS
HRpHRpHRp
HSCT--0.34 (0.19–0.60)0.00020.34 (0.19–0.60)<0.0001
Age > 600.43 (0.15–1.22)0.10491.37 (0.78–2.40)0.26610.89 (0.51–1.55)0.6864
De novo2.17 (0.55–7.76)0.2460----
ECOG PS 2–30.26 (0.07–1)0.03981.09 (0.42–2.85)0.8559--
WBC count > 50--1.20 (0.67–2.14)0.54561.07 (0.63–1.82)0.8023
NPM11.06 (0.33–3.3)0.92390.58 (0.32–1.06)0.07610.49 (0.28–0.88)0.0163
FLT3-ITD--2.76 (1.56–4.91)0.00052.81 (1.66–4.73)0.0001
DNMT3A----1.62 (0.95–2.77)0.0772
TET20.4 (0.13–1.24)0.10480.74 (0.33–1.66)0.4715--
RUNX10.54 (0.15–2.03)0.35011.25 (0.60–2.61)0.55670.89 (0.43–1.87)0.7638
CEBPA2 *--0.20 (0.06–0.68)0.00970.17 (0.05–0.57)0.0040
FLT3_PM--0.65 (0.23–1.89)0.43250.65 (0.25–1.67)0.3731
ASXL10.87 (0.19–4.63)0.86280.42 (0.16–1.08)0.0713--
PTPN11--0.60 (0.21–1.73)0.3450--
SRSF20.24 (0.06–0.95)0.0376----
STAG20.97 (0.18–6.65)0.9715----
SF3B1----1.02 (0.42–2.45)0.9663
U2AF1--4.19 (1.72–10.23)0.00165.54 (2.25–13.66)0.0002
* CEBPA2 indicates the presence of a double mutation.
Table 4. Univariate analysis for patients characteristics, treatments and mutations in patients lacking both FLT3-ITD and NPM1 alterations (n = 90 and n = 75 achieving CR).
Patients CharacteristicsCR n = 90OS n = 90DFS n = 75
HRpHRpHRp
HDS0.51 (0.15–1.59)0.26221.29 (0.72–2.32)0.38771.05 (0.56–1.98)0.8837
HSCT--0.43 (0.21–0.89)0.02290.42 (0.2–0.88)0.0225
Age > 600.51 (0.16–1.69)0.25242.28 (1.26–4.15)0.00682.63 (1.35–5.11)0.0043
Sex male2.38 (0.78–7.77)0.13360.63 (0.35–1.13)0.11940.86 (0.45–1.64)0.6537
De novo2.38 (0.65–7.98)0.16570.63 (0.33–1.22)0.17290.58 (0.27–1.23)0.1569
ECOG PS 2–31 (0.15–19.93)1.00002.66 (0.95–7.47)0.06352 (0.61–6.53)0.2504
WBC count > 501.22 (0.19–23.93)0.86050.54 (0.13–2.24)0.39550.28 (0.04–2.03)0.2066
DNMT3A0.48 (0.12–2.41)0.32192.77 (1.32–5.8)0.00683.83 (1.67–8.76)0.0015
TET20.21 (0.05–0.81)0.01952.26 (1.09–4.71)0.02862.33 (0.9–5.99)0.0797
RUNX10.41 (0.13–1.37)0.13232.36 (1.28–4.35)0.00601.96 (0.97–3.96)0.0608
IDH20.52 (0.15–2.13)0.32971.03 (0.46–2.3)0.94391.56 (0.68–3.54)0.2909
CEBPA2 *4.5 (0.81–84.34)0.15980.16 (0.05–0.53)0.00260.12 (0.03–0.5)0.0035
ASXL10.27 (0.08–1.03)0.04661.26 (0.59–2.7)0.55641.12 (0.44–2.86)0.8194
CEBPA1 *>99.99 (0–NA)0.99340.45 (0.14–1.45)0.18010.72 (0.25–2.03)0.5315
SRSF20.08 (0.02–0.31)0.00031.33 (0.59–2.98)0.48890.7 (0.17–2.93)0.6305
NRAS0.57 (0.11–4.14)0.51232.88 (1.28–6.48)0.01052.9 (1.13–7.48)0.0272
KMT2A-PTD3.5 (0.62–65.89)0.24371.05 (0.49–2.26)0.89601.22 (0.56–2.66)0.6168
STAG20.79 (0.17–5.67)0.77831.16 (0.45–2.98)0.76031.57 (0.6–4.09)0.3593
BCOR>99.99 (0–NA)0.99081.31 (0.46–3.71)0.61281.36 (0.48–3.9)0.5639
KRAS>99.99 (0–NA)0.99140.61 (0.08–4.44)0.62760.6 (0.08–4.37)0.6138
WT1>99.99 (0–NA)0.99030.58 (0.18–1.86)0.35840.6 (0.18–1.96)0.3983
GATA2>99.99 (0–NA)0.99370 (0–Inf)0.99730 (0–99.99)0.9973
SF3B11.44 (0.23–28.05)0.74171.4 (0.59–3.3)0.44791.77 (0.74–4.26)0.2010
U2AF11.67 (0.27–32.28)0.64063.03 (1.4–6.58)0.00493.89 (1.69–8.93)0.0014
* CEBPA2 and CEBPA1 indicate the presence of double or single mutation, respectively.
Table 5. Multivariate analysis for patients characteristics, treatments and mutations in FLT3 wt and NPM1 wt patients.
Patients CharacteristicsCROSDFS
HR (95% CI)pHR (95% CI)pHR (95% CI)p
HSCT--0.42 (0.16–1.09)0.07440.24 (0.09–0.62)0.0032
Age > 60--1.02 (0.43–2.41)0.96241.12 (0.51–2.45)0.7778
Sex male2.57 (0.66–11.53)0.18460.77 (0.33–1.78)0.5462--
De novo0.65 (0.11–2.96)0.59850.88 (0.36–2.16)0.77531.29 (0.50–3.33)0.5997
ECOG PS 2–3--2.24 (0.54–9.31)0.2681--
DNMT3A--2.58 (0.80–8.28)0.11053.57 (1.07–11.89)0.0383
TET20.15 (0.02–0.94)0.03872.32 (0.70–7.63)0.16701.93 (0.62–6.03)0.2600
RUNX10.44 (0.1–1.99)0.27472.20 (0.93–5.24)0.07411.93 (0.83–4.50)0.1277
CEBPA2 *3.93 (0.47–98.06)0.28060.20 (0.04–0.92)0.03870.13 (0.03–0.58)0.0070
ASXL11.38 (0.24–11.14)0.7367----
NRAS--1.21 (0.38–3.87)0.74571.05 (0.34–3.29)0.9284
SRSF20.08 (0.01–0.5)0.0093----
U2AF1--3.39 (1.16–9.92)0.02603.81 (1.35–10.78)0.0117
* CEBPA2 indicates the presence of a double mutation.

