Article

Development, Implementation and Assessment of Molecular Diagnostics by Next Generation Sequencing in Personalized Treatment of Cancer: Experience of a Public Reference Healthcare Hospital

1
Molecular Biology Unit, Service of Clinical Analysis, University and Polytechnic La Fe Hospital, 46026 Valencia, Spain
2
Clinical and Translational Cancer Research Group, Health Research Institute La Fe, 46026 Valencia, Spain
3
Department of Pathology, University and Polytechnic La Fe Hospital, 46026 Valencia, Spain
4
Department of Pulmonology, University and Polytechnic La Fe Hospital, 46026 Valencia, Spain
5
Department of Medical Oncology, University and Polytechnic La Fe Hospital, 46026 Valencia, Spain
*
Author to whom correspondence should be addressed.
These authors have contributed equally to this work.
Cancers 2019, 11(8), 1196; https://doi.org/10.3390/cancers11081196
Submission received: 30 July 2019 / Revised: 12 August 2019 / Accepted: 13 August 2019 / Published: 16 August 2019
(This article belongs to the Special Issue Application of Next-Generation Sequencing in Cancers)

Abstract

:
The establishment of precision medicine in cancer patients requires the study of several biomarkers. Single-gene testing approaches are limited by sample availability and turnaround time. Next generation sequencing (NGS) provides an alternative for detecting genetic alterations in several genes with low sample requirements. Here we show the implementation to routine diagnostics of a NGS assay under International Organization for Standardization (UNE-EN ISO 15189:2013) accreditation. For this purpose, 106 non-small cell lung cancer (NSCLC) and 102 metastatic colorectal cancer (mCRC) specimens were selected for NGS analysis with Oncomine Solid Tumor (ThermoFisher). In NSCLC the most prevalently mutated gene was TP53 (49%), followed by KRAS (31%) and EGFR (13%); in mCRC, TP53 (50%), KRAS (48%) and PIK3CA (16%) were the most frequently mutated genes. Moreover, NGS identified actionable genetic alterations in 58% of NSCLC patients, and 49% of mCRC patients did not harbor primary resistance mechanisms to anti-EGFR treatment. Validation with conventional approaches showed an overall agreement >90%. Turnaround time and cost analysis revealed that NGS implementation is feasible in the public healthcare context. Therefore, NGS is a multiplexed molecular diagnostic tool able to overcome the limitations of current molecular diagnosis in advanced cancer, allowing an improved and economically sustainable molecular profiling.

1. Introduction

Cancer is a complex and heterogeneous disease with considerable variation in histological and biological features. Understanding the role of genetic alterations involved in cancer development has led to its reclassification into different molecular subtypes that reflect biological behavior and may lead to further effective therapeutic targets to achieve improved outcome [1,2]. For this purpose, single gene testing approaches are traditionally used to identify individual alterations, currently targeted with approved drugs. However, comprehensive molecular characterization of tumors is hampered by the limited amount of cytology samples and/or formalin-fixed paraffin-embedded (FFPE) tissue biopsies, and by the turnaround time to assess multiple targetable genes and high economic costs. Moreover, the routine methods do not board the mutational co-occurrences, so they do not detect other alterations which in many cases are responsible for disease progression.
The knowledge of a tumor’s genetic profile is crucial to improve clinical-decision making in the patient management. Consequently, laboratories must integrate high-throughput sequencing technologies in routine molecular diagnostics [3]. These allow the simultaneous testing of multiple genetic alterations (point mutations, insertions, deletions, copy number variations and translocations) and quantify molecular subclones by procedures that provide accurate, reliable and cost-effective results. In this sense, next-generation sequencing (NGS) has overcome the cited challenges, posing an attractive alternative to traditional molecular diagnostic testing for cancer [4,5,6]. In fact, the College of American Pathologists has suggested the use of expanded panels in its latest guideline [7,8,9] and both the National Comprehensive Cancer Network (NCCN) and the European Society for Medical Oncology (ESMO) have proposed broader molecular profiling to identify rare driver mutations in non-small cell lung cancer (NSCLC) and metastatic colorectal cancer (mCRC) patients, for which effective drugs are already available or under development in clinical trials [10,11,12,13]. However, given the implications of NGS studies on the treatment of cancer patients, the establishment of an internal quality management system is strongly recommended. In this regard, the UNE-EN ISO 15189:2013 accreditation has been recognized as the international standard for quality management systems for all fields in clinical laboratories [14].
The purpose of the current study is to evaluate the integration of NGS technology in a routine clinical setting. We describe the mutational profile of two highly prevalent cancers (advanced NSCLC and mCRC) and analyze its diagnostic potential to characterize molecular heterogeneity and to increase the therapeutic opportunities with targeted therapies; we assess NGS technology at a technical and economical level; and we describe our experience in clinical practice of an NGS pipeline for cancer molecular diagnostics in the UNE-EN ISO 15189:2013 accreditation scope.

2. Results

2.1. Performance Evaluation of Next Generation Sequencing

2.1.1. Next Generation Sequencing Quality Assessment

NGS assay was able to detect the seven low frequency variants (between 1–3%) present in two reference materials used as positive controls. The variant allele frequency (VAF) detected was consistent to the data obtained by digital droplet PCR (ddPCR) assays except for EGFR p.Leu858Arg and KRAS p.Gly13Asp mutations in which NGS VAF was slightly higher (5% versus 3% and 4% versus 3%, respectively).
Quality control analysis revealed excellent performance of the NGS panels (Figure S1). The median of total reads per sample was 347,362 with a median read depth of 3310 reads per amplicon. Uniformity was 97.1% on average and the average “on-target” reads per sample was 92.6%. Moreover, 96.6% of targeted bases showed ≥500 × read depth.
On the other hand, NGS showed an invalid test rate of 3.8% (8/208 FFPE specimens). Six NSCLC samples and two mCRC failed due to low sequencing quality metrics (total reads <100,000). These samples were subsequently excluded from the study.

2.1.2. Comparison of Next Generation Sequencing with Conventional Methods

For ROS1 rearrangements and NRAS mutations the overall agreement (OA) was 100% (Table 1). Regarding EGFR, one specimen showed the p.Thr790Met mutation by conventional methodology which was not reported by NGS (OA; 99.0%). Instead, NGS and Sanger Sequencing (SS) revealed a synonymous change in homozygosis in 787 codon p.(Gln787Gln). NGS technology allowed the detection of an ALK rearrangement not detected by immunohistochemistry (IHQ) or fluorescence in situ hybridization (FISH) (OA: 99.0%). In KRAS, seven specimens gave discordant results when comparing with Real Time (RT)-qPCR assay (OA: 94.7%). BRAF pVal600Glu mutation was detected by High Resolution Melting (HRM) in nine out of eleven NGS BRAF p.Val600Glu mutated samples (OA: 96.4%).

2.1.3. Turnaround Time (TAT) and Cost Comparison

In order to compare NGS with conventional methodologies under theoretical conditions, we calculated the turnaround time and cost for three mandatory testing genes in NSCLC (EGFR, ALK and ROS1) and mCRC (KRAS, NRAS and BRAF). Starting in both cases from FFPE tissue blocks we were able to prepare libraries, sequence eight NSCLC or ten mCRC samples, and analyze data in five working days. Conventional methodologies for molecular testing of EGFR, ALK and ROS1 resulted approximately in three days while testing KRAS, NRAS and BRAF in mCRC resulted approximately in four working days. However, if KRAS is positive, TAT is reduced to three days. TAT and cost comparison between NGS and conventional methods is shown in Table 2.

2.1.4. Clinical Laboratory Accreditation

This thorough validation consisting of reference material analysis, quality control metrics assessment, experimental validation with conventional methodologies and TAT and cost comparison allowed us to include the assay within the scope of the recently granted UNE-EN ISO 15189:2013 accreditation (Entidad Nacional de Acreditación, ENAC, Nº1302/LE2445). Moreover, this NGS assay was externally validated within the European Genetics Quality Network (EMQN) External Quality Assessment Scheme for Oncogene Panel Testing, obtaining satisfactory results in 2017 and 2018 editions [15].

2.2. Next Generation Sequencing Results in the Routine Setting

2.2.1. Pathogenic Alterations Detected by Next Generation Sequencing

Sequencing analysis identified on average 1.45 non-synonymous and non-polymorphic variants per sample (291/200) (Figure 1). After filtering, a total of 168 different non-synonymous and non-polymorphic variants were detected, of which 149 were classified as somatic alterations previously reported and 19 were variants of uncertain significance (VUS).
In the NSCLC cohort, the most prevalently mutated gene was TP53 (49%) followed by KRAS (31%), EGFR (13%), BRAF (11%) and PIK3CA (7%). Rearrangements were found in ALK and ROS1 (5% and 1%, respectively). In the entire group, 9% of patients did not carry any somatic mutation; 56% harbored one somatic mutation and 35% two or more (Figure 1, Table S1).
In mCRC patients, only 17% did not harbor any mutation, 33% carried one somatic mutation and 50% harbored two or more. Half of the patients carried mutations in TP53 (50%). Mutations in KRAS were the second most prevalent (48%), specifically mutations in codon 12 accounted for 37%. We also detected pathogenic variants in codon 13 (5%), codon 146 (5%), codon 117 (1%) and the uncommon codon 19 mutation (p.Leu19Phe) found in concomitancy with a codon 146 mutation. Pathogenic variants in PIK3CA supposed 16% and mutations in SMAD4 were detected in 11% of patients. Regarding BRAF, eight samples harbored the classical p.Val600Glu and two showed mutations outside this hotspot. NRAS mutated samples (2%) harbored the hotspot p.Gln61Arg mutation (Figure 1, Table S2).

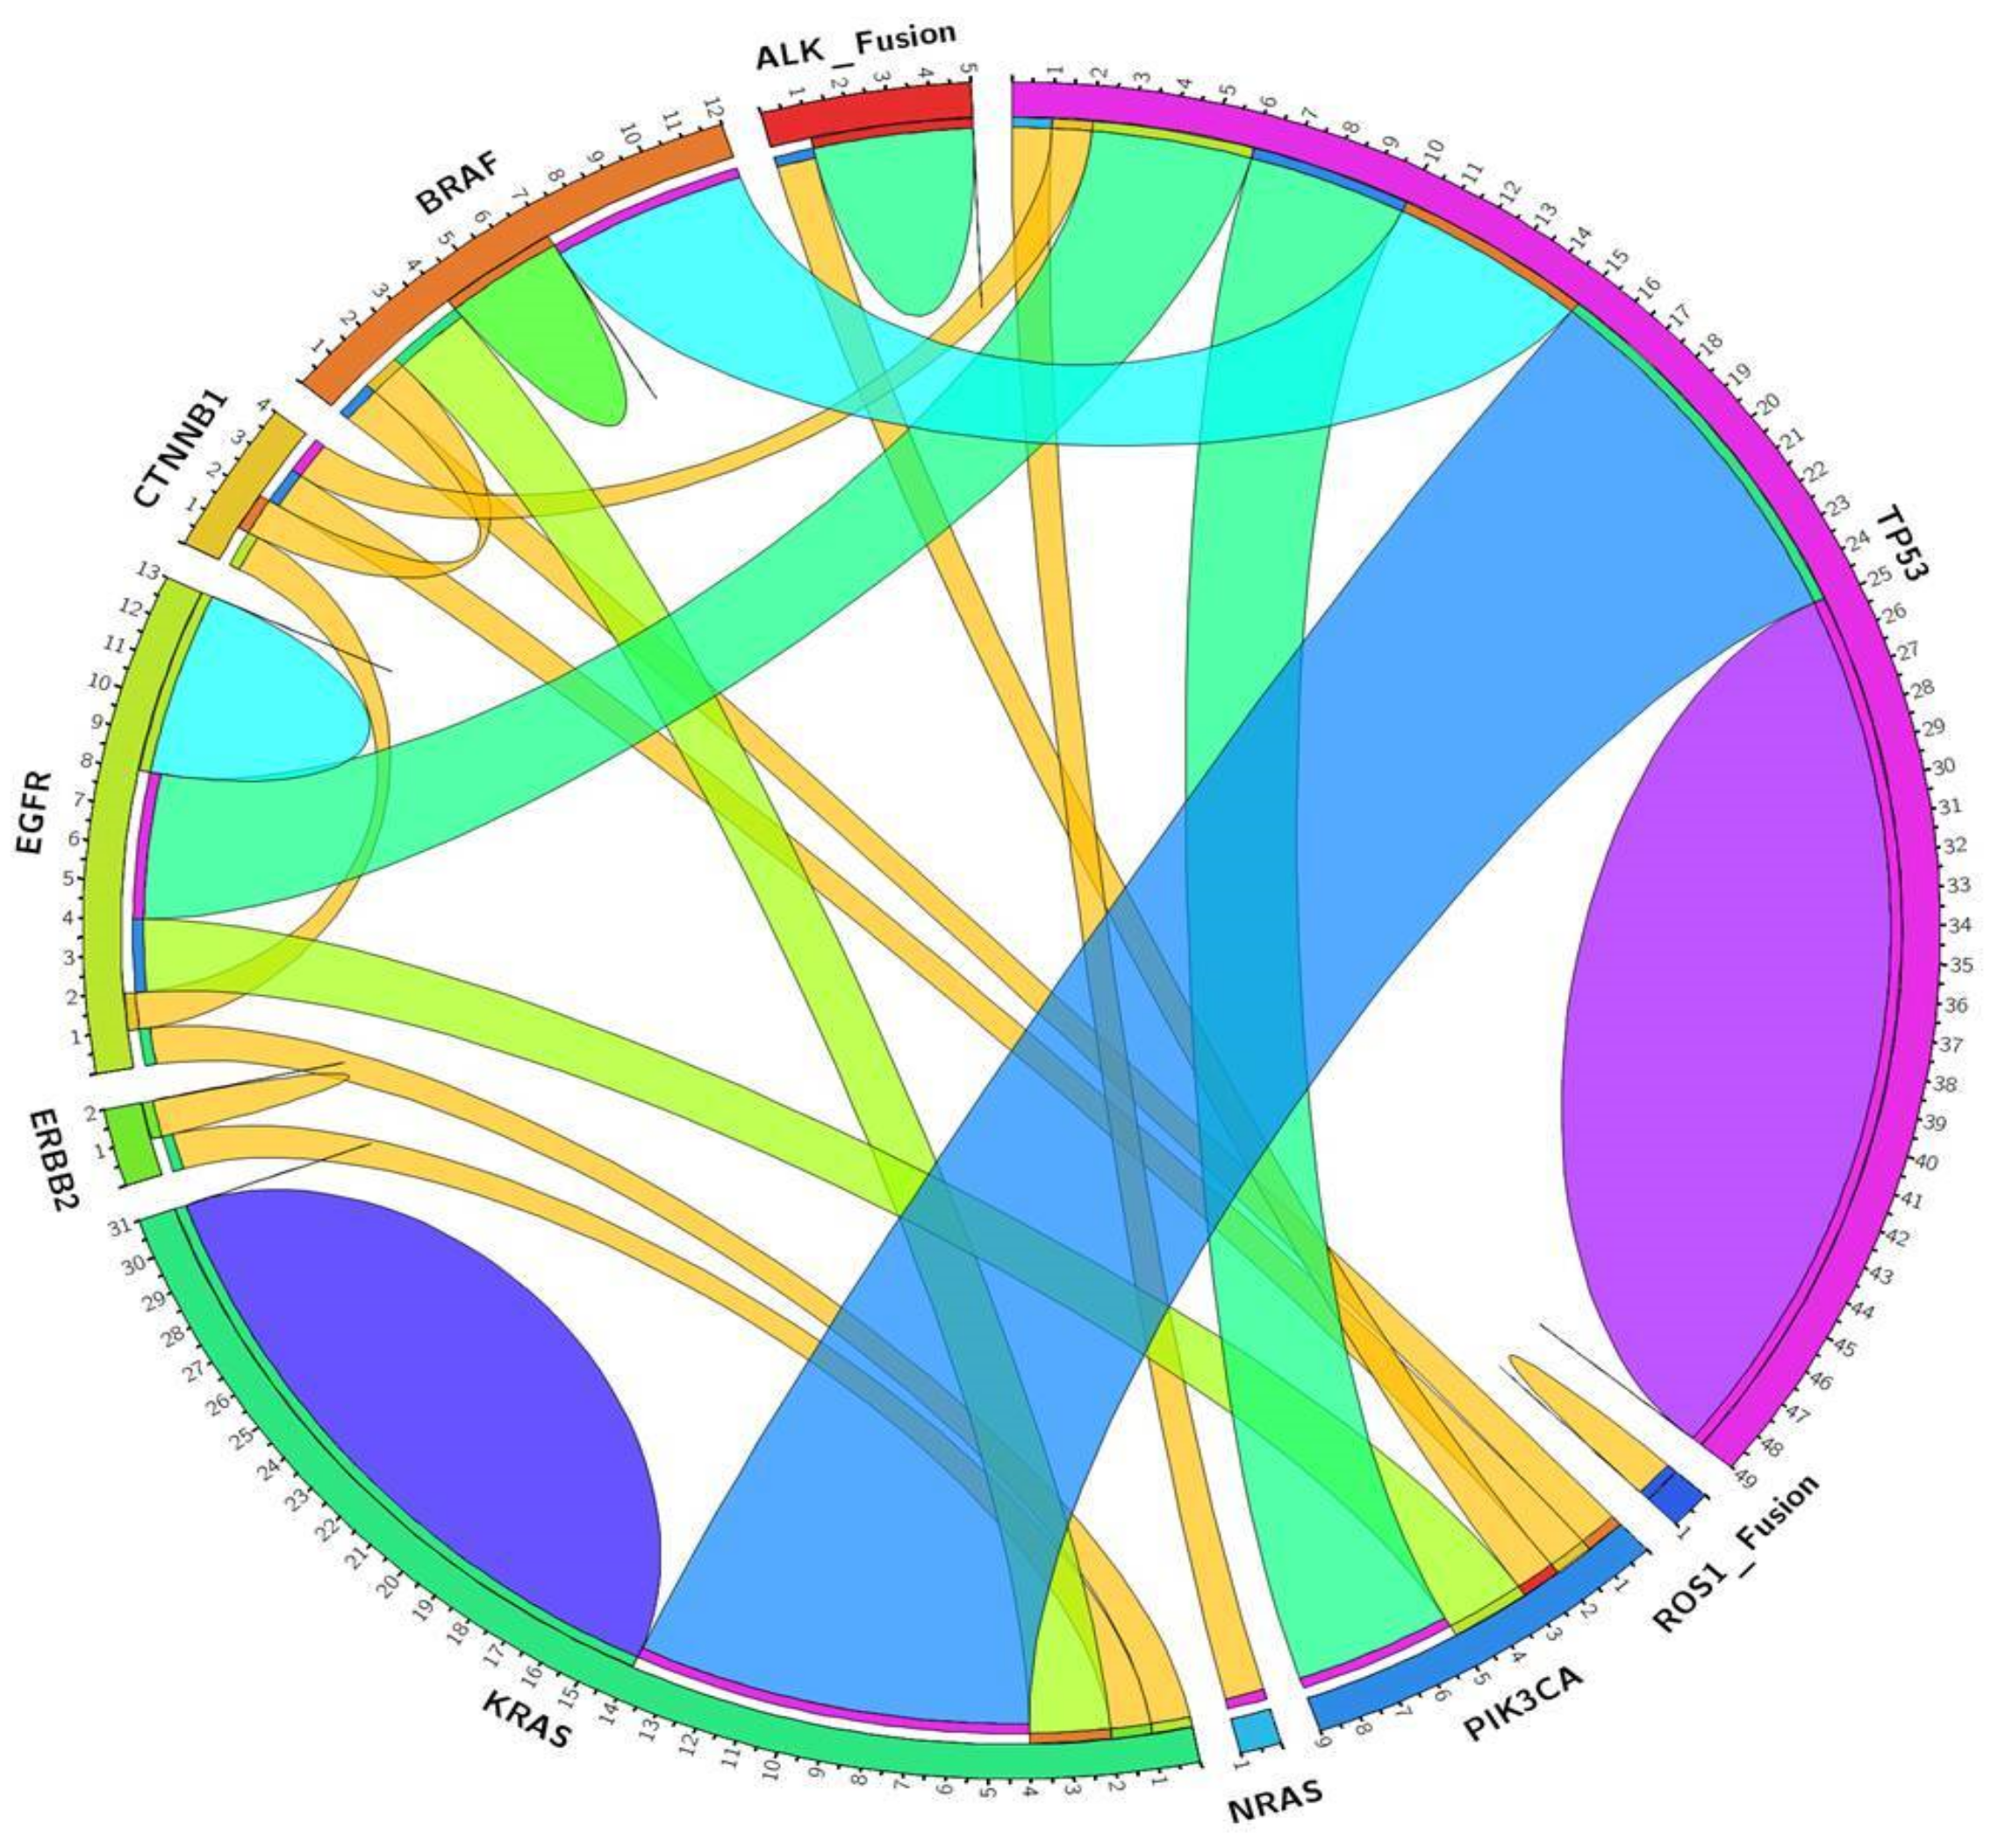
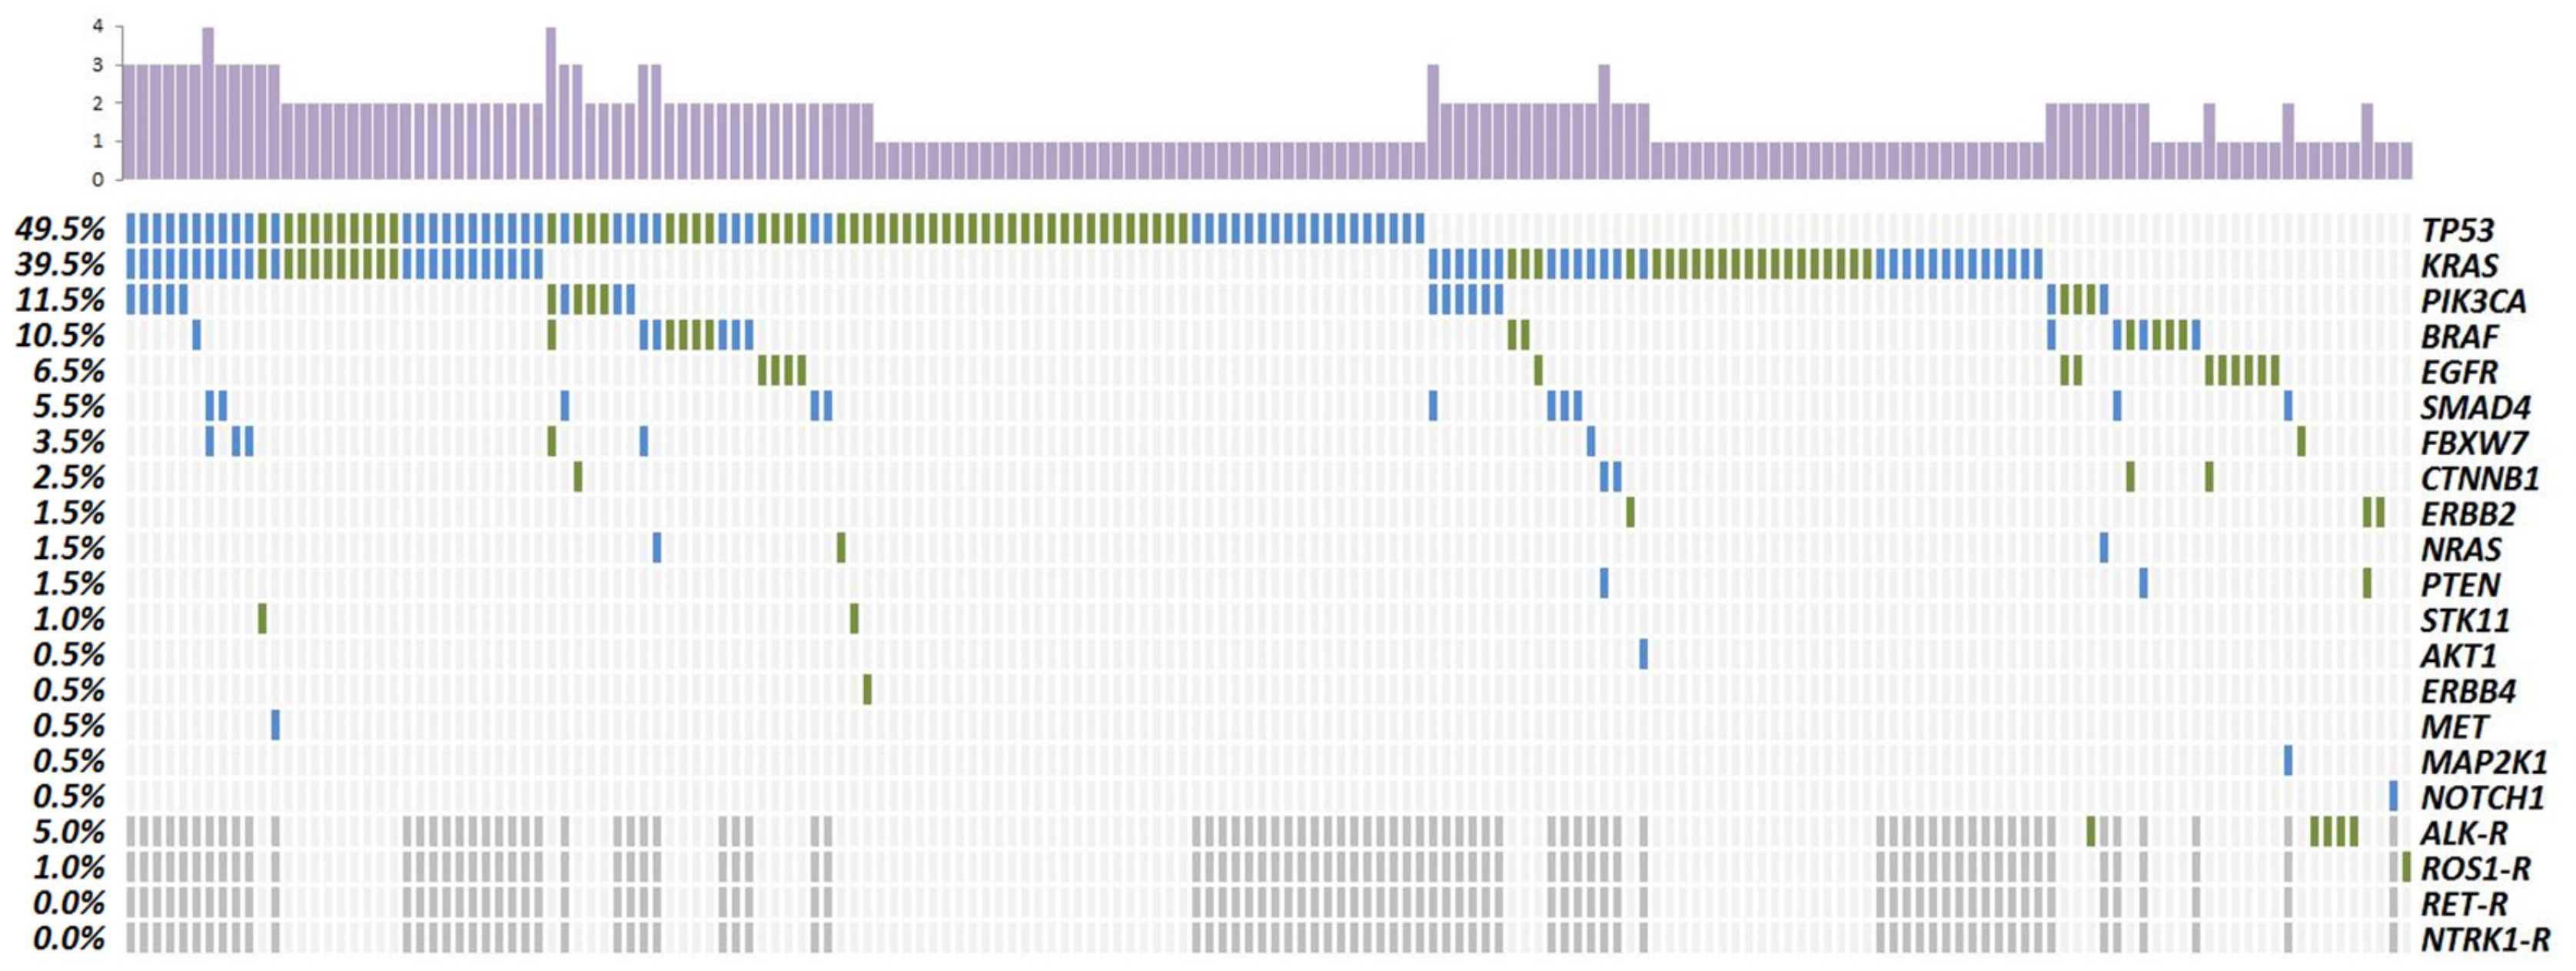
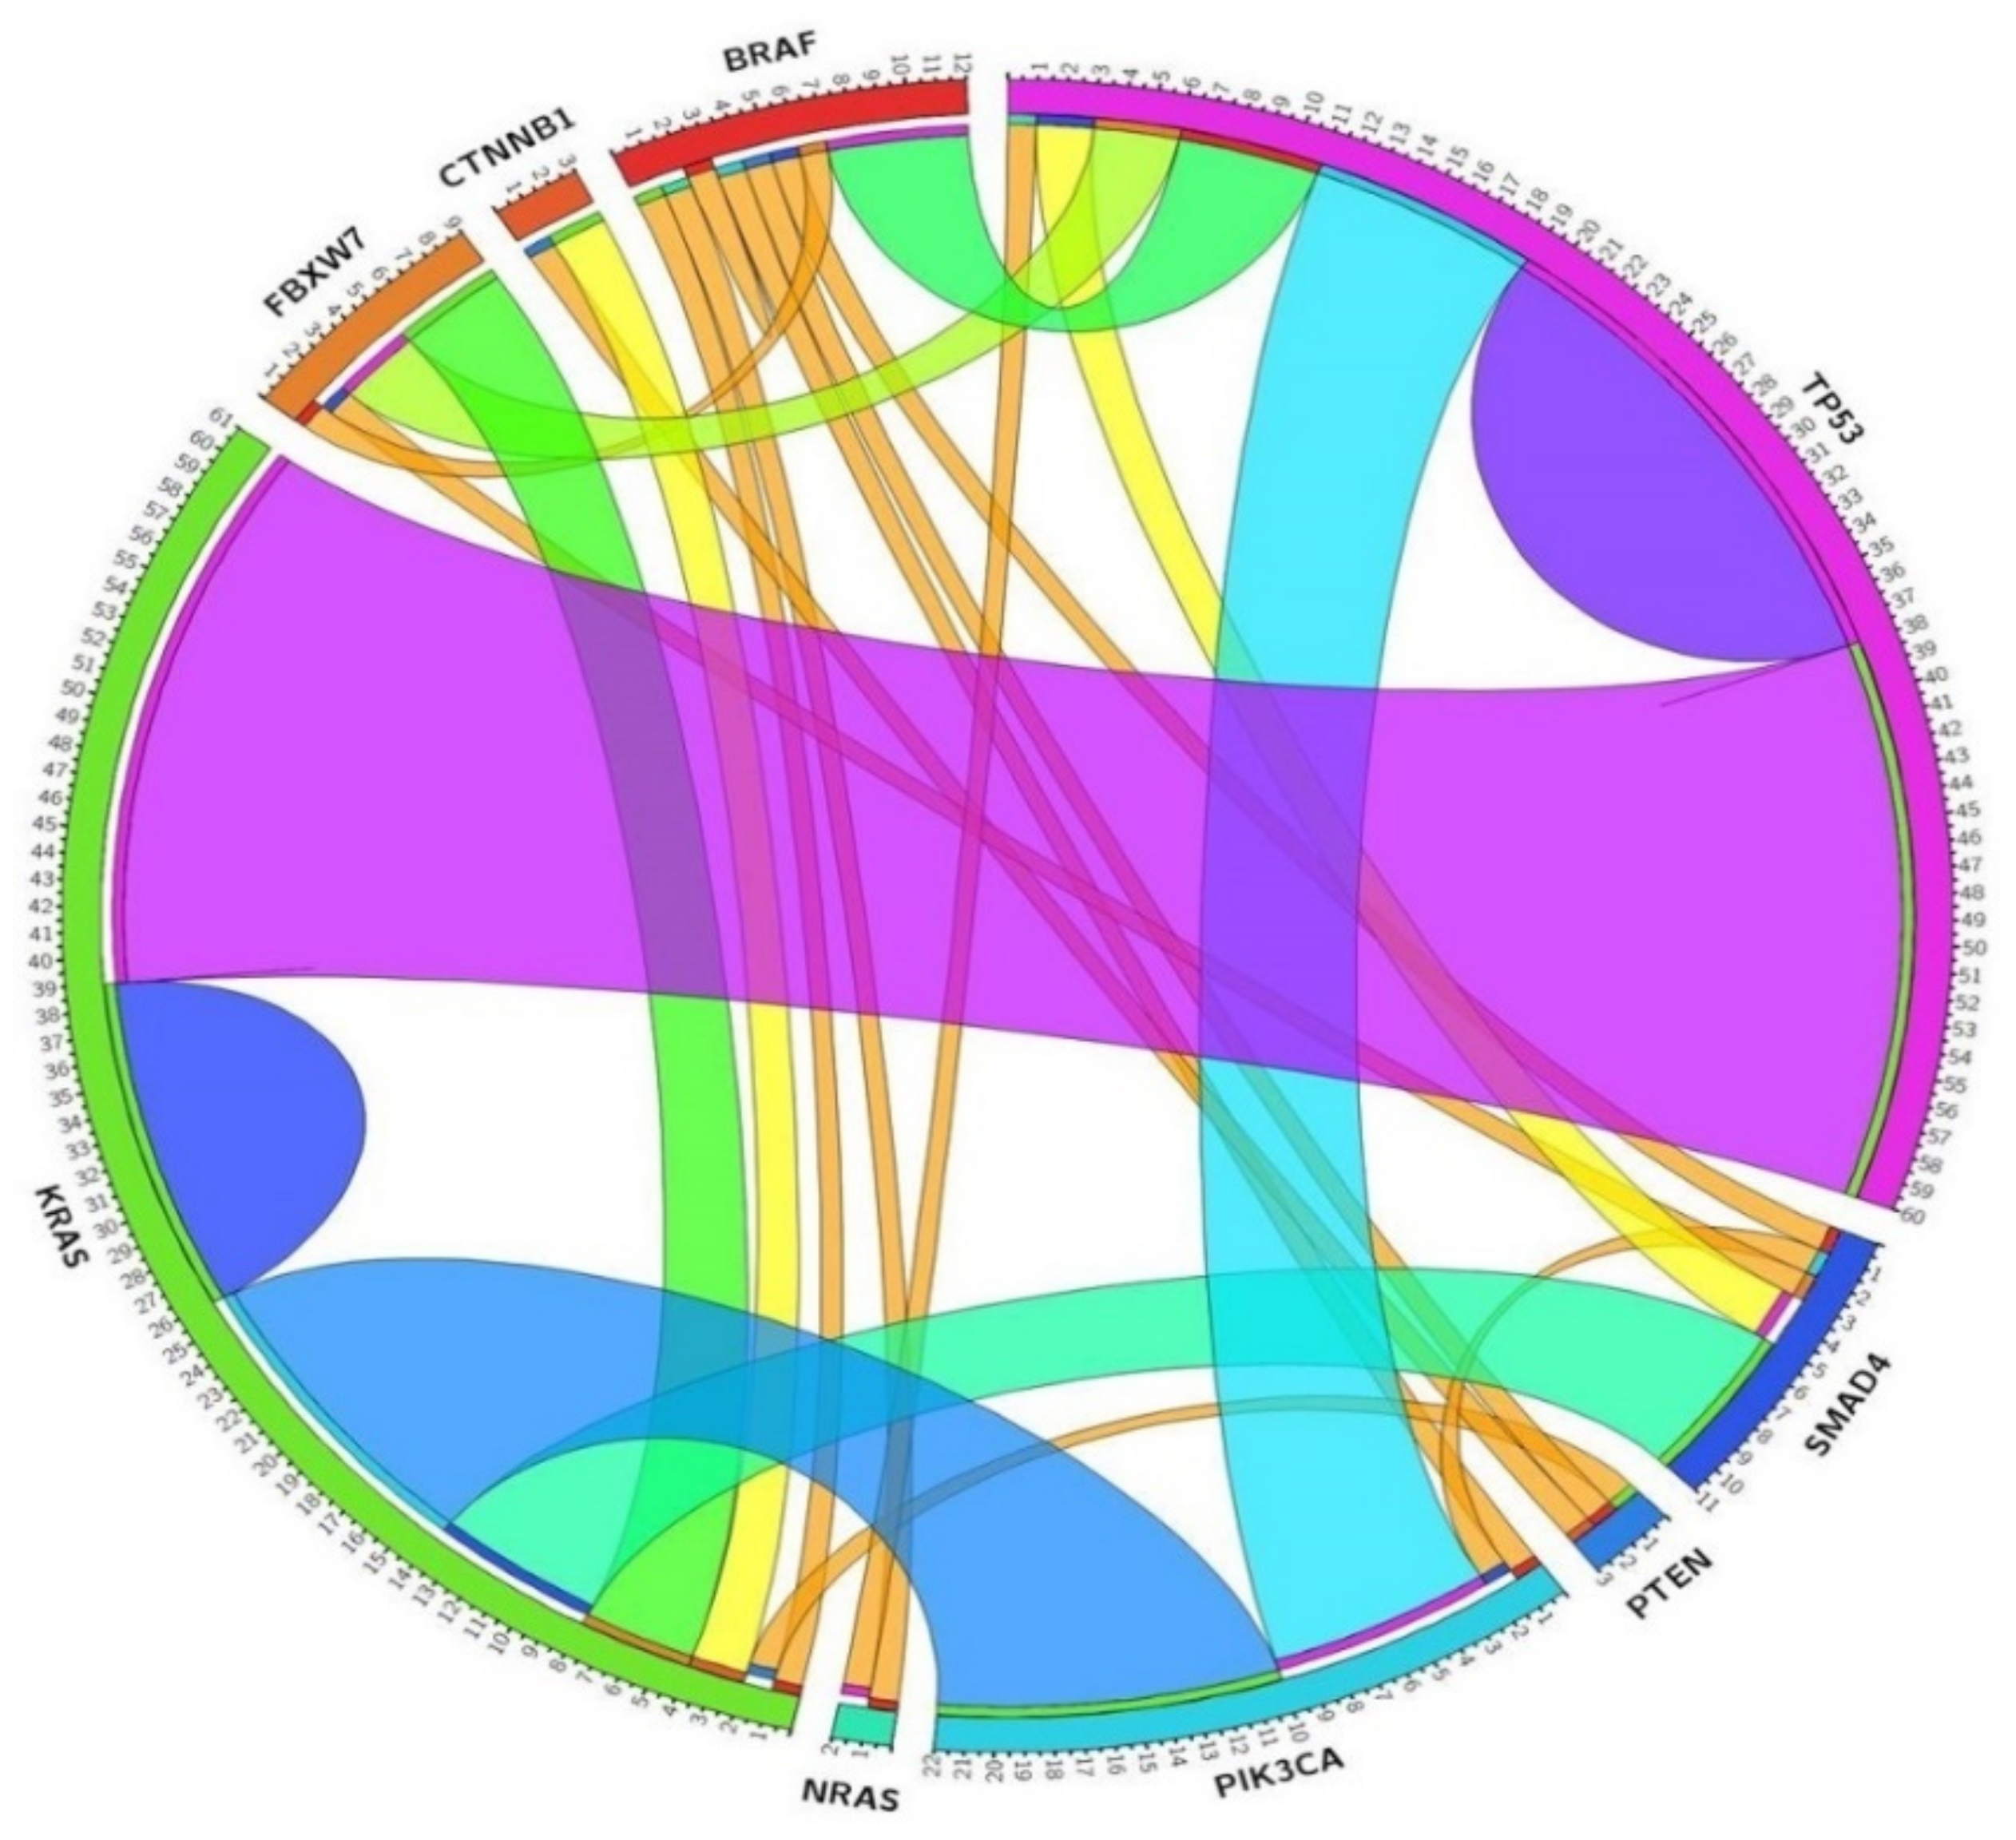
2.2.2. Concurrent Molecular Alterations

Thirty-five NSCLC patients harbored co-occurring mutations. One patient carried an indel in EGFR exon 19 accompanied by KRAS codon 12 mutation. Three EGFR mutations and one exon 19 deletion appeared in concurrency with TP53 mutations. Two EGFR mutated patients also presented PIK3CA mutations; and one harbored a double EGFR codon 18 mutation in concurrency with CTNNB1 mutation. Among the 31 KRAS mutated samples, two were in concurrency with BRAF mutations; one carried also a mutation in ERBB2 and one sample harbored double KRAS mutations. One sample carrying a NRAS mutation also presented a TP53 frameshift mutation. PIK3CA mutations were found to be concurrent with EGFR, BRAF, TP53 mutations or ALK fusion. We identified two samples with three concurrent mutations. In one sample we identified mutations in PIK3CA, CTNNB1 and TP53. Another patient carried mutations in KRAS, STK11 and TP53. Moreover, one sample harbored four concurrent mutations in PIK3CA, BRAF, FBXW7 and TP53 (Figure 2, Table S1).
Fifty mCRC patients harbored concurrent mutations. KRAS mutations were found to be concomitant with TP53 (n = 11), PIK3CA (n = 5), SMAD4 (n = 3) and FBXW7 (n = 1), CTNNB1 (n = 1) and AKT (n = 1). BRAF p.Val600Glu mutation was found in concurrency with TP53 (n = 3), PTEN (n = 1), PIK3CA (n = 1) and SMAD4 (n = 1). NRAS and PIK3CA were concomitant in one sample. Fifteen patients carried three concurrent mutations, KRAS-PIK3CA-TP53 being the most frequent combination (n = 5). Interestingly, one patient harbored concurrent mutations in KRAS, BRAF and TP53 and other carried mutations in NRAS, BRAF and TP53. One patient carried four concurrent mutations in KRAS, SMAD4, FBXW7 and TP53 (Figure 3, Table S2).

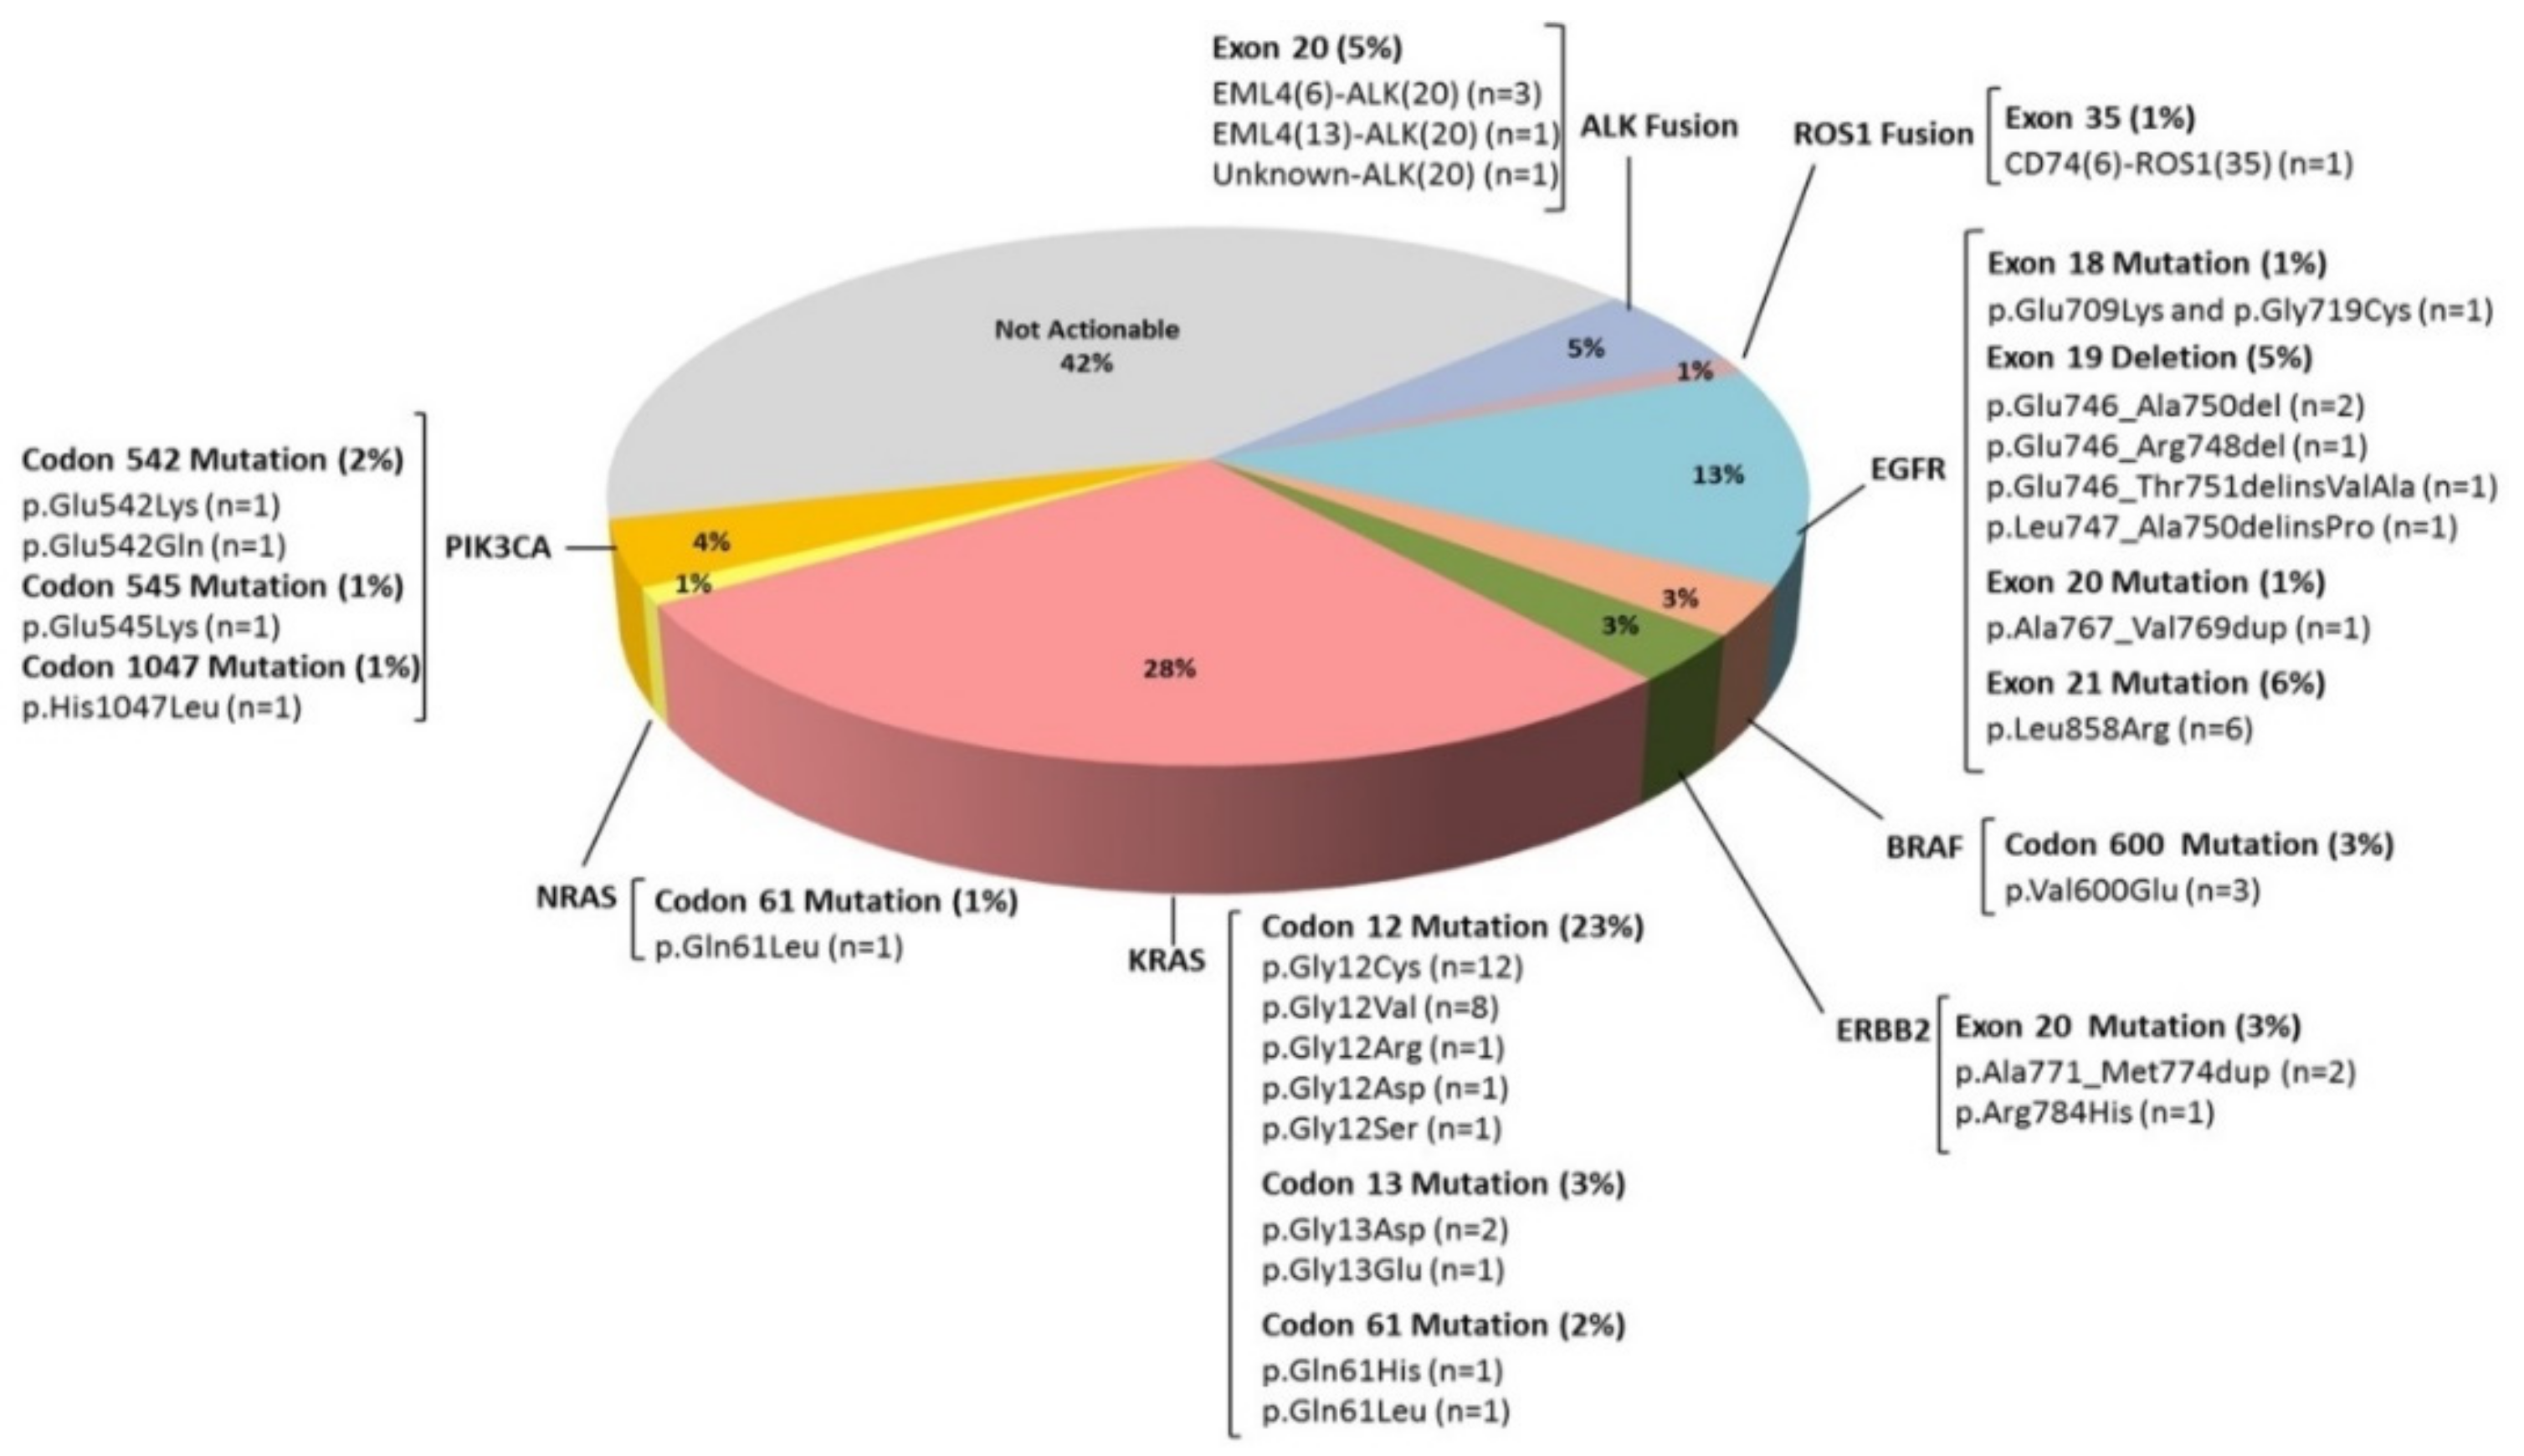
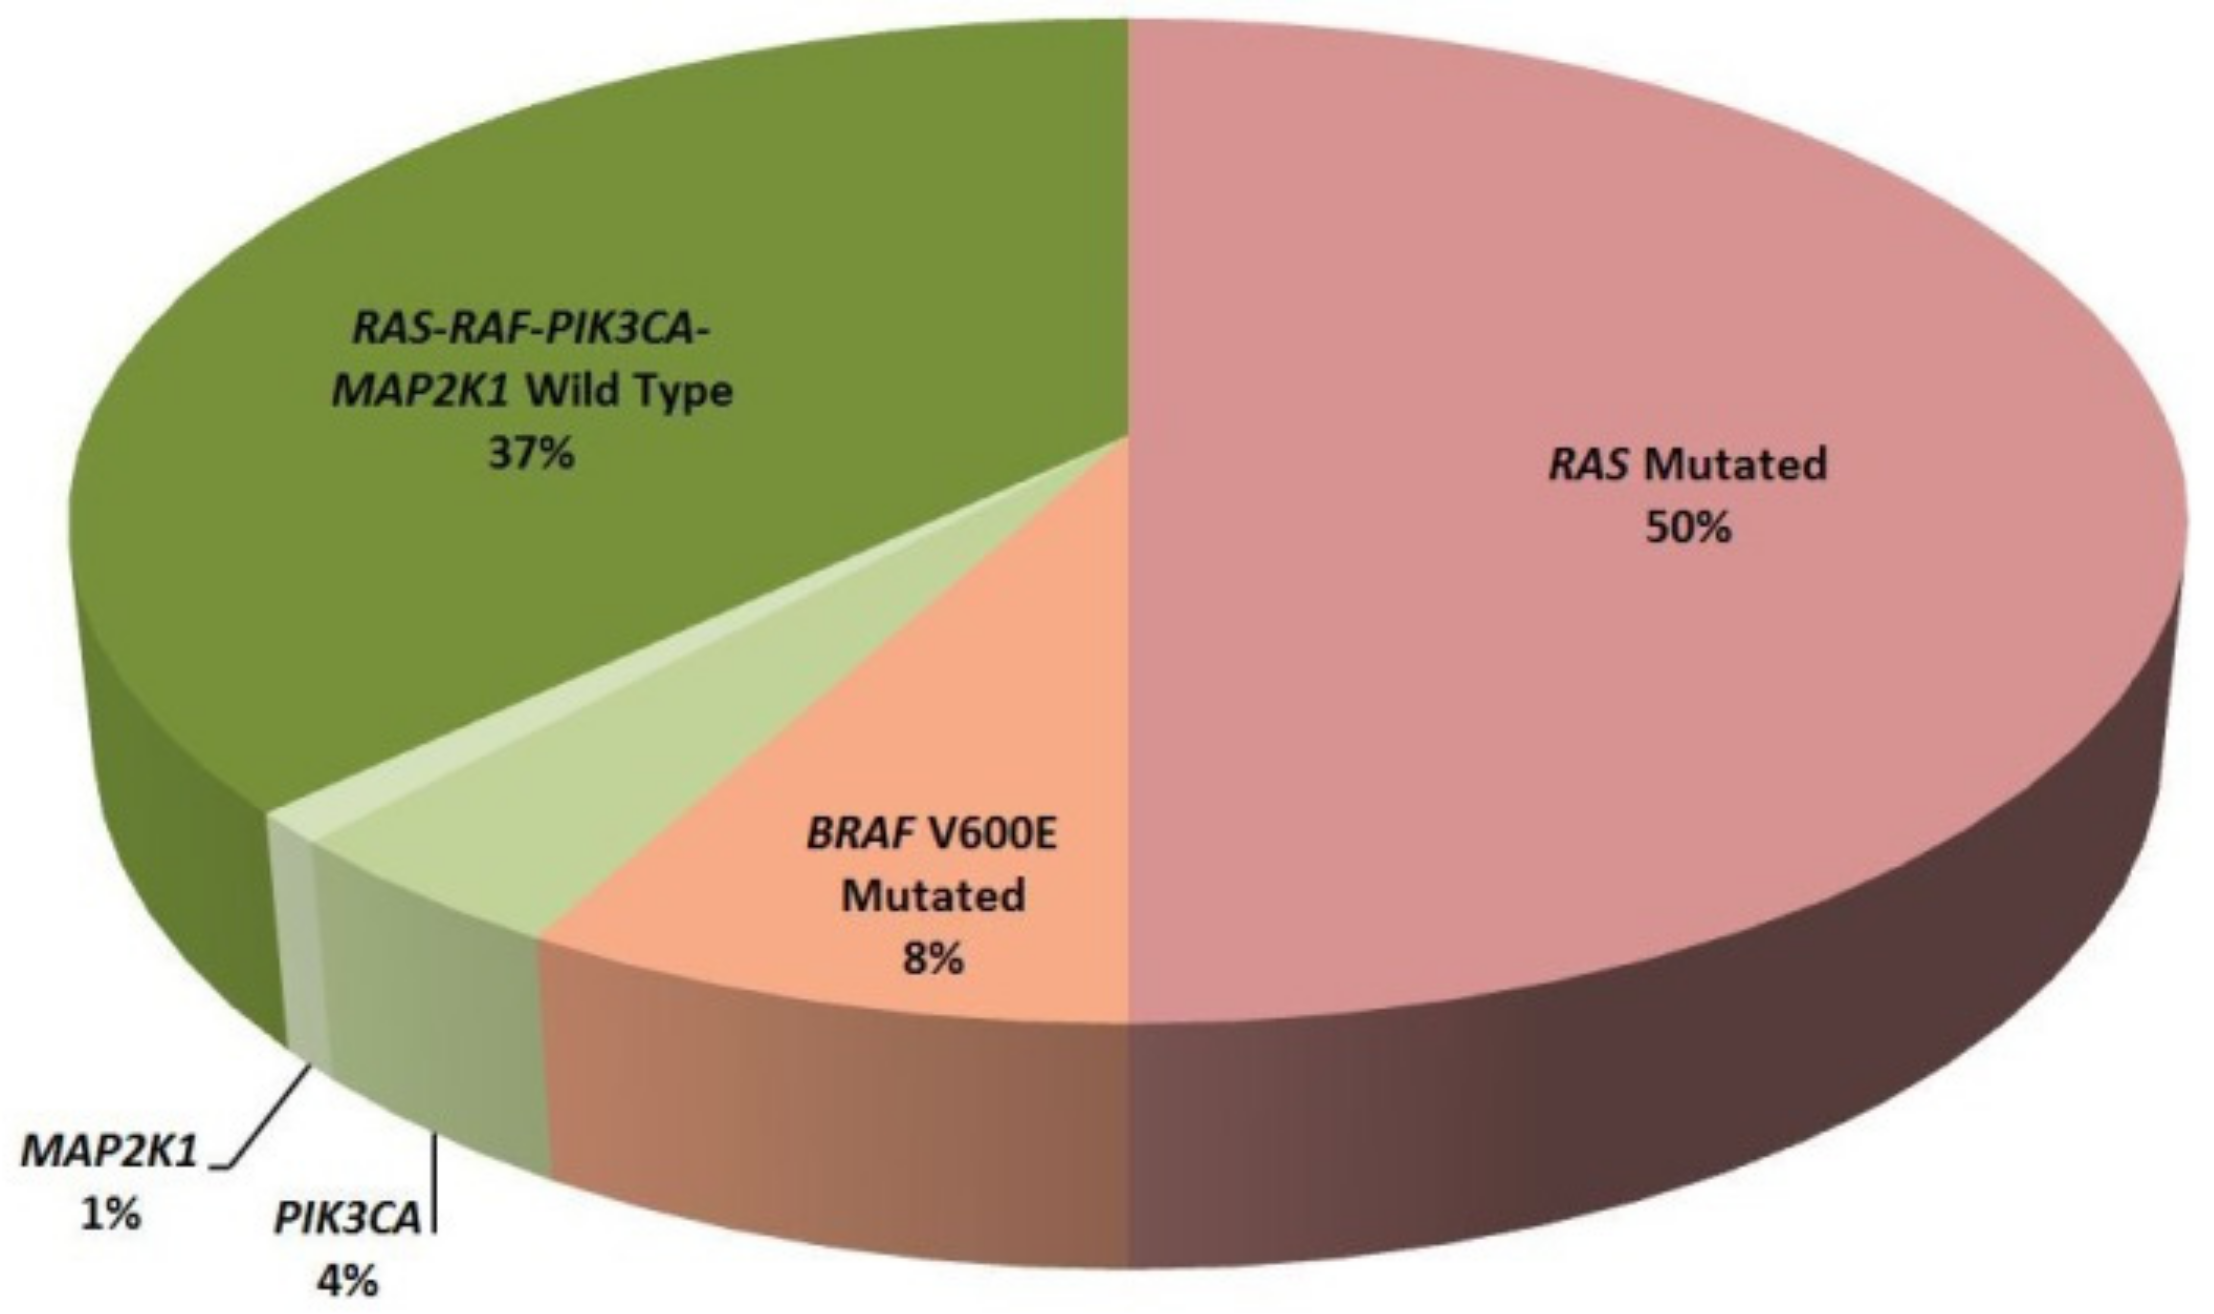
2.2.3. Clinically Relevant Genetic Variants

NGS identified actionable genomic alterations in 58% of NSCLC patients (Figure 4). The most prevalent changes detected in EGFR were exon 21 mutations (6%) followed by exon 19 alterations (5%). Codon 12 was the most frequently mutated in KRAS (23%) followed by codon 13 (3%) and codon 61 (2%). In NRAS only codon 61 was found mutated (1%). Regarding BRAF, three out eleven detected mutations occurred on the hotspot Val600. In regard to PIK3CA, codon 542 mutations were the most frequent (2%) followed by mutations in codons 545 and 1047 (1% for both). Duplication in exon 20 (p.Ala771_Met774dup; 2%) and the hotspot mutation p.Arg784His (1%) were found in ERBB2. Four patients showed fusions between ALK and EML4, in all of them, the rearrangement involved exon 20 of ALK, in three patients with exon 6 of EML4 and in other with exon 13. One patient showed a fusion of ALK with an unknown partner. Finally, one patient presented a fusion between ROS1 (exon 35) and CD74 (exon 6).
Regarding targeted therapy in mCRC patients, 50% of patients harbored RAS mutations as a primary resistance mechanism to anti-EGFR therapies. Additionally, in the RAS wild type patients, NGS identified eight BRAF V600E mutated patients, five PIK3CA mutated patients and one patient harboring p.Lys57Asn in MAP2K1 gene (Figure 5).

3. Discussion

NGS has emerged as a promising strategy to achieve precision medicine [16,17]. These approaches are able to identify multiple cancer genes simultaneously with low sample requirement, reducing sequencing costs and molecular diagnostics turn-around time. However, the integration a high-throughput technology into clinical routine practice of a public health system represents a major challenge. Laboratories performing clinically-relevant tests must improve their quality and competence [18] and for this purpose, accreditation and participation in External Quality Assessment (EQA) programs are strongly recommended [19].
In this study, we show that NGS technology is able to efficiently amplify and sequence multiple genes using only 10 ng of DNA or RNA obtained from FFPE samples. The quality metrics analysis revealed excellent read depth and coverage for all the targeted regions, allowing confident somatic variant detection [20]. These results technically validate the NGS assay and grant the identification of low VAF variants. The invalid test rate obtained (3.8%) is concordant with previously reported studies in FFPE samples [21,22].
In particular, these panels were able to confidently detect variants at <5% VAF, which can be relevant, in challenging, low tumor percentage FFPE samples. Therefore, and taking into account that current recommendations of NGS studies in FFPE samples propose not reporting variants with a VAF lower than 5% [23,24] (unless they have an important therapeutic or prognostic impact) we established this value as a threshold for reporting variants.
Moreover, we found an excellent correlation between NGS and single-gene conventional methods. The analysis of discordant results revealed that NGS is a more robust method compared with conventional approaches. Concerning EGFR mutations, one patient reported as positive with Cobas® assay and negative by NGS also carried a homozygous and synonymous variant near codon 790 (p.Gln787Gln). However, since both NGS and SS did not detect this mutation, we hypothesize that the synonymous variant could affect primer or probe hybridization of the Cobas® assay, resulting in a false positive detection of the p.Thr790Met mutation. In KRAS testing, we found seven discordant cases. Two samples resulted positive by RT-qPCR assay but were not detected by NGS. These samples were re-tested using a new lot of the AmoyDx assay, providing then concordant results with the NGS assay. Among the five negative samples for KRAS mutations by RT-qPCR, NGS reported mutations at low VAF in two cases (3.9% and 5.0%, respectively). In theory, these VAFs should be detected by the AmoyDx assay, which has a limit of detection (LOD) of 1–2%, established by using cell line DNA. However, we suspect this LOD could be higher when using highly degraded DNA obtained from FFPE samples. In the three remaining cases, NGS revealed KRAS mutations at high VAF (12%, 12% and 20%), which could be confirmed by SS. Moreover, these samples were re-tested by a technician in another institution, showing concordant results with the NGS assay. For BRAF p.Val600Glu mutation, NGS revealed two mutated samples with VAF of 4% and 5%, not detected by HRM (LOD = 10%). Regarding fusion transcripts, an OncoNetwork collaborative research study was able to detect EML4/ALK fusion up to 1% dilution [25]. In our cohort, we detected five fusions by NGS, of which one was not detected by IHQ nor FISH (53 nuclei counts). Our results are in agreement with Velizheva et al., who conclude that targeted NGS is a more robust and reliable method for fusion detection, especially in borderline cases, compared to single target assays such as FISH [26]. Taken together, NGS has proven to be a valid alternative to conventional molecular testing in terms of diagnostic accuracy [27].
TAT and economic costs are essential for NGS implementation in routine molecular diagnostics in a public healthcare hospital. Here, we found a great economic benefit in the employment of NGS technology versus conventional methodologies when it came to wild type KRAS mCRC patients. In KRAS mutated patients this benefit is not observed, however, a complete NGS test is achieved with a €30 difference per sample, therefore being an economically sustainable approach. In NSCLC, the extra cost associated with NGS studies (€51.5/patient) can be assumed based on the ability to identify actionable alterations with significant impact on patients’ outcome.
The NGS approach described in this study requires a manual library and template preparation (emulsion PCR, enrichment and chip loading). Consequently, hands-on time is clearly higher than conventional studies in both NSCLC and mCRC samples. However, the development of new automatized devices for library and template preparation has drastically reduced hands-on time to approximately 1 hour, making NGS implementation in terms of technical staff much easier. Global time duration of NGS studies has also been higher than conventional approaches in NSCLC (5 versus 3 working days) and in mCRC (5 versus 3–4 working days depending on KRAS mutational status). This delay in molecular studies should not be an important limitation of NGS implementation because of its ability to identify clinically relevant alterations beyond the routinely tested genes. Moreover, the coexistence of both strategies may allow the choice of a faster conventional strategy when needed, especially in patients whose clinical situation requires a molecular result in a short period of time.
The implementation of this workflow in diagnostics routine was our first experience with NGS which allowed us to acquire a great expertise in amplicon-based NGS approaches. This has permitted us improve and optimized the process by implementing more complex gene panels (such as Oncomine Focus Assay, able to detect hotspot mutations in 35 genes, copy number variation in 19 genes and fusion transcripts of 23 driver genes) and automatizing the process (IonChef Instrument). Moreover, the development of new and faster sequencers (Ion S5 Instrument) is able to reduce global time duration to 4 days. However, it is important to acknowledge that NGS is economically sustainable when the appropriate number of samples is studied in the same experiment. In this sense, and according to the number of samples received for NGS studies, we are reporting NGS results under routine laboratory conditions in approximately 10–15 working days, as recommended [28,29,30].
The major advantage of the NGS approach is to provide information about potential therapeutic targets to improve clinical outcomes of patients with advanced cancer. Multiple biomarker testing has become a major challenge for molecular diagnostic laboratories because of the increasing number of approved targeted therapies and clinical trials. In this scenario NGS has been postulated as a technology with clinical applicability able to provide an exhaustive molecular profiling, deciphering tumoral heterogeneity that can in certain cases have a prognostic value and/or explain treatment resistance [31].
The mutation prevalence identified in our study for NSCLC and mCRC samples is concordant with previously published studies [32,33,34]. Exhaustive molecular profiling can provide relevant information for a patient’s clinical management. In our study, 58% of NSCLC patients harbored a potential clinically-actionable alteration, confirming the applicability of these studies for candidate selection. Regarding mCRC, in RAS wild type patients (n = 50) NGS identified four patients with mutated PIK3CA. Response to anti-EGFR treatment in these patients is still controversial [35] although RAS-RAF and PIK3CA wild-type patients seem to have better responses [36]. Moreover, one patient harbored the p.Lys57Asn mutation in MAP2K1 that has been described as a primary resistance mechanism to anti-EGFR treatment [37]. Taken together NGS identified 49% of patients without resistance mechanisms to this targeted therapy.
Concurrent mutations have been detected in 35% of NSCLC patients and in 50% of mCRC patients revealing tumor biology complexity. Although there are no well-established molecular prognostic factors neither in NSCLC nor mCRC certain passenger mutations may be associated with an adverse prognosis. In this sense, TP53 [38] or STK11 in concomitancy with KRAS mutations [39] have been associated with a worse prognosis in NSCLC. In mCRC, TP53 [40] or SMAD4 [41] mutations have been related to a worse response to anti-EGFR therapy and FBXW7 [42] has recently been described as a strong worse prognostic factor.

4. Materials and Methods

4.1. Patients and Samples

The study included a series of 106 advanced NSCLC (stages III–IV) and 102 mCRC (stage IV) patients diagnosed in the Department of Medical Oncology at the University Hospital La Fe (Valencia, Spain) from 2015 to 2017. The epidemiological, clinical and pathological features of these patients are summarized in Table 3. All patients showed their agreement by signing the informed consent elaborated in accordance with the recommendations of the Declaration of Human Rights, the Conference of Helsinki [43] and the study was approved by the Hospital Ethics Committee (2015/0713; 16 February 2016, 2015/0096; 15 July 2016 2017/0070 29 March 2017), Tissue samples were examined in the Department of Pathology and only those with at least 150 total cells and 20% of tumor content were considered valid for molecular analysis. Two reference standard DNA samples provided by the European Molecular Genetics Quality Network (EMQN) were also used as positive controls.

4.2. DNA and RNA Preparation

Genomic DNA was isolated from three 5 μm thick FFPE sections using Deparaffinization Solution and the GeneRead DNA FFPE Kit (Qiagen, Hilden, Germany). RNA was extracted from three 15 μm thick FFPE sections employing the RecoverAllTM Total Nucleic Acid Isolation Kit (ThermoFisher Scientific, Waltham, MA, USA). DNA and RNA concentration was assessed using Qubit 3.0 fluorometer with DNA HS or RNA HS Assay Kit (ThermoFisher Scientific).

4.3. Molecular Analysis by Next Generation Sequencing

Molecular analysis was performed at the Molecular Biology Unit (University Hospital la Fe) using Conformité Européenne-In vitro diagnostic (CE-IVD) approved kits and workflows.

4.3.1. Next Generation Sequencing Panels

Oncomine Solid Tumor DNA kit (OST-DNA; ThermoFisher Scientific) was used for mutation detection in 22 genes involved in colon and lung cancer (AKT1 (NM_001014431.1), ALK (NM_004304.4), BRAF (NM_004333.4), CTNNB1 (NM_001904.3), DDR2 (NM_006182.2), EGFR (NM_005228.3), ERBB2 (NM_004448.3), ERBB4 (NM_005235.2), FBXW7 (NM_033632.3), FGFR1 (NM_001174067.1), FGFR2 (NM_022970.3), FGFR3 (NM_001163213.1), KRAS (NM_033360.3), MAP2K1 (NM_002755.3), MET (NM_001127500.1), NOTCH1 (NM_017617.3), NRAS (NM_002524.4), PIK3CA (NM_006218.2), PTEN (NM_000314.4), SMAD4 (NM_005359.5), STK11 (NM_000455.4), TP53 (NM_000546.5)). The design includes 92 amplicons. For RNA sequencing of NSCLC samples, we used Oncomine Solid Tumor Fusion Transcript kit (OST-RNA; ThermoFisher Scientific), that allows the detection of fusion transcripts involving ALK, RET, ROS1 and NTRK1 genes with 85 amplicons. All NGS studies were conducted with the Ion Torrent Personal Genome Machine (PGM) technology (ThermoFisher Scientific).

4.3.2. Ion Torrent Library Preparation

For DNA libraries preparation, multiplex PCR was performed on 10 ng of DNA. After primer digestion and barcode ligation, library fragments were purified with Agencourt® AMPure® XP (Beckman Coulter, Brea, CA, USA). Finally, quantification and dilution (100 pM) of the amplified libraries was performed using the Ion Library Equalizer Kit (ThermoFisher Scientific) as described by the manufacturer.
RNA libraries preparation included a previous cDNA synthesis step from 10 ng of RNA using the SuperScript kit VILO cDNA synthesis kit (ThermoFisher Scientific). In this case, a multiplex PCR amplification of cDNA was performed. Library quantification was carried out by qPCR, inferring the concentration from a standard curve generated with Ion Library Quantification Kit (ThermoFisher Scientific). RNA libraries were diluted to a concentration of 100 pM.
In NSCLC, DNA and RNA libraries from eight patients were combined in a 4:1 proportion, generating the library pool. In mCRC samples, 10 DNA libraries were combined in equal proportion.

4.3.3. Clonal Amplification and DNA Sequencing

The library pool was clonally amplified in an emulsion PCR reaction using Ion Sphere Particles (ISPs) in the One Touch 2 Instrument. Subsequently, template-positive ISPs were enriched using the Ion One Touch ES with the Ion PGM Hi-Q OT2 kit following manufacturer´s protocol. Enriched template-positive ISPs were subjected to sequencing on the Ion Torrent Personal Genome Machine (PGM) on a 318v2 Ion Chip using Ion PGM Sequencing Hi-Q kit (all kits from ThermoFisher Scientific).

4.3.4. Base Calling, Variant Annotation and Prediction Tools Analysis

Raw data processing and alignment to the hg19 human reference genome was performed with Torrent Suite v5.6. Aligned sequences (Binary Alignment Map (BAM) files) were automatically transferred to the Ion Reporter Software (v5.6) to perform variant calling/annotation by using commercial workflows. Intronic variants and synonymous changes were filtered out. Variants with low total read depth (<500 total) and/or low variant read depth (<20 reads) were excluded. Additionally, Variants were visually examined using the Integrative Genomics Viewer (IGV) software (v.2.4). Subsequently, sequence variation databases such as Catalogue of Somatic Mutations in Cancer (COSMIC) [44], VarSome [45], The 1000 Genomes Project [46] and Single Nucleotide Polymorphism Database (dbSNPs) [47] were used to assess the pathogenicity of the detected variants. In variants with unknown significance, prediction tools like Provean [48], Sorting intolerant from tolerant (SIFT) [49] and PolyPhen-2 [50] were used in order to predict the effect of the amino acid substitution on the protein structure and function.

4.4. Experimental Verification

Verification instead of a full validation analysis was performed according to our national accreditation body (ENAC; Entidad Nacional de Acreditación), since the OST-DNA and OST-RNA kits are CE-IVD approved. The performance of NGS testing was extensively evaluated on different aspects. Firstly, we used well-characterized reference material to assess the presence or absence of somatic variants (point mutation and small insertions/deletions) and their allele frequencies. Secondly, we considered the pre-analytical conditions and assessed the quality of NGS analysis on determining FFPE samples as start material, allowing us to establish the sequencing quality metrics. Thirdly, diagnostic sensitivity and specificity were determined experimentally by comparing it with conventional methods for routinely tested alterations; additionally, clinical reporting was adapted according to international diagnostic standards and professional guidelines. Finally, to ensure a consistent high standard of performance, it was essential to establish an EQA program to monitor the quality of NGS testing in clinical practice and to propose corrective actions when needed.

4.4.1. Low Frequency Variant Detection

To evaluate the performance of the NGS assay for low frequency variant (<5%) detection we used reference materials provided by the European Molecular Genetics Quality Network (EMQN) in the External Quality Assessment Scheme for Oncogene Panel Testing (2017 and 2018). One of the reference materials used harbored the EGFR hotspot mutation p.Leu858Arg (VAF:3%), the EGFR deletion p.Glu746_Ala750del (VAF:2%) and the resistance hotspot mutation p.Thr790Met (VAF:1%) and the other harbored the following low frequency variants: EGFR p.Leu858Arg (VAF:3%), p.Thr790Met (VAF:2%), KRAS p.Gly13Asp (VAF:3%) and PIK3CA p.His1047Arg (VAF:3%). All described variants had previously been validated by ddPCR.

4.4.2. Next Generation Sequencing Metrics

The number of reads, mean depth, “on-target” reads and uniformity were the parameters used as quality control check points for further sample analysis. A total number of reads higher than 100,000 together with “on-target” and uniformity values >80% were required for each DNA library and 20,000 total reads for each RNA library.

4.4.3. Assessment of the Diagnostic Sensitivity and Specificity of the NGS Assay

Detected missense mutations in EGFR, NRAS, KRAS and BRAF genes, as well as ALK and ROS1 genes rearrangements were tested by conventional methods. EGFR mutations were validated by Cobas® EGFR Mutation Test v2 (CE-IVD) (Roche Diagnostics, Basel, Switzerland); NRAS and KRAS mutations were confirmed by Real Time (RT)-qPCR using AmoyDx® KRAS Mutation Detection Kit and AmoyDx® NRAS Mutation Detection Kit (AmoyDx, Xiamen, China); BRAF mutations were validated by High Resolution Melting (HRM) as previously described [51]. ALK and ROS1 rearrangements were studied by immunohistochemistry (IHQ) employing VENTANA ALK (D5F3) CDx Assay (Roche Diagnostics, Basel, Switzerland) and IHQ ROS1 Clon D4D6 (Cell Signaling Technology, Danvers, MA, USA), respectively. Positive IHQ assays were confirmed by fluorescence in situ hybridization (FISH) employing Vysis ALK Break Apart FISH Probe Kit (Abbott Laboratories, Chicago, Illinois, USA) and Vysis 6q22 ROS1 Break Apart FISH Probe Kit (Abbott Laboratories), respectively.

4.4.4. External Quality Assessment (EQA) Program

To ensure a consistent high standard of performance, this assay was externally validated by the participation in the EMQN External Quality Assessment Scheme for Oncogene Panel Testing (2017/2018).

4.5. Statistics

Quantitative variables were summarized by their mean and standard deviation, and categorical variables by absolute frequencies.

5. Conclusions

NGS is a technology able to assess multiple genetic biomarkers that has demonstrated a great concordance with conventional single target assays, providing an exhaustive molecular profiling of clinically relevant alterations at reasonable costs and turnaround times. The implementation of NGS in the diagnostic routine under the scope of UNE-EN ISO 15189:2013 accreditation has provided relevant information for patients’ clinical management, improving the molecular diagnostic in our center.

Supplementary Materials

The following are available online at https://www.mdpi.com/2072-6694/11/8/1196/s1, Figure S1: NGS quality metrics, Table S1: Pathogenic variants detected in NSCLC patients, Table S2: Pathogenic variants detected in mCRC patients.

Author Contributions

Conceptualization, J.S., R.M. and S.P.; Funding acquisition, S.P.; Investigation, J.S., R.M. and S.P.; Methodology, J.S., R.M., G.P.-S., N.M., D.R. and S.P.; Resources, B.L., E.C., E.A., J.G.-C., J.A., C.S. and Ó.J.; Supervision, S.P.; Writing—original draft, J.S. and R.M.; Writing—review and editing, M.L., I.d.J., E.B. and S.P.

Funding

This research was funded by: Ministerio de Economía, Industria y Competitividad, Programa Estatal de I+D+i Orientada a los Retos de la Sociedad, Convocatoria Retos-Colaboración 2015, grant number (RTC-2015-3625-1). Roche Diagnostics, grant number (IISLaFe 2017/0070-IISLaFe 2015/0713) and Consellería de Educación, Investigación, Cultura y Deporte de la Comunidad Valenciana (J.S.) (ACIF/2018/258).

Acknowledgments

We thank Amparo Compañ-Quilis (Department of Pathology, University Clinic Hospital, 46010 Valencia, Spain) for her collaboration in the preliminary phases of the research.

Conflicts of Interest

The authors declare no conflict of interest. The funders had no role in the design of the study; in the collection, analyses, or interpretation of data; in the writing of the manuscript, or in the decision to publish the results.

References

  1. Cagle, P.T.; Chirieac, L.R. Advances in treatment of lung cancer with targeted therapy. Arch. Pathol. Lab. Med. 2012, 136, 504–599. [Google Scholar] [CrossRef] [PubMed]
  2. Xue, Y.; Wilcox, W.R. Changing paradigm of cancer therapy: Precision medicine by next-generation sequencing. Cancer Biol. Med. 2016, 13, 12–18. [Google Scholar] [CrossRef] [PubMed]
  3. Pannuti, A.; Filipovic, A.; Hicks, C.; Lefkowitz, E.; Ptacek, T.; Stebbing, J.; Miele, L. Novel putative drivers revealed by targeted exome sequencing of advanced solid tumors. PLoS ONE 2018, 13, 1–19. [Google Scholar] [CrossRef] [PubMed]
  4. Illei, P.B.; Belchis, D.; Tseng, L.H.; Nguyen, D.; De Marchi, F.; Haley, L.; Riel, S.; Beierl, K.; Zheng, G.; Brahmer, J.R.; et al. Clinical mutational profiling of 1006 lung cancers by next generation sequencing. Oncotarget 2017, 20, 96684–96696. [Google Scholar] [CrossRef] [PubMed]
  5. D’Haene, N.; Fontanges, Q.; De Nève, N.; Blanchard, O.; Melendez, B.; Delos, M.; Dehou, M.F.; Maris, C.; Nagy, N.; Rousseau, E.; et al. Clinical application of targeted next-generation sequencing for colorectal cancer patients: A multicentric Belgian experience. Oncotarget 2018, 17, 20761–20768. [Google Scholar] [CrossRef] [PubMed]
  6. Zhang, J.; Späth, S.S.; Marjani, S.L.; Zhang, W.; Pan, X. Characterization of cancer genomic heterogeneity by next-generation sequencing advances precision medicine in cancer treatment. Precis. Clin. Med. 2018, 1, 29–48. [Google Scholar] [CrossRef] [Green Version]
  7. Lindeman, N.I.; Cagle, P.T.; Aisner, D.L.; Arcila, M.E.; Beasley, M.B.; Bernicker, E.H.; Colasacco, C.; Dacic, S.; Hirsch, F.R.; Kerr, K.; et al. Updated Molecular Testing Guideline for the Selection of Lung Cancer Patients for Treatment With Targeted Tyrosine Kinase Inhibitors: Guideline From the College of American Pathologists, the International Association for the Study of Lung Cancer, and the Association for Molecular Pathology. Arch. Pathol. Lab. Med. 2018, 142, 321–346. [Google Scholar] [CrossRef]
  8. Jennings, L.J.; Arcila, M.E.; Corless, C.; Kamel-Reid, S.; Lubin, I.M.; Pfeifer, J.; Temple-Smolkin, R.L.; Voelkerding, K.V.; Nikiforova, M.N. Guidelines for validation of Next-generation sequencing-based oncology panels: A joint consensus recommendation of the association for Molecular Pathology and College of American Pathologists. J. Mol. Diagn. 2017, 19, 341–365. [Google Scholar] [CrossRef]
  9. Sepulveda, A.R.; Hamilton, S.R.; Allegra, C.J.; Grody, W.; Cushman-Vokoun, A.M.; Funkhouser, W.K.; Kopetz, S.E.; Lieu, C.; Lindor, N.M.; Minsky, B.D.; et al. Molecular Biomarkers for the Evaluation of Colorectal Cancer: Guideline From the American Society for Clinical Pathology, College of American Pathologists, Association for Molecular Pathology, and the American Society of Clinical Oncology. J. Clin. Oncol. 2017, 1, 1453–1486. [Google Scholar] [CrossRef]
  10. D’Haene, N.; Le Mercier, M.; De Nève, N.; Blanchard, O.; Delaunoy, M.; El Housni, H.; Dessars, B.; Heimann, P.; Remmelink, M.; Demetter, P.; et al. Clinical validation of targeted next generation sequencing for colon and lung cancers. PLoS ONE 2015, 10, 1–13. [Google Scholar] [CrossRef]
  11. Benson, A.B.; Venook, A.P.; Al-Hawary, M.M.; Cederquist, L.; Chen, Y.J.; Ciombor, K.K.; Cohen, S.; Cooper, H.S.; Deming, D.; Engstrom, P.F.; et al. NCCN Guidelines Insights: Colon Cancer, Version 2.2018. J. Natl. Compr. Canc. Netw. 2018, 16, 359–369. [Google Scholar] [CrossRef] [PubMed]
  12. Planchard, D.; Popat, S.; Kerr, K.; Novello, S.; Smit, E.F.; Faivre-Finn, C.; Mok, T.S.; Reck, M.; Van Schil, P.E.; Hellmann, M.D.; et al. Metastatic Non-Small Cell Lung Cancer: Esmo Clinical Practice Guidelines for Diagnosis, Treatment and Follow-Up. Ann. Oncol. 2018, 29, 192–237. [Google Scholar] [CrossRef] [PubMed]
  13. Van Cutsem, E.; Cervantes, A.; Adam, R.; Sobrero, A.; Van Krieken, J.H.; Aderka, D.; Aranda-Aguilar, E.; Bardelli, A.; Benson, A.; Bodoky, G.; et al. ESMO Consensus Guidelines for the Management of Patients with Metastatic Colorectal Cancer. Ann. Oncol. 2016, 27, 1386–1422. [Google Scholar] [CrossRef] [PubMed]
  14. Thelen, M.H.M.; Huisman, W. Harmonization of accreditation to ISO15189. Clin. Chem. Lab. Med. 2018, 10, 1637–1643. [Google Scholar] [CrossRef] [PubMed]
  15. European Molecular Genetics Quality Network (EMQN) Office. Available online: https://www.emqn.org/ (accessed on 15 July 2019).
  16. Biankin, A.V.; Piantadosi, S.; Hollingsworth, S.J. Patient-centric trials for therapeutic development in precision oncology. Nature 2015, 526, 361–370. [Google Scholar] [CrossRef] [Green Version]
  17. Friedman, A.A.; Letai, A.; Fisher, D.E.; Flaherty, K.T. Precision medicine for cancer with next-generation functional diagnostics. Nat. Rev. Cancer 2015, 15, 747–756. [Google Scholar] [CrossRef] [PubMed]
  18. Raymaekers, M.; Bakkus, M.; Boone, E.; de Rijke, B.; El Housni, H.; Descheemaeker, P.; De Schouwer, P.; Franke, S.; Hillen, F.; Nolet, F.; et al. Reflections and proposals to assure quality in molecular diagnostics. Acta. Clin. Belg. 2011, 66, 33–41. [Google Scholar] [CrossRef]
  19. Dubbink, H.J.; Deans, Z.C.; Tops, B.B.; van Kemenade, F.J.; Koljenović, S.; van Krieken, H.J.; Blokx, W.A.; Dinjens, W.N.; Groenen, P.J. Next generation diagnostic molecular pathology: Critical appraisal of quality assurance in Europe. Mol. Oncol. 2014, 8, 830–839. [Google Scholar] [CrossRef]
  20. Misyura, M.; Zhang, T.; Sukhai, M.A.; Thomas, M.; Garg, S.; Kamel-Reid, S.; Stockley, T.L. Comparison of Next-Generation Sequencing Panels and Platforms for Detection and Verification of Somatic Tumor Variants for Clinical Diagnostics. J. Mol. Diagn. 2016, 6, 842–850. [Google Scholar] [CrossRef]
  21. Hung, S.S.; Meissner, B.; Chavez, E.A.; Ben-Neriah, S.; Ennishi, D.; Jones, M.R.; Shulha, H.P.; Chan, F.C.; Boyle, M.; Kridel, R.; et al. Assessment of Capture and Amplicon-Based Approaches for the Development of a Targeted Next-Generation Sequencing Pipeline to Personalize Lymphoma Management. J. Mol. Diagn. 2018, 20, 203–214. [Google Scholar] [CrossRef] [Green Version]
  22. Wang, Y.; Liu, H.; Hou, Y.; Zhou, X.; Liang, L.; Zhang, Z.; Shi, H.; Xu, S.; Hu, P.; Zheng, Z.; et al. Performance validation of an amplicon-based targeted next-generation sequencing assay and mutation profiling of 648 Chinese colorectal cancer patients. Virchows Arch. 2018, 472, 959–968. [Google Scholar] [CrossRef] [PubMed]
  23. De Leng, W.W.; Gadellaa-van Hooijdonk, C.G.; Barendregt-Smouter, F.A.; Koudijs, M.J.; Nijman, I.; Hinrichs, J.W.; Cuppen, E.; van Lieshout, S.; Loberg, R.D.; de Jonge, M.; et al. Targeted Next Generation Sequencing as a Reliable Diagnostic Assay for the Detection of Somatic Mutations in Tumours Using Minimal DNA Amounts from Formalin Fixed Paraffin Embedded Material. PLoS ONE 2016, 26, 1–18. [Google Scholar] [CrossRef] [PubMed]
  24. Strom, S.P. Current practices and guidelines for clinical next-generation sequencing oncology testing. Cancer Biol. Med. 2016, 13, 3–11. [Google Scholar] [CrossRef] [PubMed] [Green Version]
  25. Magdaleno, S.M.; Cheng, A.; Petratroli, R.; Shelis, O.; Tops, B.; Le Corre, D.; Kurth, H.; Blons, H.; Amato, E.; Mafficini, A.; et al. Abstract 3575: The OncoNetwork Consortium: A global collaborative research study on the development and verification of an Ion AmpliSeq RNA gene lung fusion panel. Cancer Res. 2014, 74. [Google Scholar] [CrossRef]
  26. Velizheva, N.P.; Rechsteiner, M.P.; Valtcheva, N.; Freiberger, S.N.; Wong, C.E.; Vrugt, B.; Zhong, Q.; Wagner, U.; Moch, H.; Hillinger, S.; et al. Targeted next-generation-sequencing for reliable detection of targetable rearrangements in lung adenocarcinoma-a single center retrospective study. Pathol. Res. Pract. 2018, 214, 572–578. [Google Scholar] [CrossRef] [PubMed]
  27. Biswas, B. Clinical Performance Evaluation of Molecular Diagnostic Tests. J. Mol. Diagn. 2016, 18, 803–812. [Google Scholar] [CrossRef] [Green Version]
  28. Patel, K.P.; Ruiz-Cordero, R.; Chen, W.; Routbort, M.J.; Floyd, K.; Rodriguez, S.; Galbincea, J.; Barkoh, B.A.; Hatfield, D.; Khogeer, H.; et al. Ultra-Rapid Reporting of GENomic Targets (URGENTseq): Clinical Next-Generation Sequencing Results within 48 Hours of Sample Collection. J. Mol. Diagn. 2019, 21, 89–98. [Google Scholar] [CrossRef] [PubMed]
  29. Hamblin, A.; Wordsworth, S.; Fermont, J.M.; Page, S.; Kaur, K.; Camps, C.; Kaisaki, P.; Gupta, A.; Talbot, D.; Middleton, M.; et al. Clinical applicability and cost of a 46-gene panel for genomic analysis of solid tumours: Retrospective validation and prospective audit in the UK National Health Service. PLoS Med. 2017, 14, 1–26. [Google Scholar] [CrossRef]
  30. Hagemann, I.S.; Devarakonda, S.; Lockwood, C.M.; Spencer, D.H.; Guebert, K.; Bredemeyer, A.J.; Al-Kateb, H.; Nguyen, T.T.; Duncavage, E.J.; Cottrell, C.E.; et al. Clinical next-generation sequencing in patients with non-small cell lung cancer. Cancer 2015, 121, 631–639. [Google Scholar] [CrossRef]
  31. Burrell, R.A.; Swanton, C. Tumour heterogeneity and the evolution of polyclonal drug resistance. Mol. Oncol. 2014, 8, 1095–1111. [Google Scholar] [CrossRef]
  32. Cancer Genome Atlas Research Network. Comprehensive molecular profiling of lung adenocarcinoma. Nature 2014, 511, 543–550. [Google Scholar] [CrossRef]
  33. Peeters, M.; Kafatos, G.; Taylor, A.; Gastanaga, V.M.; Oliner, K.S.; Hechmati, G.; Terwey, J.H.; van Krieken, J.H. Prevalence of RAS mutations and individual variation patterns among patients with metastatic colorectal cancer: A pooled analysis of randomised controlled trials. Eur. J. Cancer 2015, 13, 1704–1713. [Google Scholar] [CrossRef] [PubMed]
  34. El-Deiry, W.S.; Vijayvergia, N.; Xiu, J.; Scicchitano, A.; Lim, B.; Yee, N.S.; Harvey, H.A.; Gatalica, Z.; Reddy, S. Molecular profiling of 6,892 colorectal cancer samples suggests different possible treatment options specific to metastatic sites. Cancer Biol. Ther. 2015, 16, 1726–1737. [Google Scholar] [CrossRef] [PubMed] [Green Version]
  35. Mei, Z.B.; Duan, C.Y.; Li, C.B.; Cui, L.; Ogino, S. Prognostic role of tumor PIK3CA mutation in colorectal cancer: A systematic review and meta-analysis. Ann. Oncol. 2016, 10, 1836–1848. [Google Scholar] [CrossRef] [PubMed]
  36. Guo, F.; Gong, H.; Zhao, H.; Chen, J.; Zhang, Y.; Zhang, L.; Shi, X.; Zhang, A.; Jin, H.; Zhang, J.; et al. Mutation status and prognostic values of KRAS, NRAS, BRAF and PIK3CA in 353 Chinese colorectal cancer patients. Sci. Rep. 2018, 17, 1–11. [Google Scholar] [CrossRef] [PubMed]
  37. Kim, J.E.; Kim, K.K.; Kim, S.Y.; Lee, J.; Park, S.H.; Park, J.O.; Park, Y.S.; Lim, H.Y.; Kang, W.K.; Kim, S.T. MAP2K1 Mutation in Colorectal Cancer Patients: Therapeutic Challenge Using Patient-Derived Tumor Cell Lines. J. Cancer 2017, 8, 2263–2268. [Google Scholar] [CrossRef] [PubMed] [Green Version]
  38. Jincui, G.; Yanbin, Z.; Lixia, H.; Weijun, O.; Jian, W.; Shaoli, L.; Junwen, X.; Jinlun, F.; Baomo, L. TP53 mutation is associated with a poor clinical outcome for non-small cell lung cancer: Evidence from a meta-analysis. Mol. Clin. Oncol. 2016, 5, 705–713. [Google Scholar] [CrossRef] [Green Version]
  39. La Fleur, L.; Falk-Sörqvist, E.; Smeds, P.; Berglund, A.; Sundström, M.; Mattsson, J.S.; Brandén, E.; Koyi, H.; Isaksson, J.; Brunnström, H.; et al. Mutation patterns in a population-based non-small cell lung cancer cohort and prognostic impact of concomitant mutations in KRAS and TP53 or STK11. Lung Cancer. 2019, 130, 50–58. [Google Scholar] [CrossRef] [Green Version]
  40. Huemer, F.; Thaler, J.; Piringer, G.; Hackl, H.; Pleyer, L.; Hufnagl, C.; Weiss, L.; Greil, R. Sidedness and TP53 mutations impact OS in anti-EGFR but not anti-VEGF treated mCRC—an analysis of the KRAS registry of the AGMT (Arbeitsgemeinschaft Medikamentöse Tumortherapie). BMC Cancer 2018, 18, 1–11. [Google Scholar] [CrossRef]
  41. Mehrvarz Sarshekeh, A.; Advani, S.; Overman, M.J.; Manyam, G.; Kee, B.K.; Fogelman, D.R.; Dasari, A.; Raghav, K.; Vilar, E.; Manuel, S.; et al. Association of SMAD4 mutation with patient demographics, tumor characteristics, and clinical outcomes in colorectal cancer. PLoS ONE 2017, 12, 1–14. [Google Scholar] [CrossRef]
  42. Korphaisarn, K.; Morris, V.K.; Overman, M.J.; Fogelman, D.R.; Kee, B.K.; Raghav, K.P.S.; Manuel, S.; Shureiqi, I.; Wolff, R.A.; Eng, C.; et al. FBXW7 missense mutation: A novel negative prognostic factor in metastatic colorectal adenocarcinoma. Oncotarget 2017, 24, 39268–39279. [Google Scholar] [CrossRef]
  43. World Medical Association Declaration of Helsinki. Ethical Principles for Medical Research Involving Human Subjects. Available online: https://www.wma.net/wp-content/uploads/2016/11/DoH-Oct2013-JAMA.pdf (accessed on 15 July 2019).
  44. Catalogue of Somatic Mutations in Cancer. Available online: http://cancer.sanger.ac.uk/cosmic (accessed on 15 July 2019).
  45. Kopanos, C.; Tsiolkas, V.; Kouris, A.; Chapple, C.E.; Albarca-Aguilera, M.; Meyer, R.; Massouras, A. VarSome: The human genomic variant search engine. Bioinformatics 2019, 35, 1978–1980. [Google Scholar] [CrossRef] [PubMed]
  46. 1000 Genomes. Available online: http://browser.1000genomes.org/index.html (accessed on 15 July 2019).
  47. National Center for Biotechnology Information. dbSNP. Available online: https://www.ncbi.nlm.nih.gov/projects/SNP/ (accessed on 15 July 2019).
  48. Protein Variation Effect Analyzer. Available online: http://provean.jcvi.org/index.php (accessed on 15 July 2019).
  49. Kumar, P.; Henikoff, S.; Ng, P.C. Predicting the effects of coding non-synonymous variants on protein function using the SIFT algorithm. Nat. Protoc. 2009, 7, 1073–1081. [Google Scholar] [CrossRef] [PubMed]
  50. Adzhubei, I.A.; Schmidt, S.; Peshkin, L.; Ramensky, V.E.; Gerasimova, A.; Bork, P.; Kondrashov, A.S.; Sunyaev, S.R. A method and server for predicting damaging missense mutations. Nat. Methods 2010, 7, 248–249. [Google Scholar] [CrossRef] [PubMed] [Green Version]
  51. Reed, G.H.; Wittwer, C.T. Sensitivity and specificity of single-nucleotide polymorphism scanning by high-resolution melting analysis. Clin. Chem. 2004, 50, 1748–1754. [Google Scholar] [CrossRef] [PubMed]
Figure 1. Distribution of gene alterations in NSCLC (green) and mCRC patients (blue). Column chart in the upper part represents the total number of mutations for each sample. Left column indicates the percentage of samples with specific gene alteration. Dark grey—Not tested. R—Rearrangements.
Cancers 11 01196 g001
Figure 2. Circos diagram. Associations among the most prevalently mutated genes in NSCLC patients.
Cancers 11 01196 g002
Figure 3. Circos diagram. Associations among the most prevalently mutated genes in mCRC patients.
Cancers 11 01196 g003
Figure 4. Percentage of NSCLC patients with actionable alterations detected by NGS. Fifty-eight percent of patients included in the study were susceptible to being treated with targeted drugs approved in advanced cancers or in clinical trials.
Cancers 11 01196 g004
Figure 5. Classification of mCRC patients according to clinically relevant alterations detected by NGS.
Cancers 11 01196 g005
Table 1. Comparison of NGS results with conventional methods.
Conventional Methods Result
GeneMutation/Fusion DetectedNot DetectedParameterAgreement
EGFR-NGS Result
Mutation Detected130PPA92.9%
Not Detected186NPA100%
OA99.0%
KRAS-NGS Result
Mutation Detected745PPA97.4%
Not Detected250NPA90.9%
OA94.7%
NRAS-NGS Result
Mutation Detected30PPA100%
Not Detected054NPA100%
OA100%
BRAF-NGS Result
Mutation Detected92PPA100%
Not Detected045NPA95.8%
OA96.4%
ALK Fusions-NGS Result
Fusion Detected41PPA100%
Not Detected095NPA99.0%
OA99.0%
ROS1 Fusions-NGS Result
Fusion Detected10PPA100%
Not Detected099NPA100%
OA100%
NGS—Next Generation Sequencing; PPA—Positive percent agreement; NPA—Negative percent agreement; OA—Overall agreement.
Table 2. Turnaround time and cost comparison between NGS and conventional methods.
AnalysisSystemHands-on Time, min (h)Time Duration, min (h)Costs (€)
NGS Analysis (8 NSCLC samples (DNA + RNA))
DNA and RNA isolationManual90 (1.5)1140 (19.0)166.96
Quantification and sample dilutionQubit30 (0.5)30 (0.5)13.68
Library preparation DNAVeriti Thermal Cycler120 (2.0)1440 (24.0)984.00
Library preparation RNAVeriti Thermal Cycler 1214.72
Emulsion PCROne Touch20 (0.3)480 (8.0)124.16
EnrichmentOne Touch ES10 (0.2)30 (0.5)23.70
SequencingPGM System10 (0.2)240 (4.0)607.00
Data Processing and analysisIon Reporter160 (2.6)180 (3.0)-
Laboratory personnel costs † -235.60
Total Cost --3369.84
Cost per sample --421.23
Working days 440 (7.3)5 days-
Conventional Molecular Analysis (8 NSCLC samples (DNA))
DNA isolationManual60 (1.0)1140 (19.0)84.16
Quantification and sample dilutionQubit15 (0.25)30 (0.5)5.04
EGFR (Exon 18, 19, 20 and 21)RT-qPCR20 (0.3)120 (2.0)1391.50
ALK- RearrangementsIHQ10 (0.2)960 (16.0)672.00
ROS1-RearrangementsIHQ10 (0.2)960 (16.0)672.00
Sanger sequencingSS30 (0.5)480 (8.0)40.00
Data Processing and analysis 30 (0.5)30 (0.5)-
Laboratory personnel costs † -76.55
Total Cost --2941.27
Cost per sample 367.66
Working days 175 (2.9)3 days-
NGS Analysis (10 mCRC samples (DNA))
DNA isolationManual60 (1.0)1140 (19.0)105.20
Quantification and sample dilutionQubit15 (0.25)30 (0.5)6.30
Library preparation DNAVeriti Thermal Cycler120 (2.0)1440 (24.0)1230.00
Emulsion PCROne Touch20 (0.4)480 (8.0)77.60
EnrichmentOne Touch ES10 (0.2)30 (0.5)14.80
SequencingPGM System10 (0.2)240 (4.0)379.40
Data Processing and analysisIon Reporter160 (2.6)180 (3.0)-
Laboratory personnel costs † -219.85
Total Cost --2033.15
Cost per sample --203.32
Working days 395 (6.6)5 days-
Conventional Molecular Analysis (10 mCRC samples (DNA))
DNA isolationManual60 (1.0)1140 (19.0)105.20
Quantification and sample dilutionQubit15 (0.25)30 (0.5)6.30
KRAS (Exon 2,3 and 4)RT-qPCR20 (0.3)150 (2.5)1530.60
NRAS (Exon 2,3 and 4)IHQ20 (0.3)150 (2.5)1391.50
BRAF (Codon 600)IHQ30 (0.5)120 (2.0)1001.80
Sanger sequencingSS30 (0.5)480 (8.0)50.00
Data Processing and analysis 30 (0.5)30 (0.5)-
Laboratory personnel costs † --87.05
Total Cost --4172.47
Cost per sample --417.25
Working days 250 (3.4)4 days *-
NSCLC—Non-small cell lung cancer; mCRC—metastatic colorectal cancer; NGS—Next-generation sequencing; PGM—Personal Genome Machine; RT-qPCR—Real-Time quantitative polymerase chain reaction; SS—Sanger sequencing; IHQ—Immunohistochemistry; HRM—High resolution melting; - Non applicable. † Laboratory personnel costs—Cost is calculated based on the time required by the technician/physician in each analysis step (Hands-on time). * If KRAS is mutated global time duration has been estimated in 3 days.
Table 3. Epidemiological and clinical-pathological characteristics of the patients included.
NSCLC Patients (n = 100)mCRC Patients (n = 100)
VariablenVariablen
Age (mean ±SD)65.18 ± 10.66Age (mean ±SD)64.91 ± 10.82
Age, years Age, years
<6030<6034
≥6070≥6066
Gender Gender
Male65Male63
Female35Female37
Anatomic site Anatomic site
Primary tumor85Primary tumor85
Regional lymph nodes5Liver7
Brain4Lung4
Liver2Peritoneum2
Others4Others2
Histologic NSCLC type Histologic mCRC type
Adenocarcinoma87Adenocarcinoma100
Squamous Cell Carcinoma3
NOS10
Smoking status Tumor Location
Non-smoker21Sigmoid Colon31
Ex-smoker45Rectum26
Current-smoker34Right (ascending) colon14
Left (descending) colon9
Transverse colon6
Splenic flexure5
Cecum3
Unknown6
NSCLC—Non-small cell lung cancer; mCRC—metastatic colorectal cancer; NOS—Not Otherwise Specified.

