Optimizing Neuro-Oncology Imaging: A Review of Deep Learning Approaches for Glioma Imaging

 , , ,
, , ,
Abstract
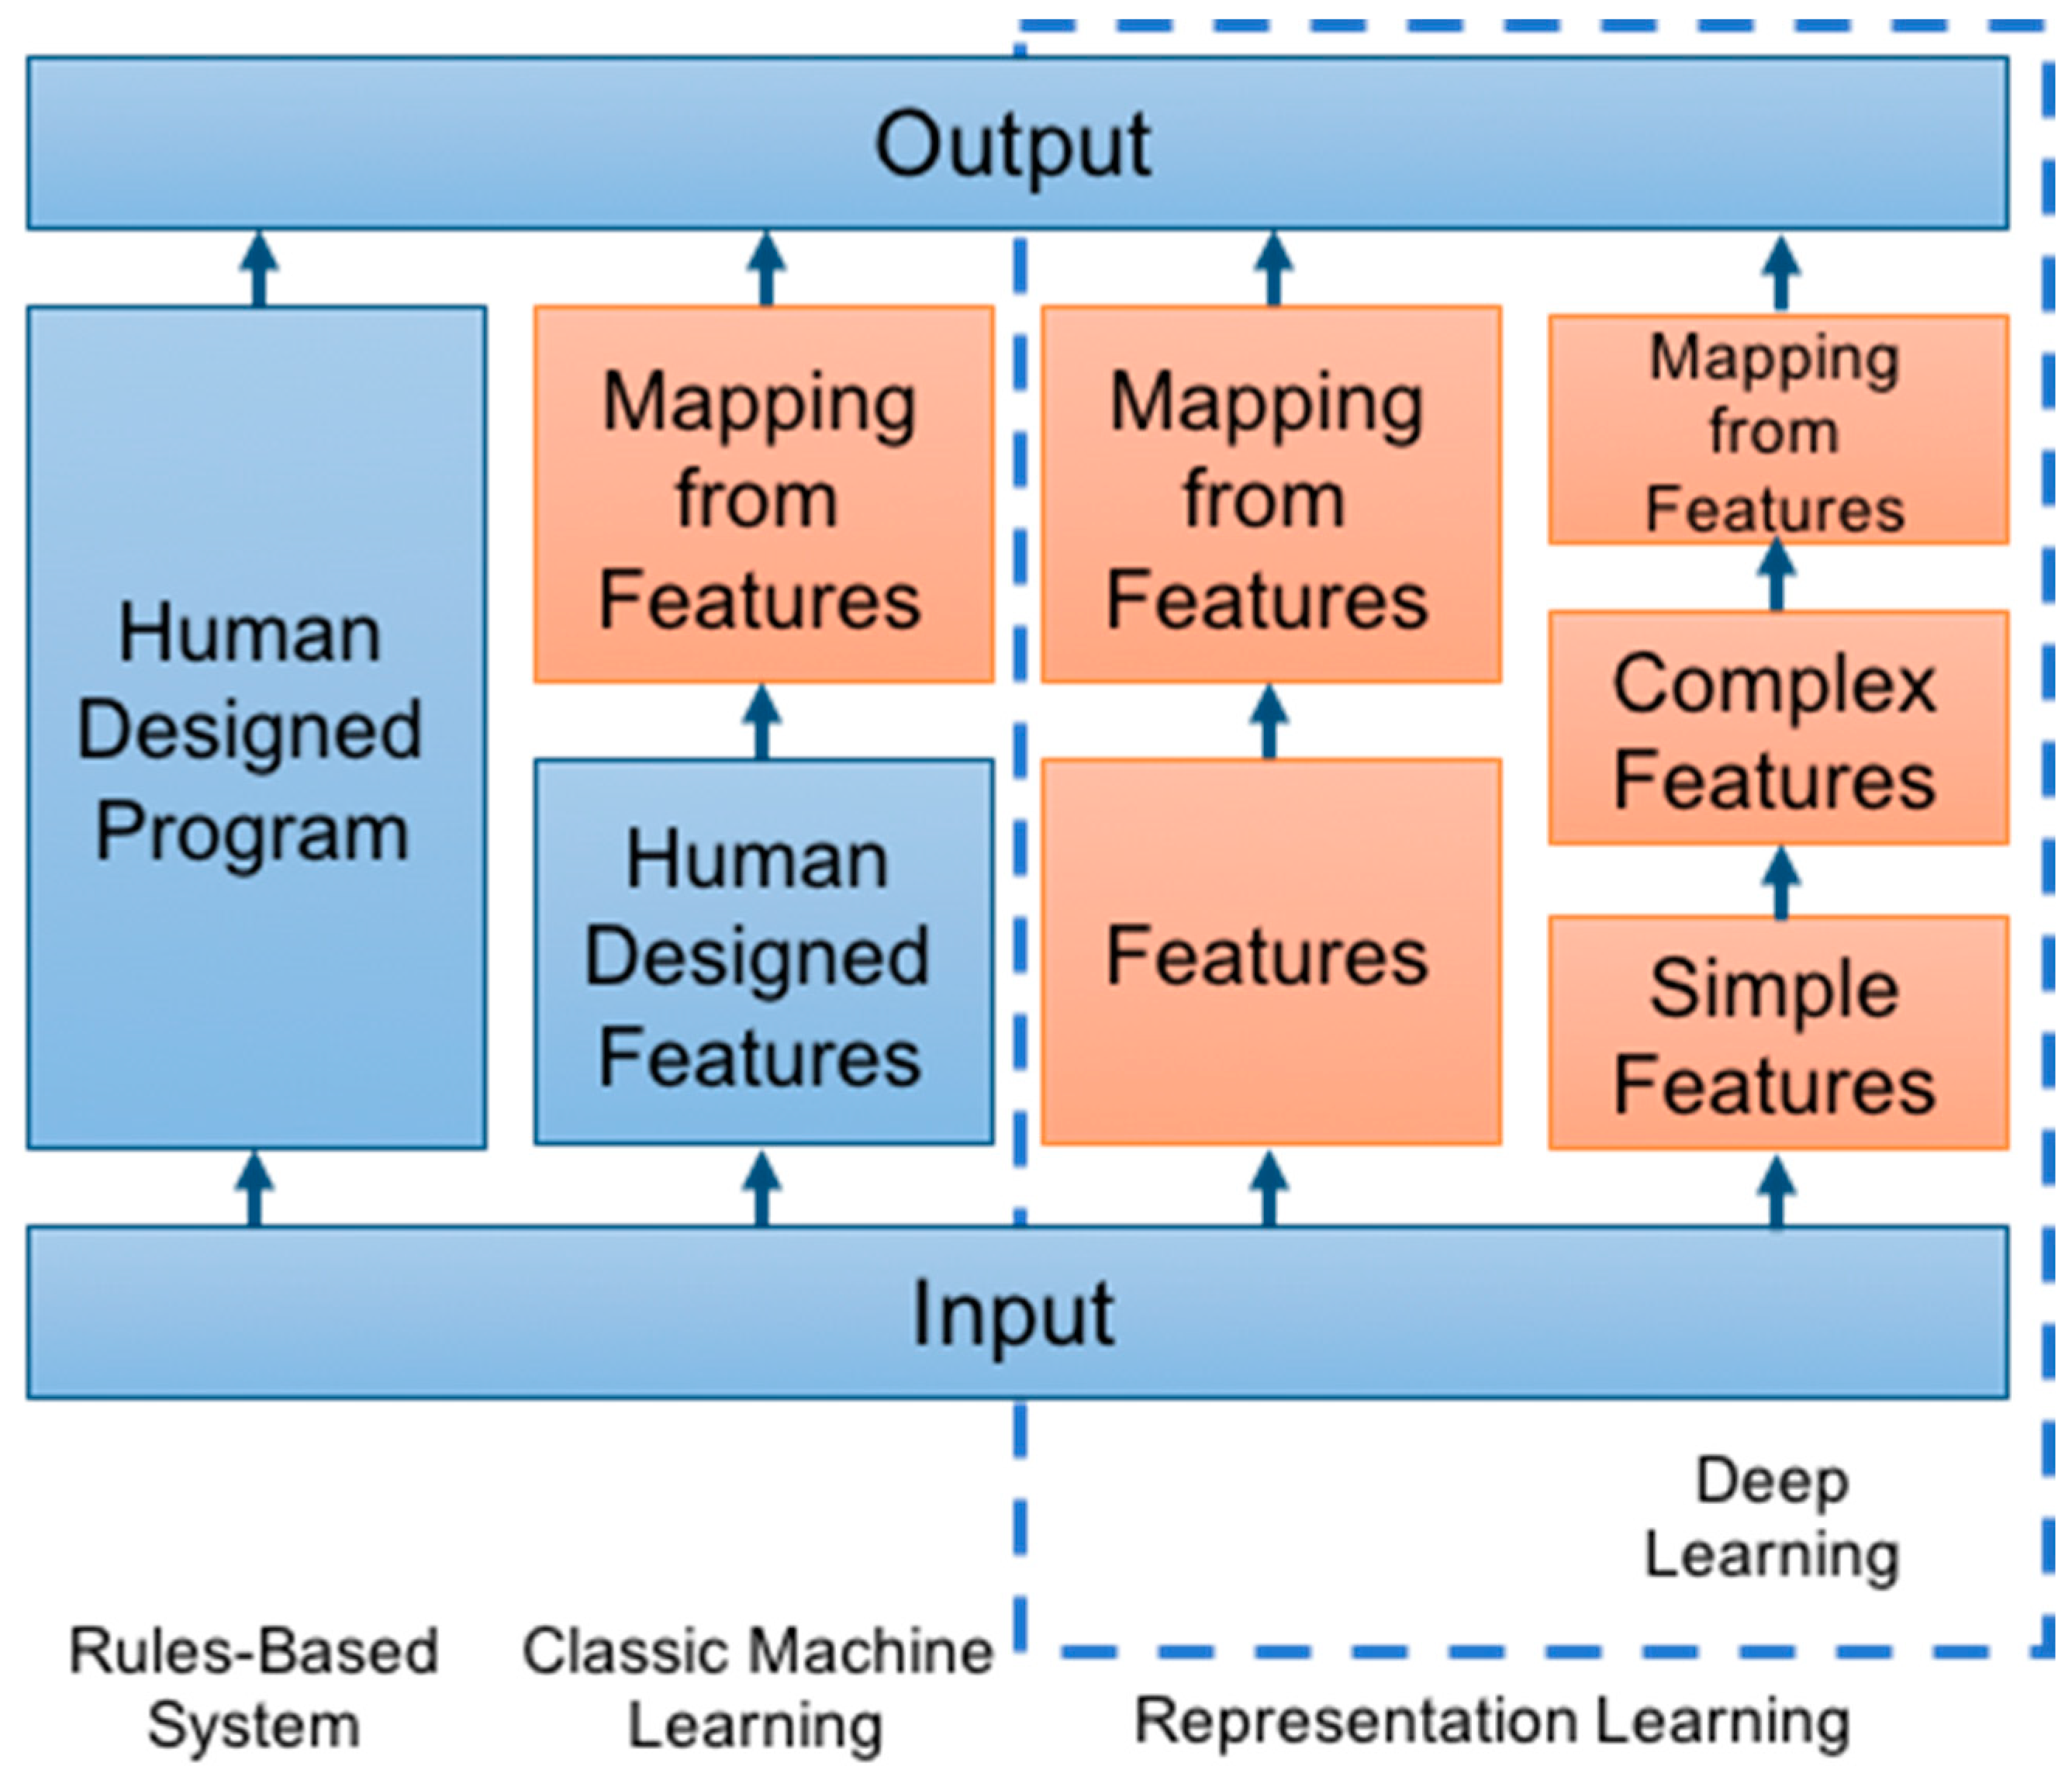
:1. Introduction
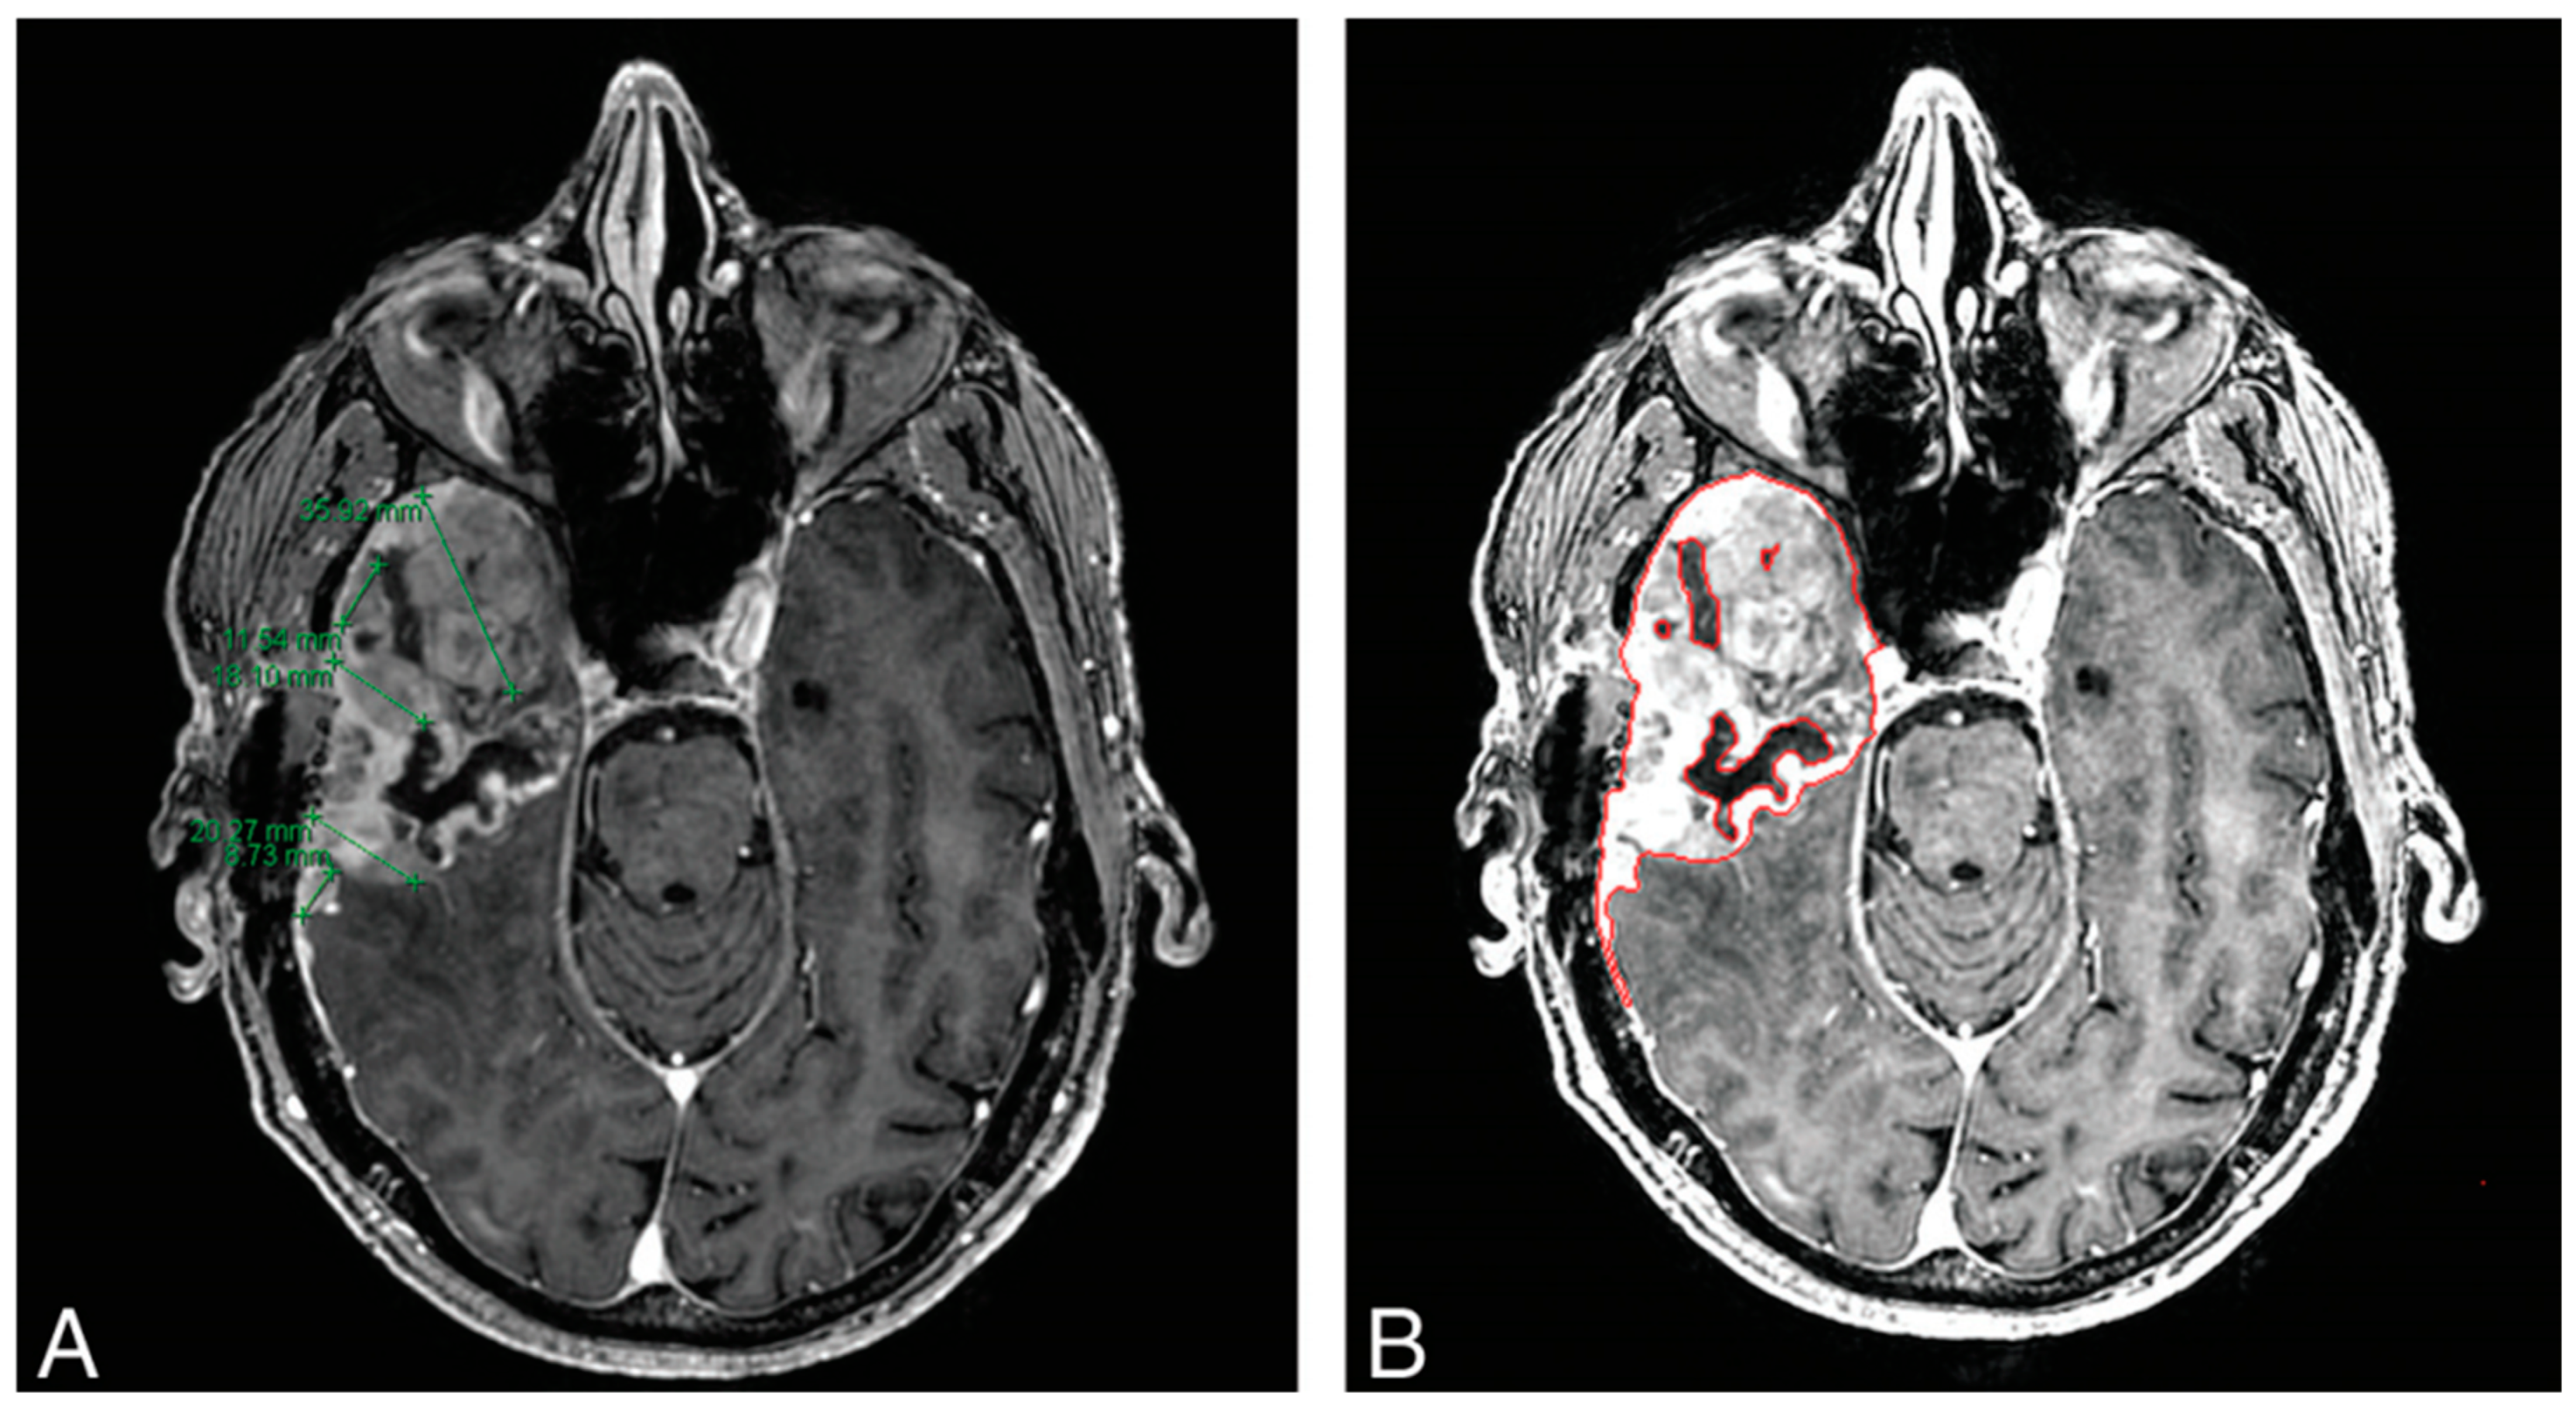
2. Pre and Post-Operative Tumor Segmentation: Quantification of Disease Burden
3. Characterization: Pseudoprogression
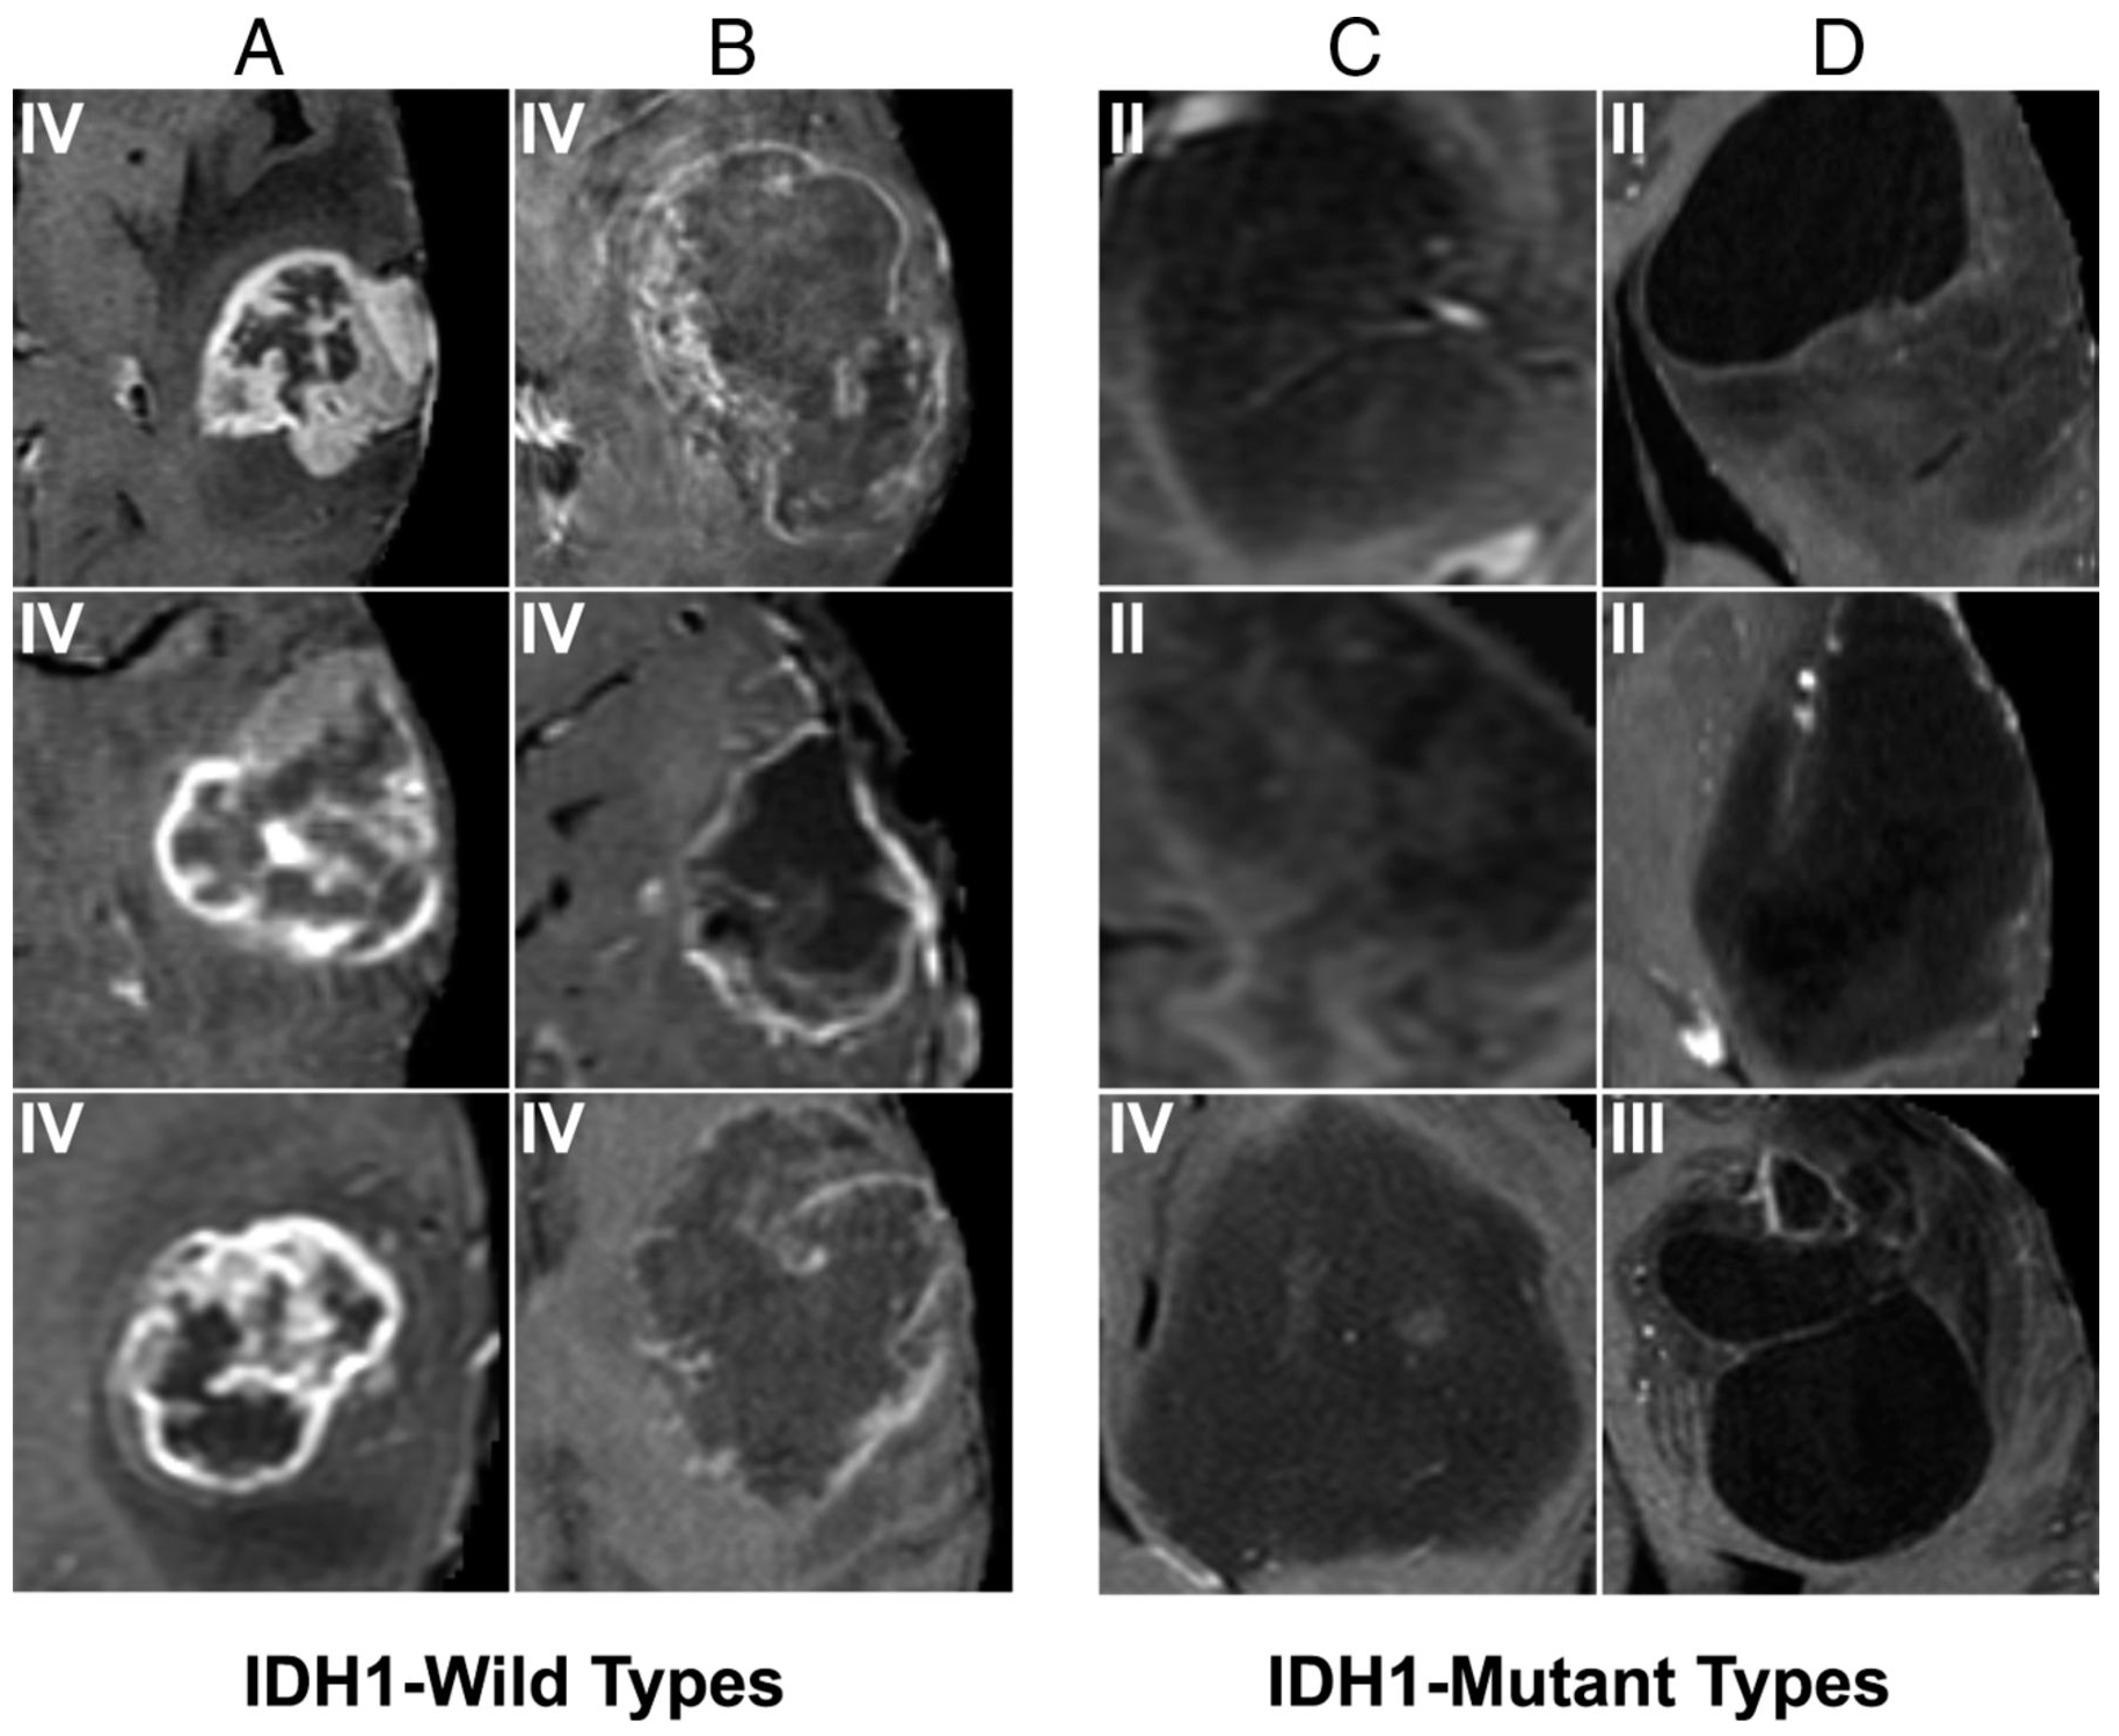
4. Characterization: Radiogenomics
5. Prognostication
6. Challenges
7. Conclusions
Funding
Conflicts of Interest
References
- Ostrom, Q.T.; Gittleman, H.; Fulop, J.; Liu, M.; Blanda, R.; Kromer, C.; Wolinsky, Y.; Kruchko, C.; Barnholtz-Sloan, J.S. CBTRUS Statistical Report: Primary Brain and Central Nervous System Tumors Diagnosed in the United States in 2008–2012. Neuro Oncol. 2015, 17 (Suppl. 4), iv1–iv62. [Google Scholar] [CrossRef]
- Belden, C.J.; Valdes, P.A.; Ran, C.; Pastel, D.A.; Harris, B.T.; Fadul, C.E.; Israel, M.A.; Paulsen, K.; Roberts, D.W. Genetics of glioblastoma: A window into its imaging and histopathologic variability. Radiographics 2011, 31, 1717–1740. [Google Scholar] [CrossRef]
- Wiki for the VASARI Feature Set the National Cancer Institute Web Site. Available online: https://wiki.cancerimagingarchive.net/display/Public/VASARI+Research+Project (accessed on 10 April 2019).
- Gutman, D.A.; Cooper, L.A.; Hwang, S.N.; Holder, C.A.; Gao, J.; Aurora, T.D.; Dunn, W.D., Jr.; Scarpace, L.; Mikkelsen, T.; Jain, R.; et al. MR imaging predictors of molecular profile and survival: Multi-institutional study of the TCGA glioblastoma data set. Radiology 2013, 267, 560–569. [Google Scholar] [CrossRef]
- Mazurowski, M.A.; Desjardins, A.; Malof, J.M. Imaging descriptors improve the predictive power of survival models for glioblastoma patients. Neuro-Oncol. 2013, 15, 1389–1394. [Google Scholar] [CrossRef] [Green Version]
- Velazquez, E.R.; Meier, R.; Dunn, W.D., Jr.; Alexander, B.; Wiest, R.; Bauer, S.; Gutman, D.A.; Reyes, M.; Aerts, H.J. Fully automatic GBM segmentation in the TCGA-GBM dataset: Prognosis and correlation with VASARI features. Sci. Rep. 2015, 5, 16822. [Google Scholar] [CrossRef] [Green Version]
- Goodfellow, I.; Bengio, Y.; Courville, A. Deep Learning; The MIT Press: Cambridge, MA, USA, 2016. [Google Scholar]
- Zacharaki, E.I.; Wang, S.; Chawla, S.; Soo Yoo, D.; Wolf, R.; Melhem, E.R.; Davatzikos, C. Classification of brain tumor type and grade using MRI texture and shape in a machine learning scheme. Magn. Reson. Med. Off. J. Int. Soc. Magn. Reson. Med. 2009, 62, 1609–1618. [Google Scholar] [CrossRef] [Green Version]
- Hu, L.S.; Ning, S.; Eschbacher, J.M.; Baxter, L.C.; Gaw, N.; Ranjbar, S.; Plasencia, J.; Dueck, A.C.; Peng, S.; Smith, K.A.; et al. Radiogenomics to characterize regional genetic heterogeneity in glioblastoma. Neuro Oncol. 2017, 19, 128–137. [Google Scholar] [CrossRef]
- Kassner, A.; Thornhill, R.E. Texture analysis: A review of neurologic MR imaging applications. AJNR Am. J. Neuroradiol. 2010, 31, 809–816. [Google Scholar] [CrossRef]
- Deng, L.; Yu, D. Deep learning: Methods and applications. Found. Trends® Signal Process. 2014, 7, 197–387. [Google Scholar] [CrossRef]
- Zeiler, M.D.; Fergus, R. Visualizing and understanding convolutional networks. In European Conference on Computer Vision; Springer: Cham, Switzerland, 2014; pp. 818–833. [Google Scholar]
- He, K.; Zhang, X.; Ren, S.; Sun, J. Deep Residual Learning for Image Recognition. arXiv 2015, arXiv:1512.03385. [Google Scholar]
- Krizhevsky, A.; Sutskever, I.; Hinton, G. Imagenet classification with deep convolutional neural networks. In Proceedings of the 25th International Conference on Neural Information Processing Systems-Volume 1, Lake Tahoe, NV, USA, 3–6 December 2012; pp. 1097–1105. [Google Scholar]
- LeCun, Y.; Bengio, Y.; Hinton, G. Deep learning. Nature 2015, 521, 436–444. [Google Scholar] [CrossRef]
- LeCun, Y.; Huang, F.J.; Bottou, L. Learning methods for generic object recognition with invariance to pose and lighting. In Proceedings of the 2004 IEEE Computer Society Conference on Computer Vision and Pattern Recognition, Washington, DC, USA, 27 June–2 July 2004; pp. 97–104. [Google Scholar]
- Reardon, D.A.; Galanis, E.; DeGroot, J.F.; Cloughesy, T.F.; Wefel, J.S.; Lamborn, K.R.; Lassman, A.B.; Gilbert, M.R.; Sampson, J.H.; Wick, W.; et al. Clinical trial end points for high-grade glioma: The evolving landscape. Neuro Oncol. 2011, 13, 353–361. [Google Scholar] [CrossRef]
- Henson, J.W.; Ulmer, S.; Harris, G.J. Brain tumor imaging in clinical trials. Am. J. Neuroradiol. 2008, 29, 419–424. [Google Scholar] [CrossRef]
- Işın, A.; Direkoğlu, C.; Şah, M. Review of MRI-based brain tumor image segmentation using deep learning methods. Procedia Comput. Sci. 2016, 102, 317–324. [Google Scholar] [CrossRef]
- Zijdenbos, A.P.; Dawant, B.M.; Margolin, R.A.; Palmer, A.C. Morphometric analysis of white matter lesions in MR images: Method and validation. IEEE Trans. Med. Imaging 1994, 13, 716–724. [Google Scholar] [CrossRef]
- Chen, L.; Wu, Y.; DSouza, A.M.; Abidin, A.Z.; Wismüller, A.; Xu, C. MRI tumor segmentation with densely connected 3D CNN. In Medical Imaging 2018: Image Processing; International Society for Optics and Photonics: Bellingham, WA, USA, 2018; Volume 10574, p. 105741F. [Google Scholar]
- Havaei, M.; Davy, A.; Warde-Farley, D.; Biard, A.; Courville, A.; Bengio, Y.; Pal, C.; Jodoin, P.-M.; Larochelle, H. Brain tumor segmentation with deep neural networks. Med. Image Anal. 2017, 35, 18–31. [Google Scholar] [CrossRef]
- Yi, D.; Zhou, M.; Chen, Z.; Gevaert, O. 3-D convolutional neural networks for glioblastoma segmentation. arXiv 2016, arXiv:1611.04534. [Google Scholar]
- Rao, V.; Sarabi, M.S.; Jaiswal, A. Brain tumor segmentation with deep learning. MICCAI Multimodal Brain Tumor Segm. Chall. (BraTS) 2015, 56–59. [Google Scholar]
- Menze, B.H.; Jakab, A.; Bauer, S.; Kalpathy-Cramer, J.; Farahani, K.; Kirby, J.; Burren, Y.; Porz, N.; Slotboom, J.; Wiest, R. The multimodal brain tumor image segmentation benchmark (BRATS). IEEE Trans. Med. Imaging 2015, 34, 1993–2024. [Google Scholar] [CrossRef]
- Bakas, S.; Reyes, M.; Jakab, A.; Bauer, S.; Rempfler, M.; Crimi, A.; Shinohara, R.T.; Berger, C.; Ha, S.M.; Rozycki, M. Identifying the best machine learning algorithms for brain tumor segmentation, progression assessment, and overall survival prediction in the BRATS challenge. arXiv 2018, arXiv:1811.02629. [Google Scholar]
- Huang, G.; Liu, Z.; Van Der Maaten, L.; Weinberger, K.Q. Densely connected convolutional networks. In Proceedings of the IEEE Conference on Computer Vision and Pattern Recognition, Honolulu, HI, USA, 21–26 July 2017; pp. 4700–4708. [Google Scholar]
- Liu, Y.; Xu, X.; Yin, L.; Zhang, X.; Li, L.; Lu, H. Relationship between glioblastoma heterogeneity and survival time: An MR imaging texture analysis. Am. J. Neuroradiol. 2017, 38, 1695–1701. [Google Scholar] [CrossRef]
- He, K.; Zhang, X.; Ren, S.; Sun, J. Deep residual learning for image recognition. In Proceedings of the IEEE Conference on Computer Vision and Pattern Recognition, Las Vegas, NV, USA, 27–30 June 2016; pp. 770–778. [Google Scholar]
- Warren, K.E.; Patronas, N.; Aikin, A.A.; Albert, P.S.; Balis, F.M. Comparison of one-, two-, and three-dimensional measurements of childhood brain tumors. J. Natl. Cancer Inst. 2001, 93, 1401–1405. [Google Scholar] [CrossRef]
- Sorensen, A.G.; Patel, S.; Harmath, C.; Bridges, S.; Synnott, J.; Sievers, A.; Yoon, Y.-H.; Lee, E.J.; Yang, M.C.; Lewis, R.F. Comparison of diameter and perimeter methods for tumor volume calculation. J. Clin. Oncol. 2001, 19, 551–557. [Google Scholar] [CrossRef]
- Sorensen, A.G.; Batchelor, T.T.; Wen, P.Y.; Zhang, W.-T.; Jain, R.K. Response criteria for glioma. Nat. Rev. Clin. Oncol. 2008, 5, 634–644. [Google Scholar] [CrossRef]
- Dempsey, M.F.; Condon, B.R.; Hadley, D.M. Measurement of tumor “size” in recurrent malignant glioma: 1D, 2D, or 3D? Am. J. Neuroradiol. 2005, 26, 770–776. [Google Scholar]
- Kanaly, C.W.; Mehta, A.I.; Ding, D.; Hoang, J.K.; Kranz, P.G.; Herndon, J.E.; Coan, A.; Crocker, I.; Waller, A.F.; Friedman, A.H. A novel, reproducible, and objective method for volumetric magnetic resonance imaging assessment of enhancing glioblastoma. J. Neurosurg. 2014, 121, 536–542. [Google Scholar] [CrossRef]
- Chow, D.S.; Qi, J.; Guo, X.; Miloushev, V.Z.; Iwamoto, F.M.; Bruce, J.N.; Lassman, A.B.; Schwartz, L.H.; Lignelli, A.; Zhao, B.; et al. Semiautomated volumetric measurement on postcontrast MR imaging for analysis of recurrent and residual disease in glioblastoma multiforme. Am. J. Neuroradiol. 2014, 35, 498–503. [Google Scholar] [CrossRef]
- Hygino da Cruz, L.C., Jr.; Rodriguez, I.; Domingues, R.C.; Gasparetto, E.L.; Sorensen, A.G. Pseudoprogression and pseudoresponse: Imaging challenges in the assessment of posttreatment glioma. Am. J. Neuroradiol. 2011, 32, 1978–1985. [Google Scholar] [CrossRef]
- Brandsma, D.; Stalpers, L.; Taal, W.; Sminia, P.; van den Bent, M.J. Clinical features, mechanisms, and management of pseudoprogression in malignant gliomas. Lancet Oncol. 2008, 9, 453–461. [Google Scholar] [CrossRef]
- Wen, P.Y.; Macdonald, D.R.; Reardon, D.A.; Cloughesy, T.F.; Sorensen, A.G.; Galanis, E.; Degroot, J.; Wick, W.; Gilbert, M.R.; Lassman, A.B.; et al. Updated response assessment criteria for high-grade gliomas: Response assessment in neuro-oncology working group. J. Clin. Oncol. 2010, 28, 1963–1972. [Google Scholar] [CrossRef]
- Nasseri, M.; Gahramanov, S.; Netto, J.P.; Fu, R.; Muldoon, L.L.; Varallyay, C.; Hamilton, B.E.; Neuwelt, E.A. Evaluation of pseudoprogression in patients with glioblastoma multiforme using dynamic magnetic resonance imaging with ferumoxytol calls RANO criteria into question. Neuro Oncol. 2014, 16, 1146–1154. [Google Scholar] [CrossRef]
- Abbasi, A.W.; Westerlaan, H.E.; Holtman, G.A.; Aden, K.M.; van Laar, P.J.; van der Hoorn, A. Incidence of Tumour Progression and Pseudoprogression in High-Grade Gliomas: A Systematic Review and Meta-Analysis. Clin. Neuroradiol. 2018, 28, 401–411. [Google Scholar] [CrossRef]
- Hu, X.; Wong, K.K.; Young, G.S.; Guo, L.; Wong, S.T. Support vector machine multiparametric MRI identification of pseudoprogression from tumor recurrence in patients with resected glioblastoma. J. Magn. Reson. Imaging 2011, 33, 296–305. [Google Scholar] [CrossRef] [Green Version]
- Kebir, S.; Khurshid, Z.; Gaertner, F.C.; Essler, M.; Hattingen, E.; Fimmers, R.; Scheffler, B.; Herrlinger, U.; Bundschuh, R.A.; Glas, M. Unsupervised consensus cluster analysis of [18F]-fluoroethyl-L-tyrosine positron emission tomography identified textural features for the diagnosis of pseudoprogression in high-grade glioma. Oncotarget 2017, 8, 8294–8304. [Google Scholar] [CrossRef]
- Qian, X.; Tan, H.; Zhang, J.; Zhao, W.; Chan, M.D.; Zhou, X. Stratification of pseudoprogression and true progression of glioblastoma multiform based on longitudinal diffusion tensor imaging without segmentation. Med. Phys. 2016, 43, 5889–5902. [Google Scholar] [CrossRef]
- Jang, B.-S.; Jeon, S.H.; Kim, I.H.; Kim, I.A. Prediction of pseudoprogression versus progression using machine learning algorithm in glioblastoma. Sci. Rep. 2018, 8, 12516. [Google Scholar] [CrossRef]
- Nobusawa, S.; Watanabe, T.; Kleihues, P.; Ohgaki, H. IDH1 mutations as molecular signature and predictive factor of secondary glioblastomas. Clin. Cancer Res. 2009, 15, 6002–6007. [Google Scholar] [CrossRef]
- Yan, H.; Parsons, D.W.; Jin, G.; McLendon, R.; Rasheed, B.A.; Yuan, W.; Kos, I.; Batinic-Haberle, I.; Jones, S.; Riggins, G.J.; et al. IDH1 and IDH2 mutations in gliomas. N. Engl. J. Med. 2009, 360, 765–773. [Google Scholar] [CrossRef]
- Louis, D.N.; Perry, A.; Reifenberger, G.; von Deimling, A.; Figarella-Branger, D.; Cavenee, W.K.; Ohgaki, H.; Wiestler, O.D.; Kleihues, P.; Ellison, D.W. The 2016 World Health Organization Classification of Tumors of the Central Nervous System: A summary. Acta Neuropathol. 2016, 131, 803–820. [Google Scholar] [CrossRef]
- Bartek, J., Jr.; Ng, K.; Bartek, J.; Fischer, W.; Carter, B.; Chen, C.C. Key concepts in glioblastoma therapy. J. Neurol. Neurosurg. Psychiatry 2012, 83, 753–760. [Google Scholar] [CrossRef]
- Hegi, M.E.; Diserens, A.C.; Gorlia, T.; Hamou, M.F.; de Tribolet, N.; Weller, M.; Kros, J.M.; Hainfellner, J.A.; Mason, W.; Mariani, L.; et al. MGMT gene silencing and benefit from temozolomide in glioblastoma. N. Engl. J. Med. 2005, 352, 997–1003. [Google Scholar] [CrossRef]
- Cancer Genome Atlas Research, N. Comprehensive genomic characterization defines human glioblastoma genes and core pathways. Nature 2008, 455, 1061–1068. [Google Scholar] [CrossRef]
- Lambin, P.; Leijenaar, R.T.H.; Deist, T.M.; Peerlings, J.; de Jong, E.E.C.; van Timmeren, J.; Sanduleanu, S.; Larue, R.T.H.M.; Even, A.J.G.; Jochems, A.; et al. Radiomics: The bridge between medical imaging and personalized medicine. Nat. Rev. Clin. Oncol. 2017, 14, 749–762. [Google Scholar] [CrossRef]
- Kumar, V.; Gu, Y.; Basu, S.; Berglund, A.; Eschrich, S.A.; Schabath, M.B.; Forster, K.; Aerts, H.J.; Dekker, A.; Fenstermacher, D.; et al. Radiomics: The process and the challenges. Magn. Reson. Imaging 2012, 30, 1234–1248. [Google Scholar] [CrossRef]
- Gillies, R.J.; Kinahan, P.E.; Hricak, H. Radiomics: Images Are More than Pictures, They Are Data. Radiology 2016, 278, 563–577. [Google Scholar] [CrossRef] [Green Version]
- Gevaert, O.; Mitchell, L.A.; Achrol, A.S.; Xu, J.; Echegaray, S.; Steinberg, G.K.; Cheshier, S.H.; Napel, S.; Zaharchuk, G.; Plevritis, S.K. Glioblastoma multiforme: Exploratory radiogenomic analysis by using quantitative image features. Radiology 2014, 273, 168–174. [Google Scholar] [CrossRef]
- Levner, I.; Drabycz, S.; Roldan, G.; De Robles, P.; Cairncross, J.G.; Mitchell, R. Predicting MGMT methylation status of glioblastomas from MRI texture. In International Conference on Medical Image Computing and Computer-Assisted Intervention; Springer: Berlin/Heidelberg, Germany, 2009; Volume 12, pp. 522–530. [Google Scholar]
- Korfiatis, P.; Kline, T.L.; Lachance, D.H.; Parney, I.F.; Buckner, J.C.; Erickson, B.J. Residual Deep Convolutional Neural Network Predicts MGMT Methylation Status. J. Digit. Imaging 2017, 30, 622–628. [Google Scholar] [CrossRef]
- Veit, A.; Wilber, M.; Belongie, S. Residual Networks Behave Like Ensembles of Relatively Shallow Networks. arXiv 2016, arXiv:1605.06431. [Google Scholar]
- Chang, K.; Bai, H.X.; Zhou, H.; Su, C.; Bi, W.L.; Agbodza, E.; Kavouridis, V.K.; Senders, J.T.; Boaro, A.; Beers, A.; et al. Residual Convolutional Neural Network for the Determination of IDH Status in Low- and High-Grade Gliomas from MR Imaging. Clin. Cancer Res. 2018, 24, 1073–1081. [Google Scholar] [CrossRef]
- Chang, P.; Grinband, J.; Weinberg, B.D.; Bardis, M.; Khy, M.; Cadena, G.; Su, M.Y.; Cha, S.; Filippi, C.G.; Bota, D.; et al. Deep-Learning Convolutional Neural Networks Accurately Classify Genetic Mutations in Gliomas. Am. J. Neuroradiol. 2018, 39, 1201–1207. [Google Scholar] [CrossRef] [Green Version]
- Liang, S.; Zhang, R.; Liang, D.; Song, T.; Ai, T.; Xia, C.; Xia, L.; Wang, Y. Multimodal 3D DenseNet for IDH Genotype Prediction in Gliomas. Genes 2018, 9, 382. [Google Scholar] [CrossRef]
- Yu, J.; Shi, Z.; Lian, Y.; Li, Z.; Liu, T.; Gao, Y.; Wang, Y.; Chen, L.; Mao, Y. Noninvasive IDH1 mutation estimation based on a quantitative radiomics approach for grade II glioma. Eur. Radiol. 2017, 27, 3509–3522. [Google Scholar] [CrossRef]
- Han, L.; Kamdar, M.R. MRI to MGMT: Predicting methylation status in glioblastoma patients using convolutional recurrent neural networks. Pac Symp. Biocomput. 2018, 23, 331–342. [Google Scholar]
- Ge, C.; Gu, I.Y.; Jakola, A.S.; Yang, J. Deep Learning and Multi-Sensor Fusion for Glioma Classification Using Multistream 2D Convolutional Networks. In Proceedings of the 2018 40th Annual International Conference of the IEEE Engineering in Medicine and Biology Society (EMBC), Honolulu, HI, USA, 18–21 July 2018; pp. 5894–5897. [Google Scholar] [CrossRef]
- Chang, P.D.; Malone, H.R.; Bowden, S.G.; Chow, D.S.; Gill, B.J.A.; Ung, T.H.; Samanamud, J.; Englander, Z.K.; Sonabend, A.M.; Sheth, S.A.; et al. A Multiparametric Model for Mapping Cellularity in Glioblastoma Using Radiographically Localized Biopsies. Am. J. Neuroradiol. 2017, 38, 890–898. [Google Scholar] [CrossRef] [Green Version]
- Li, Z.; Wang, Y.; Yu, J.; Guo, Y.; Cao, W. Deep Learning based Radiomics (DLR) and its usage in noninvasive IDH1 prediction for low grade glioma. Sci. Rep. 2017, 7, 5467. [Google Scholar] [CrossRef]
- Akkus, Z.; Sedlar, J.; Coufalova, L.; Korfiatis, P.; Kline, T.L.; Warner, J.D.; Agrawal, J.; Erickson, B.J. Semi-automated segmentation of pre-operative low grade gliomas in magnetic resonance imaging. Cancer Imaging 2015, 15, 12. [Google Scholar] [CrossRef]
- Zhang, X.; Yan, L.-F.; Hu, Y.-C.; Li, G.; Yang, Y.; Han, Y.; Sun, Y.-Z.; Liu, Z.-C.; Tian, Q.; Han, Z.-Y. Optimizing a machine learning based glioma grading system using multi-parametric MRI histogram and texture features. Oncotarget 2017, 8, 47816. [Google Scholar] [CrossRef]
- Macyszyn, L.; Akbari, H.; Pisapia, J.M.; Da, X.; Attiah, M.; Pigrish, V.; Bi, Y.; Pal, S.; Davuluri, R.V.; Roccograndi, L. Imaging patterns predict patient survival and molecular subtype in glioblastoma via machine learning techniques. Neuro-Oncol. 2015, 18, 417–425. [Google Scholar] [CrossRef] [Green Version]
- Emblem, K.E.; Pinho, M.C.; Zöllner, F.G.; Due-Tonnessen, P.; Hald, J.K.; Schad, L.R.; Meling, T.R.; Rapalino, O.; Bjornerud, A. A generic support vector machine model for preoperative glioma survival associations. Radiology 2015, 275, 228–234. [Google Scholar] [CrossRef]
- Sarkiss, C.A.; Germano, I.M. Machine Learning in Neuro-Oncology: Can Data Analysis from 5,346 Patients Change Decision Making Paradigms? World Neurosurg. 2019, 124, 287–294. [Google Scholar] [CrossRef]
- Nie, D.; Zhang, H.; Adeli, E.; Liu, L.; Shen, D. 3D deep learning for multi-modal imaging-guided survival time prediction of brain tumor patients. In International Conference on Medical Image Computing and Computer-Assisted Intervention; Springer: Cham, Switzerland, 2016; pp. 212–220. [Google Scholar]
- Choy, G.; Khalilzadeh, O.; Michalski, M.; Do, S.; Samir, A.E.; Pianykh, O.S.; Geis, J.R.; Pandharipande, P.V.; Brink, J.A.; Dreyer, K.J. Current applications and future impact of machine learning in radiology. Radiology 2018, 288, 318–328. [Google Scholar] [CrossRef]
- Srivastava, N.; Hinton, G.; Krizhevsky, A.; Sutskever, I.; Salakhutdinov, R. Dropout: A simple way to prevent neural networks from overfitting. J. Mach. Learn. Res. 2014, 15, 1929–1958. [Google Scholar]
- Moore, R.; DeNero, J. L1 and L2 regularization for multiclass hinge loss models. In Proceedings of the Symposium on Machine Learning in Speech and Language Processing, Bellevue, WA, USA, 27 June 2011. [Google Scholar]
- Ioffe, S.; Szegedy, C. Batch normalization: Accelerating deep network training by reducing internal covariate shift. arXiv 2015, arXiv:1502.03167. [Google Scholar]
- Boone, J.M. Radiological interpretation 2020: Toward quantitative image assessment. Med. Phys. 2007, 34, 4173–4179. [Google Scholar] [CrossRef] [Green Version]
- Summers, R.M. Road maps for advancement of radiologic computer-aided detection in the 21st century. Radiology 2003, 229, 11–13. [Google Scholar] [CrossRef]
- Karssemeijer, N.; Otten, J.D.; Verbeek, A.L.; Groenewoud, J.H.; de Koning, H.J.; Hendriks, J.H.; Holland, R. Computer-aided detection versus independent double reading of masses on mammograms. Radiology 2003, 227, 192–200. [Google Scholar] [CrossRef]
- Van Ginneken, B.; Schaefer-Prokop, C.M.; Prokop, M. Computer-aided diagnosis: How to move from the laboratory to the clinic. Radiology 2011, 261, 719–732. [Google Scholar] [CrossRef]
- Fröhlich, H.; Balling, R.; Beerenwinkel, N.; Kohlbacher, O.; Kumar, S.; Lengauer, T.; Maathuis, M.H.; Moreau, Y.; Murphy, S.A.; Przytycka, T.M. From hype to reality: Data science enabling personalized medicine. BMC Med. 2018, 16, 150. [Google Scholar] [CrossRef]
- U.S. Food & Drug Administration. Artificial Intelligence and Machine Learning in Software as a Medical Device. Available online: https://www.fda.gov/medical-devices/software-medical-device-samd/artificial-intelligence-and-machine-learning-software-medical-device (accessed on 5 June 2019).


| Author | Approach | Feature | Training Size | Results |
|---|---|---|---|---|
| Chen et al. [21] | Connected CNN | Necrotic and non-enhancing tumor, peritumoral edema, and GD-enhancing tumor | 210 patients | Dice Scores—0.72 whole tumor, 0.81 enhancing tumor, 0.83 core |
| Havaei et al. [22] | Two Pathway CNN | Local and global features | 65 patients | Dice Scores—0.81 whole tumor, 0.58 enhancing tumor, 0.72 core |
| Yi et al. [23] | 3D CNN | Tumor edges | 274 patients | Dice Scores—0.89 whole tumor, 0.80 enhancing tumor, 0.76 core |
| Rao et al. [24] | CNN | Non-tumor, necrosis, edema, non-enhancing tumor, enhancing tumor | 10 patients | Accuracy—67% |
| Deep Learning Methods for Glioma Characterization | |||||||||
|---|---|---|---|---|---|---|---|---|---|
| Author | Year | Character Assessed | Type of DL | Patient Number | MRI Number | Accuracy | AUC | AUPRC | F-1 |
| Bum-Sup Jang et al. [44] | 2018 | Pseudoprogression | Hybrid deep and machine learning CNN-LSTM | 78 | 0.83 | 0.87 | 0.74 | ||
| Zeynettin Akkus et al. [66] | 2015 | 1p/19q Co-Deletion | Multi-Scale CNN | 159 | 87.70% | ||||
| Panagiotis Korfiatis et al. [56] | 2017 | MGMT Promoter Methylation Status | ResNet50 | 155 | 94.90% | ||||
| ResNet36 | 80.72% | ||||||||
| ResNet18 | 76.75% | ||||||||
| Ken Chang et al. [58] | 2018 | IDH mutant status | Residual CNN (ResNet34) | 406 | 82.8% training | ||||
| 83.6% validation | |||||||||
| 85.7% testing | |||||||||
| Peter Chang et al. [59] | 2018 | IDH mutant Status | CNN | 256 | 94% | ||||
| 1p/19q Co-Deletion | 92% | ||||||||
| MGMT Promoter Methylation Status | 83% | ||||||||
| Sen Liang et al. [60] | 2018 | IDH Mutant Status | Multimodal 3D DenseNet | 167 | 84.60% | 85.70% | |||
| Multimodal 3D DenseNet with Transfer learning | 91.40% | 94.80% | |||||||
| Jinhua Yu et al. [61] | 2017 | IDH Mutant Status | CNN Segmentation | 110 | 0.80 | ||||
| Lichy Han and Maulik Kamdar [62] | 2018 | MGMT Promoter Methylation Status | Convolutional Recurrent Neural Network (CRNN) | 262 | 5235 | 0.62 Testing | |||
| 0.67 Validation | |||||||||
| 0.97 Training | |||||||||
| Zeju Li et al. [65] | 2017 | IDH1 Mutation Status | CNN | 151 | 92% | ||||
| 95% (multi-modal MRI) | |||||||||
| Chenjie Ge et al. [63] | 2018 | High Grade vs. Low Grade Glioma | 2D-CNN | 285 | 285 | 91.93% Training | |||
| 93.25% validation | |||||||||
| 90.87% test | |||||||||
| 1p/19q Co-Deletion | 159 | 159 | 97.11 training | ||||||
| 90.91% validation | |||||||||
| 89.39% test | |||||||||
| Peter Chang et al. [64] | 2017 | Heterogeneity/ Cellularity | CNN | 39 | 36 MRI, 91 Biopsies | r = 0.74 | |||
| Ilya Levner et al. [55] | 2009 | MGMT Promoter Methylation Status | ANN | 59 | 87.70% | ||||
© 2019 by the authors. Licensee MDPI, Basel, Switzerland. This article is an open access article distributed under the terms and conditions of the Creative Commons Attribution (CC BY) license (http://creativecommons.org/licenses/by/4.0/).
Share and Cite
Shaver, M.M.; Kohanteb, P.A.; Chiou, C.; Bardis, M.D.; Chantaduly, C.; Bota, D.; Filippi, C.G.; Weinberg, B.; Grinband, J.; Chow, D.S.; et al. Optimizing Neuro-Oncology Imaging: A Review of Deep Learning Approaches for Glioma Imaging. Cancers 2019, 11, 829. https://doi.org/10.3390/cancers11060829
Shaver MM, Kohanteb PA, Chiou C, Bardis MD, Chantaduly C, Bota D, Filippi CG, Weinberg B, Grinband J, Chow DS, et al. Optimizing Neuro-Oncology Imaging: A Review of Deep Learning Approaches for Glioma Imaging. Cancers. 2019; 11(6):829. https://doi.org/10.3390/cancers11060829
Chicago/Turabian StyleShaver, Madeleine M., Paul A. Kohanteb, Catherine Chiou, Michelle D. Bardis, Chanon Chantaduly, Daniela Bota, Christopher G. Filippi, Brent Weinberg, Jack Grinband, Daniel S. Chow, and et al. 2019. "Optimizing Neuro-Oncology Imaging: A Review of Deep Learning Approaches for Glioma Imaging" Cancers 11, no. 6: 829. https://doi.org/10.3390/cancers11060829