Interrogation Techniques and Interface Circuits for Coil-Coupled Passive Sensors


Department of Information Engineering, University of Brescia, Via Branze, 38-25123 Brescia, Italy
*
Author to whom correspondence should be addressed.
Micromachines 2018, 9(9), 449; https://doi.org/10.3390/mi9090449
Submission received: 17 August 2018
/
Revised: 3 September 2018
/
Accepted: 5 September 2018
/
Published: 9 September 2018
(This article belongs to the Special Issue Interface Circuits for Microsensor Integrated Systems)
Abstract
:Coil-coupled passive sensors can be interrogated without contact, exploiting the magnetic coupling between two coils forming a telemetric proximity link. A primary coil connected to the interface circuit forms the readout unit, while a passive sensor connected to a secondary coil forms the sensor unit. This work is focused on the interrogation of sensor units based on resonance, denoted as resonant sensor units, in which the readout signals are the resonant frequency and, possibly, the quality factor. Specifically, capacitive and electromechanical piezoelectric resonator sensor units are considered. Two interrogation techniques, namely a frequency-domain technique and a time-domain technique, have been analyzed, that are theoretically independent of the coupling between the coils which, in turn, ensure that the sensor readings are not affected by the interrogation distance. However, it is shown that the unavoidable parasitic capacitance in parallel to the readout coil introduces, for both techniques, an undesired dependence of the readings on the interrogation distance. This effect is especially marked for capacitance sensor units. A compensation circuit is innovatively proposed to counteract the effects of the parasitic input capacitance, and advantageously obtain distance-independent readings in real operating conditions. Experimental tests on a coil-coupled capacitance sensor with resonance at 5.45 MHz have shown a deviation within 1.5 kHz, i.e., 300 ppm, for interrogation distances of up to 18 mm. For the same distance range, with a coil-coupled quartz crystal resonator with a mechanical resonant frequency of 4.432 MHz, variations of less than 1.8 Hz, i.e., 0.5 ppm, have been obtained.
1. Introduction
The ongoing downscaling of modern sensing devices is facing the main challenges of ensuring adequate power supply sources and removing wired connections. The power supply in wireless sensors has been traditionally provided by batteries that, however, have limited lifetime and need periodic recharge/replacement. Moreover, issues related to their degradation and the environmental impact for their disposal need to be considered.
As an alternative approach, energy harvesting techniques have gained increasing interest and undergone extensive investigations. Energy is harvested from the surroundings in the form of vibrations, motion, thermal energy, or solar energy, just to name a few. Suitable energy converters have been developed to transform the harvested energy into electrical energy using different principles, like piezoelectric [1,2], electromagnetic [3], thermoelectric [4] or pyroelectric [5,6] effects. Depending on the input source, the converted power can be sufficient to supply, continuously or intermittently, one or more sensing devices, which can transmit the measurement information through a radio frequency (RF) link to a receiving and supervising unit, thus creating a completely autonomous system without the need for power supply and cabling [7].
Alternatively, solutions based on the radio frequency identification (RFId) technologies can be adopted to implement sensing solutions exploiting electromagnetic coupling or RF fields to energize and transmit measurement information [8,9]. These solutions are typically based on low power configurations relying on a microcontroller to interface passive sensors, such as capacitive or resistive sensors [10]. Implantable sensors for medical analyses and monitoring are important examples where this solution can be advantageously applied [11,12,13].
Both energy harvesting and RFId systems use active electronics in the sensor unit which, in specific situations, can be a limitation, like in hostile, high-temperature, and chemically-harsh environments, where traditional silicon-based electronics cannot operate. In this context, the use of coil-coupled passive sensors, i.e., devices which do not need active components and integrated circuits to operate, is attractive. This solution exploits the magnetic coupling between a primary and a secondary coil to read passive sensors. The primary coil, along with the reading circuitry, forms the readout unit, which reads the sensor unit composed of the sensor element connected to the secondary coil [14,15,16,17]. This approach offers the promising advantage of reducing the cost of the passive sensor unit, allowing the production of disposable sensors, such as labels, with a passive sensor connected to the embedded coil [18,19].
In this paper, passive coil-coupled sensor units having a resonant behavior will be considered. The resonant behavior allows extracting the measurement information through the reading of the resonant frequency of the sensor unit [14,20]. This approach is robust because it is unaffected by the disturbances, such as noise and electromagnetic interferences, which typically affect the signal amplitude. Specifically, two kinds of sensors are investigated, as introduced in Section 2, namely, capacitive sensors, which form a resonant LC circuit with the secondary coil, and piezoelectric resonators, such as Quartz Crystal Resonators (QCRs) [21] or ceramic Resonant Piezo Layers (RPLs) [22].
One of the challenges of the contactless readout of passive sensors is to adopt reading techniques independent of the coupling between the primary and secondary coils [20,23]. This, in turn, would ensure that the readings are not affected by the interrogation distance. Two readout techniques, that are virtually independent of the coupling, are presented and discussed in detail in Section 3. In particular, a frequency-domain technique based on impedance measurements [20] and a time-domain technique called time-gated technique [21] are discussed. Both techniques suffer from significant accuracy degradation, due to the unavoidable parasitic capacitance in parallel to the readout coil that introduces a dependence of the readings on the interrogation distance. This undesirable effect is investigated in detail. Section 4 illustrates a compensation circuit that is innovatively proposed to counteract the effects of the parasitic input capacitance and advantageously obtain distance-independent readings in real operating conditions. Section 5 reports a set of experimental results on prototypes that successfully demonstrate the validity of the proposed approach and circuit.
2. Coil-Coupled Passive Sensors
A coil-coupled passive sensor is represented in its basic form by the schematic diagram of Figure 1. A primary coil CL1 with inductance L1 and series resistance R1 is magnetically coupled to the secondary coil CL2 with inductance L2 and resistance R2. The magnetic coupling is accounted for by the mutual inductance M, which depends on the geometry of L1 and L2 and their spatial arrangement. Alternatively, the magnetic coupling can be described through the coupling factor k, which is a nondimensional parameter defined as , resulting in |k|≤1. In the following, the values of L1, R1 and L2, R2 will be considered as fixed, while the value of M, and hence k, can change due to variations of the distance or orientation between CL1 and CL2.
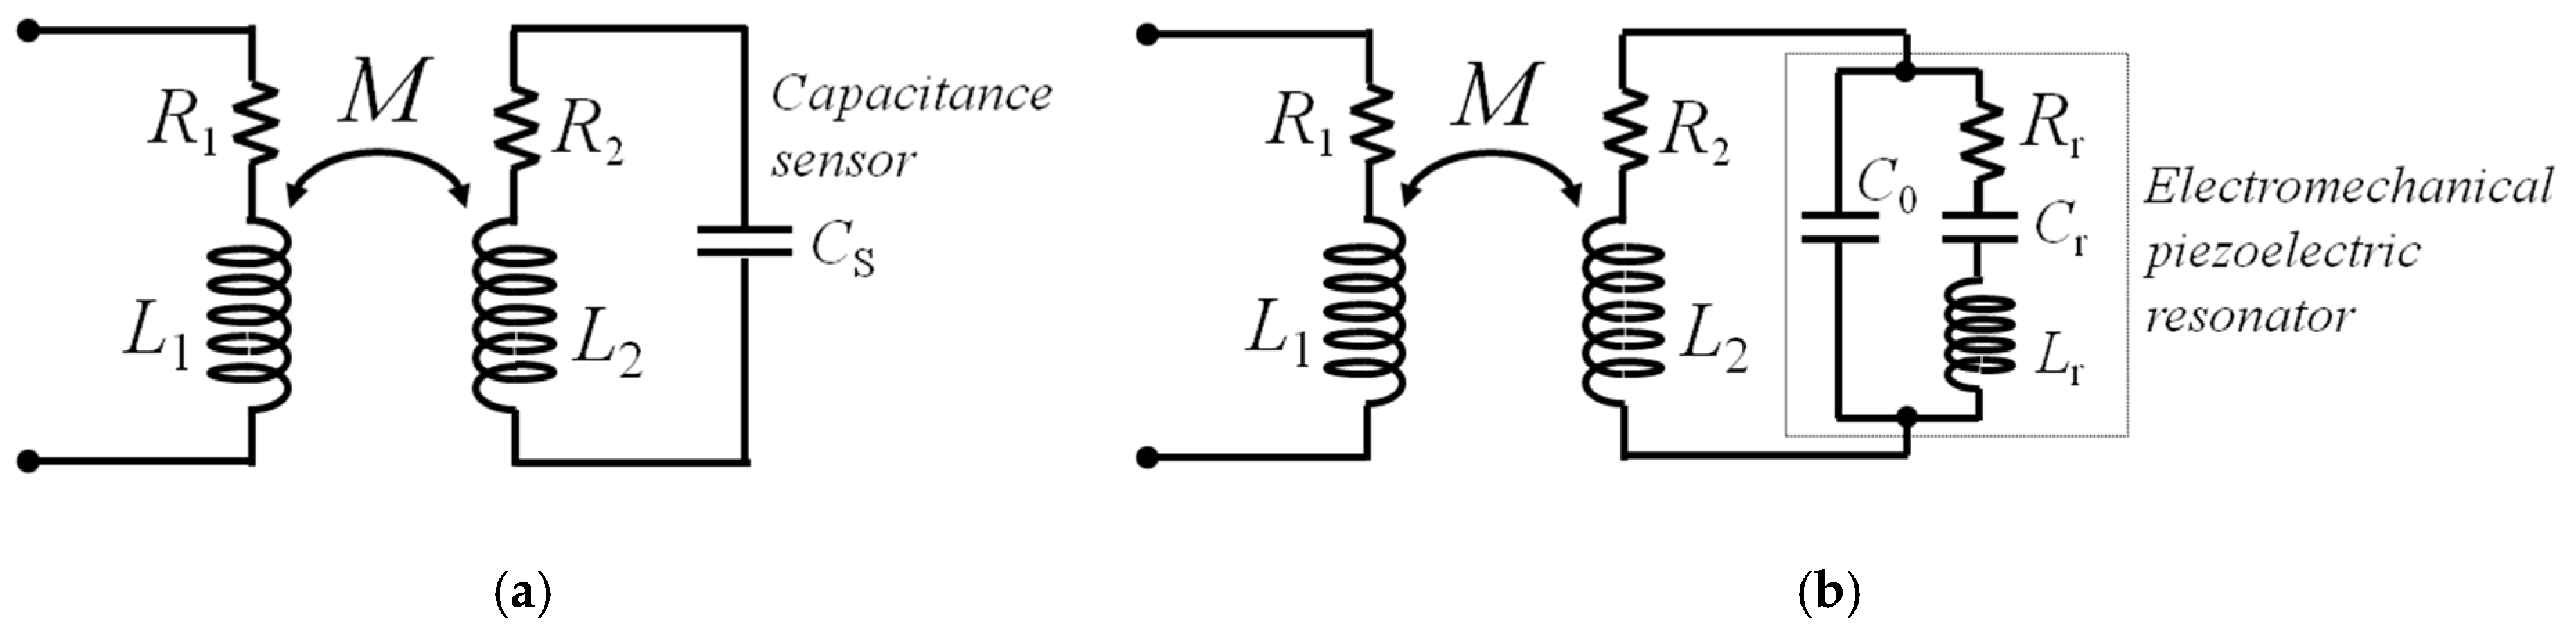
CL2 is connected to the generic impedance ZS, which models the sensing element. In the following, the relevant cases will be considered where ZS either forms, with L2, a second order network with complex conjugate poles, i.e., ZS is predominantly capacitive, or ZS itself includes a second order network with complex conjugate poles, i.e., ZS comprises an LCR network. In both cases, resonance can occur in the secondary circuit where the quantity to be sensed via ZS influences the resonant frequency and, possibly, the damping. Therefore, the resulting combination will be termed Resonant Sensor Unit (RSU).
Importantly, for the RSU, the measurement information is carried by the frequency of the readout signal instead of its amplitude. The adoption of the resonant measuring principle has two main advantages with respect to amplitude-based techniques [24,25]. Firstly, the resonant principle is robust against external interferences or nonidealities that affect the signal amplitude. Secondly, as it will be illustrated in the following, the resonant principle, combined with suitable electronic techniques, can ensure that the readout frequency is made independent of the distance between CL1 and the RSU.
The present theory will consider two specific cases for ZS and the resulting RSU.
In the first case, ZS is a capacitance sensor of value CS, forming, with L2, an LC resonant circuit as shown in Figure 2a. The resonant frequency fS and quality factor QS of the RSU are
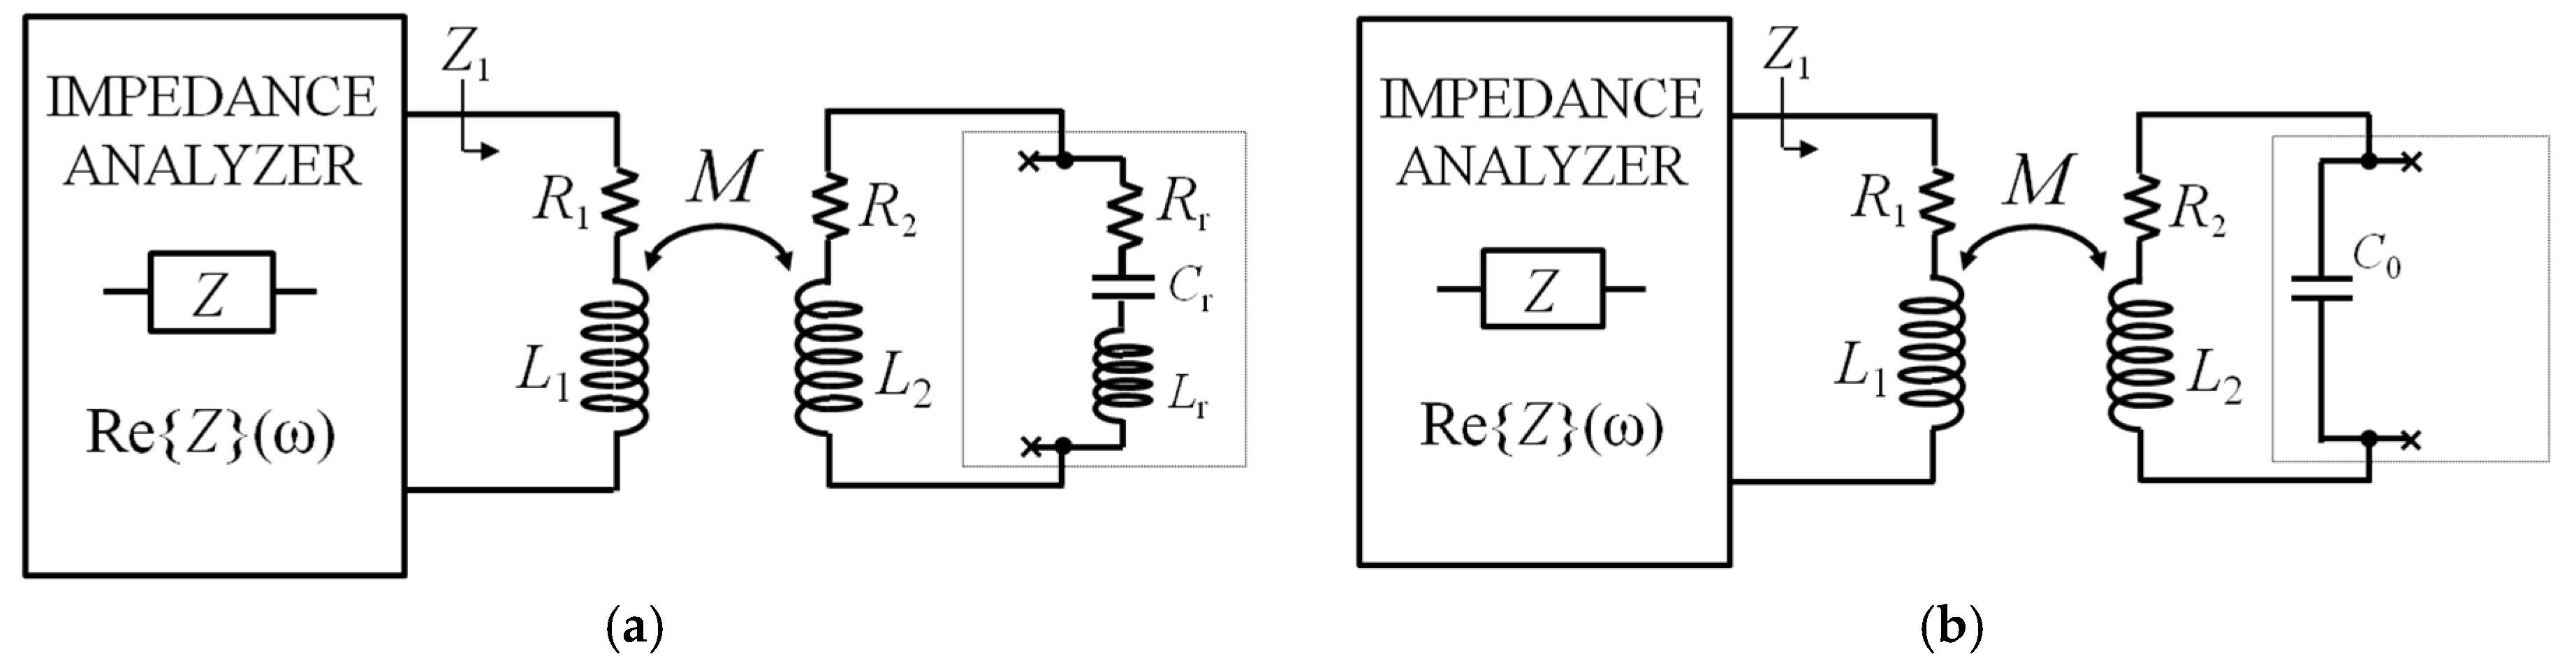
In the second case, ZS is the equivalent impedance of piezoelectric resonant sensors, like QCRs and RPLs. Their electromechanical behavior around resonance can be modelled with the Butterworth–van Dyke (BVD) equivalent lumped-element circuit, as shown in Figure 2b. The BVD circuit is composed of a motional, i.e., mechanical branch, and an electrical branch. The motional branch comprises the series of inductance Lr, capacitance Cr, and resistance Rr, which respectively represent the equivalent mass, compliance, and energy losses of the resonator. The electrical branch is formed by the parallel capacitance C0, due to the dielectric material of the resonator. Under excitation by a voltage source, the mechanical resonant frequency fr, i.e., the frequency at which the current in the motional arm is maximum, corresponds to the series resonant frequency of the BVD circuit, i.e., the frequency at which the reactance of the mechanical branch impedance vanishes [26]. Accordingly, fr and the quality factor Qr of the electromechanical resonator can be expressed as
Typically, when electromechanical piezoelectric resonators are used as sensors, the measurand quantity generates variations of the parameters of the motional branch Lr–Cr–Rr and, as a consequence, of fr and Qr.
3. Analysis of the Interrogation Techniques
3.1. General Considerations
Specific interrogation techniques are required to extract information from the RSU through electronic measurements at the primary coil, exploiting the advantage of coil-coupled, i.e., contactless, operation.
One major issue to consider is the dependence of the mutual inductance M and coupling factor k of the coils on geometrical parameters, such as their distance, alignment, and relative orientation. Techniques that are influenced by the value of M, or equivalently k, would require keeping such geometrical parameters fixed and constant [27,28]. On the other hand, in most practical applications, keeping the distance and the alignment between coils fixed is unpractical/unfeasible. Therefore, as a key requirement for out-of-the-lab use of coil-coupled sensors, robust measurement techniques are demanded that are independent of k.
In the following, two innovative techniques are illustrated to perform k-independent readout of RSUs of both capacitance and electromechanical piezoelectric resonator types. In particular, the first is a frequency-domain technique which relies on the measurement of the reflected impedance at CL1. The second is a time-domain technique, termed time-gated technique, which considers the free damped response of the RSU measured at the primary coil after that the RSU has been energized.
3.2. k-Independent Techniques Applied to Coil-Coupled Capacitance Sensors
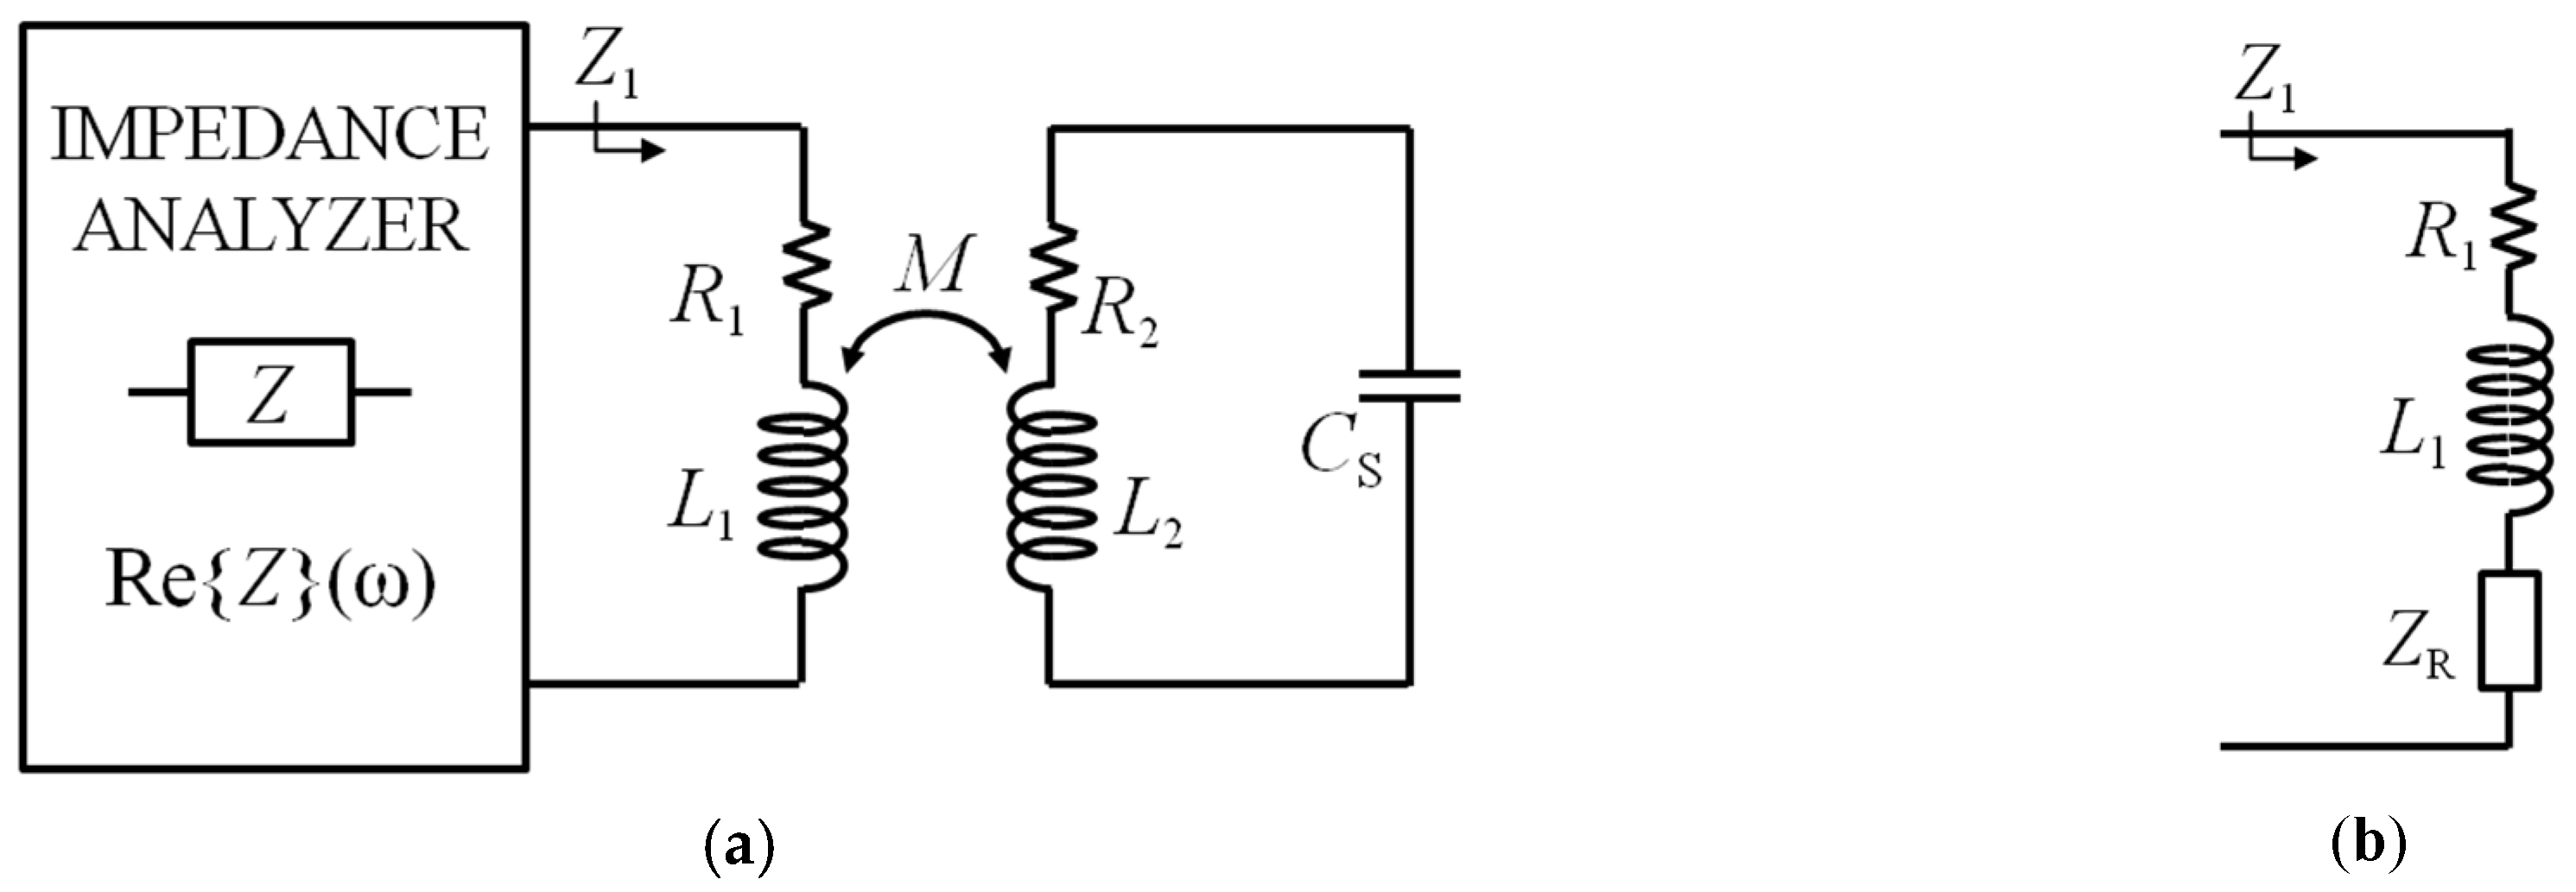
Figure 3a shows the block diagram of the readout technique based on impedance measurements, where the readout system consists in an impedance analyzer connected to the primary coil CL1. From the equivalent circuit of Figure 3b, the impedance Z1, as a function of ω = 2πf, is
It can be seen from Equation (3) that the effect of the coupling with the RSU results in a reflected impedance ZR in series with the primary coil that makes the total impedance Z1 dependent on the coupling factor k. Nevertheless, the resonant frequency fS and the quality factor QS of the RSU, defined in Equation (1), can be obtained from the real part of Z1 [20], given by
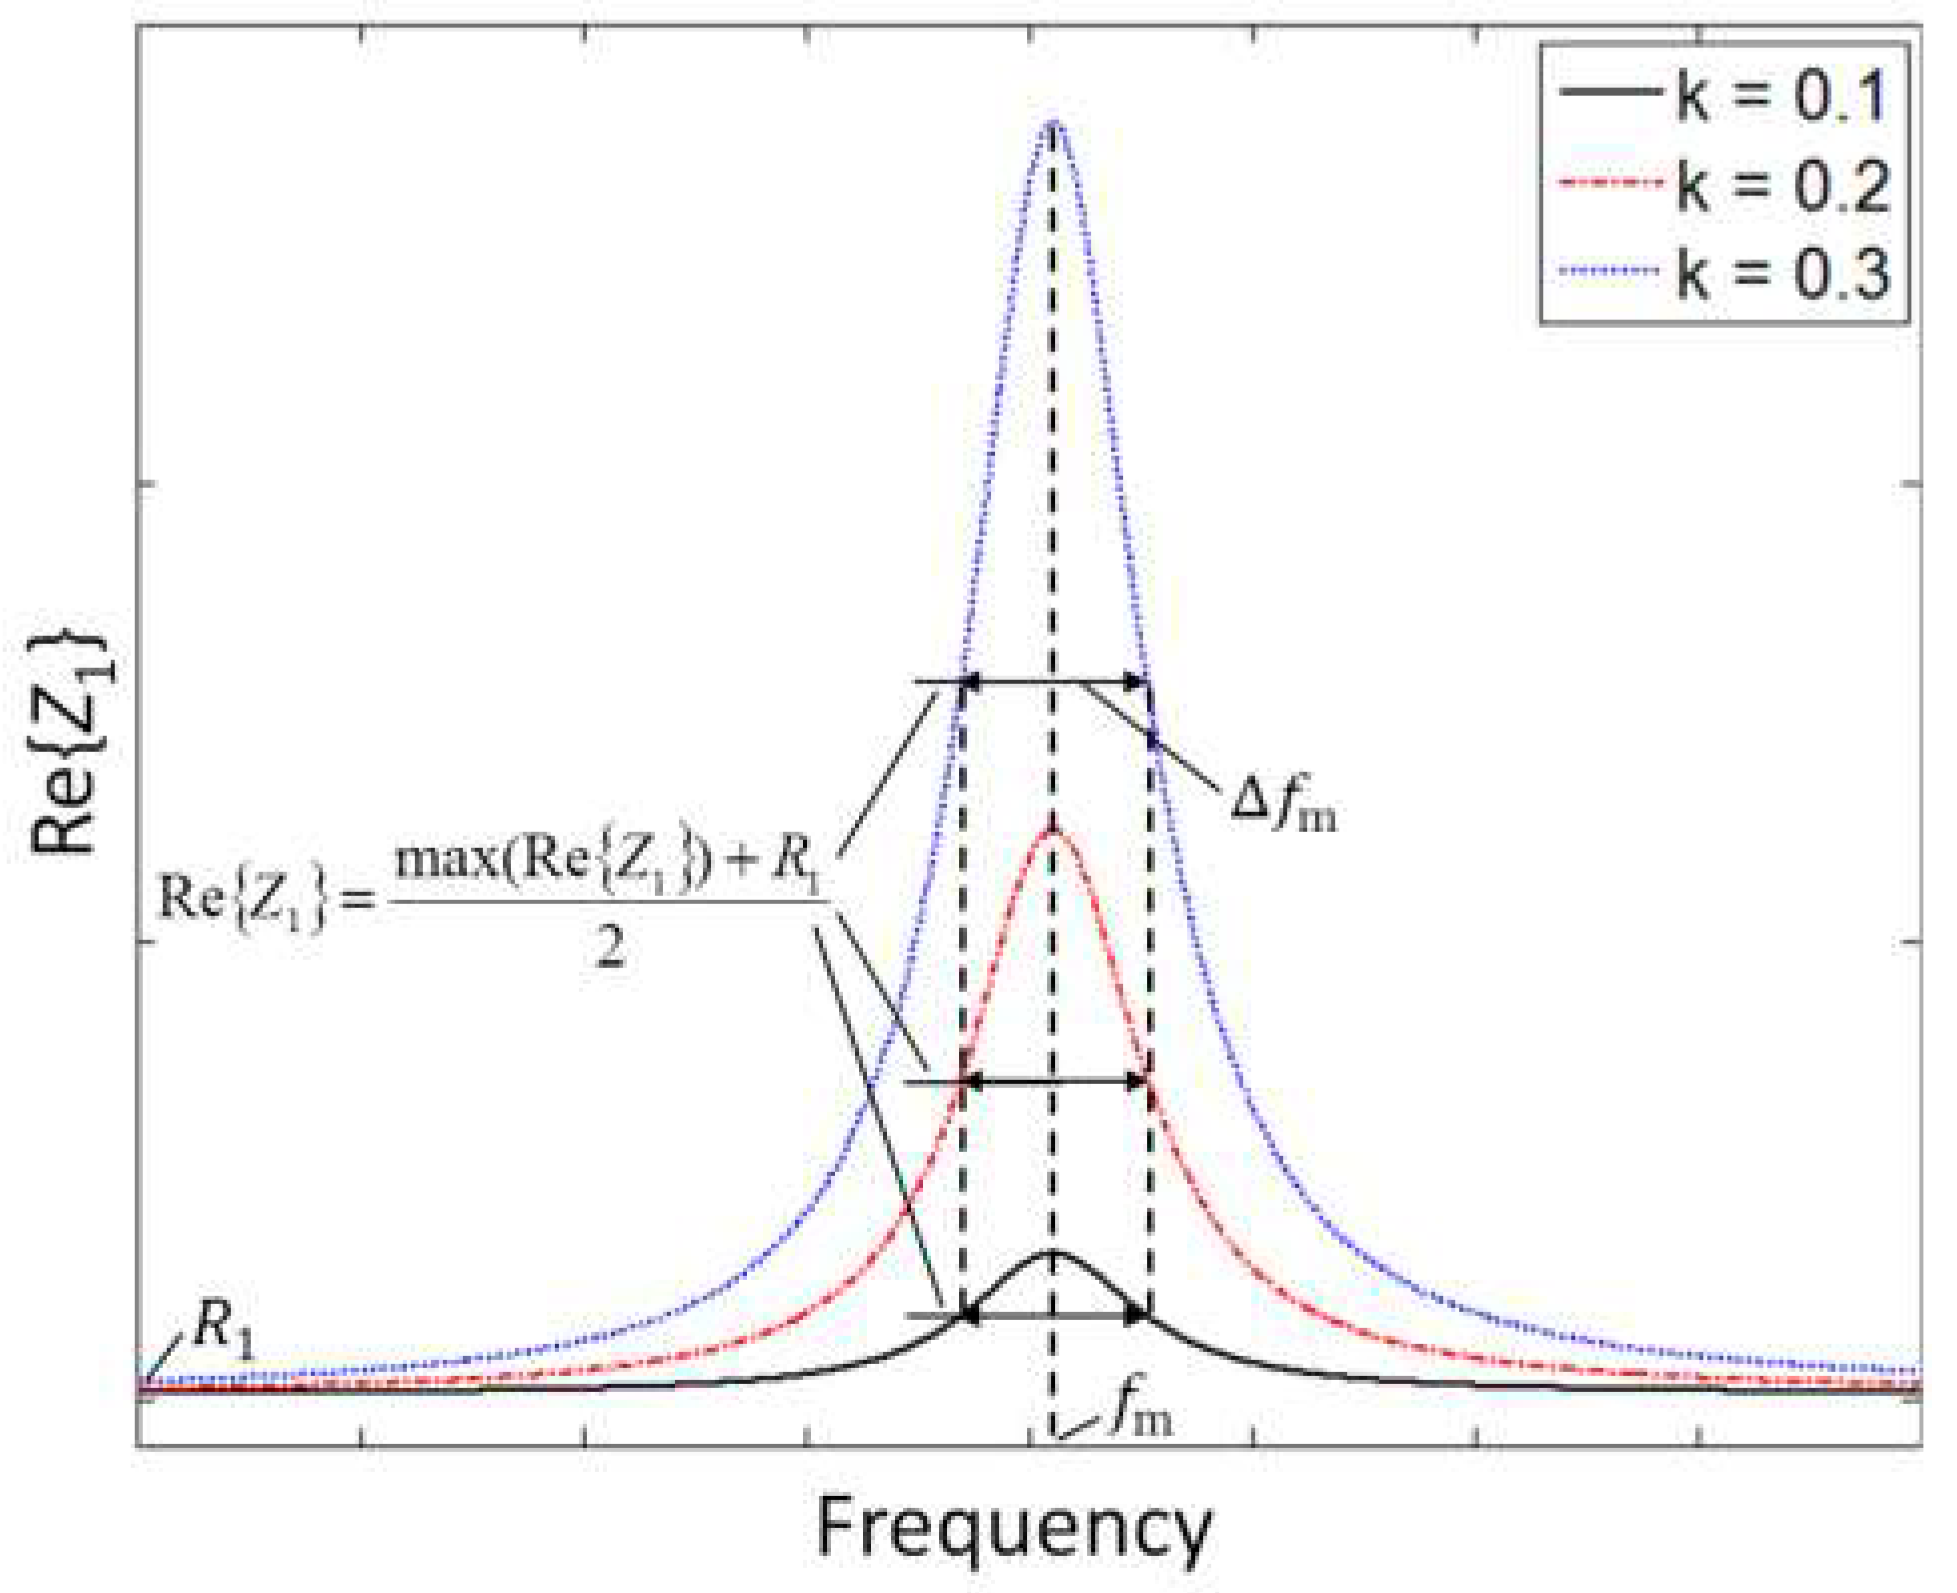
Re{Z1} has a local maximum at the frequency fm = ωm/2π, which can be found by equating to zero the derivative of Equation (4) with respect to ω. Interestingly enough, fm is independent of k, and it can be related to fS and QS only. Then, combining Equations (1) and (4), the following relations hold:
where Δfm is the full width at half maximum (FWHM) of Re{Z1}, around fm [20]. If QS is sufficiently large, then fm ≈ fS, with a relative deviation |fm − fS|/fS < 100 ppm for QS > 50. Equations (4) and (5) demonstrate that from the measurement of fm and Δfm in Re{Z1}, the frequency fS and quality factor QS of the capacitive RSU can be advantageously extracted independently from k. Figure 4 shows sample plots of Re{Z1} calculated for three different values of k, and illustrates the definition of Δfm. Consistently with Equation (4), k only affects amplitude.
The operating principle of the time-gated technique is shown in Figure 5a [21]. It comprises two subsequent alternating phases, namely, excitation and detection phases. During the excitation phase, when the switch is in the E position, CL1 is connected to the sinusoidal signal vexc(t) to excite the RSU through inductive coupling. During the subsequent detection phase, when the switch is in the D position, the excitation signal is disconnected, and CL1 is connected to a readout circuit with a high-impedance input, resulting in a virtually zero current in CL1.
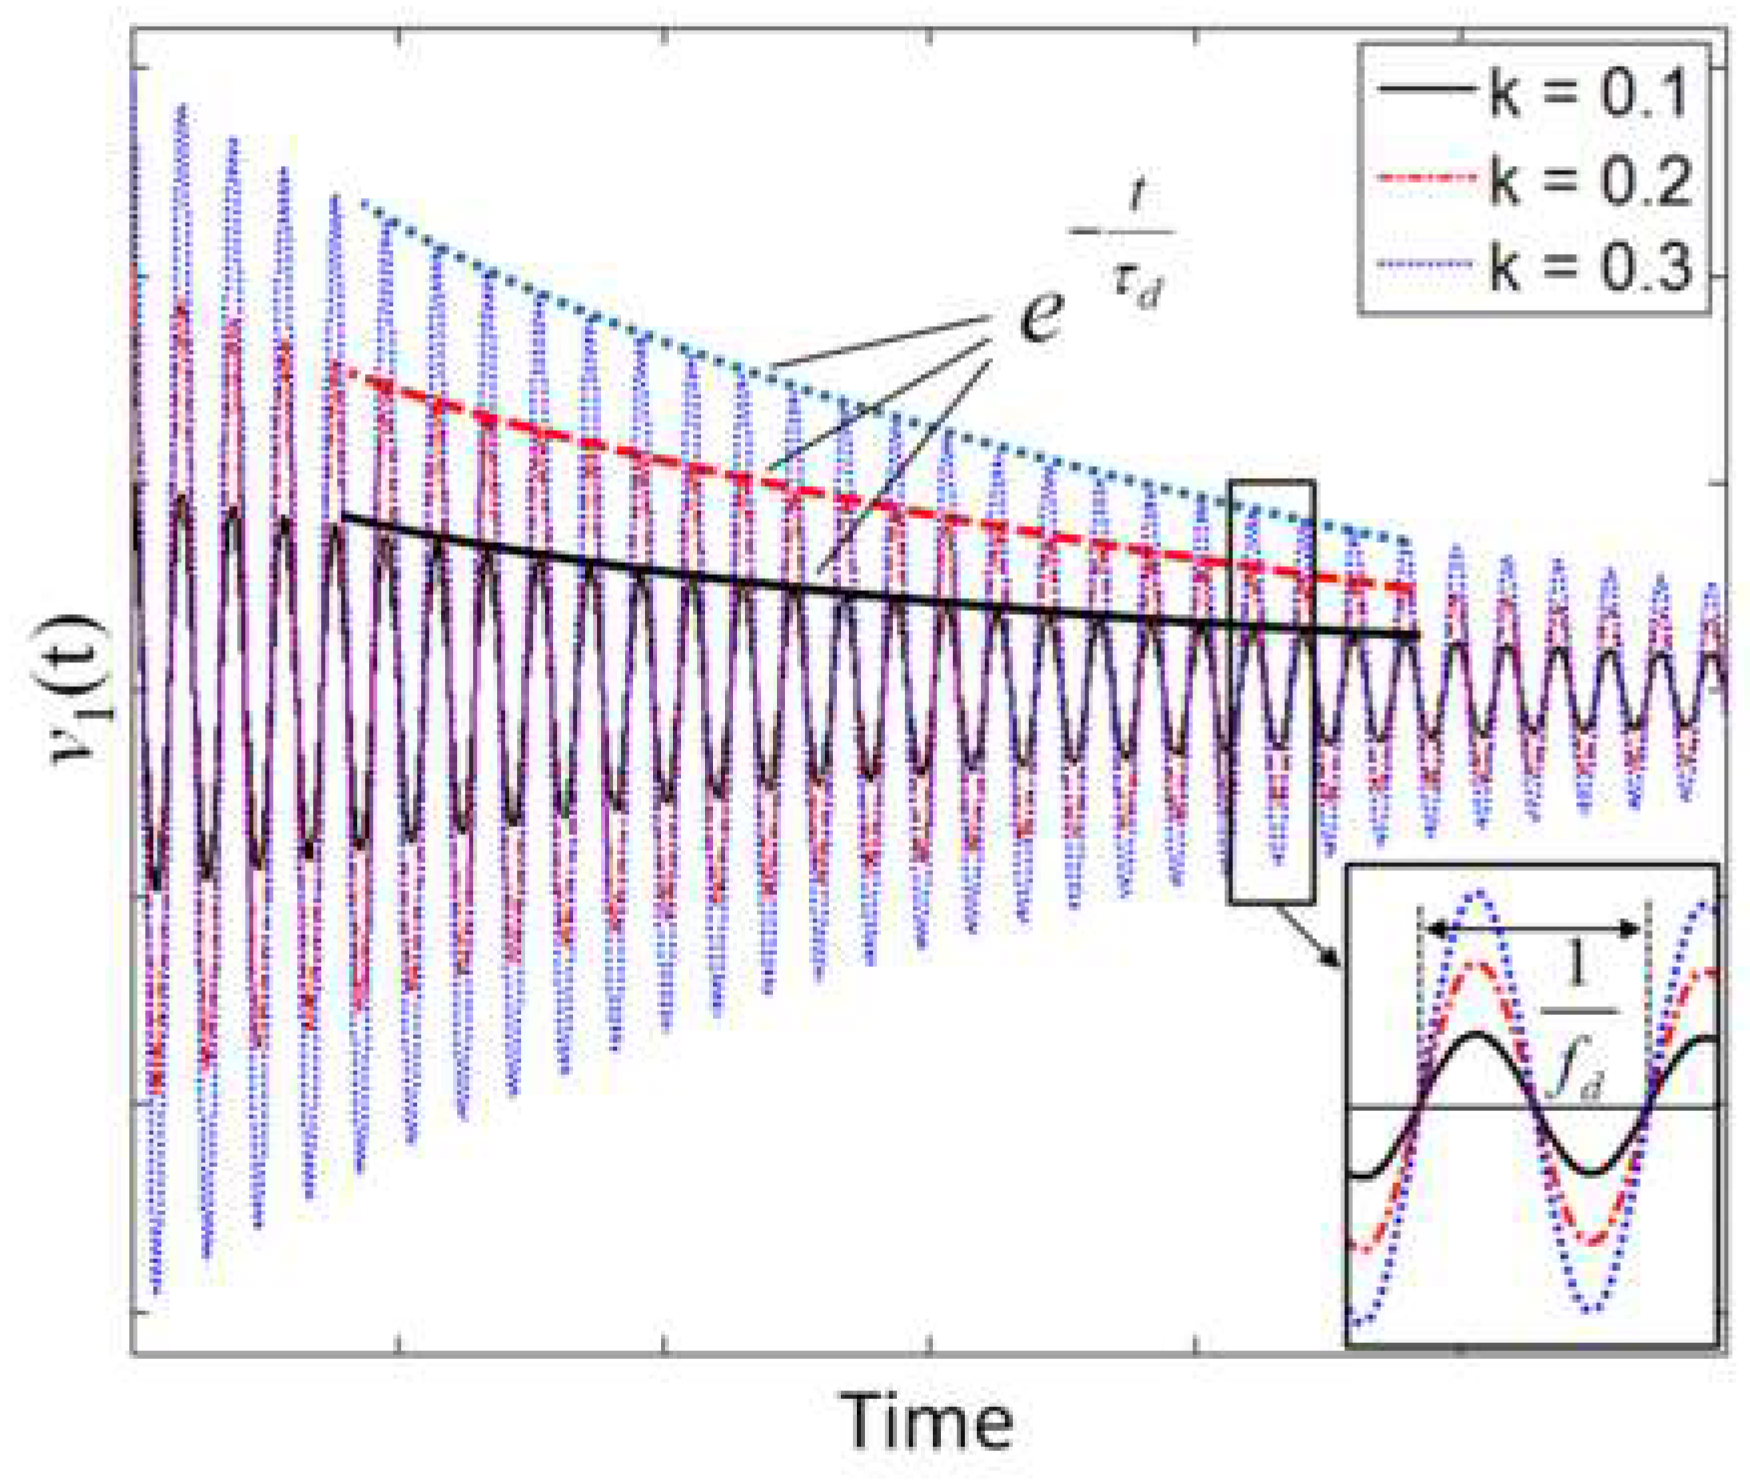
The input voltage v1(t) of the readout circuit during the detection phase D can be derived by taking the inverse Laplace transform of the corresponding voltage V1(s), where s is the complex frequency. Since the RSU forms a second order LCR network, the voltage v1(t) is expected to be a damped sinusoid with frequency fd and a decay time τd from which the resonant frequency fS and the quality factor QS of the RSU can be inferred.
Generally, assuming that the detection phase D starts at t = 0, the readout voltage v1(t) depends on the initial conditions at t = 0 of all the reactive elements, namely CS, L1, L2, and M. The effect of the initial conditions on v1(t) for t > 0 is to globally affect only its starting amplitude, while the complex frequencies of the network, that define fd and τd, are unaltered. Therefore, without losing any generality, the single initial condition VCS0 defined as the voltage across CS at t = 0 can be considered, neglecting the remaining ones. As an equivalent alternative that does not change the consequences of the present treatment, VCS0 can also be seen as an effective initial condition.
As a result, the equivalent circuit of Figure 5b representing the time-gated configuration during the detection phase in the Laplace domain can be considered, and the expression of V1(s) is
The corresponding time expression v1(t) can be calculated:
The signal v1(t) is a damped sinusoid with damped frequency fd and decay time τd that are related to fS and QS of the RSU as
If QS is sufficiently large, it results in fd ≈ fS, with a relative deviation |fd − fS|/fS < 50 ppm for QS > 50. Notably, the coupling factor k only acts as an amplitude factor on v1(t) without influencing either fd or τd. Figure 6 reports sample plots of v1(t) calculated for three different values of k.
In summary, Equations (7) and (8) demonstrate that, under the assumptions made, the time-gated technique can also allow extraction of the frequency fS and quality factor QS of the capacitive RSU, independently of k.
3.3. k-Independent Techniques Applied to Coil-Coupled Electromechanical Piezoelectric Resonators
Considering the technique based on impedance measurements with reference to the equivalent circuit of Figure 2b, the impedance Z1 measured at the primary coil can be expressed as
As it can be observed in Equation (9), the impedance Z1 depends on the coupling factor k. Nevertheless, also in this case, the frequency fr can be extracted from the frequency of the maximum of the real part of Z1.
Close to the angular frequency ωr = 2πfr, the impedance of the motional arm Zr = Rr + jωLr + 1/(jωCr) has a magnitude typically much smaller than that of the impedance of C0, i.e., |Zr| << 1/ωC0. Then, the presence of C0 can be neglected, resulting in the simplified equivalent circuit of Figure 7a. Accordingly, Re{Z1} around ωr has the following approximated expression:
Equation (10) has the same form as Equation (4) and, hence, Re{Z1} has a maximum at the frequency fm_r given by
It can be observed that for large Qr2, fm_r ≈ fr2 with a deviation |fm_r − fr2|/fr2 < 100 ppm for Qr2 > 50. In addition, assuming that L2 << Lr, the frequency fr2 approximates fr and, hence, fm_r ≈ fr holds. Similarly, if R2 << Rr, Qr2 approaches Qr. Importantly, again, the coupling factor k acts only as an amplitude factor that advantageously does not affect either the frequency or the quality factor of the resonance.
Considering, now, the frequencies ω >> ωr, the impedance magnitude of C0 is smaller than the impedance magnitude of Zr, which then can be neglected, obtaining the equivalent circuit of Figure 7b. Consequently, the following approximated expression of Re{Z1} results:
Also Equation (12) has the same form as Equation (4), and it can be seen that Re{Z1} now has a maximum at the frequency fm_el:
From the previous analysis, it can be concluded that Re{Z1} has two peaks: the first is related to the mechanical resonance fr, the second to the electrical resonance fel. With the previous assumptions on the values of Lr and L2, and considering that, typically, Cr << C0, then it follows that fel >> fr.
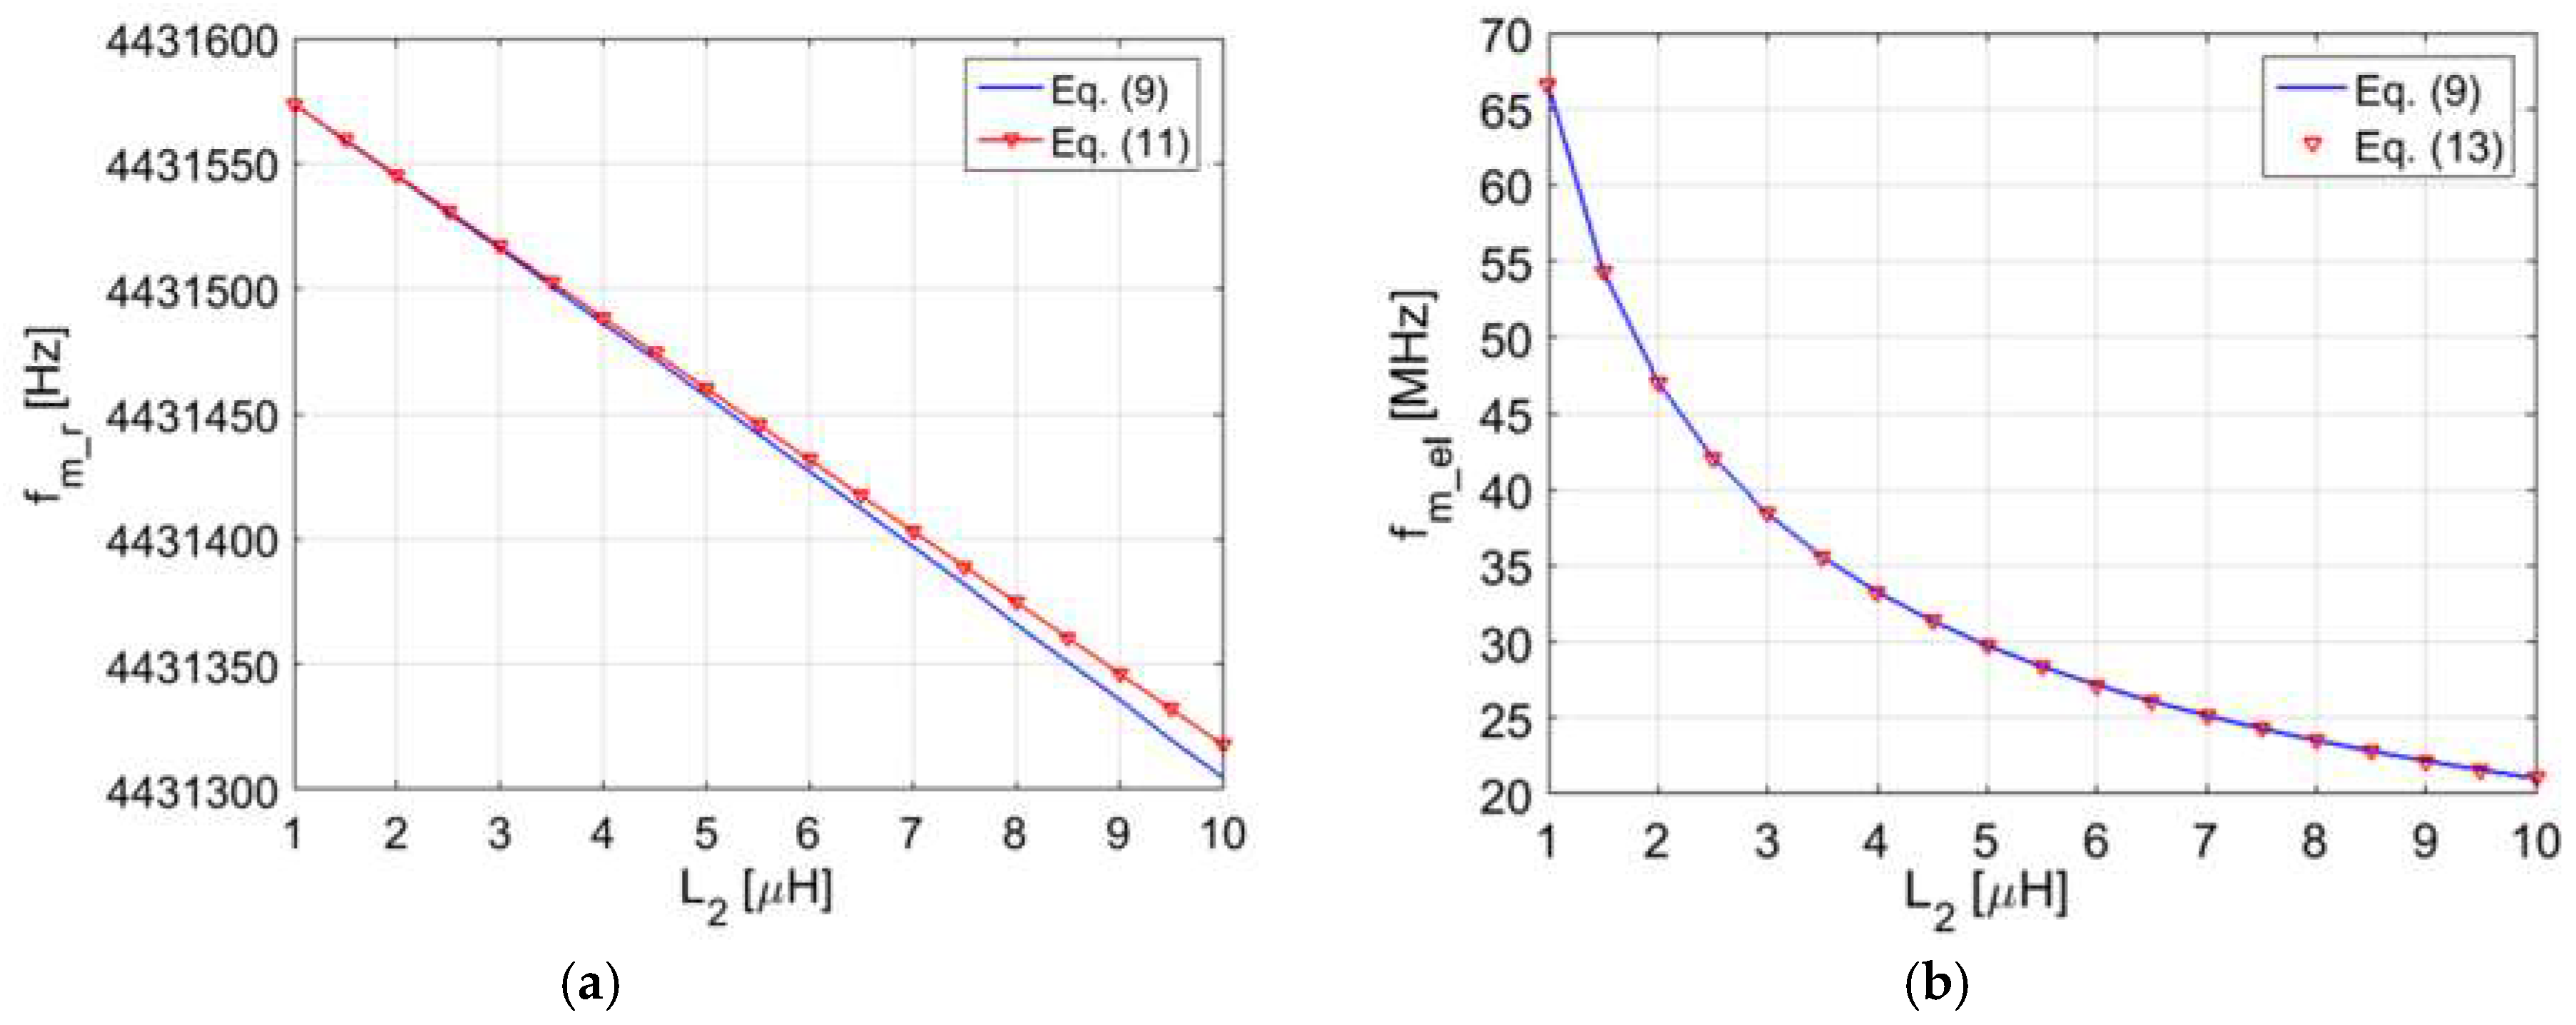
To validate, numerically, the proposed approximations, Figure 8a,b report the comparison of the values of fm_r and fm_el derived respectively from Equations (11) and (13), and the frequency of the maxima derived numerically from Re{Z1} in Equation (9) as a function of L2. The following values of the BVD model of a 4.432 MHz AT-cut QCR have been used: C0 = 5.72 pF, Rr = 10.09 Ω, Lr = 77.98 mH, and Cr = 16.54 fF. For CL1 and CL2, the values of the electrical parameters are L1 = 8.5 µH, R1 = 5 Ω, and R2 = 5 Ω.
Figure 8a shows that for L2 up to 10 µH, the values of fm_r predicted from Equation (11) are within 3 ppm with respect to the numerical solutions from Equation (9). Additionally, for the same range of variation of L2, a remarkable agreement is obtained between fm_el predicted from Equation (13) and the numerical solution.
The possibility to interrogate coil-coupled electromechanical piezoelectric resonators with the time-gated technique independently from the coupling has been previously demonstrated [21].
The RSU configuration of Figure 9 has been studied in [21], showing that the open circuit voltage v1(t) at CL1 during the detection phase, after the RSU has been energized in the excitation phase, is the sum of two damped sinusoids: one at frequency fd_r with exponential decaying time τr, and one at frequency fd_el with exponential decaying time τel.
The damped sinusoid at fd_r is due to the mechanical response of the resonator, while the one at fd_el is due to the electrical response of L2 that interacts with the electrical capacitance C0. In addition, for suitable values of L2 and R2, and considering the typical values of the equivalent parameters of the BVD model of a QCR, the decaying time τr is orders of magnitude larger than τel. Thus, the damped sinusoid at frequency fd_el decays to zero much faster than the damped sinusoid at frequency fd_r. Hence, the former can be neglected in the expression of v1(t), which results in
where the amplitude and phase coefficients Ar and θr are functions of both the initial conditions at the beginning of the detection phase (t = 0), and the electrical and mechanical parameters of the system. The last term represents the contribution of the initial current iL1(0) in the primary inductor. From Equation (14), it can be seen that k acts only as a scaling factor for the amplitude of v1, without affecting the sensor response parameters fd_r and τr. From a simplified analysis that considers the undamped system with R2 = 0 and Rr = 0, under the hypothesis that (ωC0)−1 >> ωL2 at the frequency fr and that Qr is large, it has been obtained that the frequency fd_r can be approximated with the following relation:
It can be observed in Equation (15) that fd_r depends on the ratio between L2 and Lr. Nevertheless, if L2 << Lr the frequency fd_r tends to the resonant frequency fr of the electromechanical resonator. A numerical analysis that allows the calculation of the parameters fd_r and τr of the complete system, is also reported in [21]. The results can be directly compared with Figure 8, the values of the parameters of the BVD model used in the numerical analysis being the same. Also in that case, good agreement between the values of fd_r predicted from Equation (15) and the numerical results have been obtained, with a maximum deviation within 3 ppm for L2 up to 10 µH.
3.4. Effect of Parasitic Capacitance at the Primary Coil on Coil-Coupled Capacitance Sensors
When the proposed techniques are transferred into real electronic circuits, unavoidable nonidealities result in a lumped parasitic capacitance CP that appears in parallel to L1. The parasitic capacitance CP is mainly composed of the parasitic capacitance of the inductor L1, the capacitance of the connections, and the input capacitance of the electronic interface.
The effect of CP is now evaluated, firstly, considering the case of the RSU with the capacitance sensor, extending the treatment of Section 3.2.
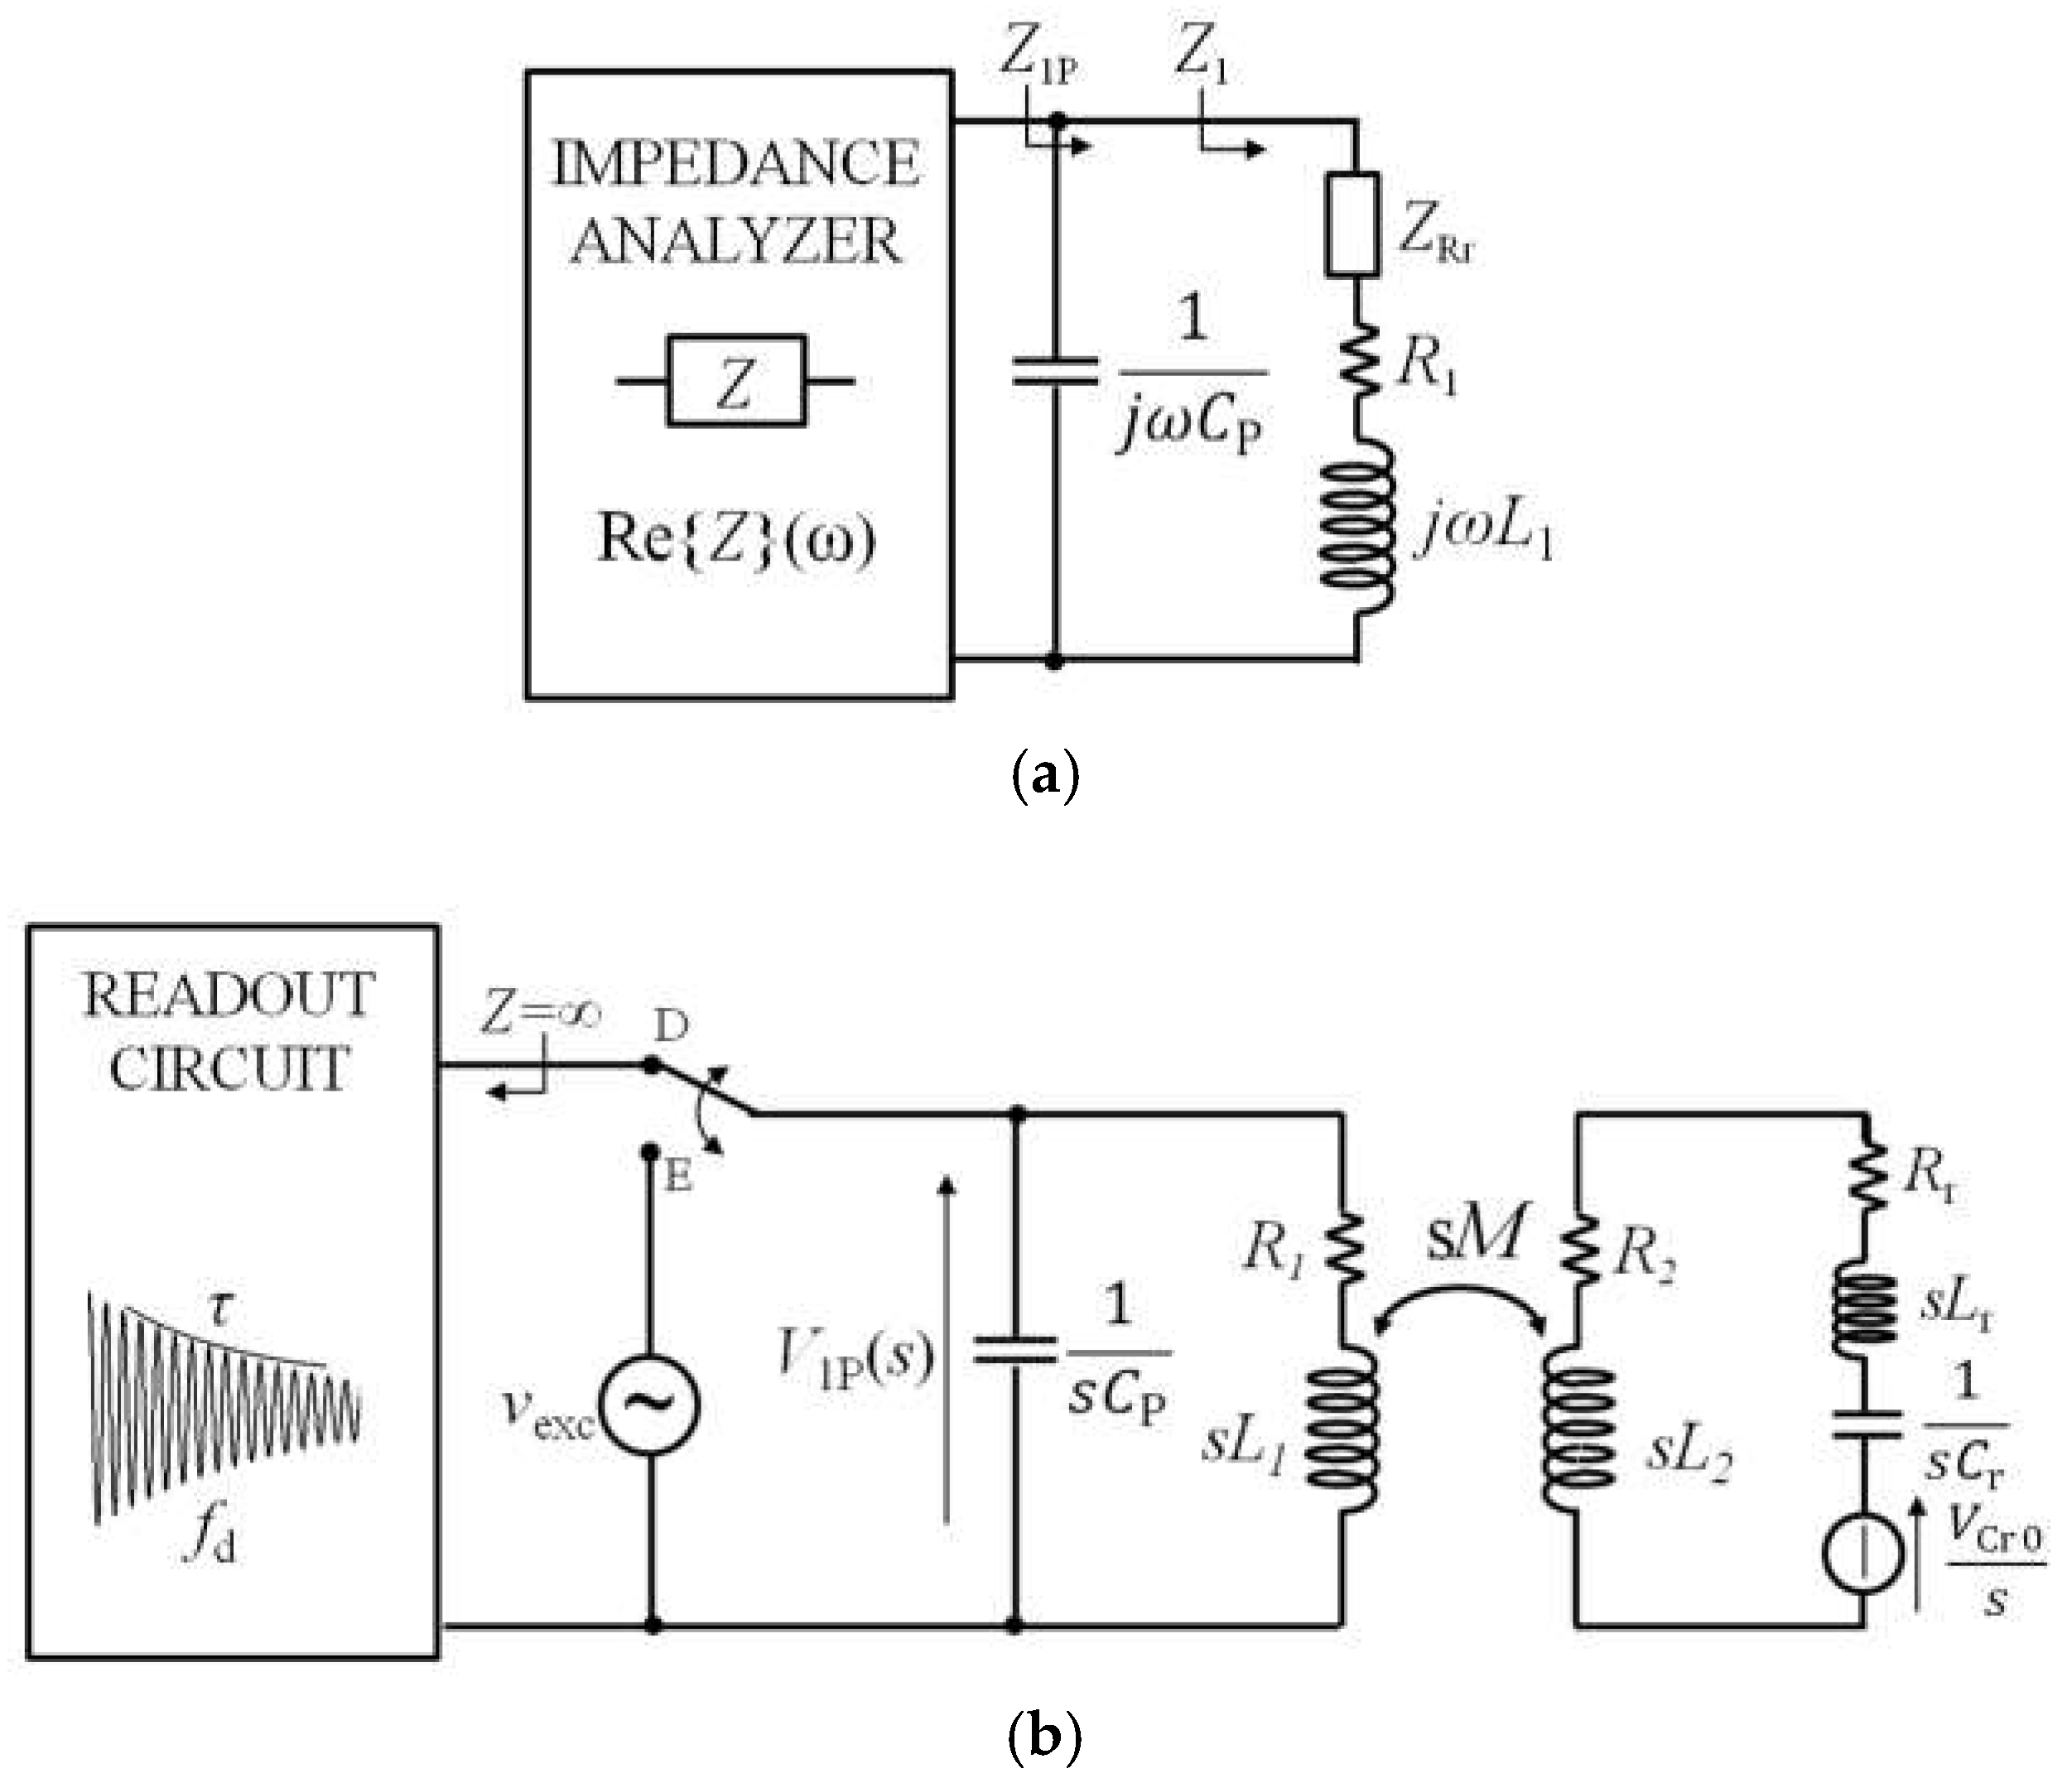
With reference to Figure 10a, the real part of the impedance at the primary coil becomes
As discussed in [23], with CP ≠ 0, Equation (16) no longer allows extraction of fS and QS independently from the coupling factor k, which now is in the expression of Z1P and affects Re{Z1P}, not only as a scaling factor. In particular, it has been shown by a numerical analysis of Equation (16) that Re{Z1P} has two maxima, corresponding, respectively, to a primary resonance near fS and a secondary resonance near . Both the frequencies of the maxima and the trend of Re{Z1P} are influenced by the coupling factor k [23].
Considering now the time-gated technique, the voltage v1P(t) at the primary coil in the detection phase can be obtained from the circuit of Figure 10b. Adopting the same approach as for the case of CP = 0, it will be assumed that all the reactive elements, except the capacitor CS, have zero initial conditions at t = 0. Consequently, the voltage V1P(s) can be expressed in the Laplace domain as
where VCS0 is the voltage across CS at t = 0. From Equation (17), it can be seen that k, besides acting as a scaling factor, also features in the coefficient of fourth degree in the polynomial D(s). Consequently, it is expected that the complex frequencies are dependent on k. Taking the inverse Laplace transform of Equation (17), it results that the expression of v1P(t) is composed of the sum of two damped sinusoids as
where A1 and A2 are amplitude coefficients and θ1 and θ2 are phase angles that depend on the parameters of the circuit and the initial conditions. The frequencies fd1 and fd2 and the decay times, τd1 and τd2 are obtained by the complex conjugate solutions p1,2 = 1/τd1 ± j2πfd1 and p3,4 = 1/τd2 ± j2πfd2 of D(s) = 0.
From the values of p1,2 and p3,4, it can be demonstrated that fd1 is close to fP, while fd2 is close to fS, but both fd1 and fd2 are dependent on k. For R2 sufficiently smaller than R1, a decay time τd2 larger than τd1 can be obtained. In this condition, in v1P(t) the damped sinusoid at fd1 falls off more rapidly than that at fd2, and it becomes negligible as time elapses. Importantly, since fd2 depends on k, the distance-independent operation of the case CP = 0 is now lost.
The dependence of the readout frequency on the coupling factor k, introduced by the parasitic capacitance CP, on both the proposed techniques, is investigated by numerical analysis. For the RSU and CL1, the following sample values, which represent real conditions well, have been considered: L2 = 8 µH, CS = 100 pF, R2 = 3 Ω, L1 = L2, and R1 = 10 Ω. For the impedance technique, the frequency fSP has been calculated from the expression of Re{Z1P}, adopting the definitions in Equation (5). For the time-gated technique, fSP has been calculated from fd2 and τd2, derived from the numerical solution of D(s) = 0, adopting the definitions in Equation (8).
Figure 11 compares the obtained relative deviation (fSP − fS)/fS as a function of the coupling factor k for three different values of CP/CS. For the considered values of the parameters, CP ranges from 1 pF to 10 pF. As it can be observed, (fSP − fS)/fS deviates from zero, corresponding to CP = 0. The deviation increases for increasing k of an amount that augments with CP/CS. Noticeably, both the techniques are equally affected by the inaccuracies introduced by CP, in terms of the dependence of the readout frequency on k. These results demonstrate that CP prevents accurate distance-independent measurements from being obtained.
3.5. Effect of Parasitic Capacitance at the Primary Coil on Coil-Coupled Electromechanical Piezoelectric Resonators
Considering, now, the case with coil-coupled electromechanical piezoelectric resonators, the dependence on k due to CP can be evaluated by using the same numerical approach as discussed in Section 3.3. The resonant frequency frP can be obtained from numerical analysis of the equivalent circuit in Figure 12a for the frequency-domain technique based on impedance Z1P, while the equivalent circuit of Figure 12b must be considered for the time-gated technique to determine V1P(s).
In both the equivalent circuits, the impedance of the static capacitance C0 has been considered high enough to be neglected. For the time-gated technique, CP is expected to give rise to an additional damped sinusoid in v1P(t), with a damped frequency related to CP resonating with L1. However, the numerical simulations have demonstrated that this sinusoid fades out more quickly than the damped sinusoid, due to the QCR response.
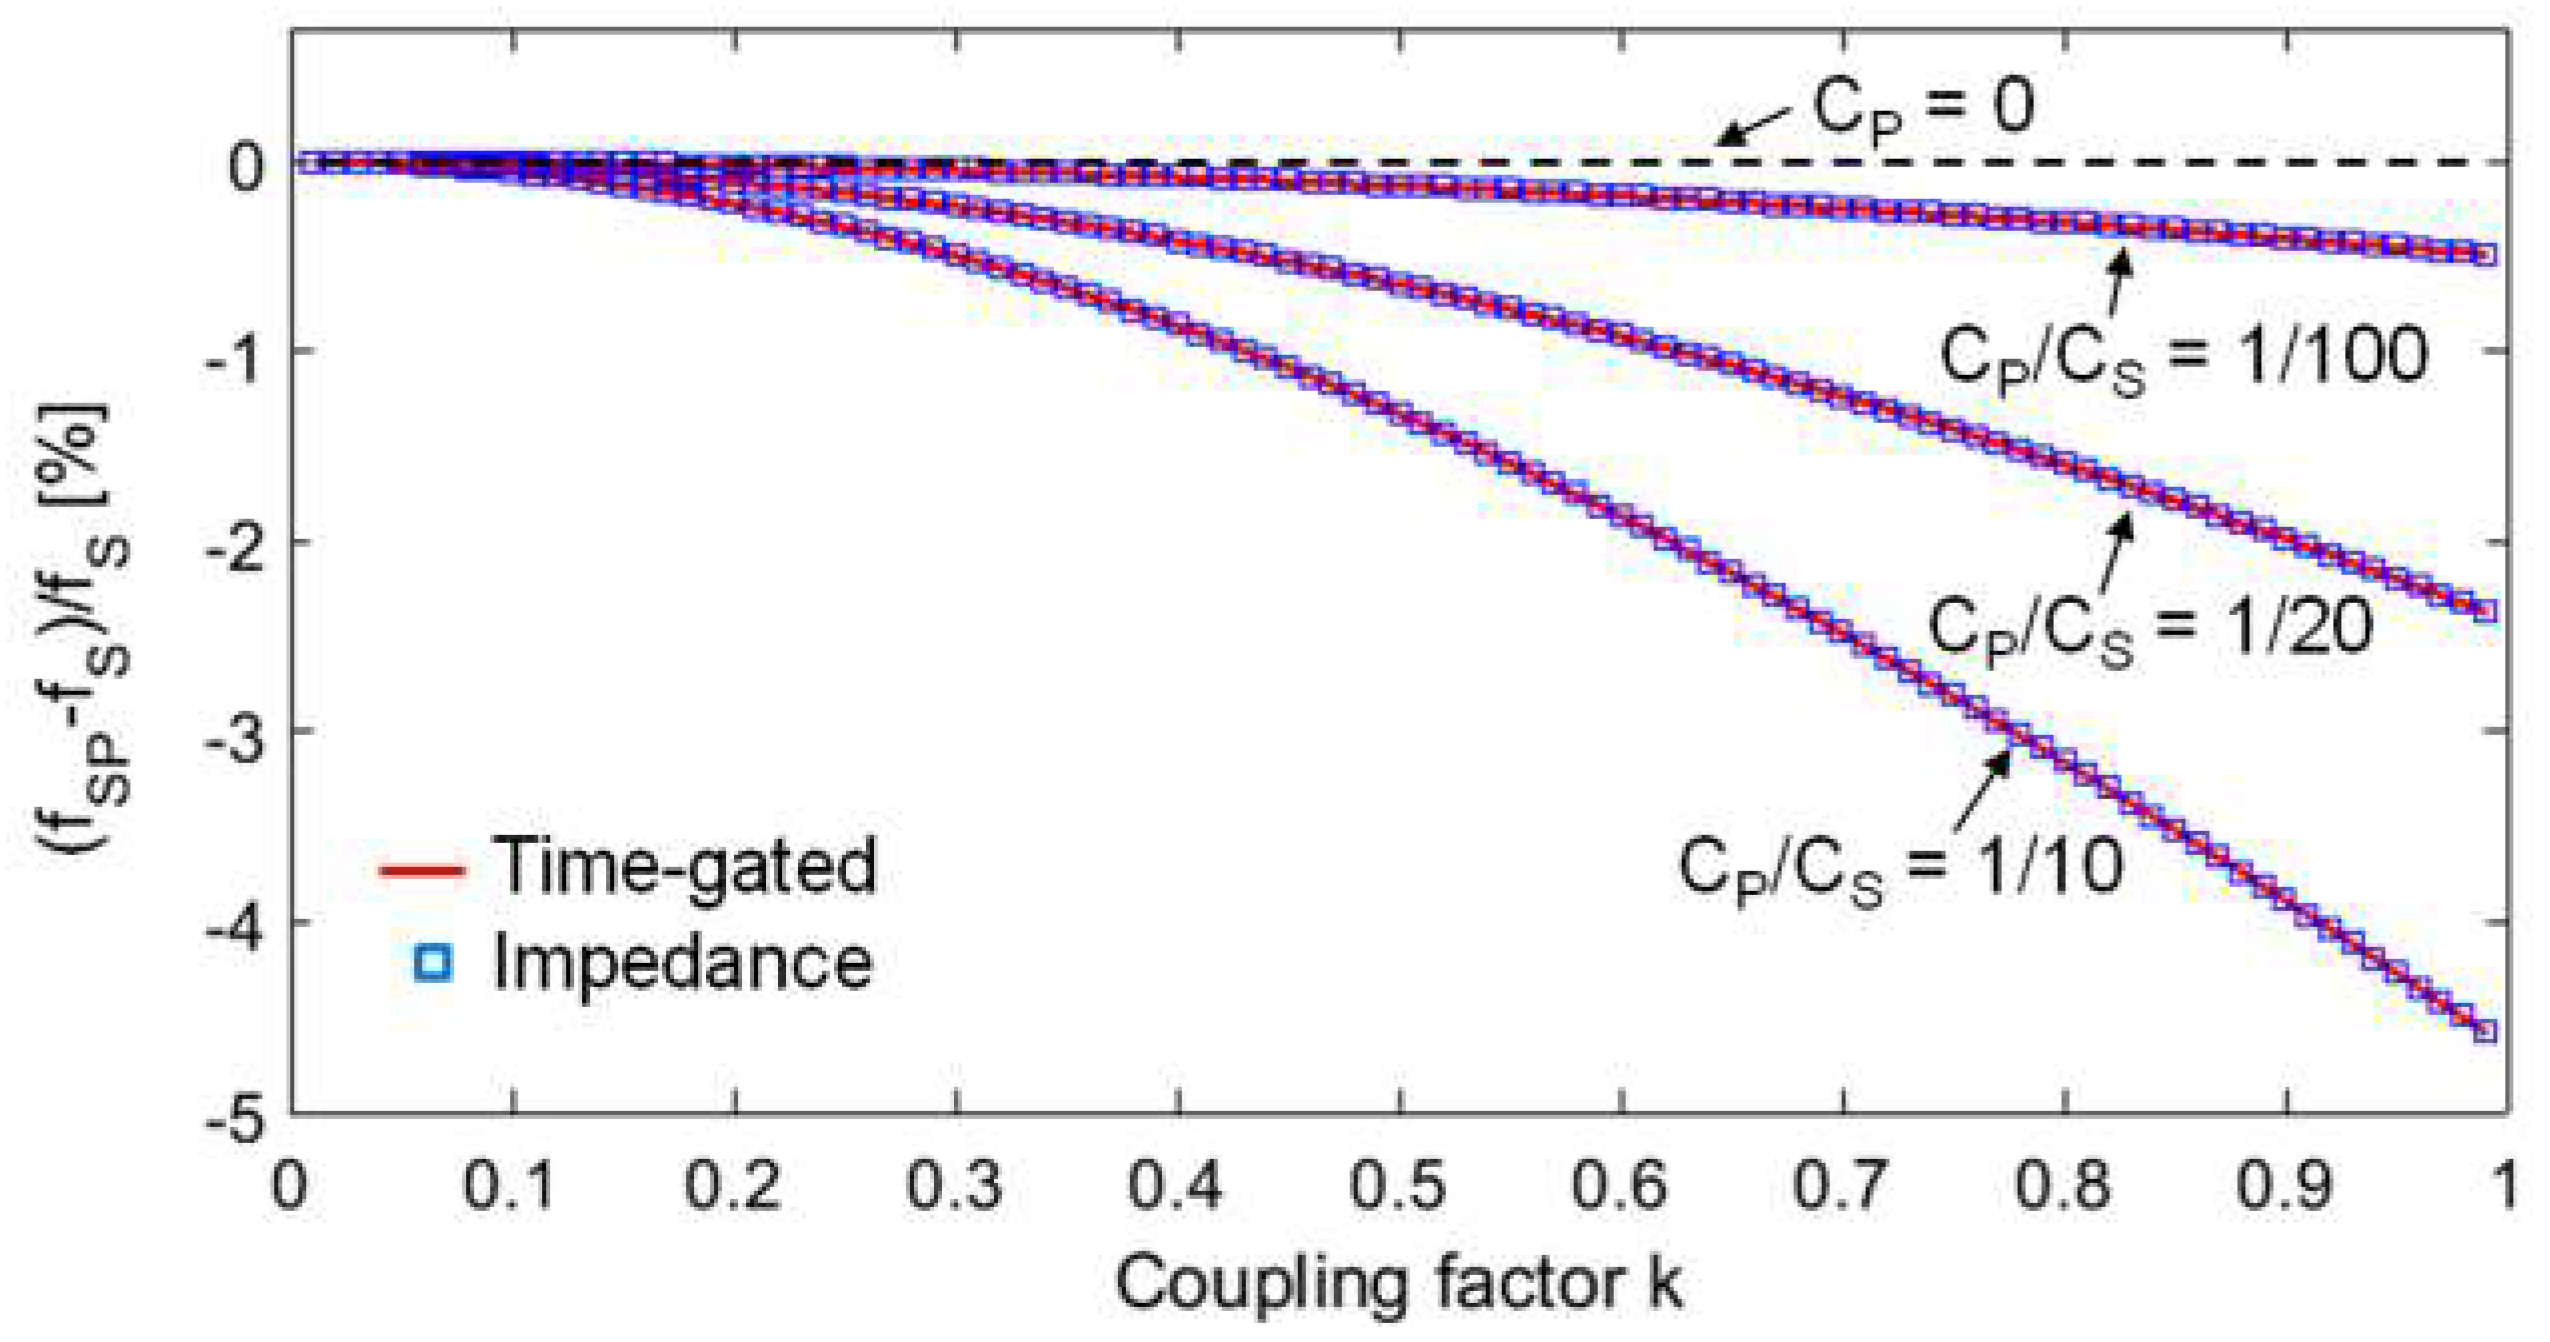
Considering the same parameter values for the QCR as adopted for the analysis of Figure 8, the obtained relative deviation (frP − fr)/fr as a function of k for three different increasing values of the ratio CP/Cr, is reported in Figure 13. For the considered values of the parameters, CP ranges from 1.65 pF to 99.2 pF. The baseline, i.e., the dotted curve corresponding to CP = 0, is at −54.5 ppm because of L2, that slightly affects fr2 and, hence, frP, according to Equation (11). As it can be observed, frP has a maximum variation of less than 4 ppm with respect to the baseline. Remarkably, also in this case, the same behaviour with respect to CP and k is predicted for the two techniques.
The quantitatively negligible dependence of frP on k can be ascribed to the fact that the inductive component in the RSU is dominated by Lr. In fact, Lr is three orders of magnitude larger than L2, and it is not involved in the coupling between the primary coil and the RSU. This result shows that with coil-coupled electromechanical resonators, such as QCRs, the proposed techniques remain practically independent from the coupling factor k, despite a not-negligible CP.
4. Interrogation Techniques and Interface Circuits
4.1. Interrogation System Based on the Impedance-Measurement Technique with Parasitic Capacitance Compensation
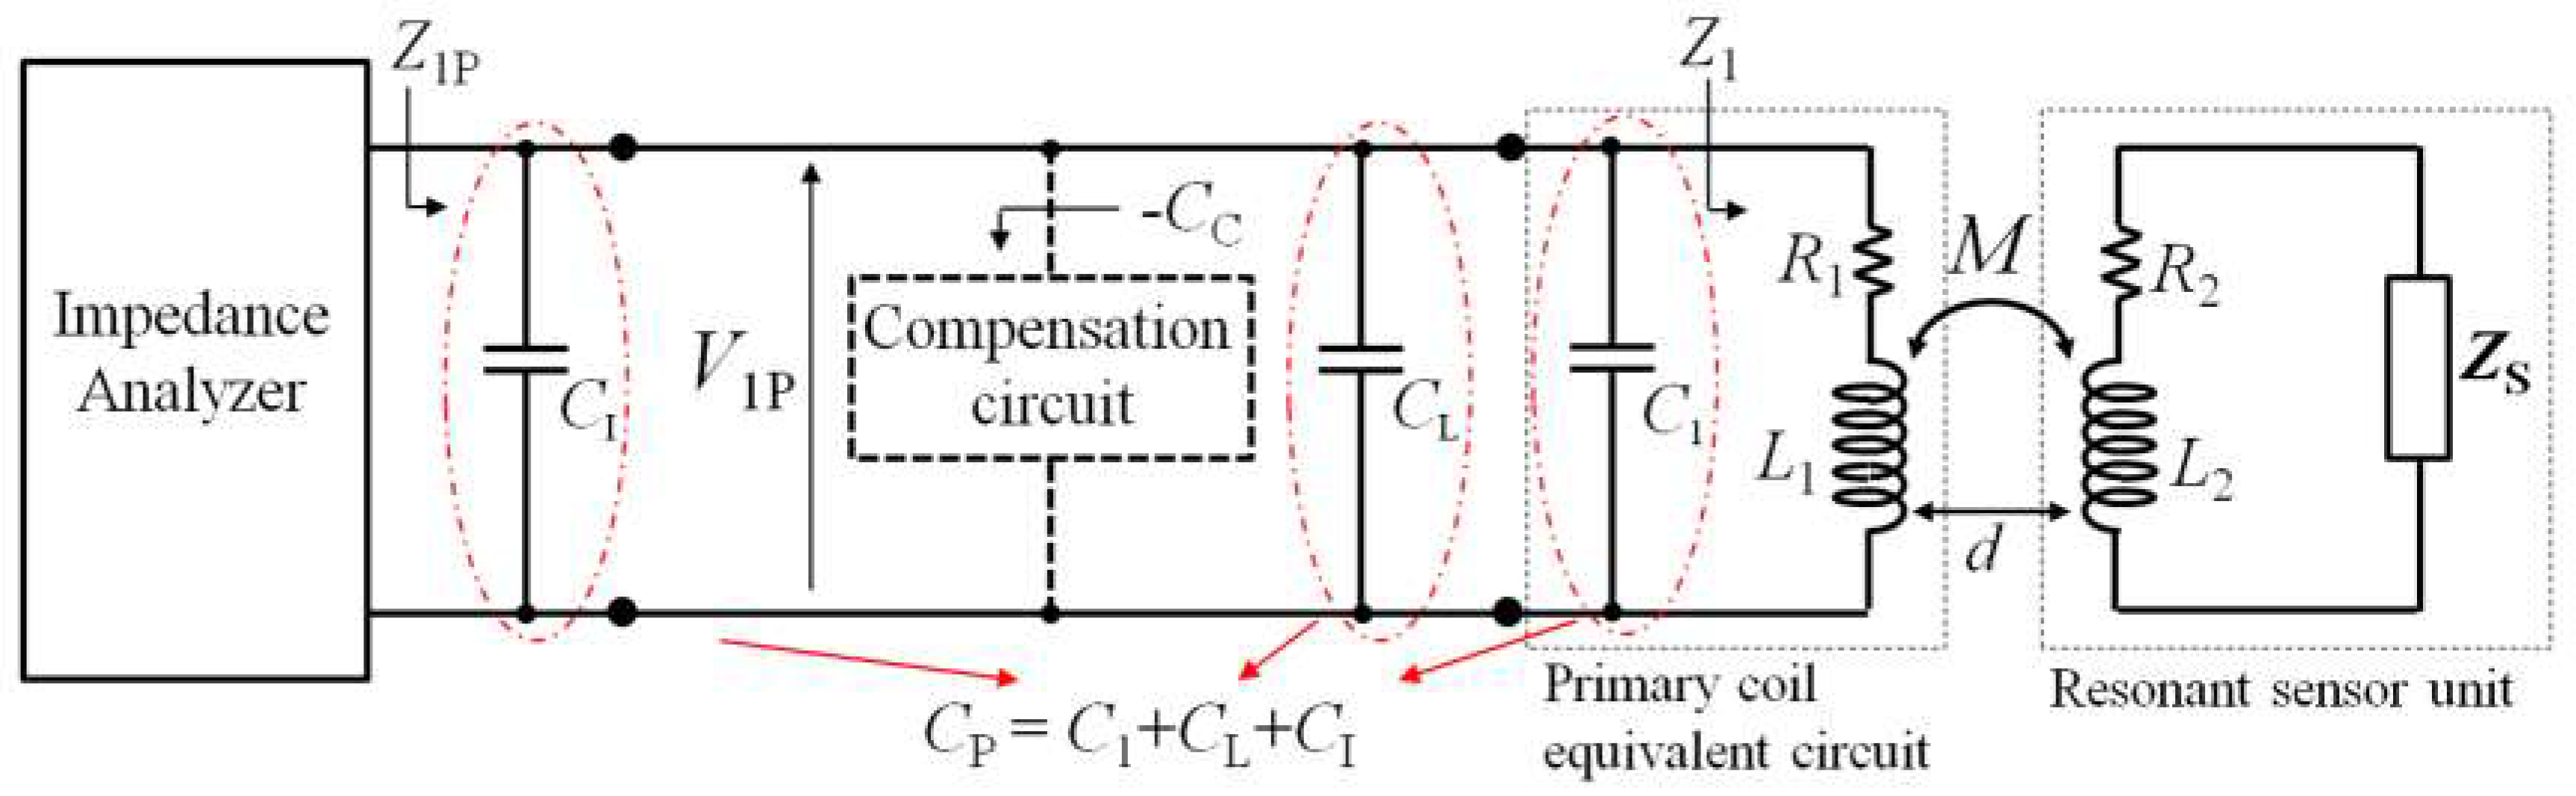
The block diagram of the interrogation system, based on impedance-measurement technique, is reported in Figure 14. The primary coil CL1 is connected to the impedance analyzer. The total parasitic capacitance CP accounts for the contributions given by the parasitic capacitances of CL1, the connections and the equivalent capacitance of the input of the impedance analyzer, represented in Figure 14 with C1, CL, and CI, respectively.
The key idea is that connecting a proper capacitance compensation circuit to the primary coil CL1, it is possible to cancel the effects of CP. The proposed compensation circuit, described in Section 4.3, behaves as an equivalent negative capacitance −CC. The ideal condition, where CP is not present, i.e., Z1P = Z1, can be thus obtained when CC = CP. In the compensated condition, Equation (5) again applies, and k-independent measurements of the resonant frequency and quality factor can be obtained by considering the maximum of the real part of the measured impedance.
4.2. Interrogation System Based on the Time-gated Technique with Parasitic Capacitance Compensation
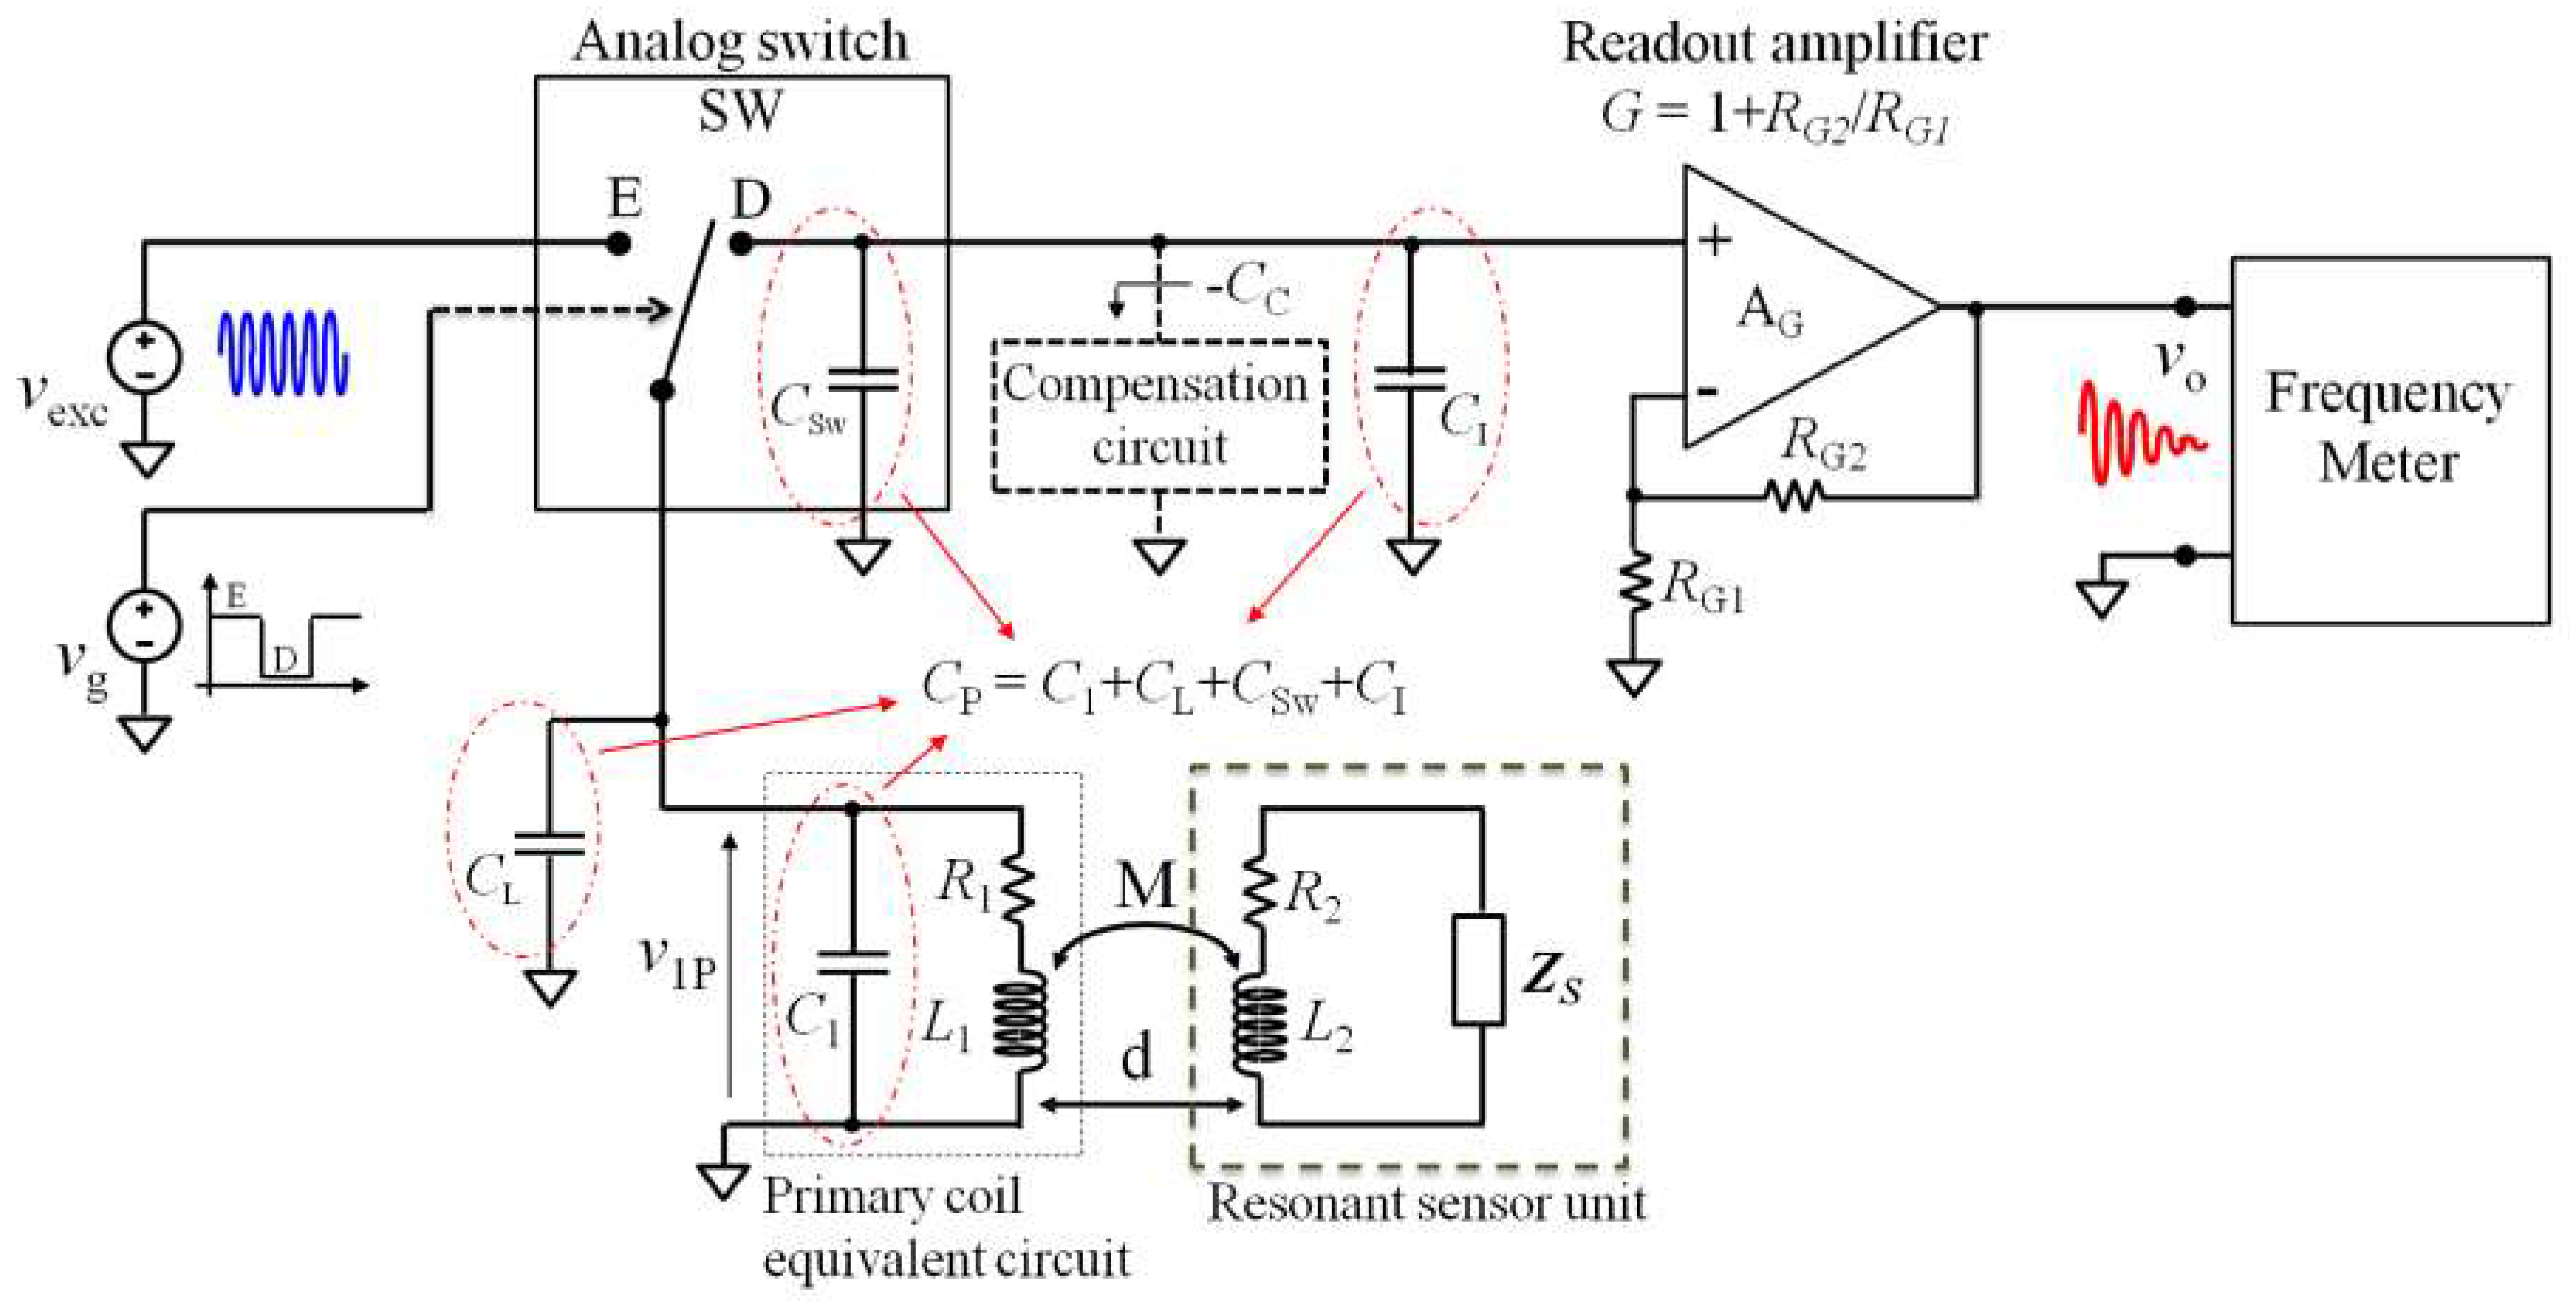
The block diagram of the proposed interrogation system based on the time-gated technique is shown in Figure 15. The analog switch SW, controlled by the square-wave gate signal vg(t), alternatively connects the primary coil to the excitation signal vexc(t) and to the high-input impedance readout amplifier AG during the excitation and detection phases, respectively. The noninverting amplifier AG, with gain G, is based on a high-bandwidth operational amplifier. A frequency meter connected to the output of AG allows measurement of the frequency of the damped sinusoidal signal vO(t).
The total parasitic capacitance CP accounts for the contributions of the parasitic capacitances of the primary coil, the connections, the analog switch SW, and the equivalent input capacitance of the amplifier AG, represented in Figure 15 with C1, CL, CSW, and CI, respectively.
Similarly to what was described in Section 4.1, a proper compensation circuit that behaves as an equivalent negative capacitance −CC can be introduced to cancel CP. In the compensated condition, the frequency and decay time of the damped sinusoidal voltage vO(t) return to be unaffected from the coupling factor k. In this condition, Equation (8) can be used to extract the resonant frequency and quality factor of the RSU from the measured resonant frequency and decay time of vO(t).
4.3. Parasitic Capacitance Compensation Circuit
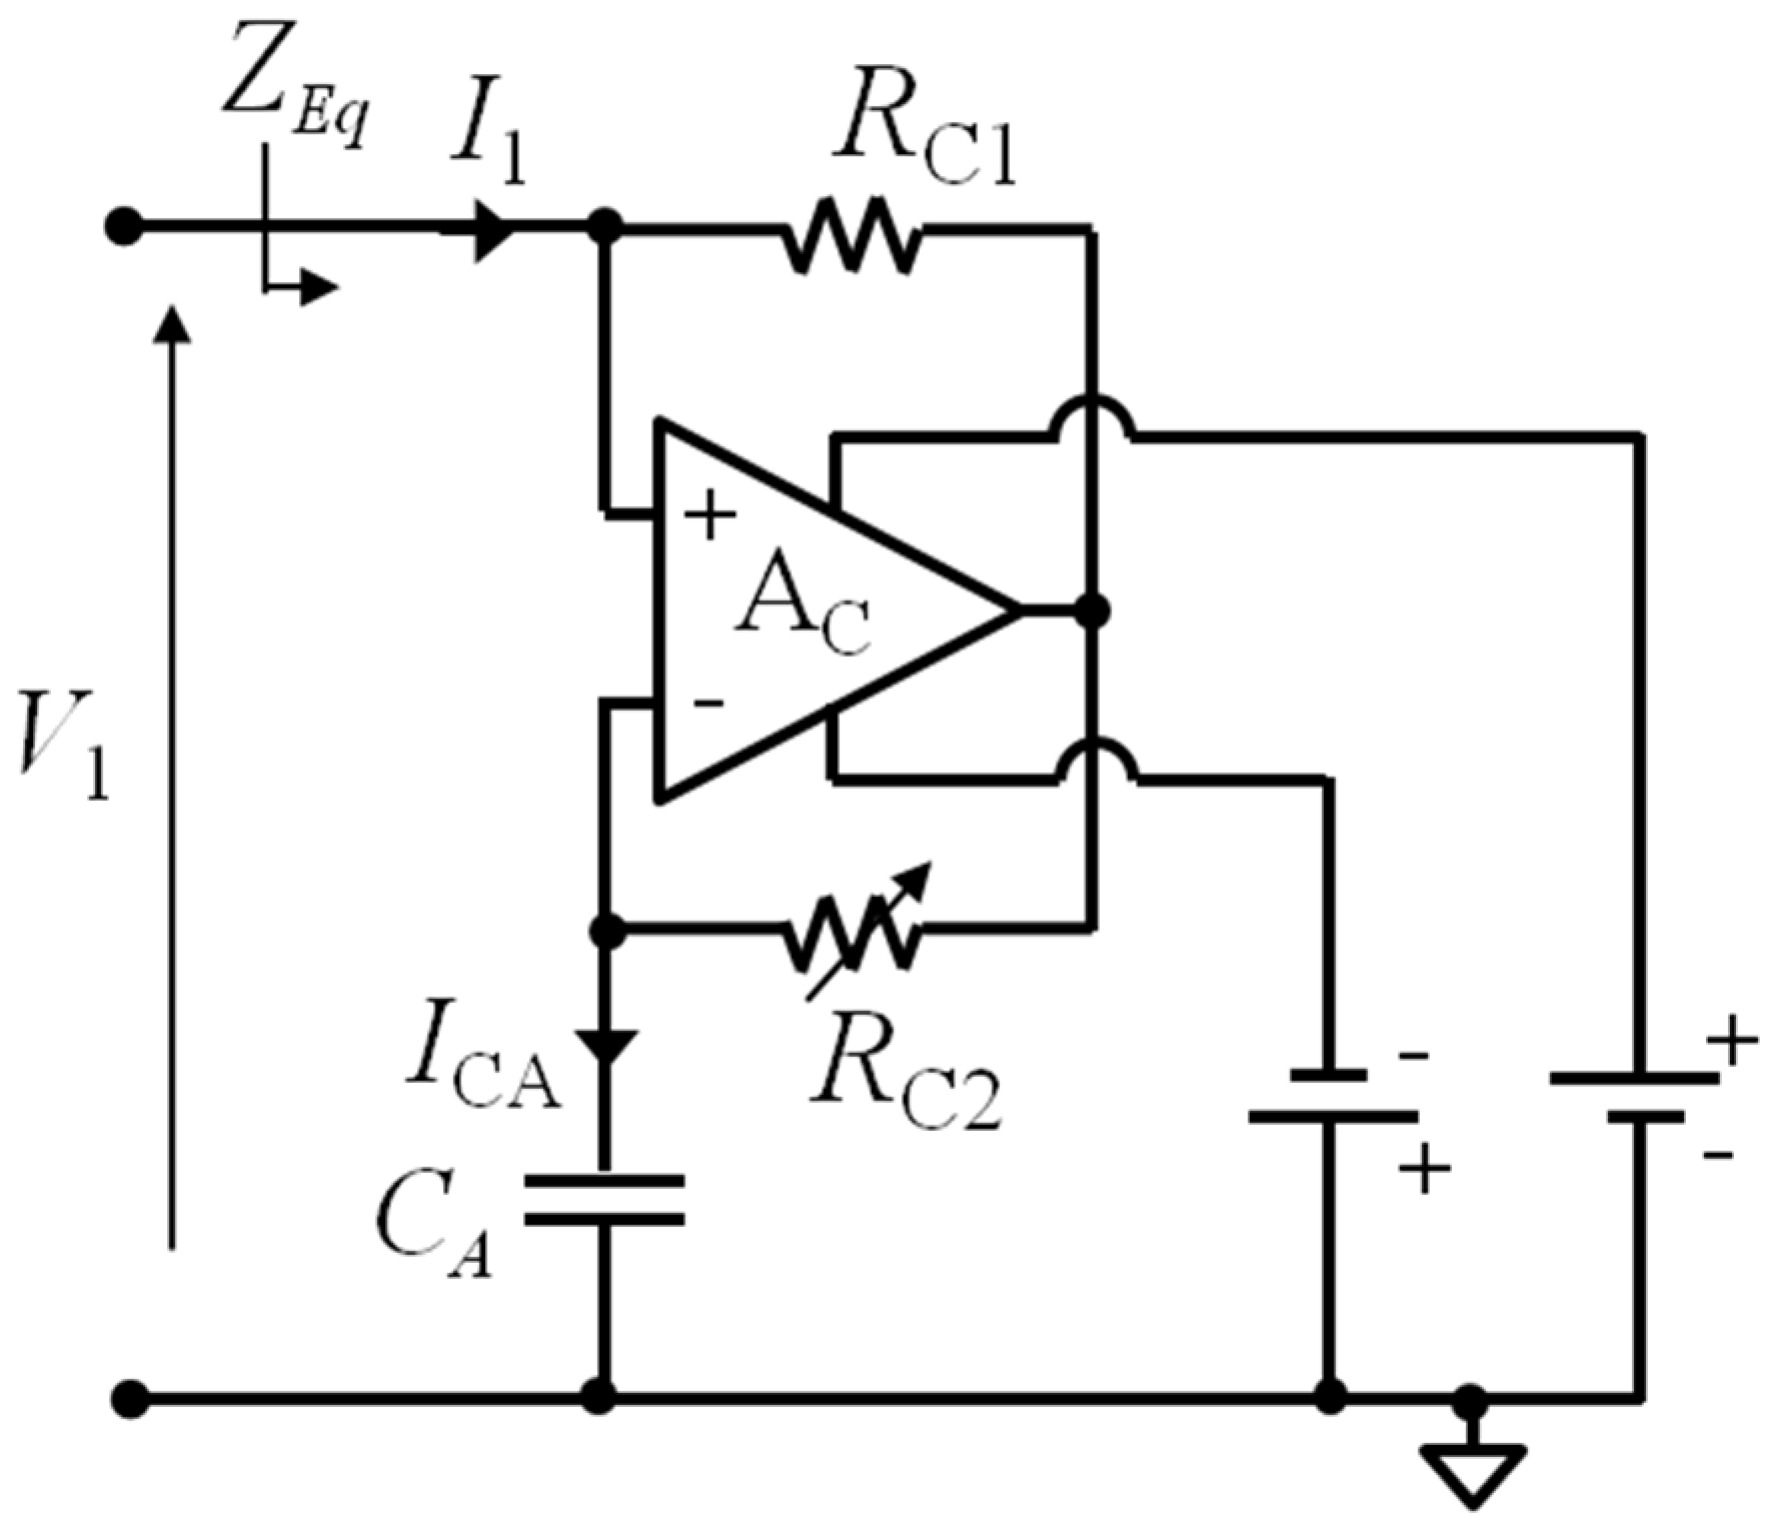
Figure 16 shows the proposed capacitance compensation circuit. It is based on a high-bandwidth operational amplifier AC operating as a negative impedance converter (NIC) to produce an effective negative capacitance −CC. The voltage V1 across CL1 is applied across the reference capacitor CA, thanks to the virtual short circuit at the input of AC. The current ICA through CA is then amplified with gain –RC2/RC1, resulting in the current I1 = −jωCAV1(RC2/RC1). The equivalent input impedance ZEq = V1/I1 is, therefore,
Then, by taking CA and RC1 as fixed, and making RC2 variable, the compensation circuit acts as an adjustable negative capacitance, given by
which can be tuned to compensate and possibly cancel CP.
5. Experimental Results and Discussion
5.1. Impedance Measurements with Coil-Coupled Capacitance Sensor and QCR
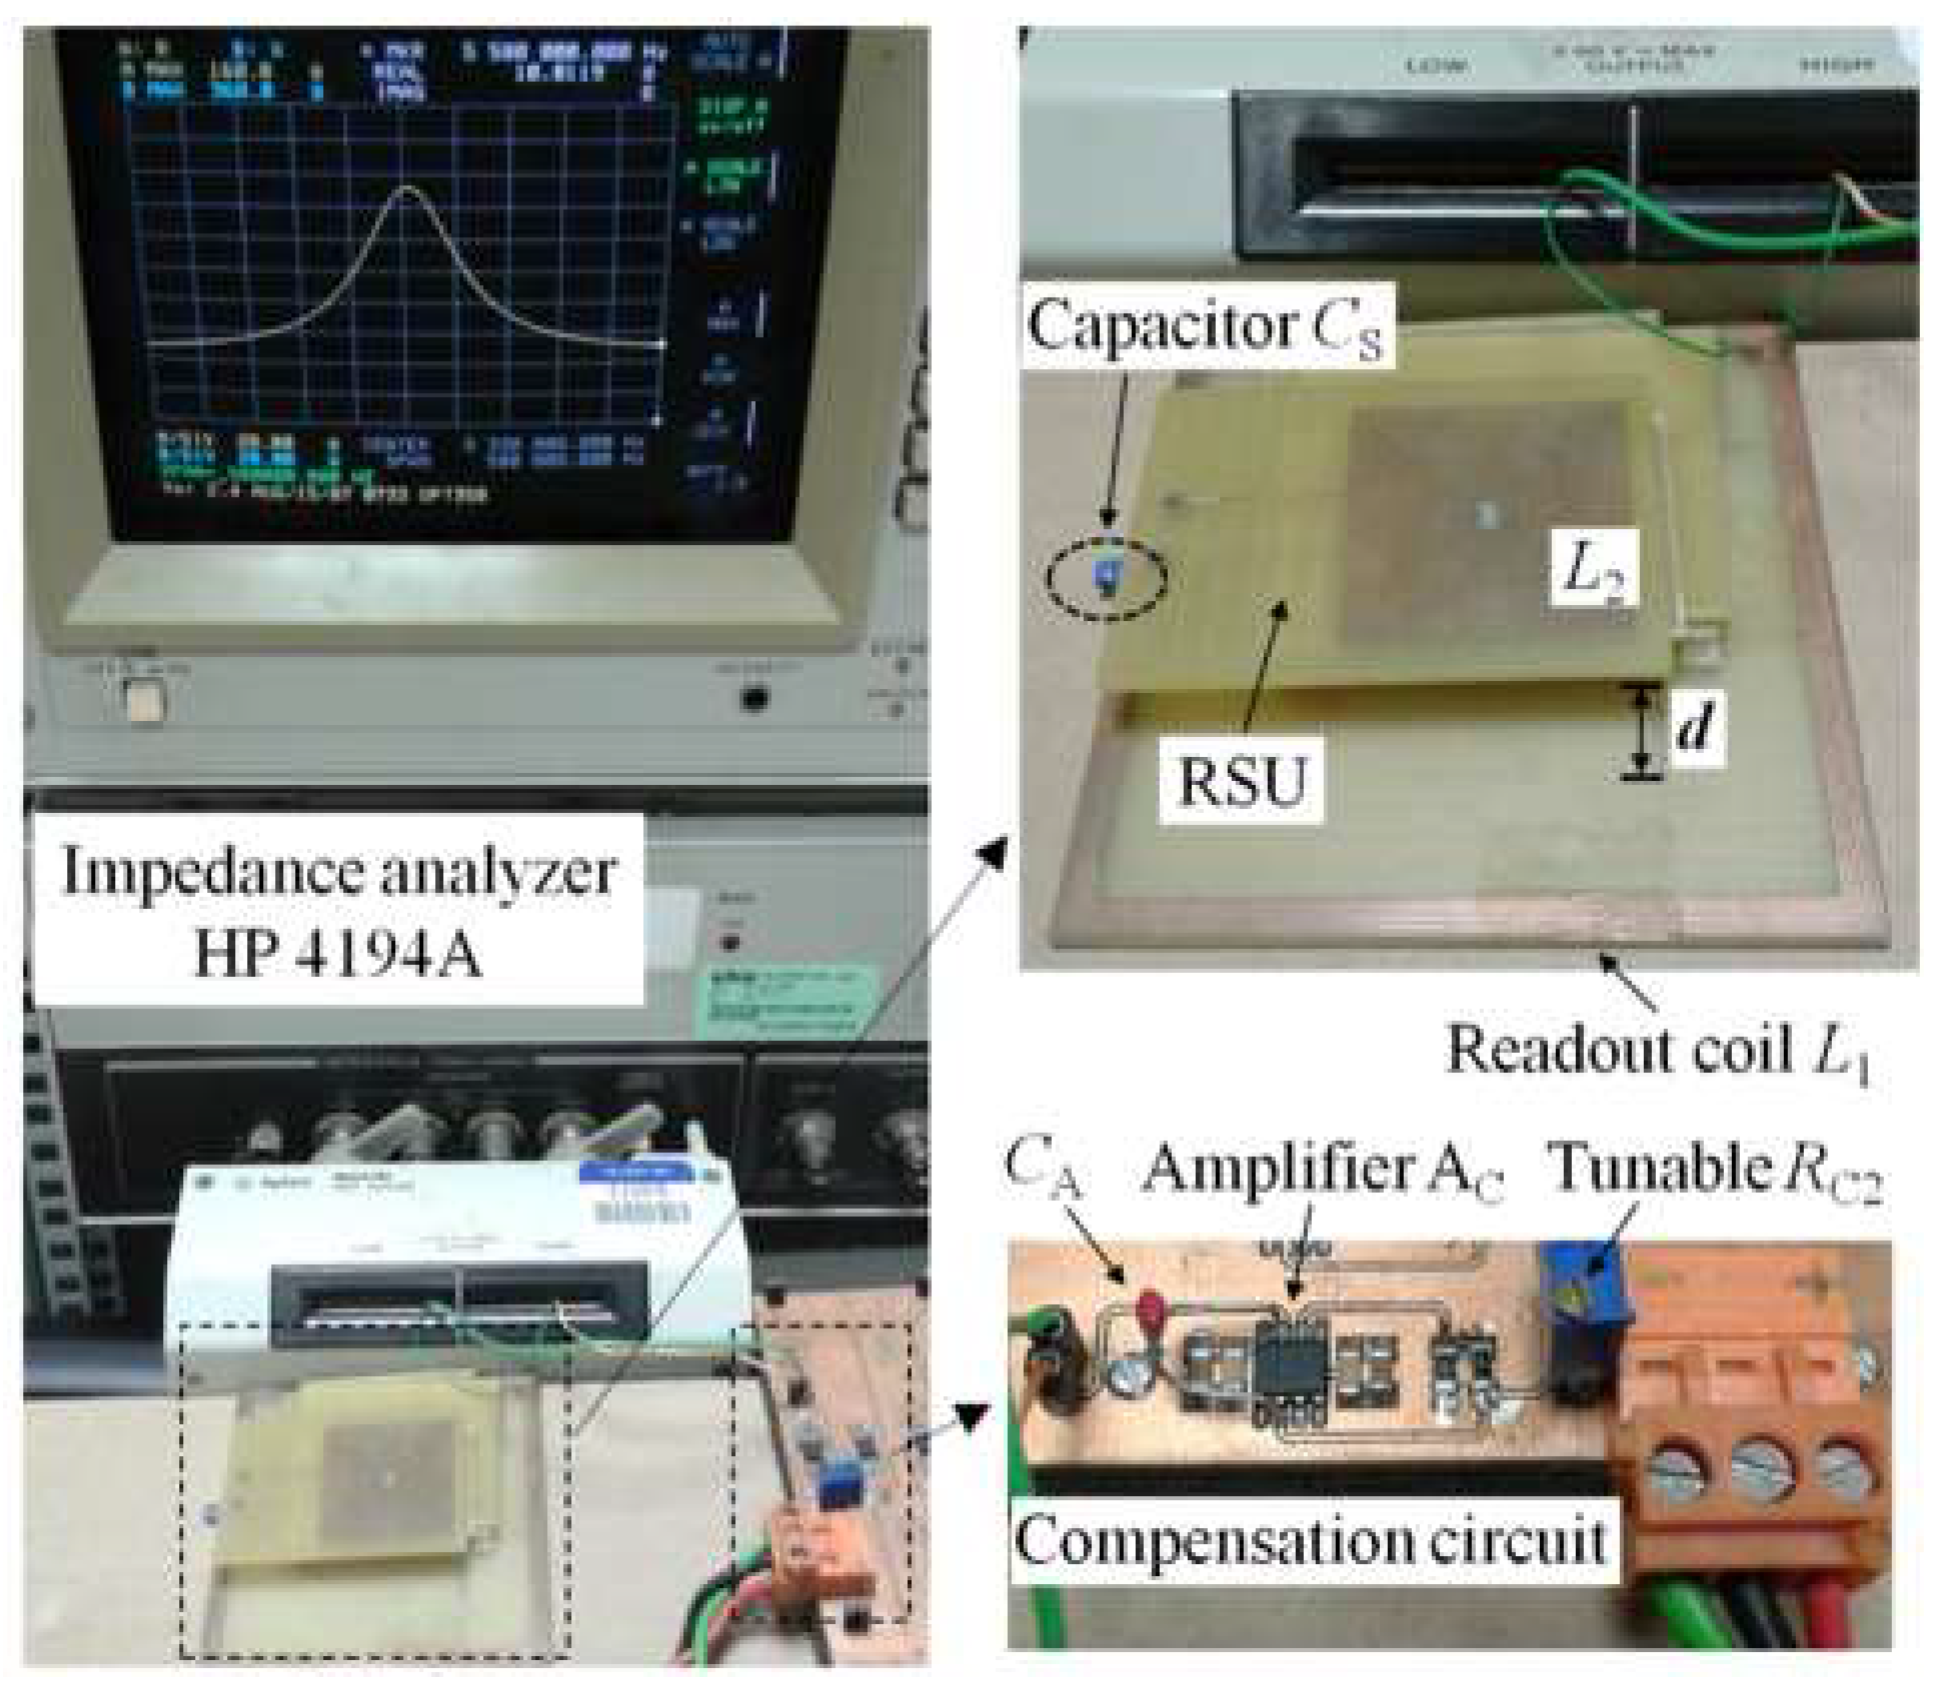
The experimental setup to test the system, according to the frequency-domain technique based on the block diagram of Figure 14, including the compensation circuit of Figure 16, is shown in Figure 17. The AD8045 (Analog Devices, Norwood, MA, USA) is used for the high-bandwidth operational amplifier AC.
For the tests on the capacitance sensor configuration, the RSU is composed of a square planar spiral coil on Printed Circuit Board (PCB) with L2 = 8.51 µH, R2 = 3.2 Ω, and a reference capacitor CS = 100 pF. According to Equation (1), the resulting resonant frequency and quality factor are fS = 5.45 MHz and QS = 91, respectively. A PCB square planar spiral coil has also been used for the primary coil, with L1 = 8.5 µH and R1 = 5 Ω. A fixed capacitor CF = 22 pF is connected in parallel to the primary coil, in order to set the parasitic capacitance and test the effectiveness of the compensation circuit.
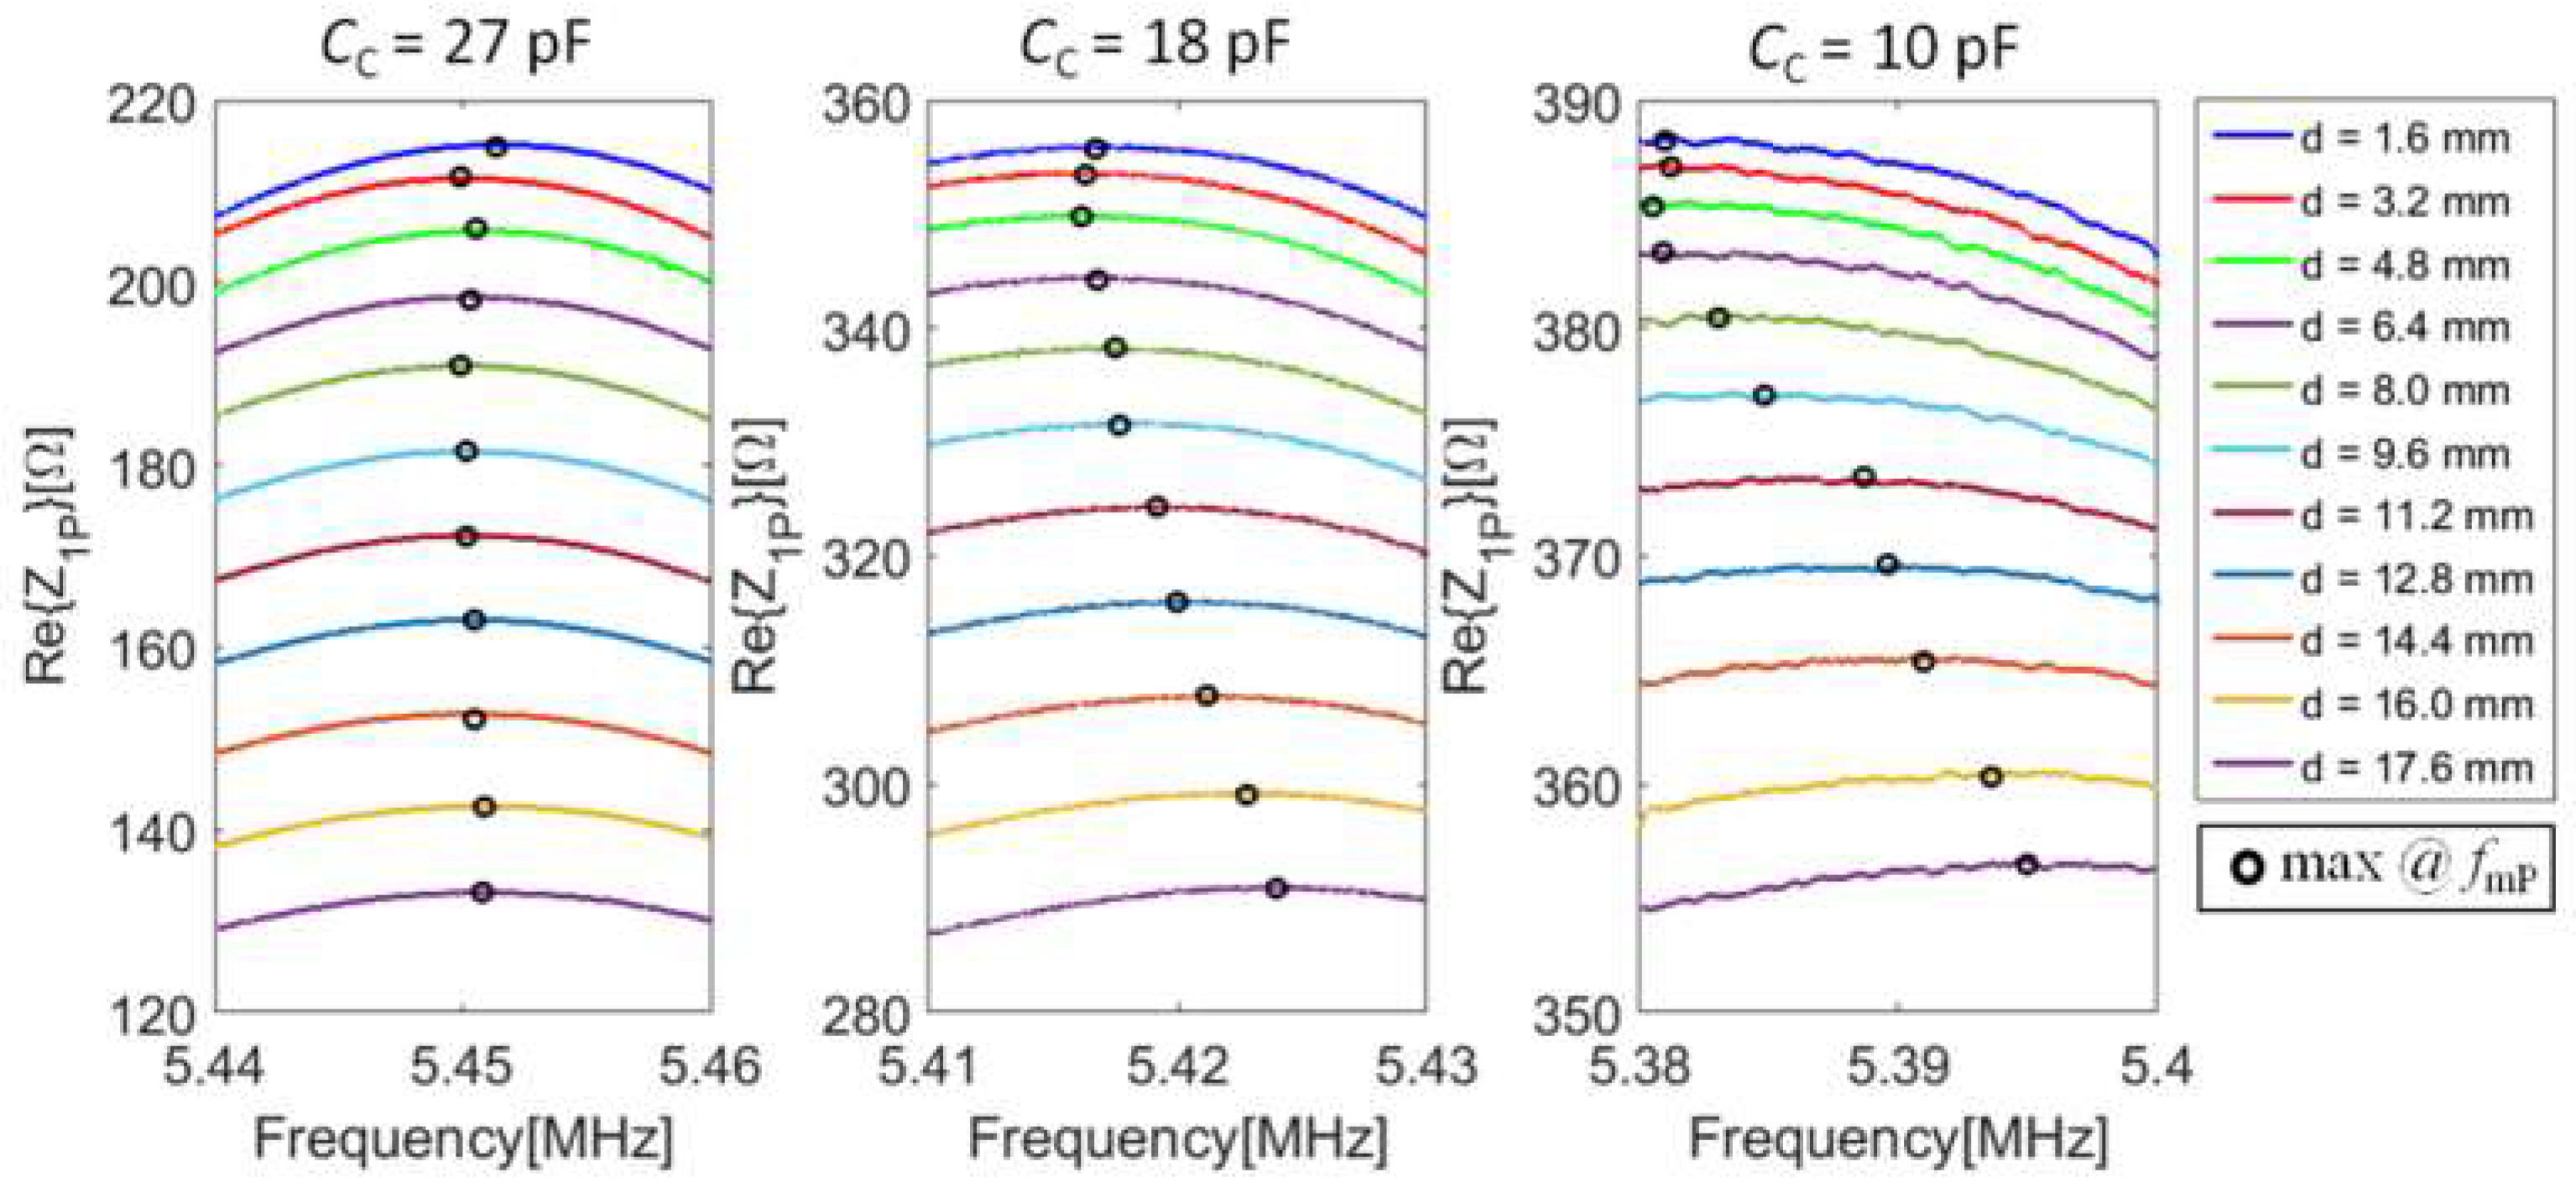
The real part of the impedance Z1P versus frequency has been measured at varying interrogation distance d, and hence the coupling factor k, for different values of the compensation capacitance CC. The results are shown in Figure 18.
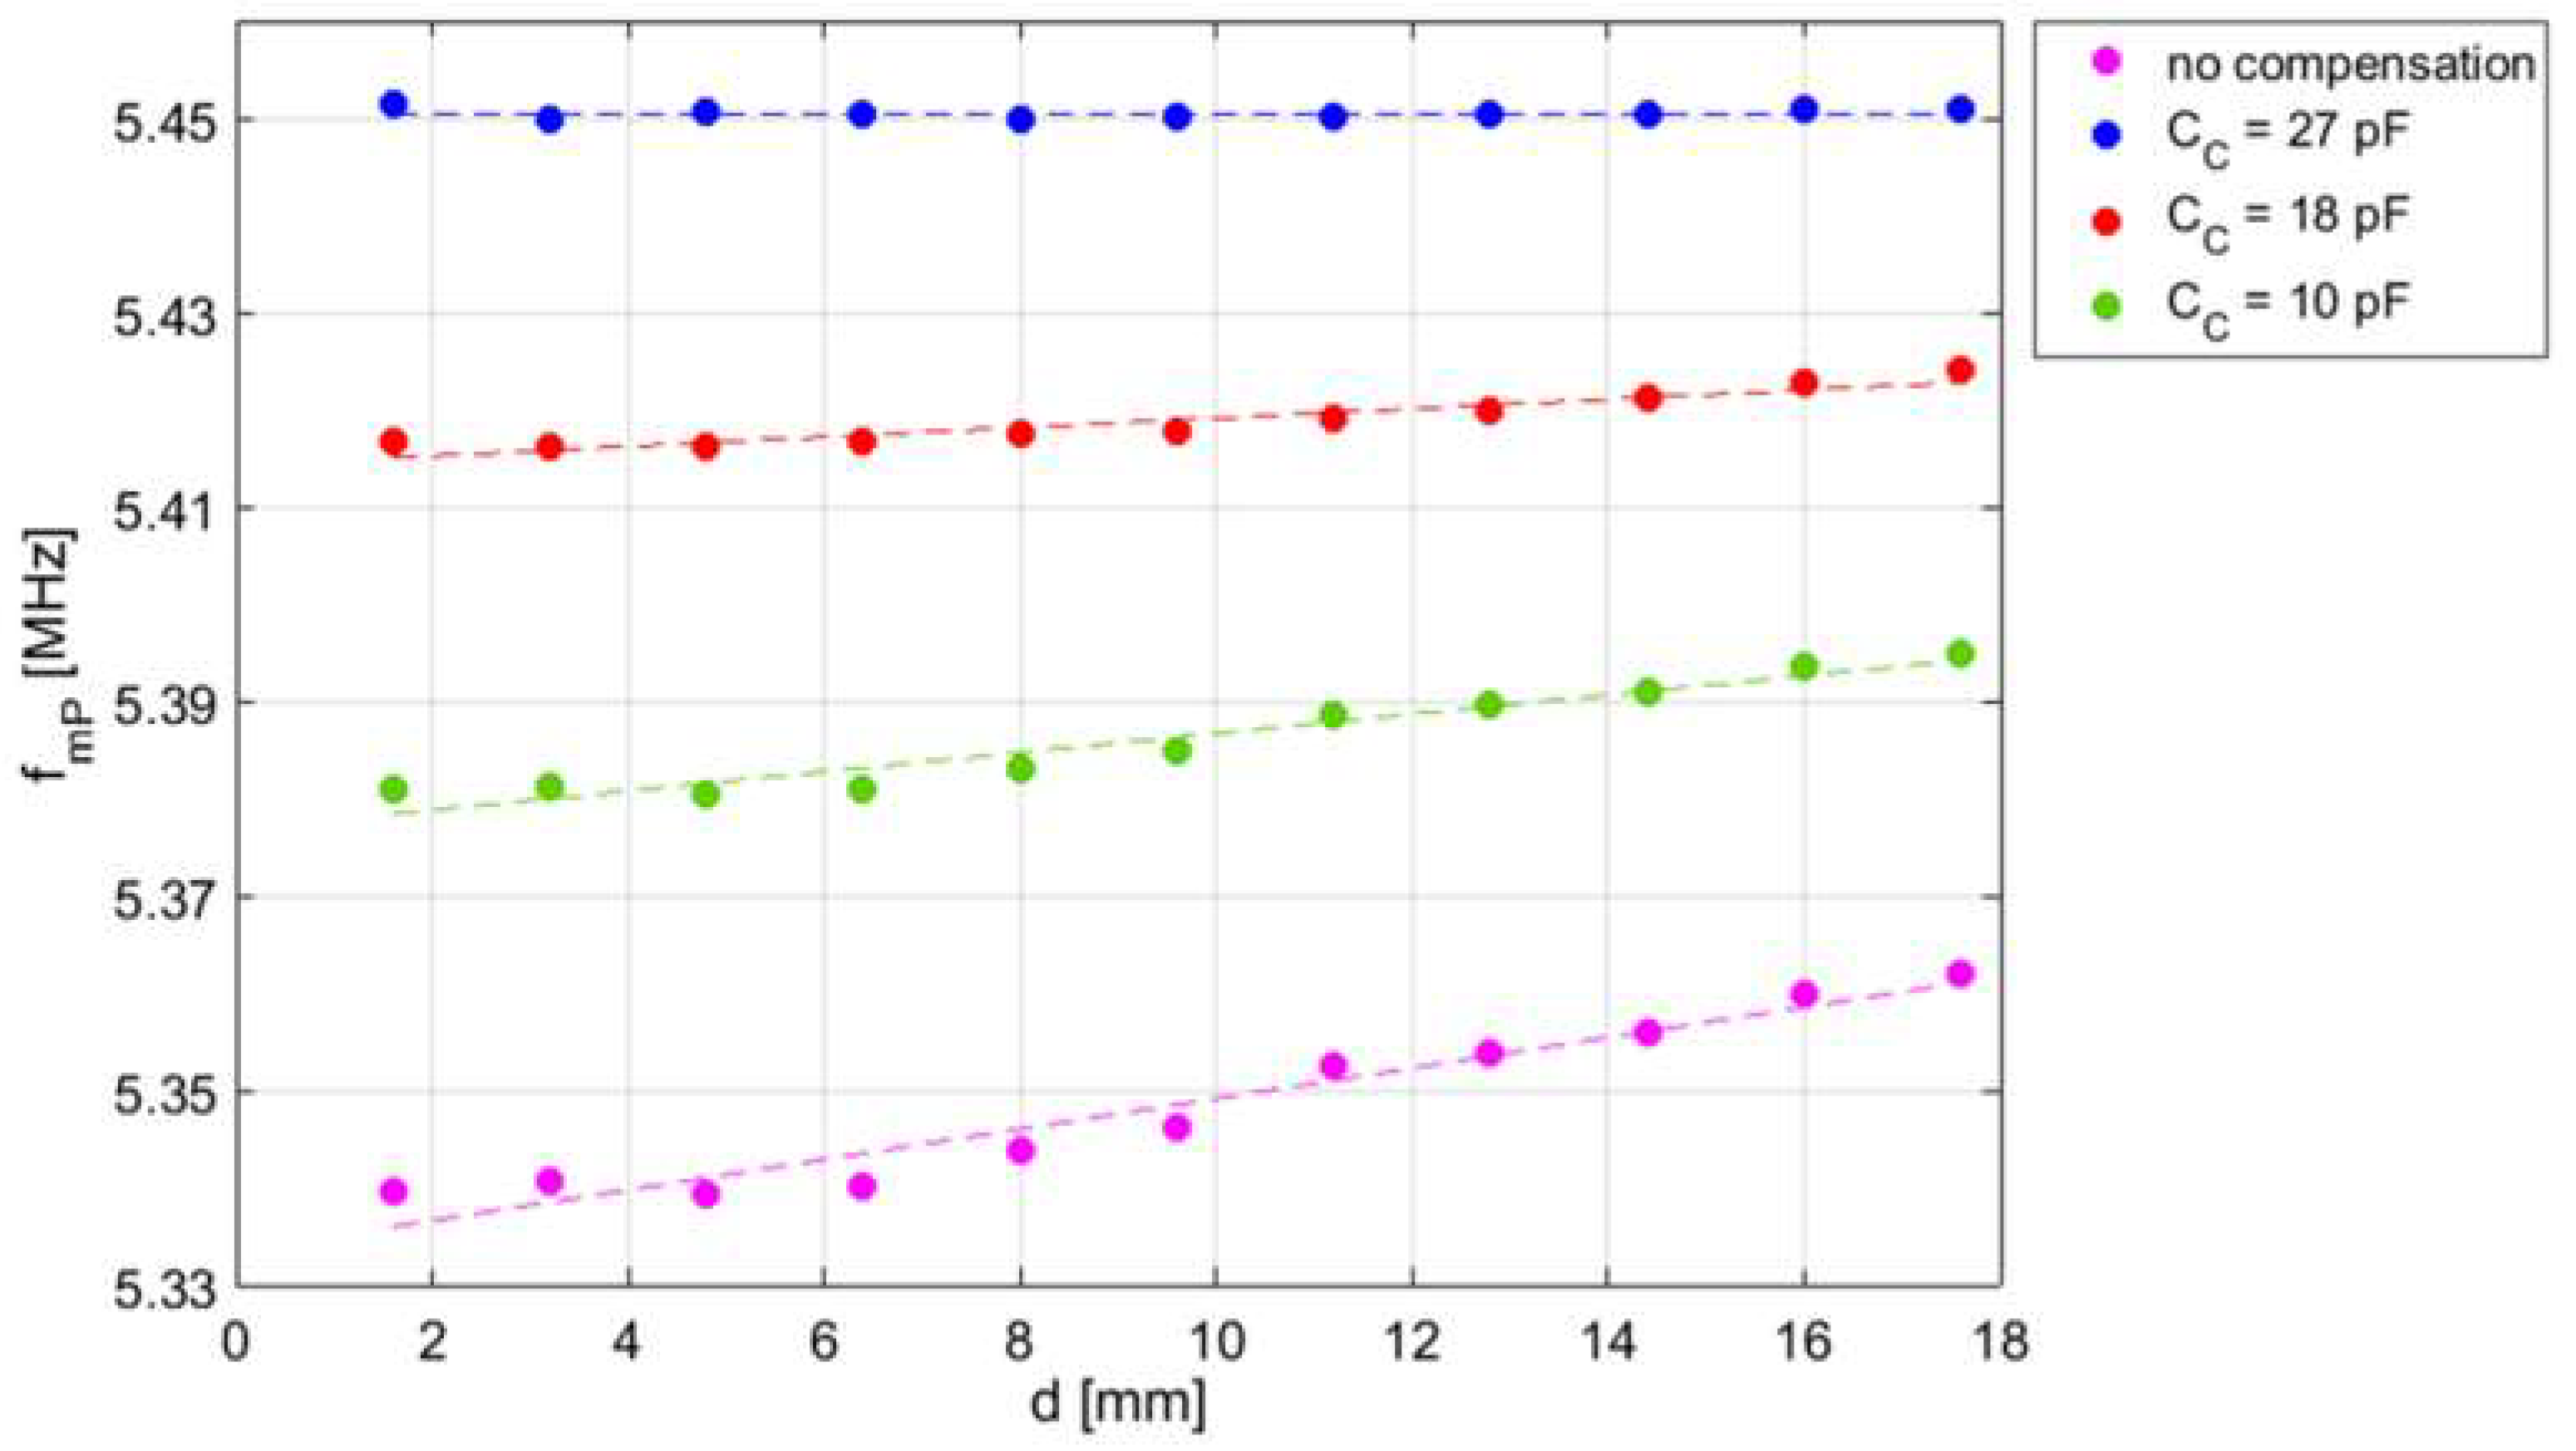
Figure 19 shows the measured frequency fmP where the maximum of Re{Z1P} near fS occurs as a function of d, for different values of the compensation capacitance CC. A monotonic decrease of k is expected by increasing d [29]. It can be observed that by increasing Cc, the expected undesired effect of the parasitic capacitances described in Section 3.3 decreases. With CC = 27 pF, the value of fmP becomes independent of d over the considered interrogation range of 16 mm, with a residual deviation of fmP within 1 kHz, i.e., less than 200 ppm. The obtained value of Cc = 27 pF, slightly higher than the capacitor CF = 22 pF, is ascribed to the presence of an extra capacitance of about 5 pF that concurs to form CP. The results clearly demonstrate the effectiveness of the compensation technique and circuit.
Under ideal complete compensation condition, the measured fmP approaches the unaffected value of fm, discussed in Section 3.2, over the considered interrogation distance range. Then, for the considered RSU with a Qs = 91, a relative deviation |fmP – fS|/fS as low as 30 ppm is obtained from Equation (5).
The same setup has been used for tests on coil-coupled electromechanical piezoelectric resonators. An AT-cut QCR with fr = 4.432 MHz has been connected to CL2. The parameters of the BVD equivalent circuit around fr of the adopted QCR are C0 = 5.72 pF, Rr = 10.09 Ω, Lr = 77.98 mH, and Cr = 16.54 fF. The numerical analysis, discussed in Section 3.4, proves that parasitic capacitances in the order of tens of picofarads introduce negligible dependence of the measured resonant frequency on k. For this reason, the compensation circuit is not connected to the primary coil. Figure 20a shows the real part of the impedance Z1P, measured in the frequency range around fr for different values of the interrogation distance d. As it can be observed, while the magnitude of the maximum of Re{Z1P} decreases by increasing d, the frequency frP, where the maximum occurs, shows residual variations as low as 1 Hz, i.e., less than 0.3 ppm, in the explored range of d, as shown in Figure 20b. This confirms the predicted independence of frP from d, and thus from k.
5.2. Time-Gated Measurements with Coil-Coupled Capacitance Sensor and QCR
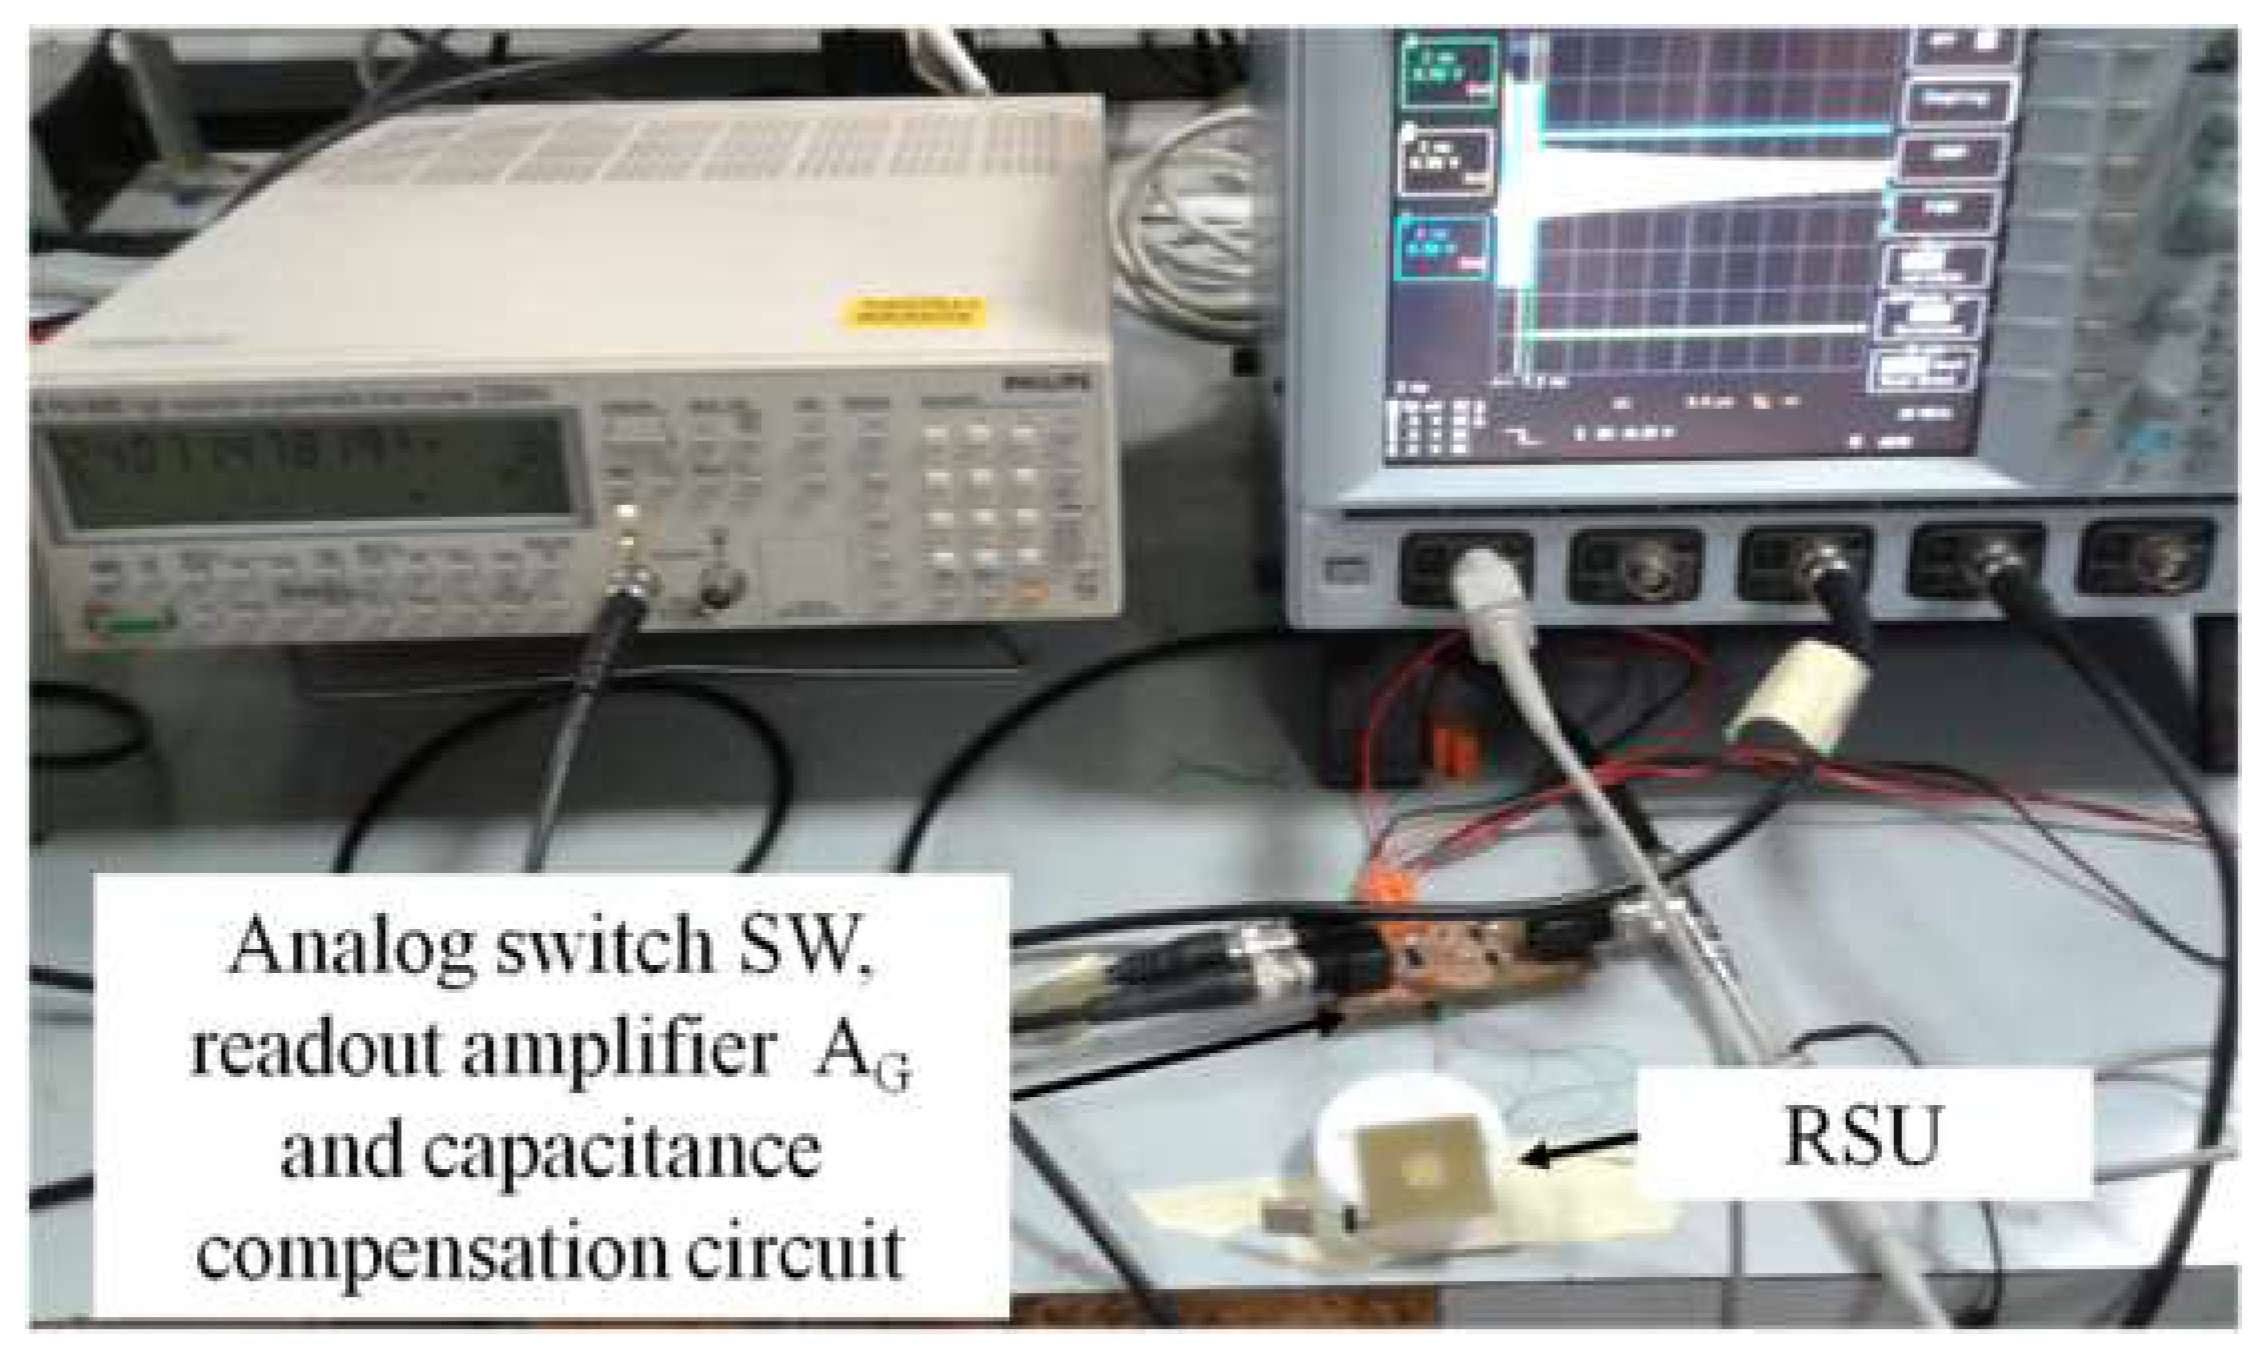
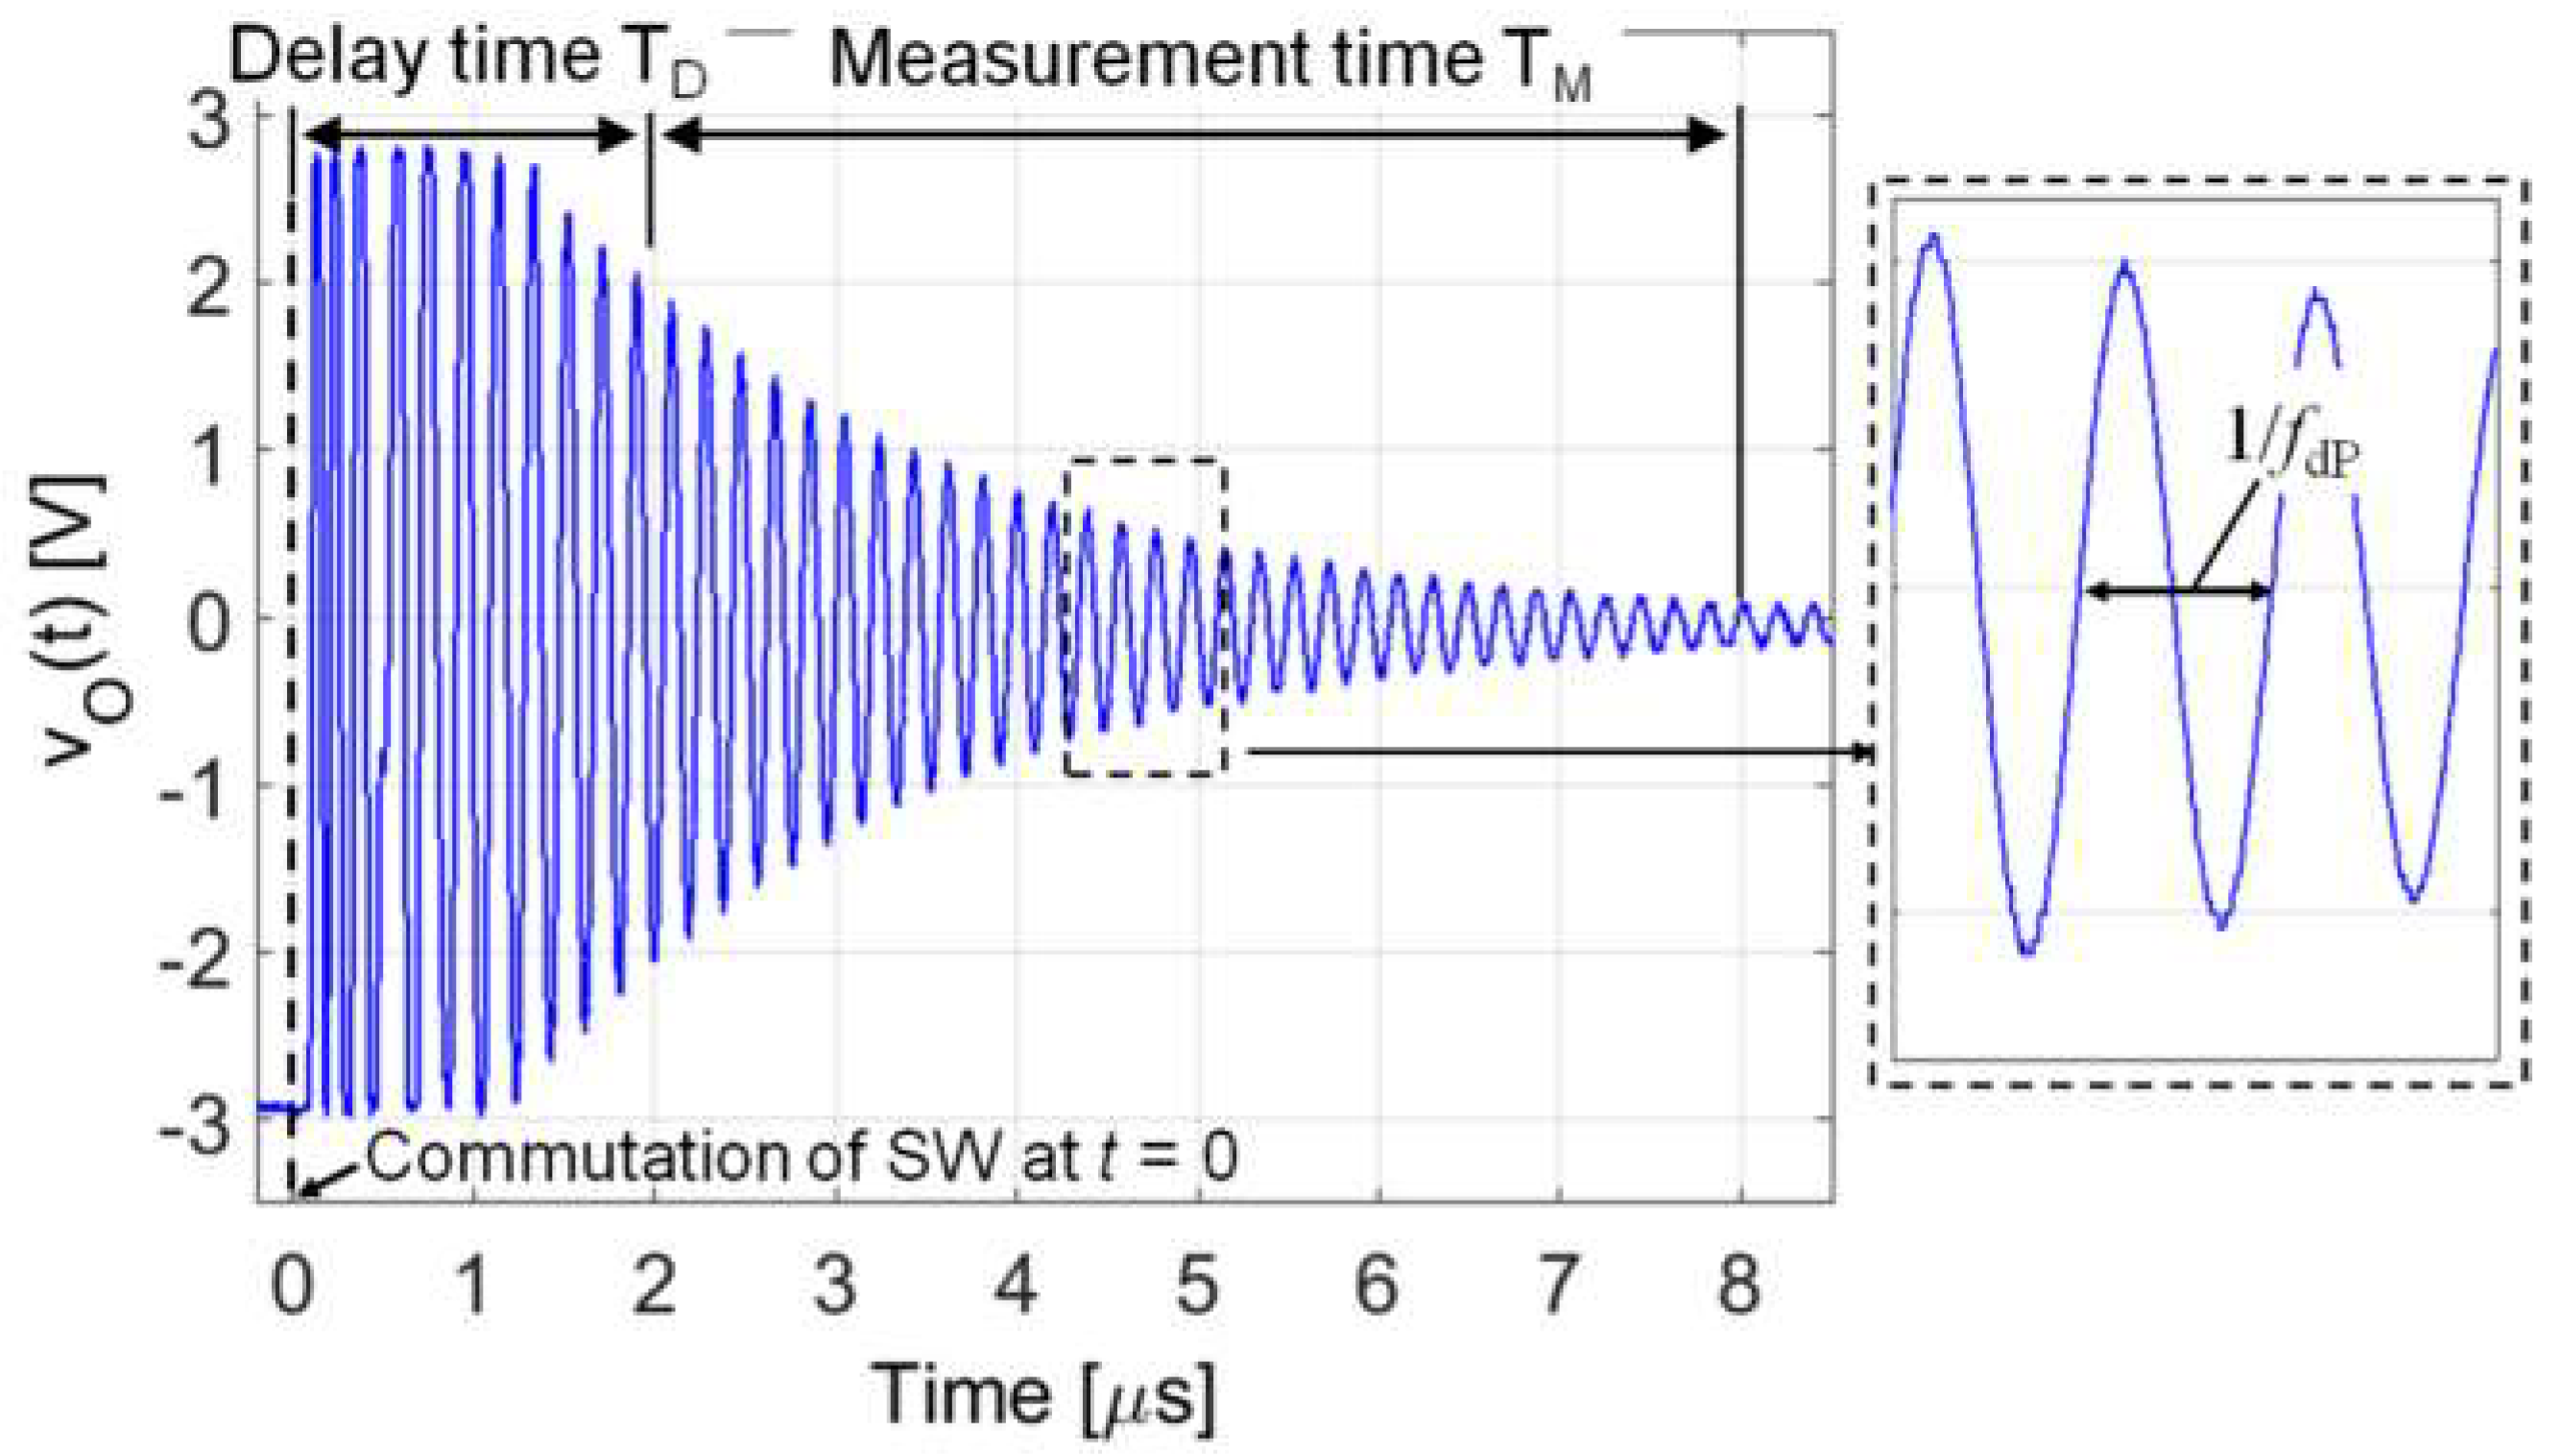
Figure 21 shows the experimental setup used to test the interrogation system based on the time-gated technique shown in Figure 15. The excitation and gate signals vexc(t) and vg(t) are generated by two Agilent 3320A waveform generators (Agilent Technologies, Santa Clara, CA, USA). A tailored circuit comprising the analog switch SW (MAX393, Maxim Integrated, San Jose, CA, USA), the parasitic capacitance compensation circuit, and the readout amplifier AG (OPA656, Texas Instruments, Dallas, TX, USA), has been developed. The readout output signal vO(t) has been connected to a high-resolution frequency meter Philips PM6680 (Philips International, Eindhoven, The Netherlands). The frequency meter is configured to perform measurements in a time window of duration TM, starting after a delay time TD from the beginning of the detection phase. The delay time TD is used to skip the initial ringing in vO(t) [18,21]. The voltage vO(t) measured during detection phase, and the times TD and TM, are shown in Figure 22.
Firstly, tests have been done on the RSU with coil-coupled capacitance sensor, described in Section 5.1. The RSU has a PCB spiral coil with L2 = 8.51 µH, R2 = 3.2 Ω, and a capacitive sensor with CS = 100 pF, resulting in a resonant frequency fS = 5.45 MHz. The same PCB spiral coil described in Section 5.1, with L1 = 8.5 µH and R1 = 5 Ω, has been used as CL1. The frequency of the excitation signal vexc(t) is set close to fS to improve the transferred signal level.
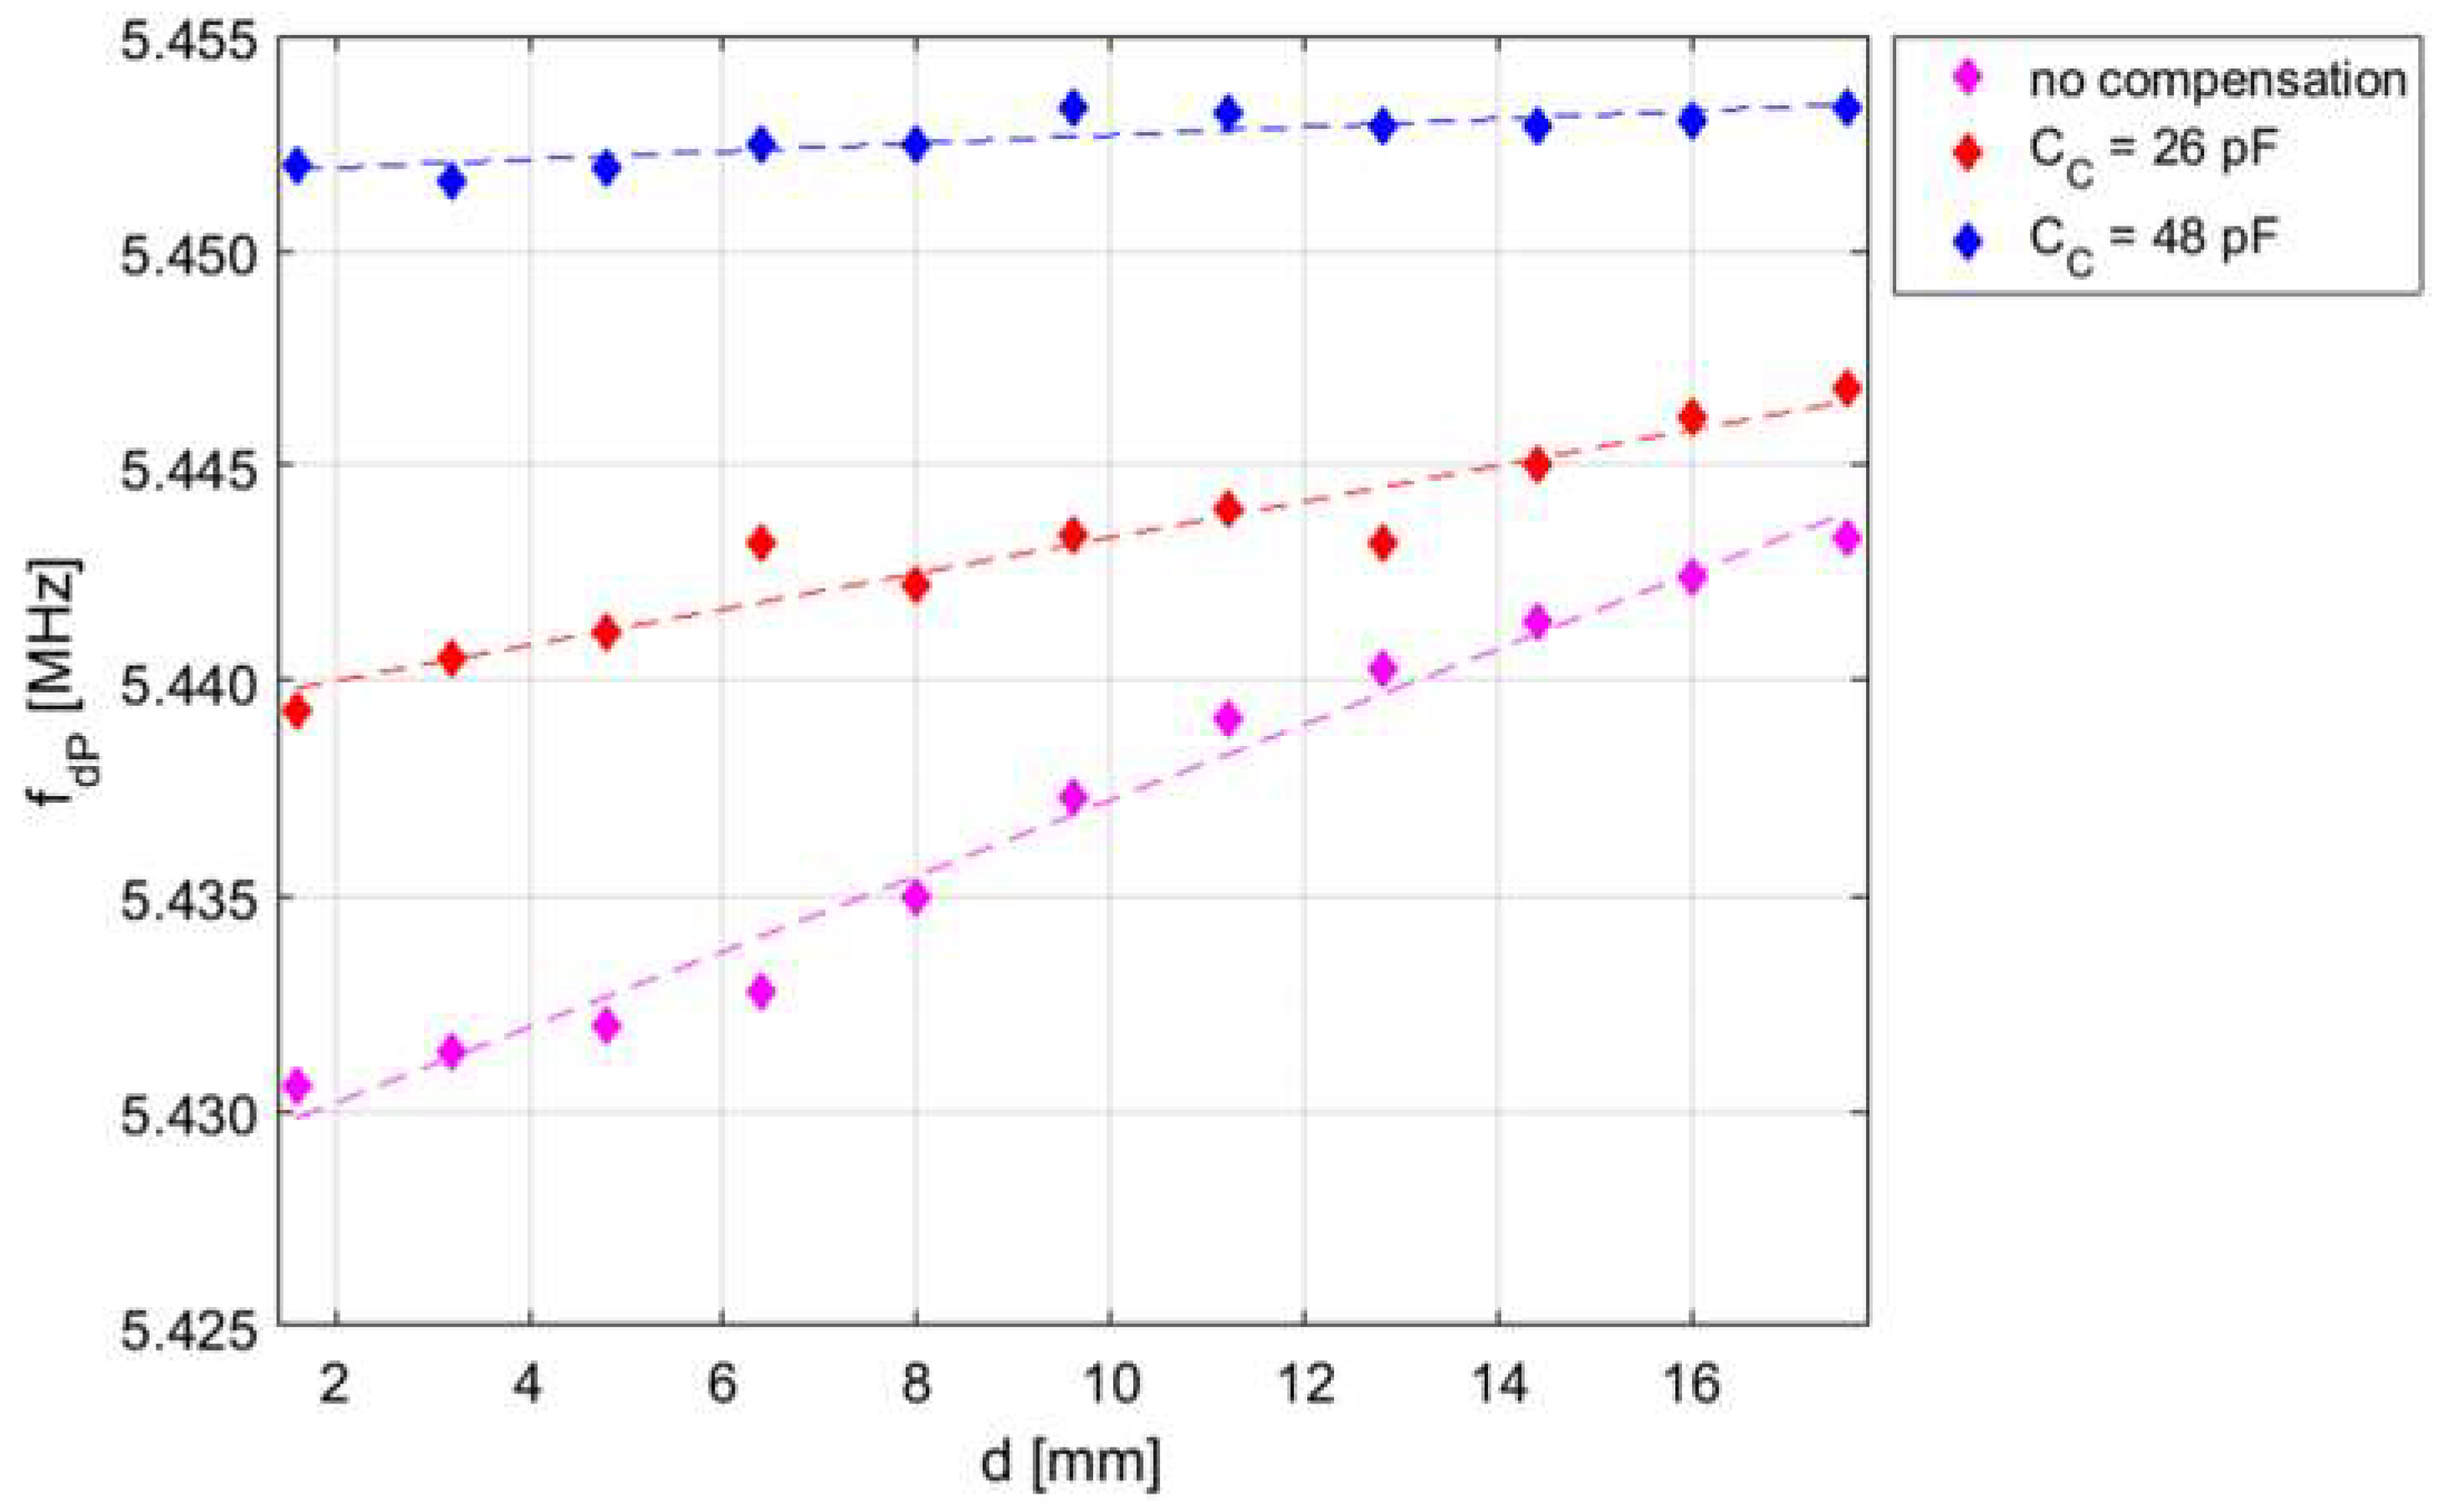
Figure 23 reports the frequency fdP of the damped sinusoid vO(t) during the detection phase, measured at varying d for different values of the compensation capacitance CC. A delay time TD = 2 µs and a measurement time TM = 6 µs have been chosen for all the measurements. As it can be observed, for the case of compensation of CP, the dependence of fdP on d is much reduced with respect to the cases with no or partial compensation. With CC ≈ 48 pF, fdP has residual variations within 1.5 kHz, i.e., less than 300 ppm, across the explored interrogation range of about 17.6 mm.
Under ideal complete compensation, the measured fdP approaches the unaffected value of fd discussed in Section 3.2. Then, for the considered RSU with Qs = 91, a relative deviation |fdP − fS|/fS as low as 15 ppm is obtained from Equation (8).
Then, tests have been run on an RSU made by a coil-coupled 4.432-MHz AT-cut QCR. The capacitance compensation circuit has been kept inactive, due to the predicted independence of frP from k for coil-coupled QCR. The frequency frP of the damped sinusoid vO(t) has been measured with varying the interrogation distance d.
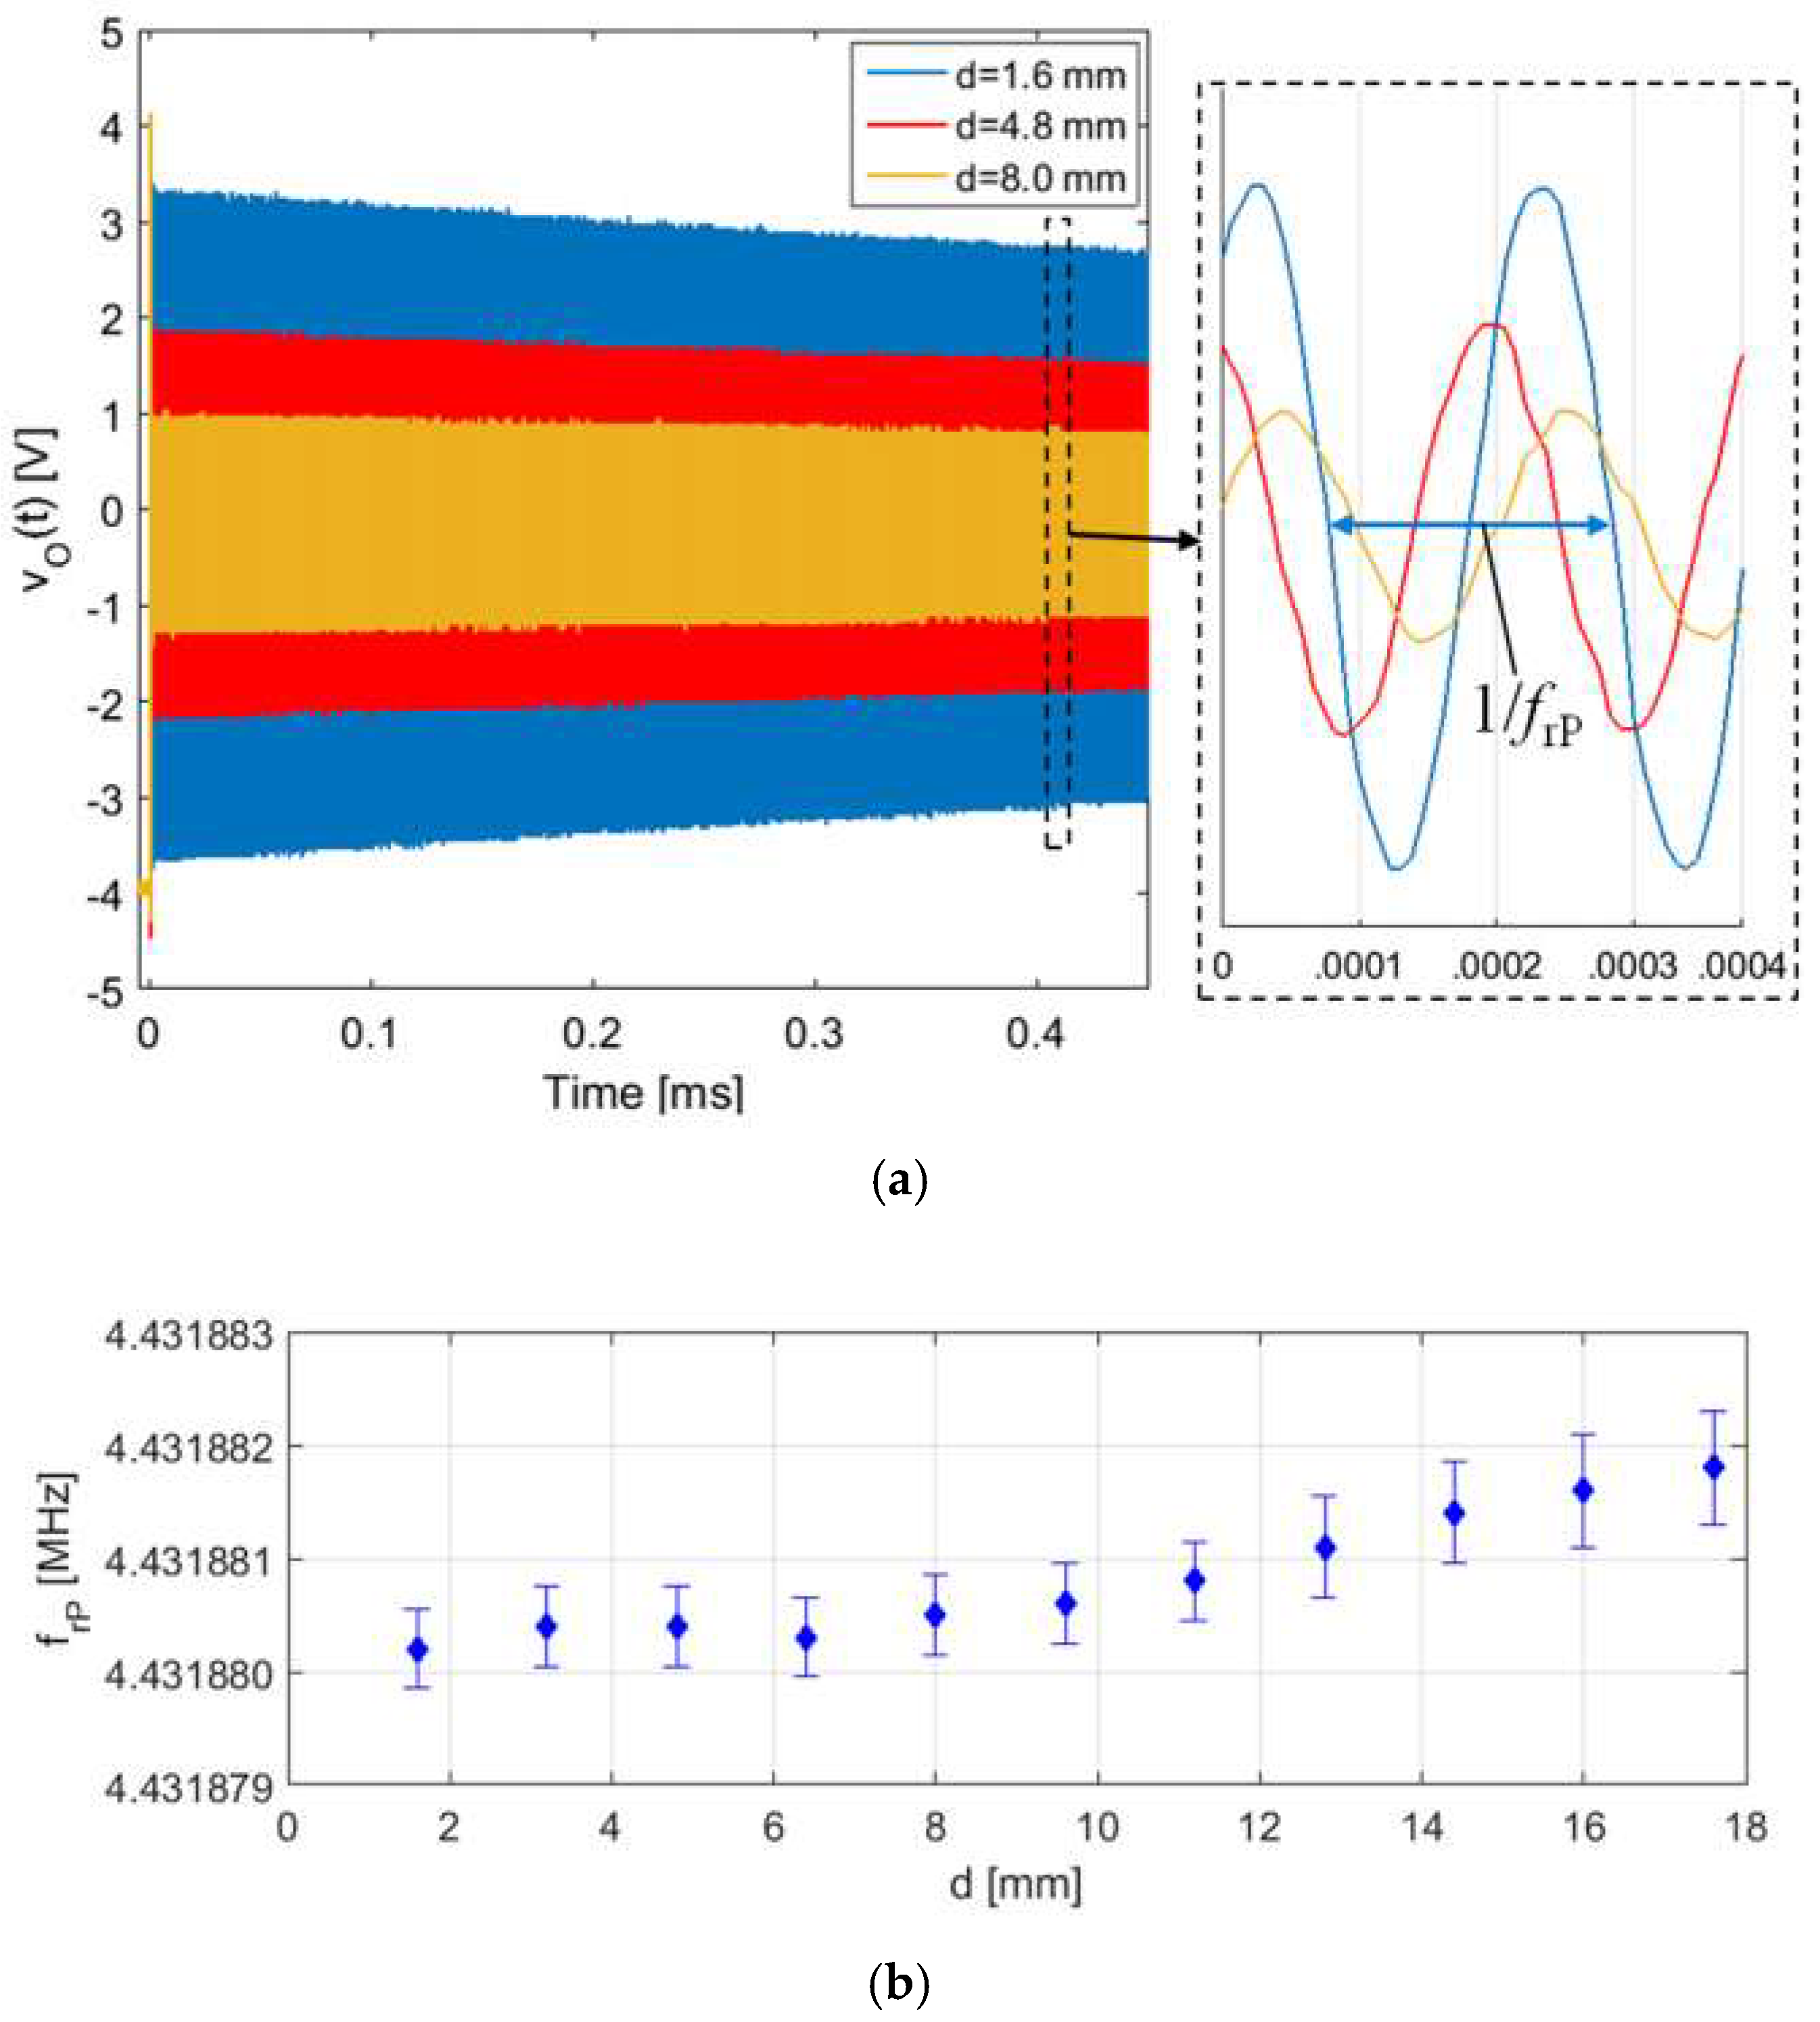
Figure 24a shows the voltage vO(t) at the beginning of the detection phase for three different interrogation distances d. As it can be observed, the magnitude of vO(t) decreases with the increasing d, i.e., with decreasing k, while, as expected, the frequency frP is unaffected, as shown in Figure 24b. A residual variation of about 1.8 Hz, i.e., less than 0.5 ppm, has been obtained over the explored interrogation distance range of about 17.8 mm. In summary, the experimental results with coil-coupled QCRs show that the total parasitic capacitance CP estimated in about 48 pF, causes a negligible variation of the measured frequency frP over the explored interrogation range.
6. Conclusions
This work has investigated contactless interrogation techniques and readout circuits for passive sensors, exploiting the electromagnetic coupling between a primary and a secondary coil.
The sensor can be either a capacitive sensor or an electromechanical piezoelectric resonator. With both kinds of sensors, resonance can occur in the secondary circuit that can, therefore, be named resonant sensor unit (RSU). The interrogation of the RSU can be accomplished by techniques operating either in the frequency domain or in the time domain, which are ideally independent of the distance between the primary and secondary coils.
On the other hand, when unavoidable parasitic effects are considered, that combine in a lumped capacitance in parallel to the readout coil, an unwanted dependence of the readout frequency and quality factor on the interrogation distance is introduced, affecting similarly both the frequency- and time-domain techniques. Numerical analysis and experimental tests demonstrate that this dependence is detrimental on the accuracy of the readout frequency of the RSU. The inaccuracies are more relevant for the capacitive sensors, while for electromechanical piezoelectric resonators, the effect is negligible in most cases.
As a solution, an innovative approach has been proposed in which such parasitic capacitance is compensated by a purposely designed electronic circuit that has been prototyped and experimentally verified.
In tests carried out on a capacitive RSU with the proposed compensation circuit applied, a maximum deviation as low as 300 ppm on a resonant frequency of 5.45 MHz has been obtained over an interrogation range of almost 2 cm. This successfully demonstrates the validity of the proposed approach and circuit.
In addition, the experimental results have confirmed that the effect of the input parasitic capacitance is negligible when a coil-coupled piezoelectric quartz crystal resonator is used as the RSU.
Author Contributions
M.D. worked on the theory and modeling, and numerical analyses, contributed in the experimental activity, analysis of experimental data, and in writing the paper. M.B. contributed in the theory and modeling, experimental activity, analysis of experimental data, and in writing and revising the paper. M.F. contributed in the experimental activity, analysis of experimental data, and in revising the paper. V.F. coordinated the research and contributed in the theory and modeling, and in revising the paper.
Funding
This research received no external funding.
Conflicts of Interest
The authors declare no conflict of interest.
References
- Ferrari, M.; Ferrari, V.; Guizzetti, M.; Marioli, D. An autonomous battery-less sensor module powered by piezoelectric energy harvesting with RF transmission of multiple measurement signals. Smart Mater. Struct. 2009, 18, 085023. [Google Scholar] [CrossRef]
- Ferrari, M.; Ferrari, V.; Guizzetti, M.; Marioli, D.; Taroni, A. Piezoelectric multifrequency energy converter for power harvesting in autonomous microsystems. Sensor Actuator A Phys. 2008, 142, 329–335. [Google Scholar] [CrossRef]
- Tan, Y.; Dong, Y.; Wang, X. Review of MEMS electromagnetic vibration energy harvester. J. Microelectromech. Syst. 2017, 26, 1–16. [Google Scholar] [CrossRef]
- Dalola, S.; Ferrari, M.; Ferrari, V.; Guizzetti, M.; Marioli, D.; Taroni, A. Characterization of thermoelectric modules for powering autonomous sensors. IEEE Trans. Instrum. Meas. 2009, 58, 99–107. [Google Scholar] [CrossRef]
- Cuadras, A.; Gasulla, M.; Ferrari, V. Thermal energy harvesting through pyroelectricity. Sensor Actuator A Phys. 2010, 158, 132–139. [Google Scholar] [CrossRef]
- Dalola, S.; Faglia, G.; Comini, E.; Ferroni, M.; Soldano, C.; Zappa, D.; Ferrari, V.; Sberveglieri, G. Planar thermoelectric generator based on metal-oxide nanowires for powering autonomous microsystem. Procedia Eng. 2012, 47, 346–349. [Google Scholar] [CrossRef]
- Demori, M.; Ferrari, M.; Bonzanini, A.; Poesio, P.; Ferrari, V. Autonomous sensors powered by energy harvesting by von karman vortices in airflow. Sensors 2017, 17, 2100. [Google Scholar] [CrossRef] [PubMed]
- Sample, A.P.; Yeager, D.J.; Powledge, P.S.; Mamishev, A.V.; Smith, J.R. Design of an RFID-based battery-free programmable sensing platform. IEEE Trans. Instrum. Meas. 2008, 57, 2608–2615. [Google Scholar] [CrossRef]
- Siddiqui, A.; Mahboob, M.R.; Islam, T. A passive wireless tag with digital readout unit for wide range humidity measurement. IEEE Trans. Instrum. Meas. 2017, 66, 1013–1020. [Google Scholar] [CrossRef]
- Demori, M.; Baù, M.; Dalola, S.; Ferrari, M.; Ferrari, V. RFID powered system for contactless measurement of a resistive sensor array. In Proceedings of the 2018 IEEE International Instrumentation and Measurement Technology Conference (I2MTC), Houston, TX, USA, 14–17 May 2018. [Google Scholar]
- Chatzandroulis, S.; Tsoukalas, D.; Neukomm, P.A. A miniature pressure system with a capacitive sensor and a passive telemetry link for use in implantable applications. J. Microelectromech. Syst. 2000, 9, 18–23. [Google Scholar] [CrossRef]
- Rodriguez, S.; Ollmar, S.; Waqar, M.; Rusu, A. A batteryless sensor ASIC for implantable bio-impedance applications. IEEE Trans. Biomed. Circuit Syst. 2016, 10, 533–544. [Google Scholar] [CrossRef] [PubMed]
- Bhamra, H.; Tsai, J.W.; Huang, Y.W.; Yuan, Q.; Shah, J.V.; Irazoqui, P. A subcubic millimeter wireless implantable intraocular pressure monitor microsystem. IEEE Trans. Biomed. Circuit Syst. 2017, 11, 1204–1215. [Google Scholar] [CrossRef] [PubMed]
- Nopper, R.; Has, R.; Reindl, L. A wireless sensor readout system—Circuit concept, simulation, and accuracy. IEEE Trans. Instrum. Meas. 2011, 60, 2976–2983. [Google Scholar] [CrossRef]
- Huang, Q.A.; Dong, L.; Wang, L.F. LC passive wireless sensors toward a wireless sensing platform: Status, prospects, and challenges. J Microelectromech. Syst. 2016, 25, 822–840. [Google Scholar] [CrossRef]
- Babu, A.; George, B. A linear and high sensitive interfacing scheme for wireless passive LC sensors. IEEE Sens. J. 2016, 16, 8608–8616. [Google Scholar] [CrossRef]
- Zhang, C.; Wang, L.F.; Huang, J.Q.; Huang, Q.A. An LC-type passive wireless humidity sensor system with portable telemetry unit. J Microelectromech. Syst. 2015, 24, 575–581. [Google Scholar] [CrossRef]
- Demori, M.; Masud, M.; Baù, M.; Ferrari, M.; Ferrari, V. Passive LC sensor label with distance-independent contactless interrogation. In Proceedings of the 2017 IEEE Sensors Conference, Glasgow, UK, 30 October–1 November 2017. [Google Scholar]
- Wang, X.; Larsson, O.; Platt, D.; Nordlinder, S.; Engquist, I.; Berggren, M.; Crispin, X. An all-printed wireless humidity sensor label. Sensor Actuators B Chem. 2012, 166, 556–561. [Google Scholar] [CrossRef] [Green Version]
- Nopper, R.; Niekrawietz, R.; Reindl, L. Wireless readout of passive LC sensors. IEEE Trans. Instrum. Meas. 2010, 59, 2450–2457. [Google Scholar] [CrossRef]
- Baù, M.; Ferrari, M.; Ferrari, V. Analysis and validation of contactless time-gated interrogation technique for quartz resonator sensors. Sensors 2017, 17, 1264. [Google Scholar] [CrossRef] [PubMed]
- Ferrari, M.; Baù, M.; Tonoli, E.; Ferrari, V. Piezoelectric resonant sensors with contactless interrogation for mass sensitive and acoustic-load detection. Sensors Actuators A Phys. 2013, 202, 100–105. [Google Scholar] [CrossRef]
- Demori, M.; Baù, M.; Ferrari, M.; Ferrari, V. Electronic technique and circuit topology for accurate distance-independent contactless readout of passive LC sensors. AEU Int. J. Electron. Commun. 2018, 92, 82–85. [Google Scholar] [CrossRef]
- Morshed, B.I. Dual coil for remote probing of signals using resistive wireless analog passive sensors (rWAPS). In Proceedings of the 2016 United States National Committee of URSI National Radio Science Meeting, Boulder, CO, USA, 21 March 2016. [Google Scholar]
- Yang, B.; Meng, F.; Dong, Y. A coil-coupled sensor for electrolyte solution conductivity measurement. In Proceedings of the 2013 2nd International Conference on Measurement, Information and Control, Harbin, China, 6 March 2014. [Google Scholar]
- Arnau, A.; Ferrari, V.; Soares, D.; Perrot, H. Interface electronic systems for AT-Cut QCM sensors: A comprehensive review. In Piezoelectric Transducers and Applications, 2nd ed.; Springer-Verlag Berlin: Heidelberg, Germay, 2008; pp. 187–203. [Google Scholar]
- DeHennis, A.; Wise, K.D. A double-sided single-chip wireless pressure sensor. In Proceedings of the MEMS 2002 IEEE International Conference, Las Vegas, NV, USA, 21–24 January 2002. [Google Scholar]
- Harpster, T.J.; Hauvespre, S.; Dokmeci, M.R.; Najafi, K. A passive humidity monitoring system for in situ remote wireless testing of micropackages. J Microelectromech. Syst. 2002, 11, 61–67. [Google Scholar] [CrossRef]
- Jacquemod, G.; Nowak, M.; Colinet, E.; Delorme, N.; Conseil, F. Novel architecture and algorithm for remote interrogation of battery-free sensors. Sensor Actuators A Phys. 2010, 160, 125–131. [Google Scholar] [CrossRef]
Figure 1.
Equivalent circuit of a coil-coupled passive sensor.
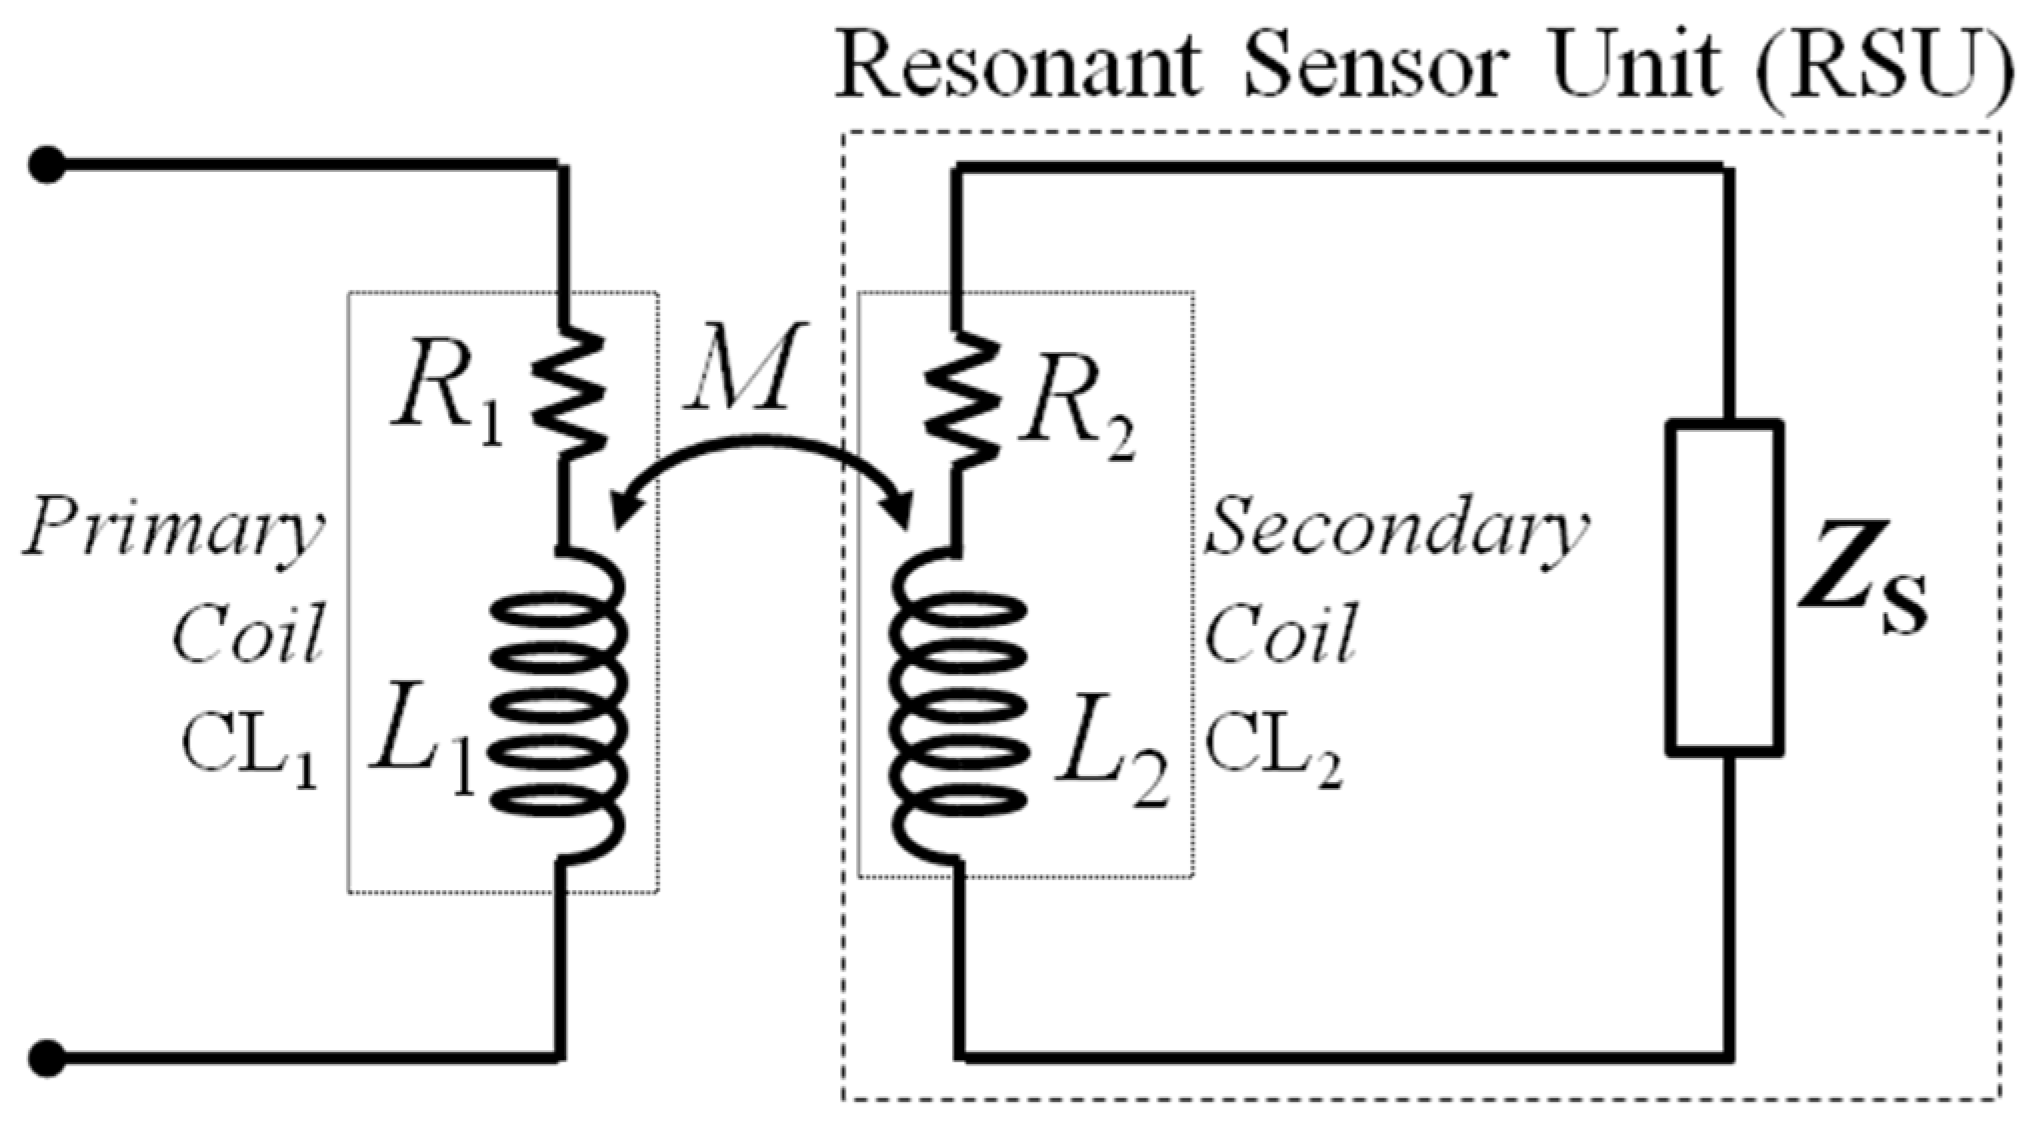
Figure 2.
Equivalent circuits of the two considered cases for a coil-coupled resonant sensor unit (RSU): (a) capacitance sensor CS; (b) electromechanical piezoelectric resonator represented with its equivalent Butterworth–van Dyke (BVD) model.
Figure 2.
Equivalent circuits of the two considered cases for a coil-coupled resonant sensor unit (RSU): (a) capacitance sensor CS; (b) electromechanical piezoelectric resonator represented with its equivalent Butterworth–van Dyke (BVD) model.

Figure 3.
(a) Block diagram of the interrogation system based on impedance measurement from the primary coil; (b) equivalent circuit for the calculation of Z1.
Figure 3.
(a) Block diagram of the interrogation system based on impedance measurement from the primary coil; (b) equivalent circuit for the calculation of Z1.

Figure 4.
Real part of Z1 as a function of frequency from Equation (4) for three different values of k.
Figure 4.
Real part of Z1 as a function of frequency from Equation (4) for three different values of k.

Figure 5.
(a) Block diagram of the time-gated technique; (b) equivalent circuit of the time-gated technique during the detection phase.
Figure 5.
(a) Block diagram of the time-gated technique; (b) equivalent circuit of the time-gated technique during the detection phase.
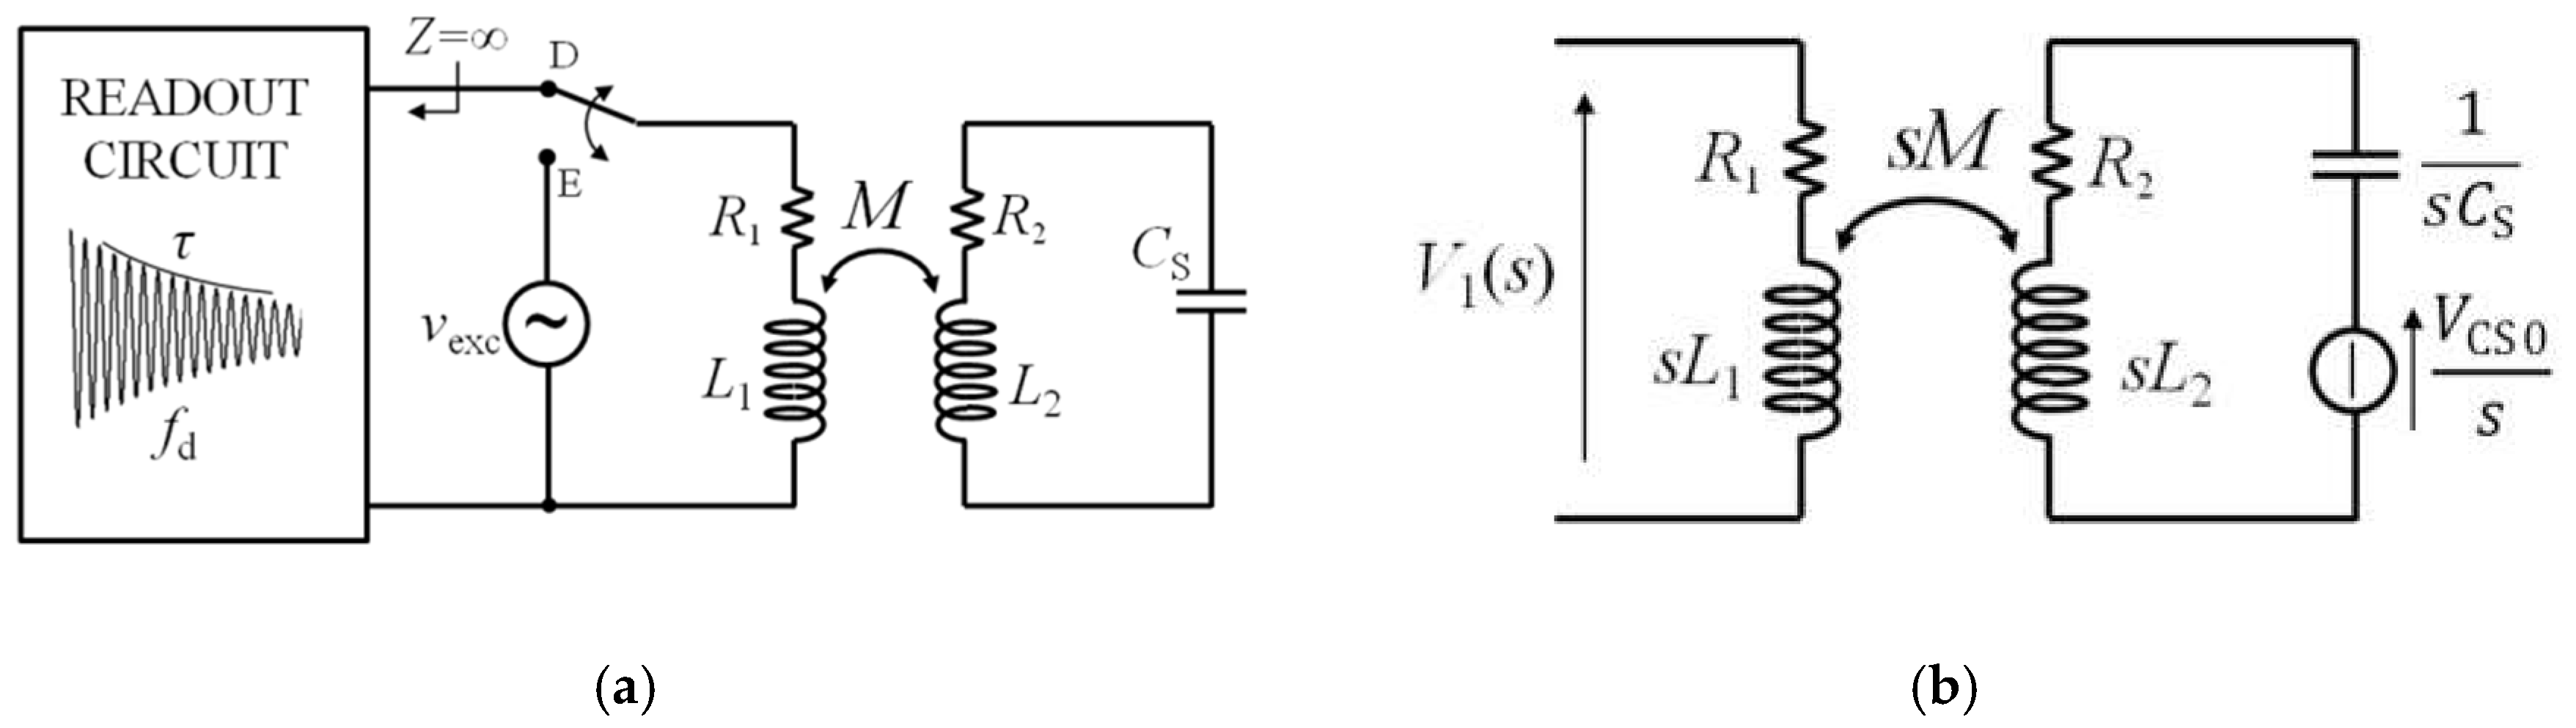
Figure 6.
Voltage v1(t) during the detection phase calculated for three different values of the coupling factor k.
Figure 6.
Voltage v1(t) during the detection phase calculated for three different values of the coupling factor k.

Figure 7.
(a) Block diagram of the interrogation system with equivalent circuit of electromechanical piezoelectric resonator around fr; (b) block diagram of the interrogation system with equivalent circuit of electromechanical piezoelectric resonator for f >> fr.
Figure 7.
(a) Block diagram of the interrogation system with equivalent circuit of electromechanical piezoelectric resonator around fr; (b) block diagram of the interrogation system with equivalent circuit of electromechanical piezoelectric resonator for f >> fr.

Figure 8.
(a) Comparison of fm_r derived from the maximum of Re{Z1} for frequencies around fr, in Equation (9), and the approximate value from Equation (11) as a function of L2; (b) comparison of fm_el derived from the maximum of Re{Z1} for f >> fr, in Equation (9), and the approximate value from Equation (13) as a function of L2.

Figure 9.
Block diagram of the time-gated technique applied to a coil-coupled electromechanical piezoelectric resonator.
Figure 9.
Block diagram of the time-gated technique applied to a coil-coupled electromechanical piezoelectric resonator.
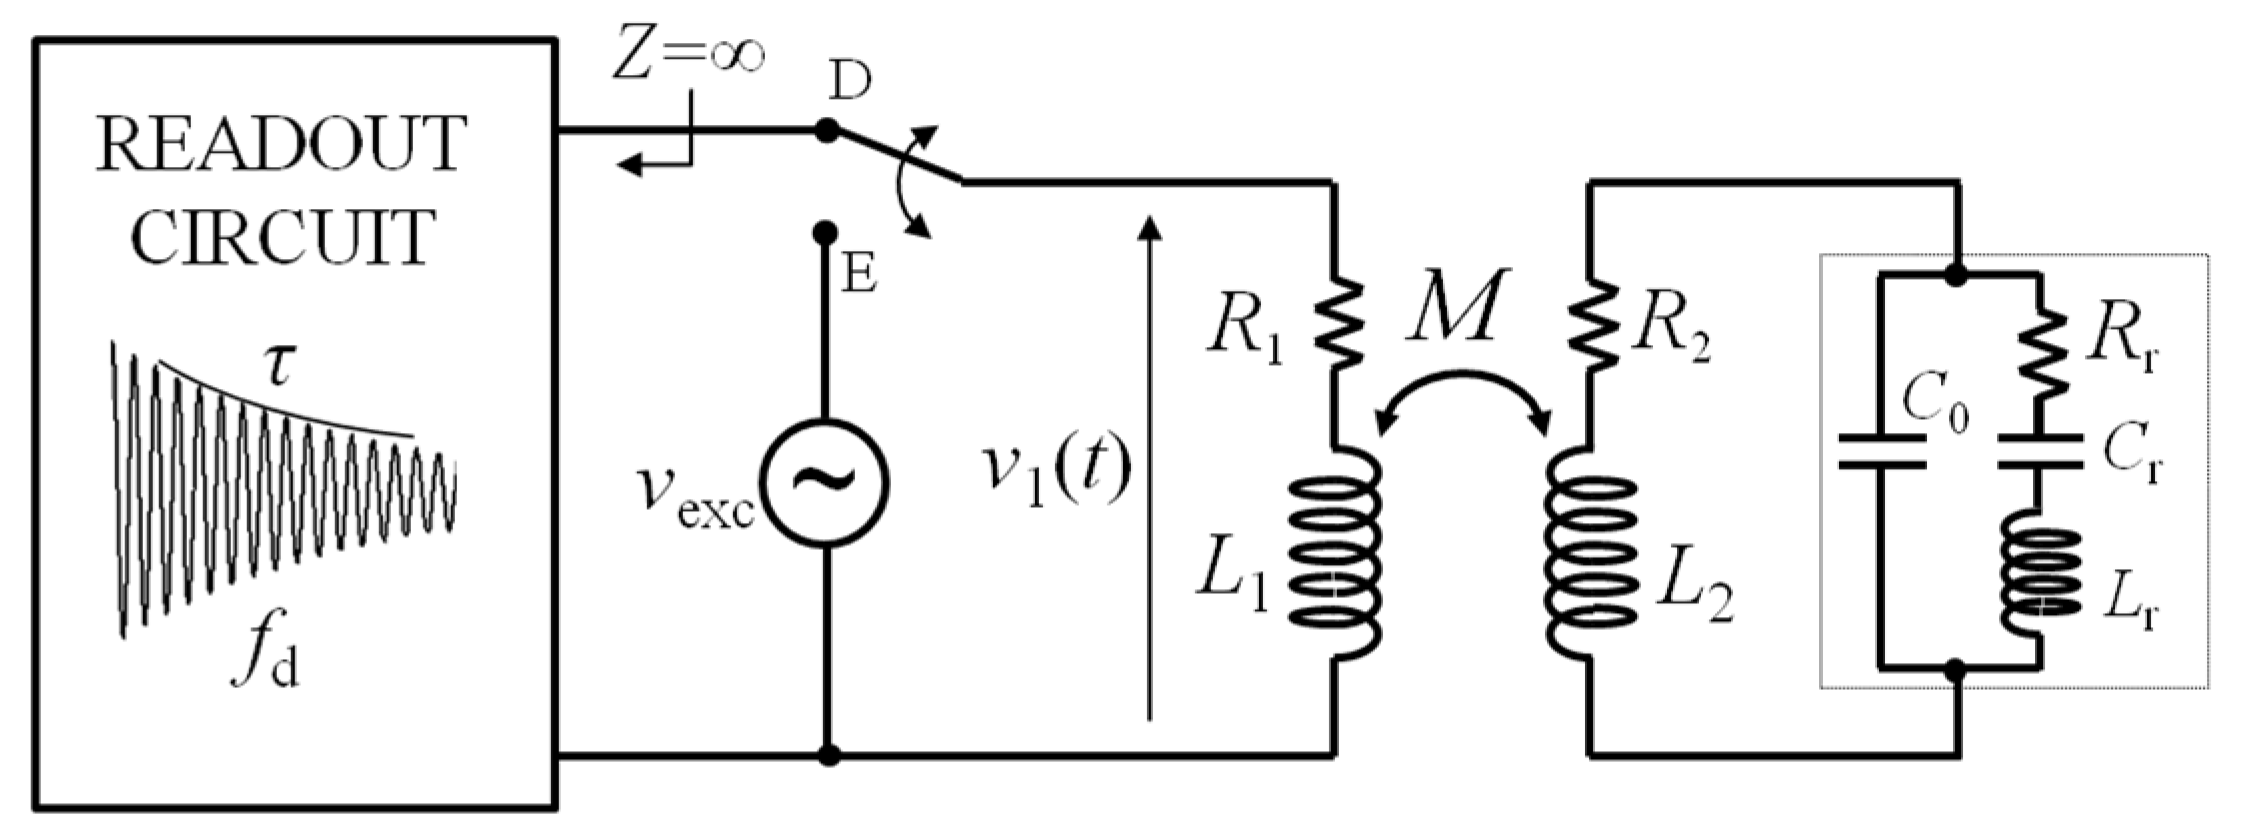
Figure 10.
(a) Block diagram of the interrogation system with equivalent circuit of the impedance Z1P for the technique based on impedance measurements applied to a coil-coupled capacitance sensor; (b) block diagram of the interrogation system with equivalent circuit in the Laplace domain to derive VP1(s) during the detection phase of the time-gated technique applied to a coil-coupled capacitance sensor.
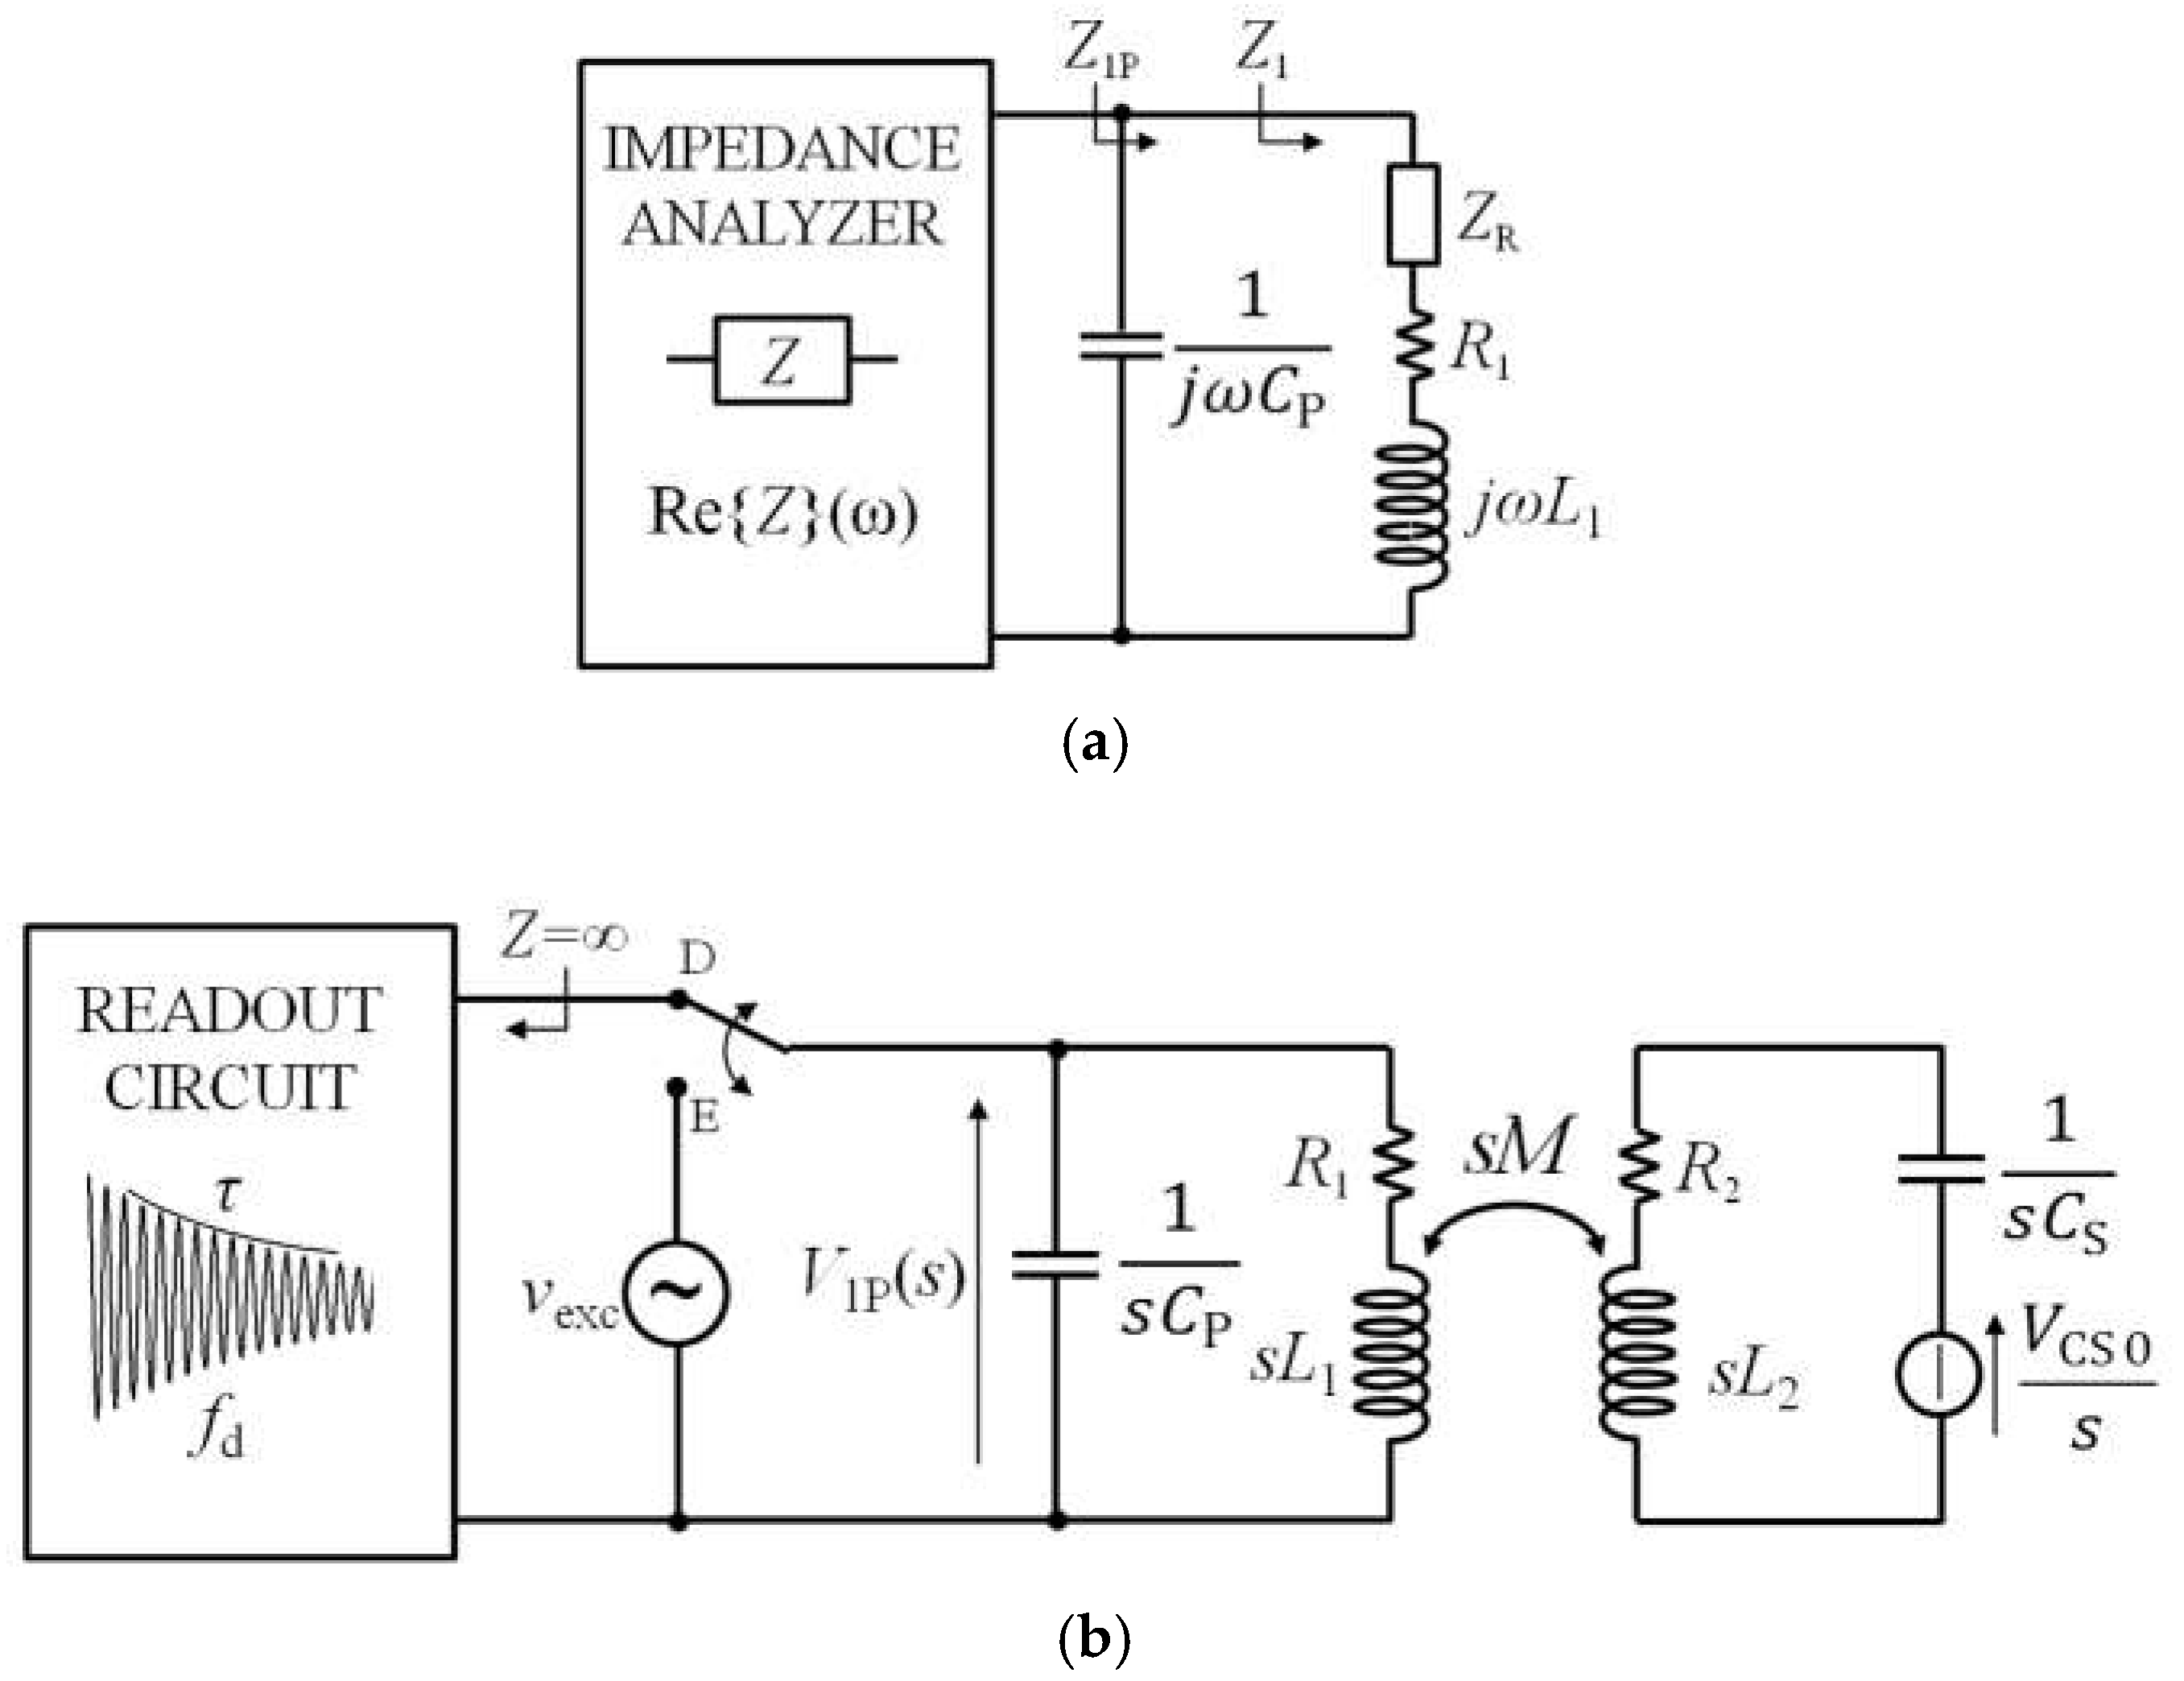
Figure 11.
Comparison of the (fSP − fS)/fS obtained from the two techniques as a function of k for three different values of the ratio CP/CS. The exact value of fS without the parasitic capacitance, i.e., CP = 0, is fS = 5.626977 MHz.
Figure 11.
Comparison of the (fSP − fS)/fS obtained from the two techniques as a function of k for three different values of the ratio CP/CS. The exact value of fS without the parasitic capacitance, i.e., CP = 0, is fS = 5.626977 MHz.

Figure 12.
(a) Block diagram of the interrogation system with equivalent circuit of the impedance Z1P for the technique based on impedance measurements applied to an electromechanical piezoelectric resonator; ZRr represents the reflected impedance of the RSU with electromechanical piezoelectric resonator. (b) Block diagram of the interrogation system with equivalent circuit in the Laplace domain to derive V1P(s) during the detection phase of the time-gated technique applied to an electromechanical piezoelectric resonator.

Figure 13.
Comparison of the relative deviation (frP − fr)/fr obtained from the time-gated technique and the impedance technique as a function of k for three different values of the ratio CP/Cr.
Figure 13.
Comparison of the relative deviation (frP − fr)/fr obtained from the time-gated technique and the impedance technique as a function of k for three different values of the ratio CP/Cr.
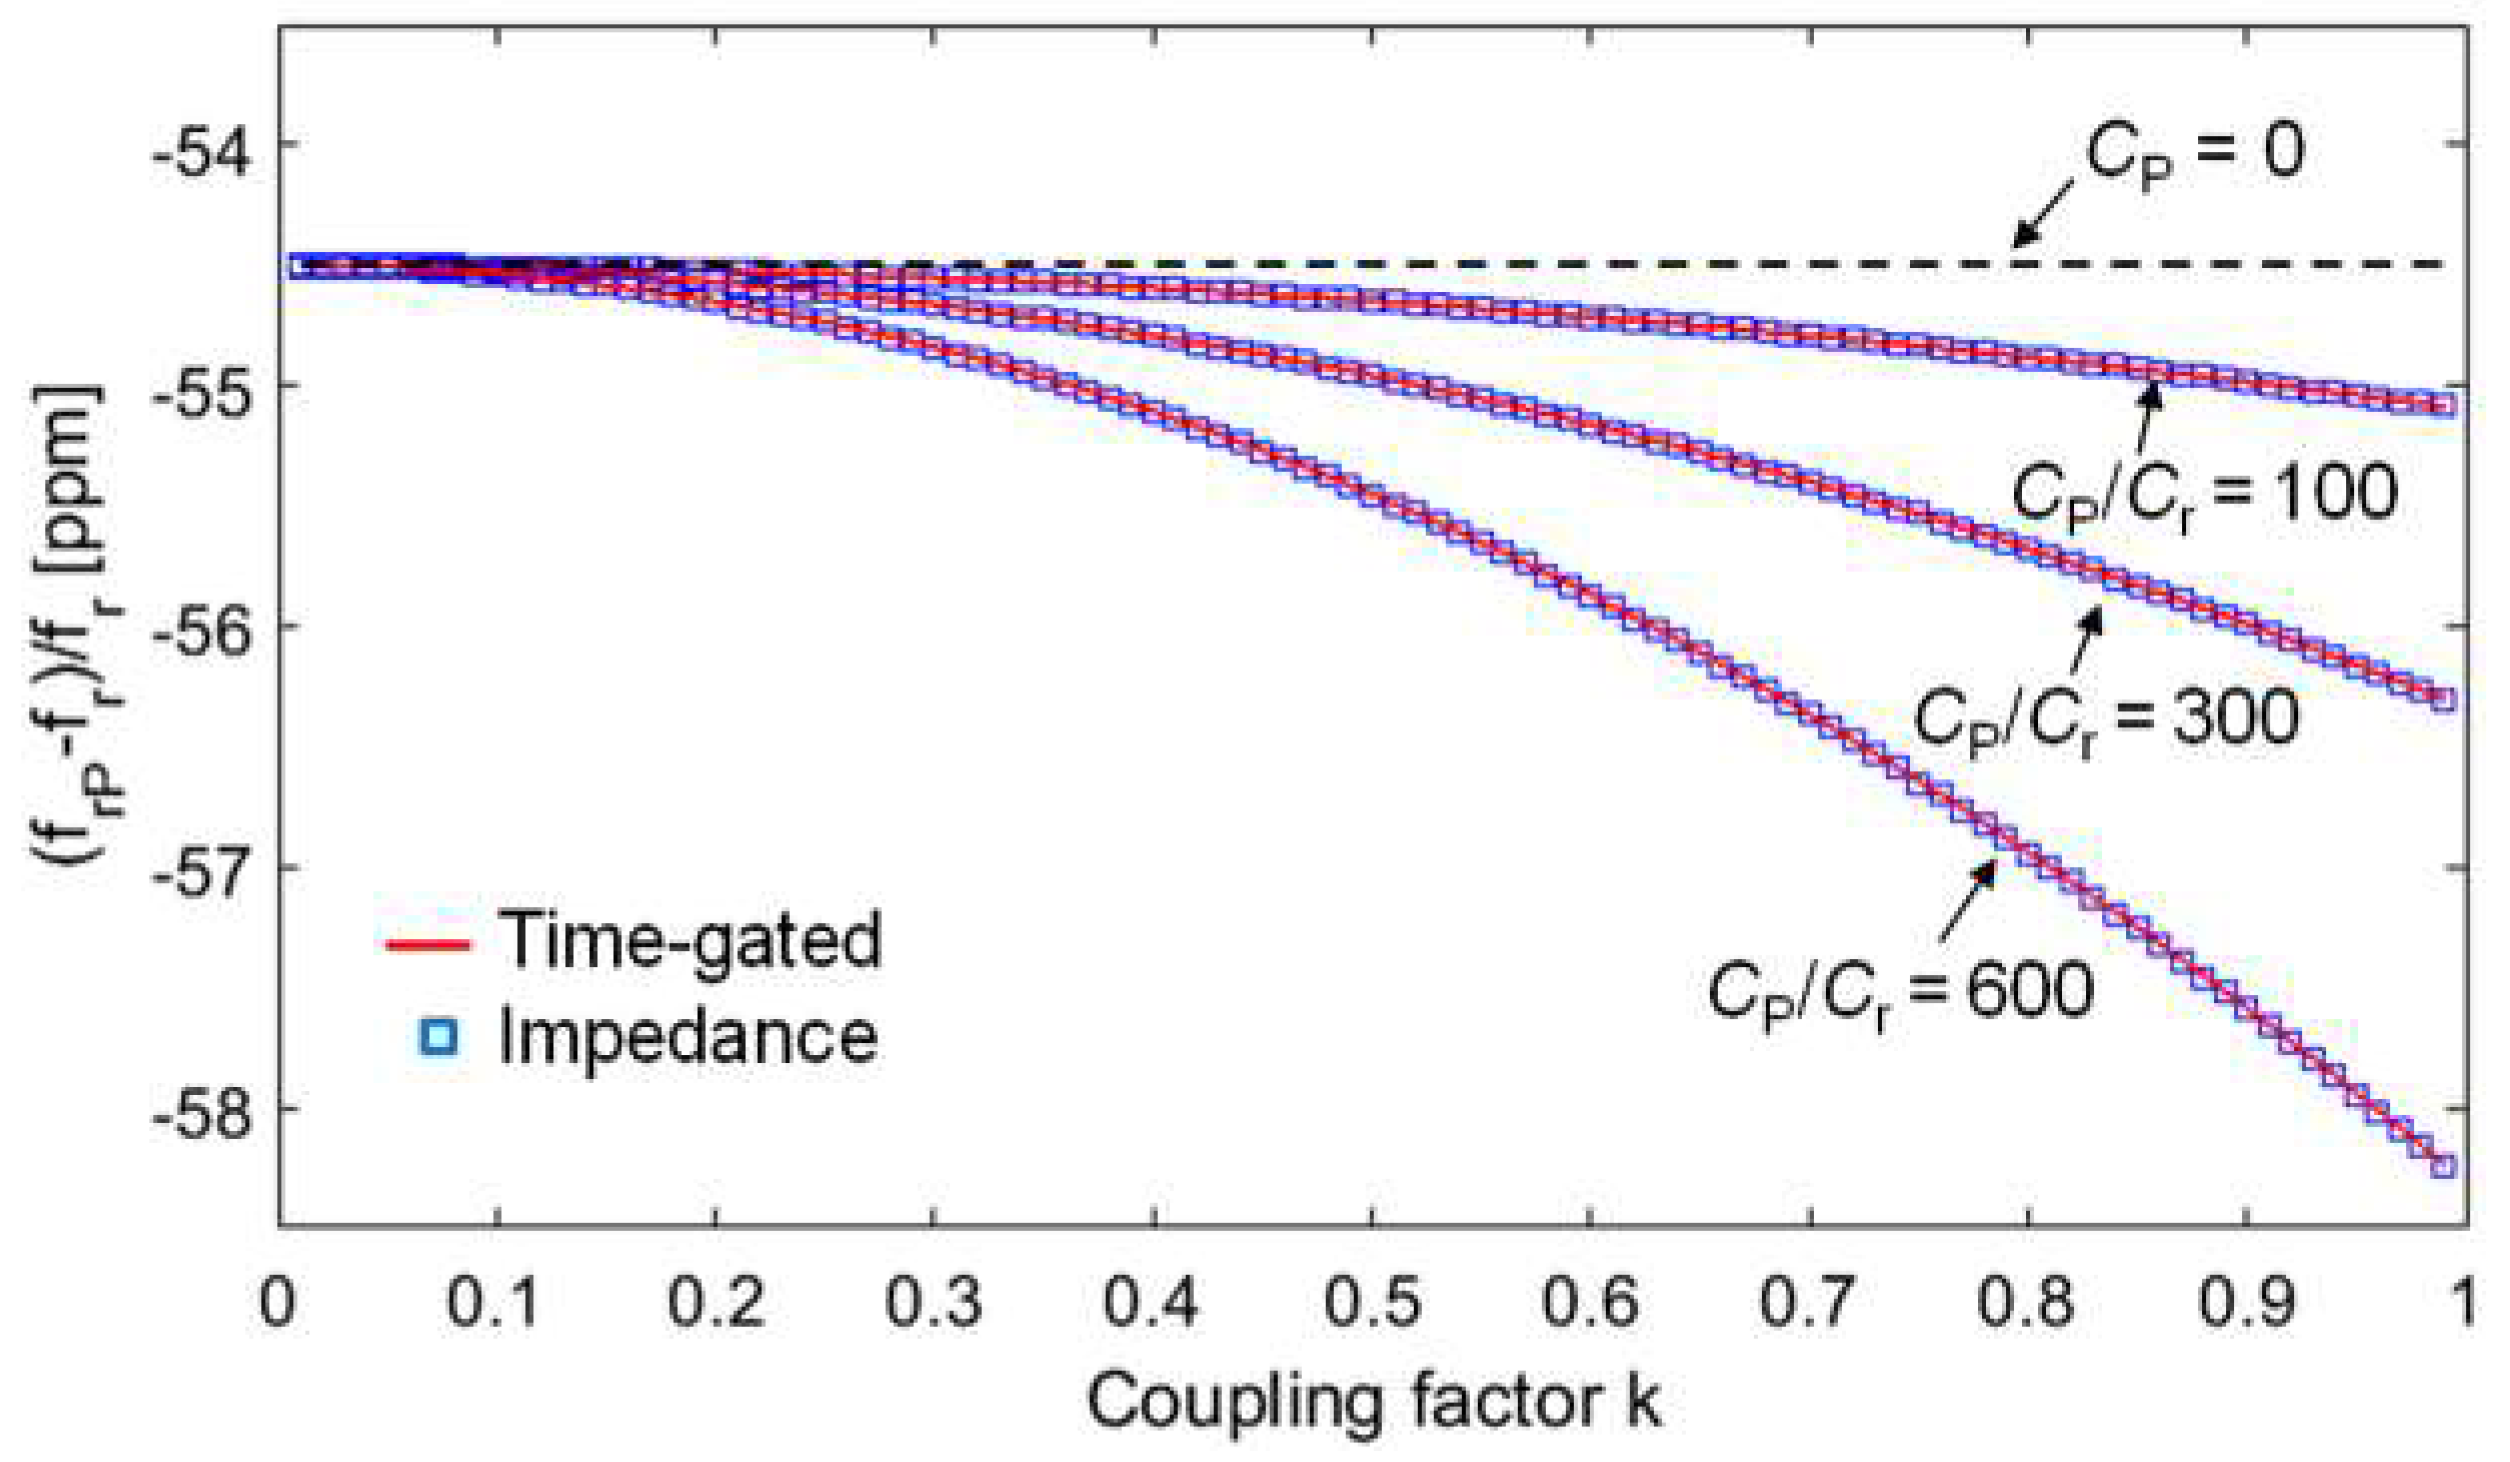
Figure 14.
Block diagram of the interrogation system based on impedance measurement technique with parasitic capacitance compensation circuit.
Figure 14.
Block diagram of the interrogation system based on impedance measurement technique with parasitic capacitance compensation circuit.

Figure 15.
Block diagram of the interrogation system based on of time-gated technique with parasitic capacitance compensation circuit.
Figure 15.
Block diagram of the interrogation system based on of time-gated technique with parasitic capacitance compensation circuit.

Figure 16.
Schematic diagram of the parasitic capacitance compensation circuit.

Figure 17.
Experimental setup and interrogation system based on impedance-measurement technique with parasitic capacitance compensation.
Figure 17.
Experimental setup and interrogation system based on impedance-measurement technique with parasitic capacitance compensation.

Figure 18.
Measured maxima in Re{Z1P} around fS for different values of the compensation CC, varying the distance d between CL1 and the RSU. The frequency of the maxima at fmP is highlighted with a black circle.
Figure 18.
Measured maxima in Re{Z1P} around fS for different values of the compensation CC, varying the distance d between CL1 and the RSU. The frequency of the maxima at fmP is highlighted with a black circle.

Figure 19.
Measured frequency fmP as a function of d for different values of CC. The no compensation data are extrapolated from experimental values.
Figure 19.
Measured frequency fmP as a function of d for different values of CC. The no compensation data are extrapolated from experimental values.

Figure 20.
(a) Real part of Z1P measured around the mechanical resonant frequency fr of the quartz crystal resonator (QCR) connected to the primary coil CL1 for different distances d. The frequency of the maxima at frP is highlighted with a black circle. (b) Frequency frP as a function of d. The error bars report the standard deviations calculated over 5 repeated measurements.
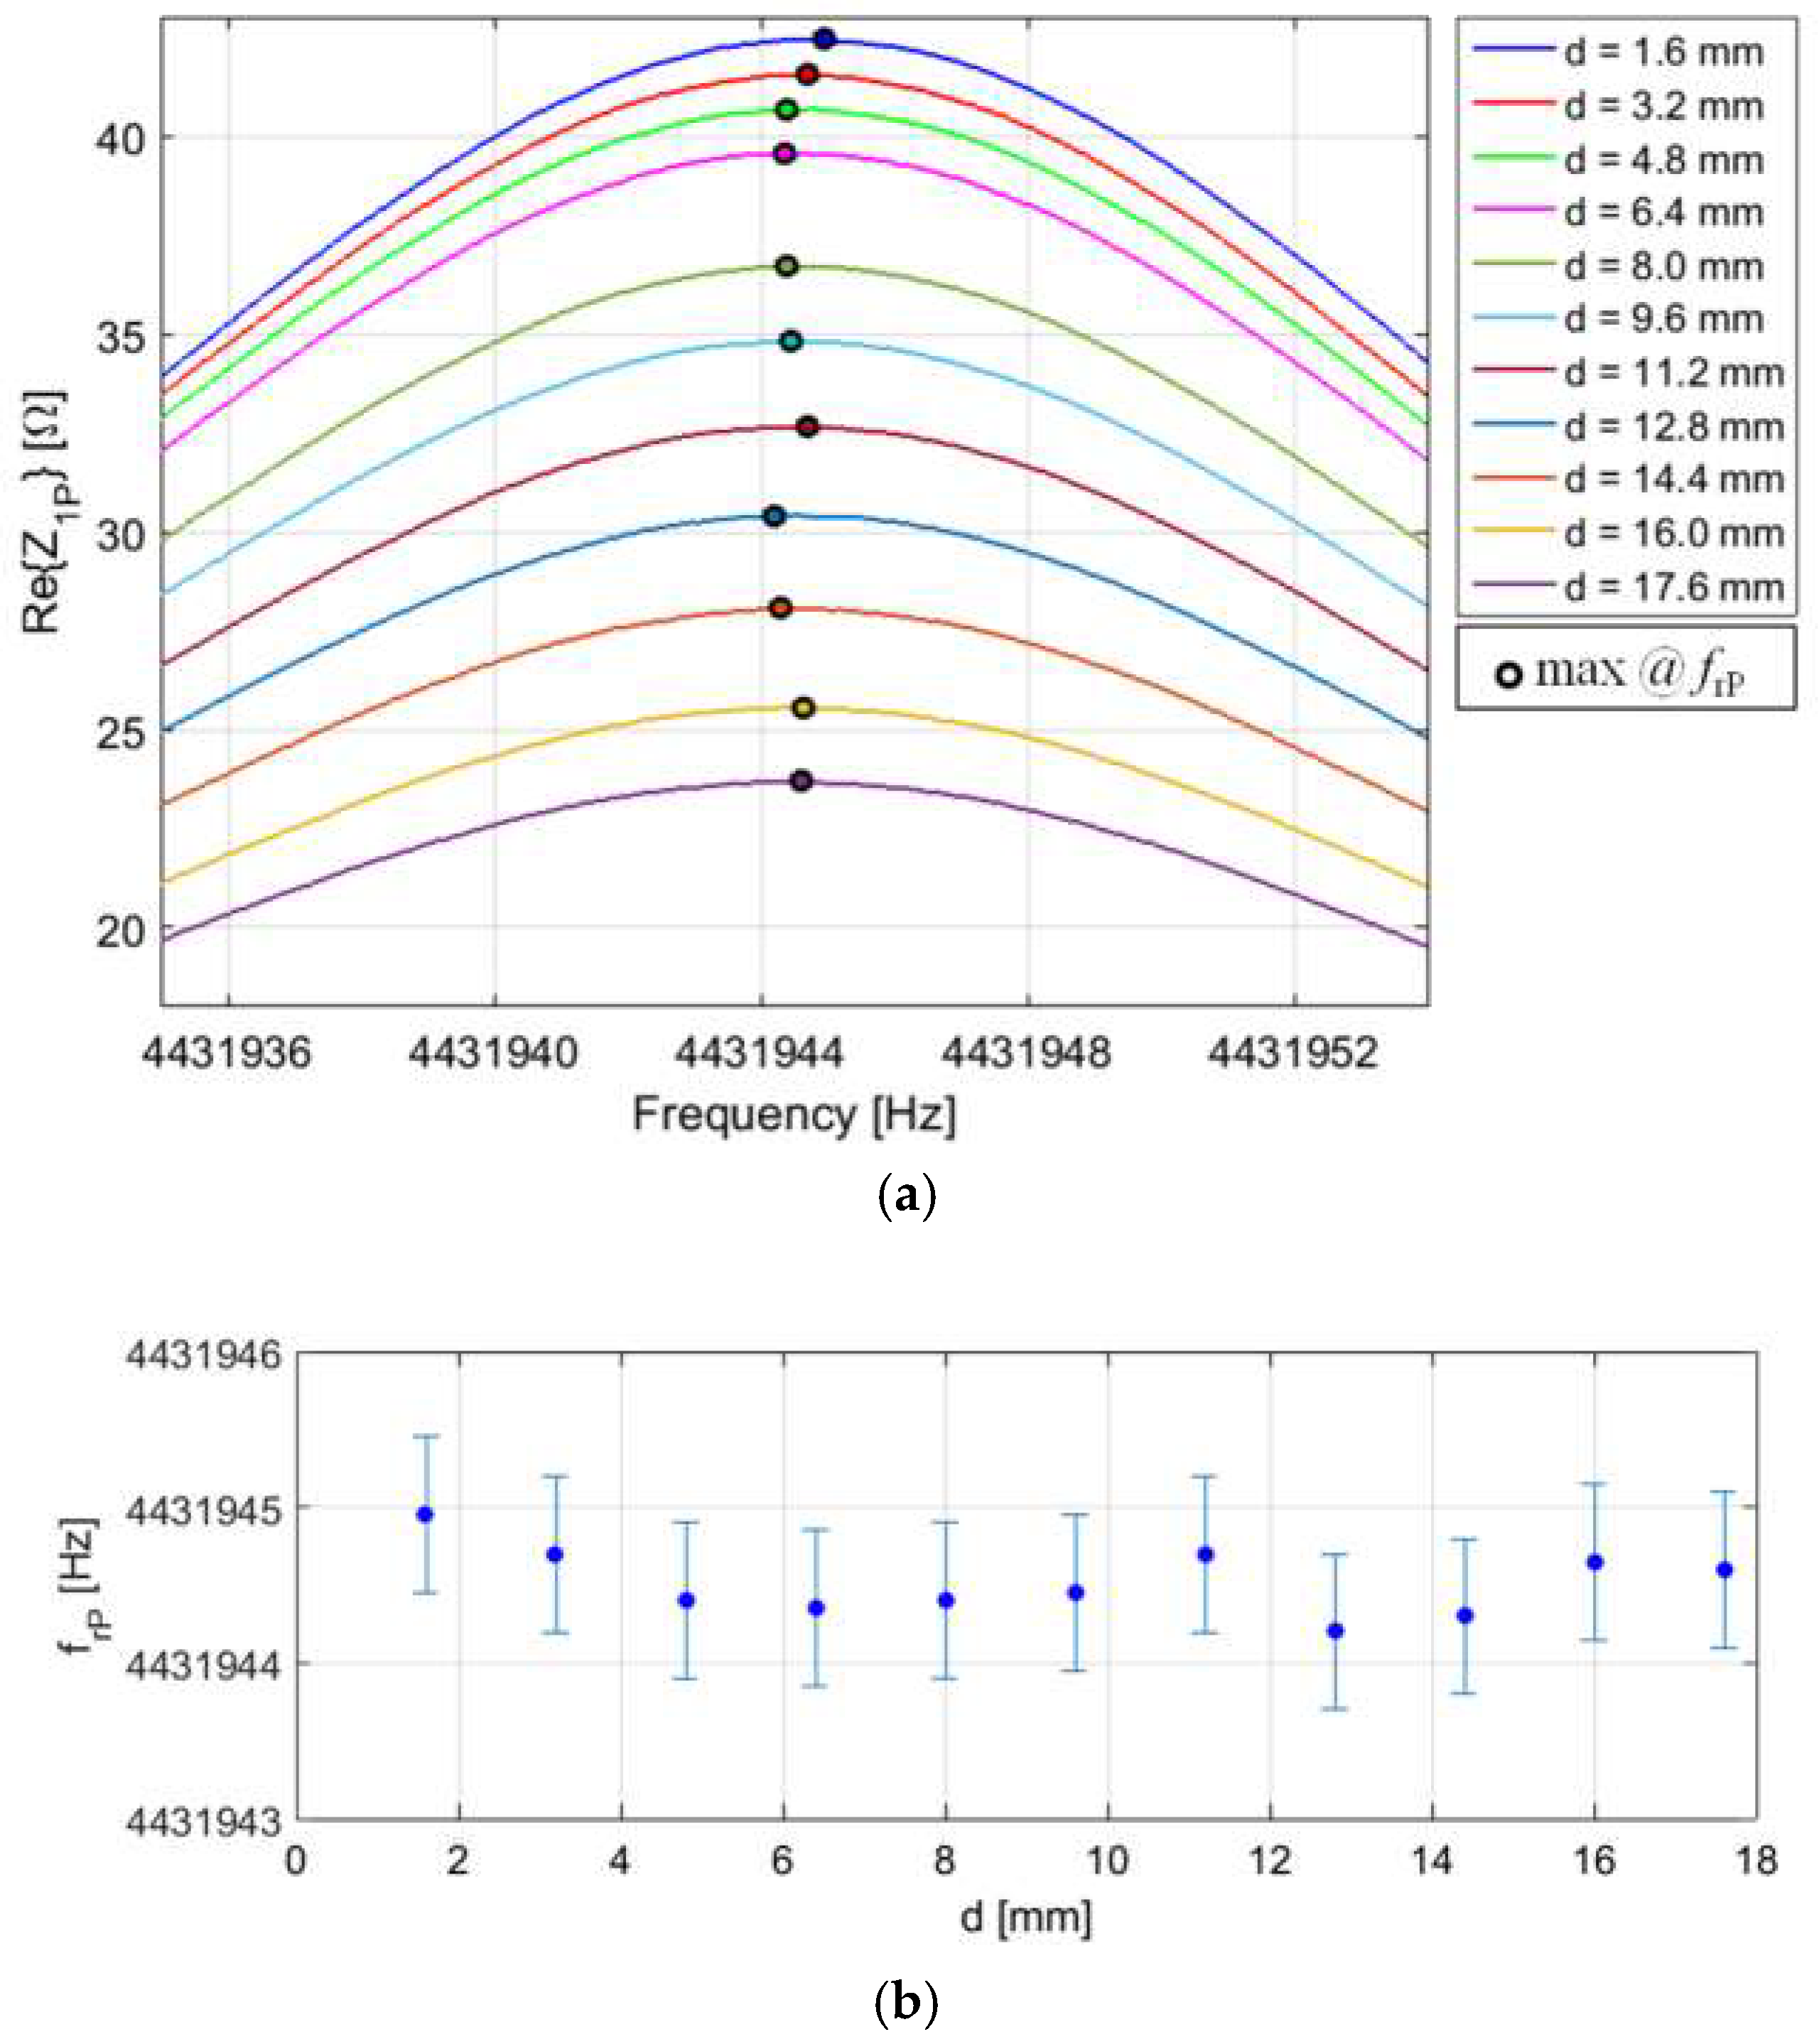
Figure 21.
Picture of the experimental setup developed to implement the time-gated technique.

Figure 22.
Measured output signal vO(t) during the detection phase. Indications of the adopted delay time TD and measurement time TM are reported.
Figure 22.
Measured output signal vO(t) during the detection phase. Indications of the adopted delay time TD and measurement time TM are reported.

Figure 23.
Frequency fdP of the damped sinusoid v1P(t) measured as a function of the interrogation distance d for different values of the compensation capacitance CC. A delay time TD = 2 µs and a measurement time TM = 6 µs have been set in the measurements.
Figure 23.
Frequency fdP of the damped sinusoid v1P(t) measured as a function of the interrogation distance d for different values of the compensation capacitance CC. A delay time TD = 2 µs and a measurement time TM = 6 µs have been set in the measurements.

Figure 24.
(a) Measured output signal vO(t) at the beginning of the detection phase for three different interrogation distances d. (b) Frequency frP as a function of d measured with a delay time TD = 5 µs and a measurement time TM = 10 ms. The error bars report the standard deviations calculated over 30 repeated measurements.

© 2018 by the authors. Licensee MDPI, Basel, Switzerland. This article is an open access article distributed under the terms and conditions of the Creative Commons Attribution (CC BY) license (http://creativecommons.org/licenses/by/4.0/).
Share and Cite
MDPI and ACS Style
Demori, M.; Baù, M.; Ferrari, M.; Ferrari, V. Interrogation Techniques and Interface Circuits for Coil-Coupled Passive Sensors. Micromachines 2018, 9, 449. https://doi.org/10.3390/mi9090449
AMA Style
Demori M, Baù M, Ferrari M, Ferrari V. Interrogation Techniques and Interface Circuits for Coil-Coupled Passive Sensors. Micromachines. 2018; 9(9):449. https://doi.org/10.3390/mi9090449
Chicago/Turabian StyleDemori, Marco, Marco Baù, Marco Ferrari, and Vittorio Ferrari. 2018. "Interrogation Techniques and Interface Circuits for Coil-Coupled Passive Sensors" Micromachines 9, no. 9: 449. https://doi.org/10.3390/mi9090449
Note that from the first issue of 2016, this journal uses article numbers instead of page numbers. See further details here.