Article

Paper-Based Sensor Chip for Heavy Metal Ion Detection by SWSV

1
State Key Laboratory of Transducer Technology, Institute of Electrics, Chinese Academy of Sciences, Beijing 100190, China
2
University of Chinese Academy of Sciences, Beijing 100190, China
*
Authors to whom correspondence should be addressed.
Micromachines 2018, 9(4), 150; https://doi.org/10.3390/mi9040150
Submission received: 26 February 2018 / Revised: 24 March 2018 / Accepted: 26 March 2018 / Published: 27 March 2018
(This article belongs to the Special Issue Paper-Based Transducers and Electronics)

Abstract

:
Heavy metal ion pollution problems have had a terrible influence on human health and the environment. Therefore, the monitoring of heavy metal ions is of great practical significance. In this paper, an electrochemical three-electrode system was fabricated and integrated on nitrocellulose membrane (NC) by the use of magnetron sputtering technology, which exhibited a uniform arrangement of porous structure without further film modification. This paper-based sensor chip was used for Cu2+ detection by square-wave stripping voltammetry (SWSV). Within the ranges of 5–200 μg·L−1 and 200–1000 μg·L−1, it showed good linearity of 99.58% and 98.87%, respectively. The limit of detection was 2 μg·L−1. On the basis of satisfying the detection requirements (10 μg·L−1), the integrated sensor was small in size and inexpensive in cost. Zn2+, Cd2+, Pb2+ and Bi3+ were also detected by this paper-based sensor chip with good linearity.

1. Introduction

Some of the heavy metal ions are necessary trace elements for human life activities, but they are mostly harmful to the environment and human health if their concentrations exceed the standard limit [1,2]. It is therefore important to be able to detect the concentration of heavy metal ions.
Metal ion detection methods [3] mainly include atomic spectroscopy [4], UV–visible spectrophotometry [5], mass spectrometry [6], electrochemical analysis [7], etc. Electrochemical analysis is recognized as a fast and sensitive method. As one of the electrochemical analysis methods, anodic stripping voltammetry is high in accuracy, widely applicable, and easy to miniaturize. The electrochemical analysis method relies on a three-electrode system (WE, working electrode; CE, counter electrode; RE, reference electrode) in which the working electrode is the core part and its performance is critical to the detection result. The working electrode is mostly a solid-state electrode. Usually, the sensitivity and specificity can be improved by sensing membrane modification [8,9,10,11]. Xing [12] et al. designed the N-type-graphene-modified electrode to achieve the goal of analyzing Ca2+, Pb2+, and Cu2+ simultaneously with high sensitivity. Wang [13] et al. used gold nanoparticles to modify a microelectrode chip, which resulted in a lower detection limit for detecting Pb2+ and Cu2+.
Since 2007, the advantages of paper-based materials have attracted more attention. They can be wildly used in public health, clinical diagnostics [14], paper microfluidics [15], environmental monitoring, etc. For example, Ainla [16] et al. designed electrically activated fluidic valves fabricated using textiles. The valves had fast response and low energy consumption. They can be used in paper-based microfluidic devices. Many researchers have also tried to prepare paper-based sensors for heavy metal ion detection [17,18,19]. Ensafi [20] et al. prepared low-cost screen-printed electrodes (SPE) and developed a signal enhancement method through gold nanoparticles. It had low limit detection for As3+. Feng [21] et al. designed hydrophobic areas on paper-based materials and sensor arrays were formed based on the structure of paper. According to the colorimetric method, it qualitatively distinguished Cu2+, Zn2+, Ni2+, Co2+, and some other heavy metal ions.
There are several kinds of methods for fabricating paper-based sensors, such as wax printing technology [22], inkjet printing technology [23], screen printing technology [24], etc. These methods are easy to operate but most of them are thick-film technologies. As a kind of physical vapor deposition technology, magnetron sputtering technology can be used to prepare thin metal films. It gives a better control of the film thickness and has strong adhesion. Paper-based materials provide a kind of porous microstructure leading to capillary action. This is beneficial for integrating the microchannel. On the basis of keeping the original space structure, if a metal film with appropriate thickness can be constructed over the paper, an electrode with three-dimensional structure will be developed. This is useful in helping the working electrode to accumulate the target ions and then improve the detection efficiency. Based on these characteristics, in this paper, nitrocellulose membrane (NC) with regular dimensional structure was used as the substrate, and magnetron sputtering technology was applied to fabricate the sensor chip for high-sensitivity and low-cost heavy metal ion detection by the electrochemical method.

2. Materials and Methods

2.1. Chemicals and Reagents

NC paper (0.45 μm) was purchased from GE Healthcare (Freiburg, Germany). Copper(II), lead(II), cadmium(II), zinc(II), and bismuth(III) solutions were purchased from Institute for Environment Reference Materials Ministry of Environmental Protection (Beijing, China); acetic acid (HAC), anhydrous sodium acetate (NaAC), potassium chloride (KCl), potassium ferricyanide (K3[Fe(CN)6]), and potassium ferrocyanide (K4[Fe(CN)6]) were obtained from Xi Long Chemical Cn. (Guangdong, China); and 95% concentrated sulfuric acid (H2SO4) was obtained from Beijing Chemical Works (Beijing, China). All chemical reagents were of analytical grade, and the water used in the experiments was deionized water. All the experiments were done at room temperature.

2.2. Apparatus

Magnetron sputtering equipment was purchased from SKY Technology Development (Shenyang, China). Characterization of the electrodes’ surface by scanning electron microscopy (SEM) and component analysis by energy-dispersive X-ray spectroscopy (EDS) were performed using an S-4800 emission microscope (Tokyo, Japan). A Gamry Reference 600 electrochemical analyzer was used for the electrochemistry analysis (Warminster, PA, USA). A digital pH meter (PHS-3C) was acquired from Shanghai Instrument Electric Science Instrument Limited by Share Ltd. (Shanghai, China). Water quality workstations (Direct-Q3) were purchased from Millipore Company (Darmstadt, Germany).

2.3. Fabrication of Paper-Based Electrodes

NC paper has a uniform and porous structure with apertures of 0.45 μm. Firstly, the mask plate within 1 mm thickness was designed and prepared by mechanical processing using stainless steel or 3D printing using UV-curable resin (SOMOS8000). Secondly, the paper-based sensor electrode was fabricated using magnetron sputtering technology. The thickness of the sputtered Au was 750 Å. After that, an Ag/AgCl slurry was coated on the reference electrode, and then thermal cured at 80 °C for 10 min to form a simple disposable RE. At last, hydrophobic treatment with wax was performed to isolate the reaction area and pad area of the electrode chip due to the hydrophilic nature of NC paper, so that the electrochemical reaction area was defined. Wax was heated to melting and then dropped on the hydrophobic area. When the wax was solidified, effective hydrophilic/hydrophobic areas were formed on the NC paper. As shown in Figure 1a, the paper-based electrode chip was divided into pad area, hydrophobic area, and reaction area after hydrophobic treatment. Figure 1b shows the top surface of the junction of the hydrophilic/hydrophobic areas.

2.4. Package of the Electrode System

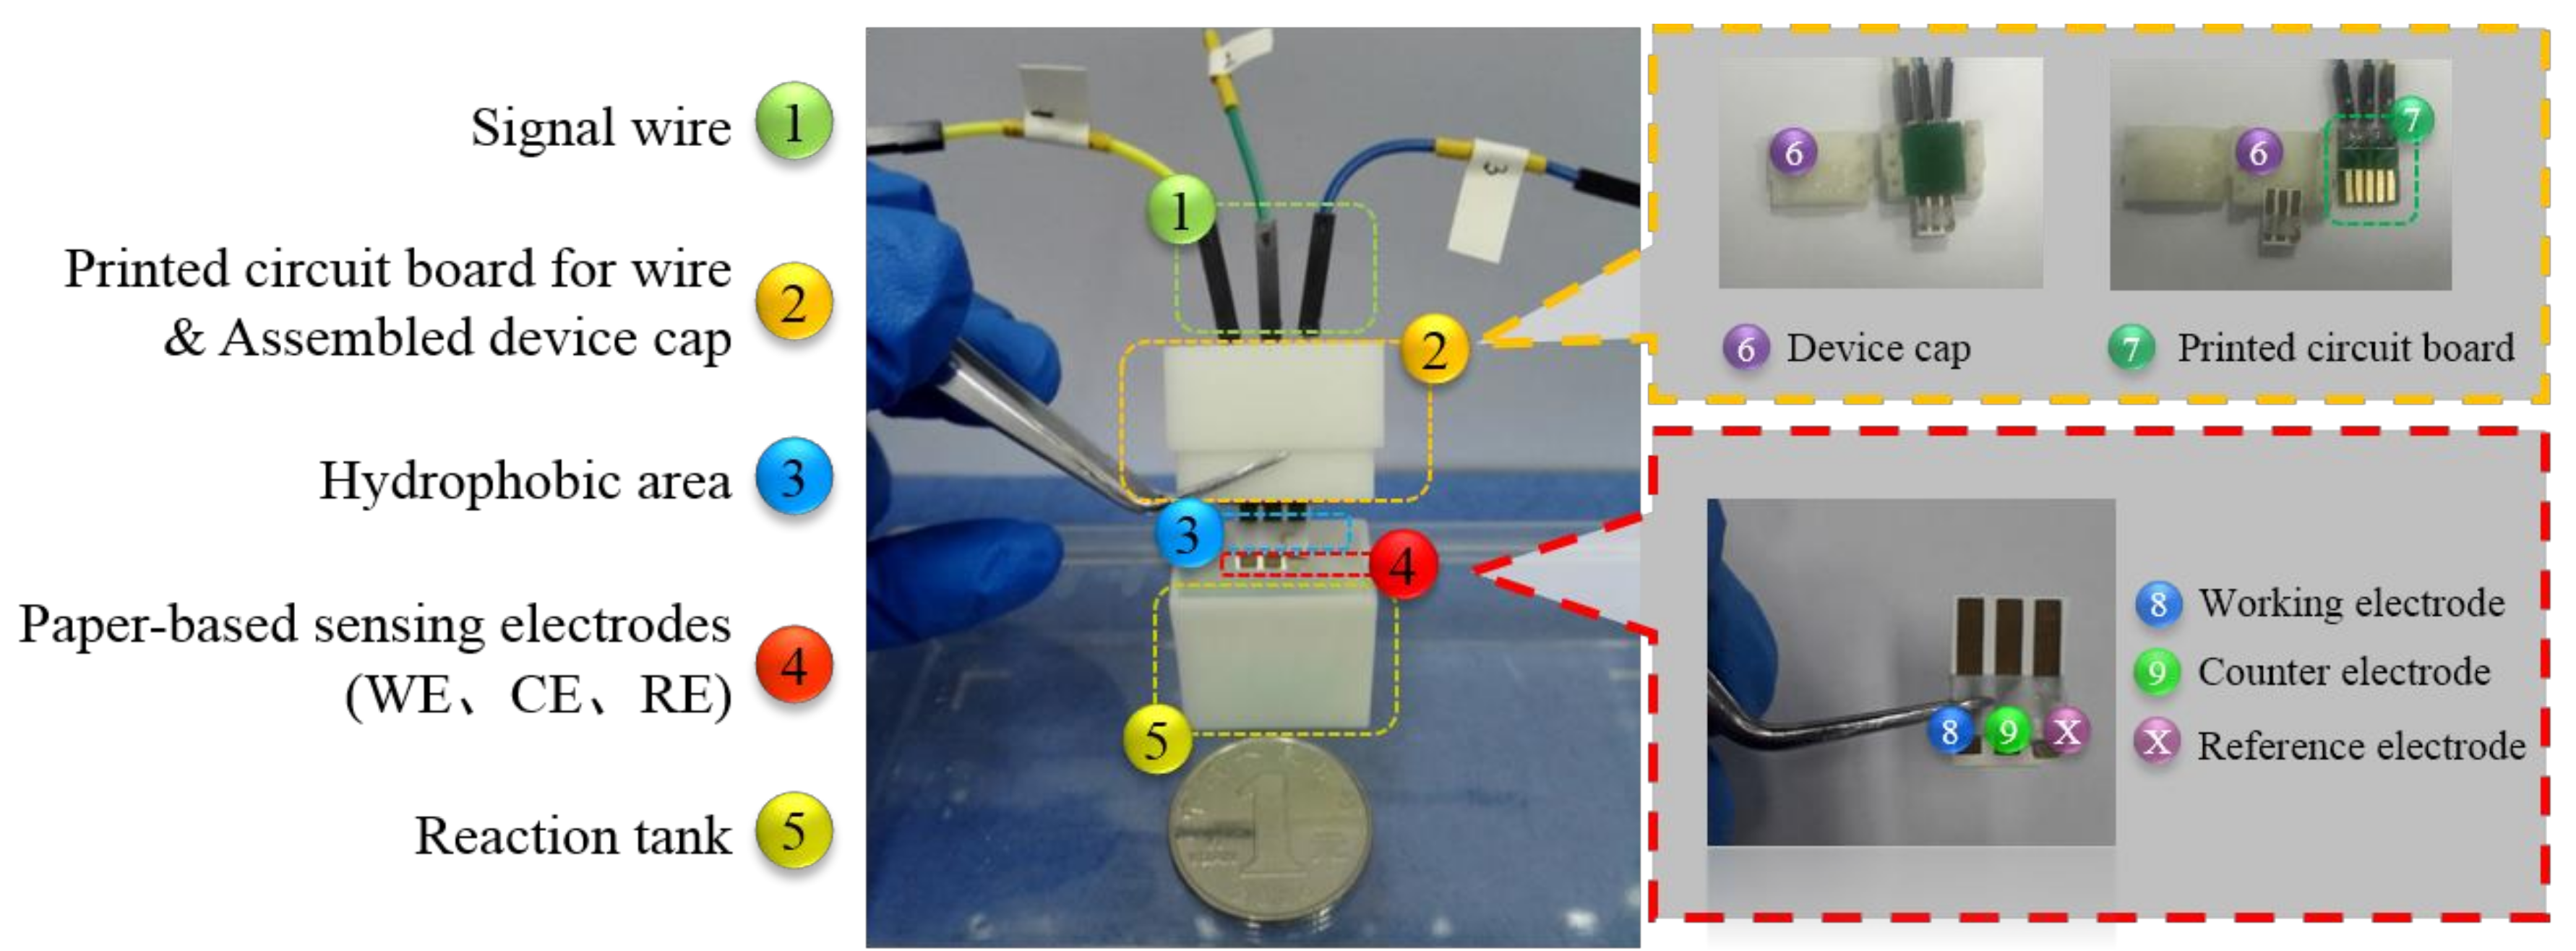
NC paper is a kind of flexible material, and the signal wire is difficult to connect using ultrasonic bonding or thermo-compression bonding technology. In this paper, a printed circuit board was designed. It can contact closely with the paper-based electrodes, so applying the driving voltage and acquiring the detection signal can be realized. The portable detection device was produced from UV-curable resin (SOMOS8000) with low-viscosity material through 3D printing. The whole experimental device is shown in Figure 2.

2.5. Square-Wave Stripping Voltammetry Measurement of Cu2+

Cu2+ sample solutions were prepared using HAC–NaAC buffer solution. The concentration of HAC–NaAC in the Cu2+ sample solution was 0.1 mol·L−1.
The concentration of Cu2+ was determined by square-wave stripping voltammetry (SWSV). There were three steps, and the parameters were set to (1) cleaning: potential 1 V, time 60 s; (2) accumulation: potential −0.2 V, time 120 s; (3) detection by square wave plus voltammetry: range −0.2–+0.8 V, frequency 25 Hz, pulse size 25 mV, step size 5 mV.

3. Results and Discussion

3.1. Characterization of Paper-Based Electrodes

3.1.1. SEM and EDS Characterization

The paper-based sensor electrodes were characterized by scanning electron microscopy (SEM) and energy-dispersive X-ray spectroscopy (EDS). The results are shown in Figure 3.
The NC paper had a regular three-dimensional porous network structure in microscopic vision, and the fiber surface was smooth (due to the insulation of the NC paper, it was pretreated by Pt before SEM detection).
Paper-based electrodes prepared by inkjet printing had good conductivity, but the silver particles were dense and uniformly distributed on the surface. There was no porous structure which was analogous with rigid-based materials.
After sputtering with Au, the spatial structure was similar to that of the NC paper, but there were Au particles adhered to the surface, which looked like a 3D-structured electrode.

3.1.2. Electrochemical Characteristics

Three electrodes—WE, CE, and RE—were integrated on this paper-based sensor chip. Their respective electrochemical performances are discussed in the following. Three electrodes were tested in each experiment, and each experiment was performed three times.
(1) Working Electrode
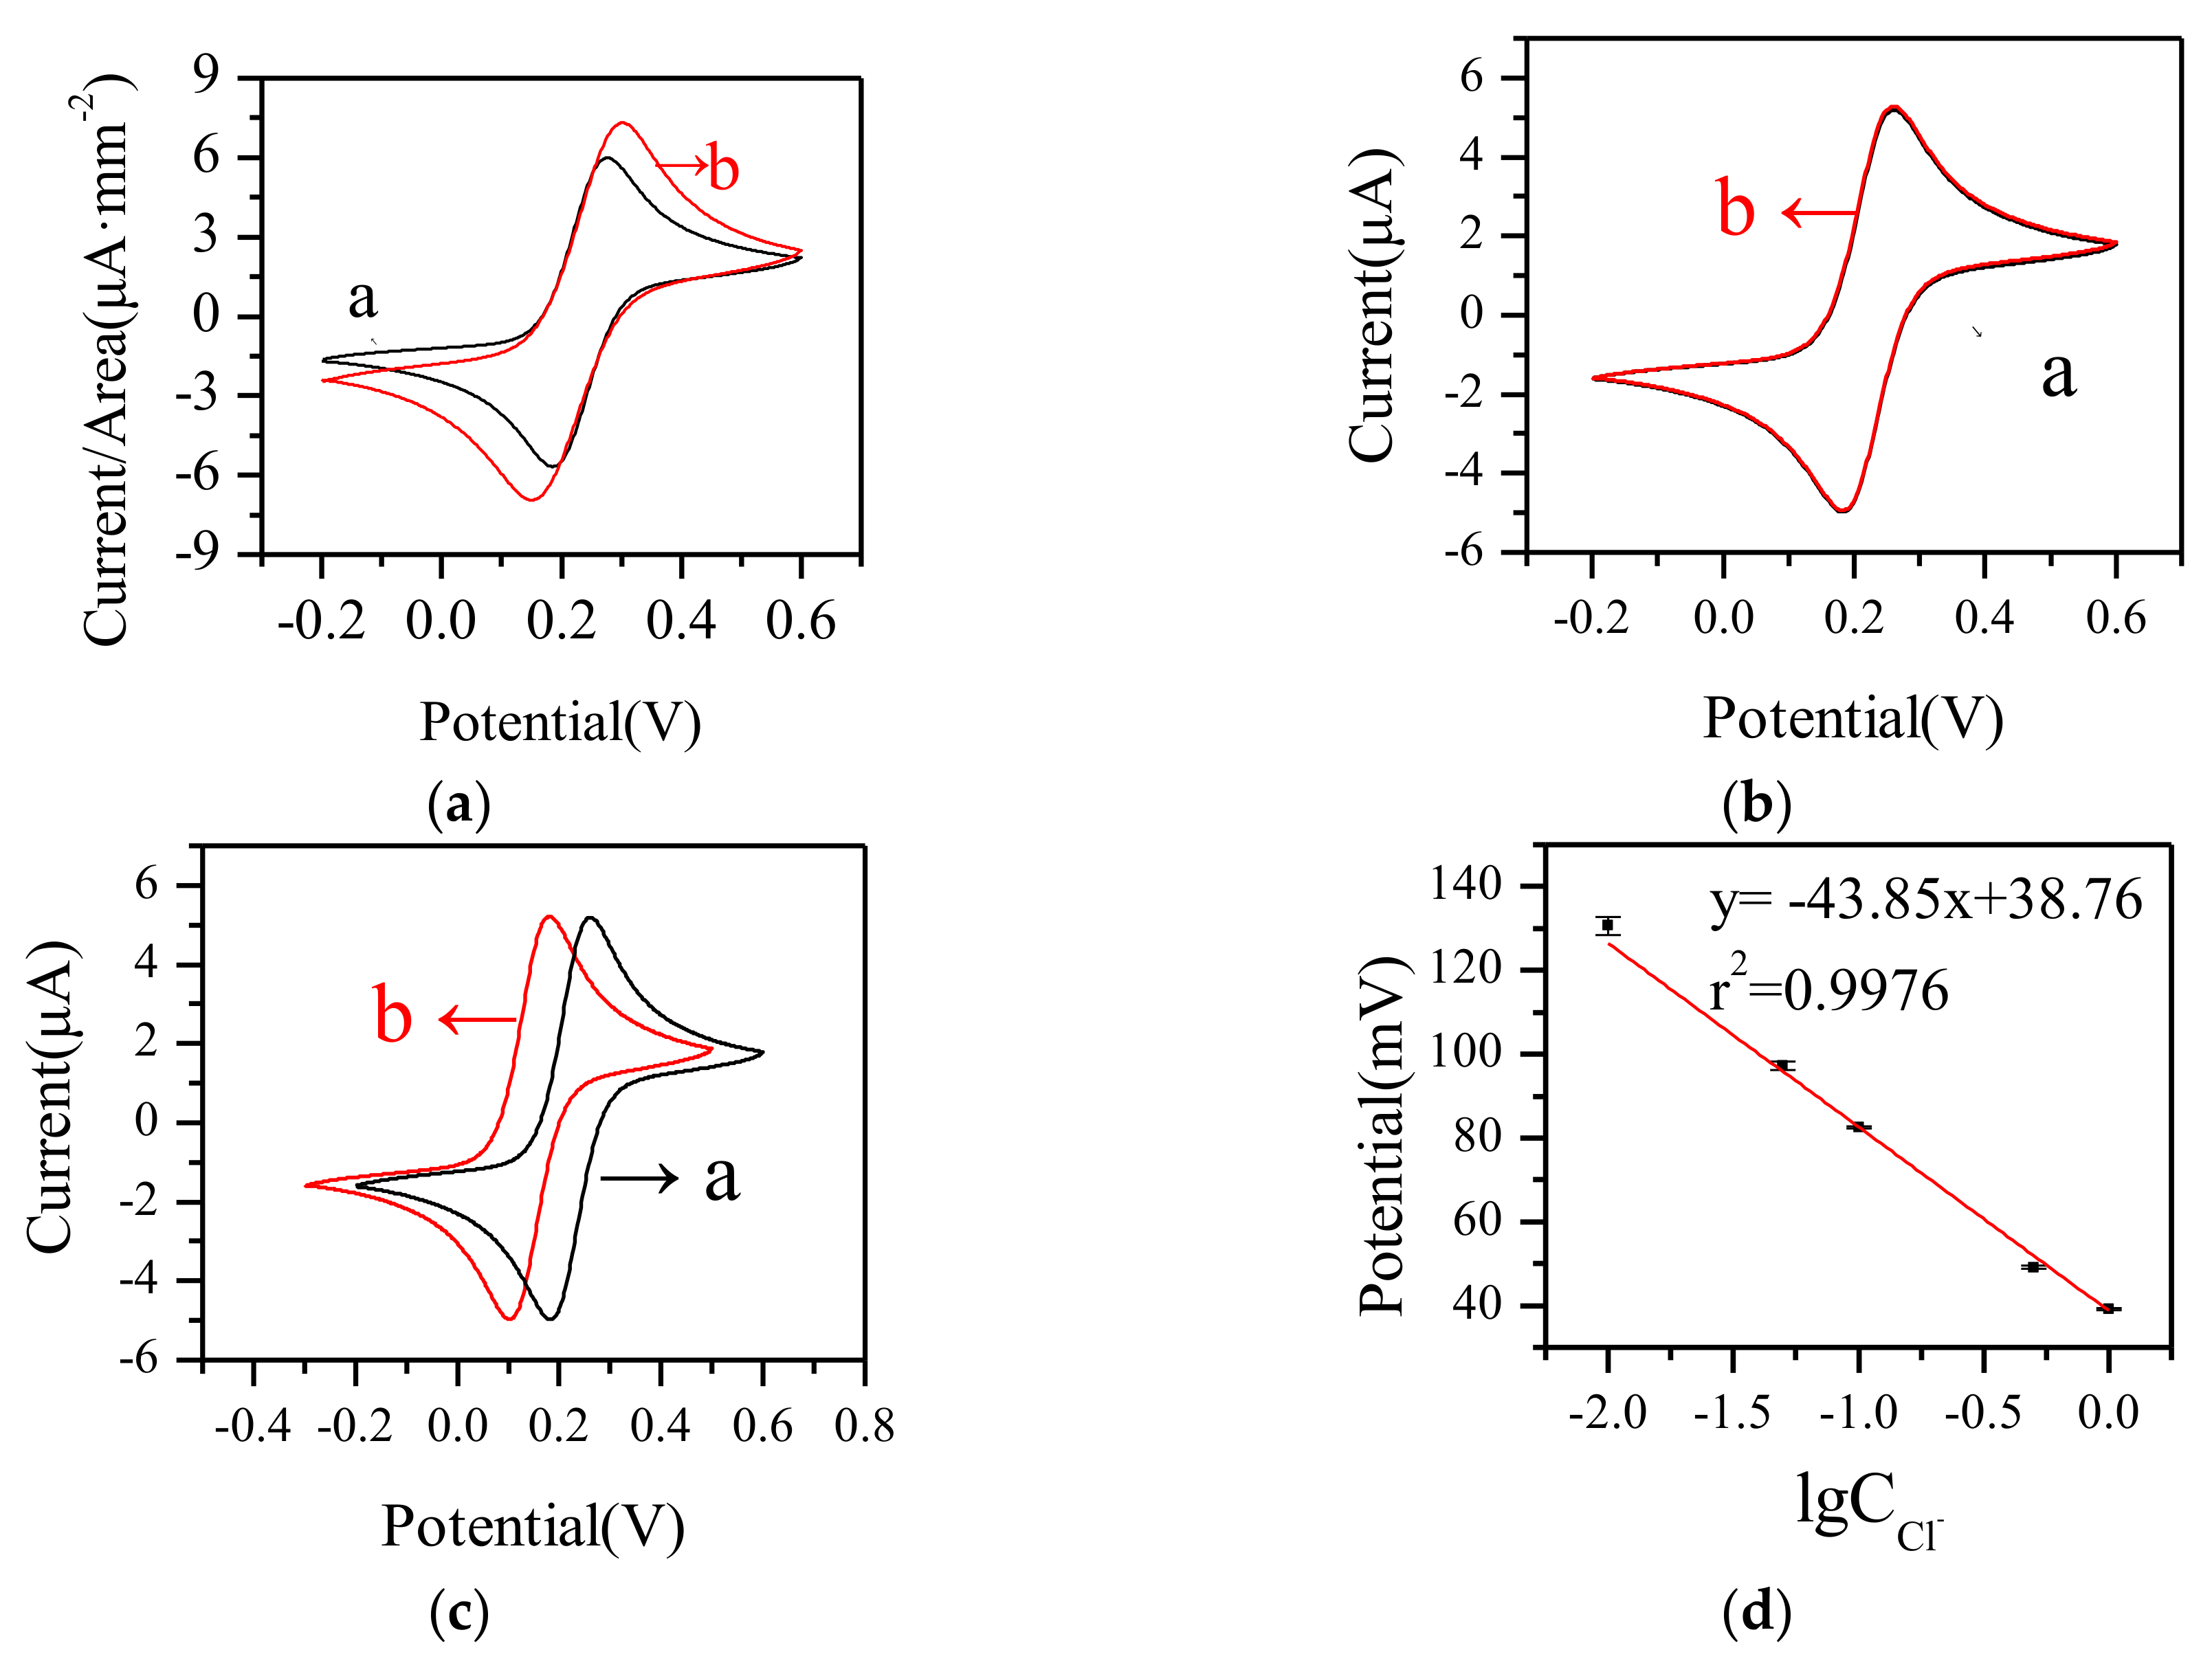
The electrochemical characteristics of the paper-based Au WE were investigated and compared with a commercial Au WE by cyclic voltammetry (CV) in 2.5 mM Fe(CN)63−/4− solution. A commercial Pt electrode and an Ag/AgCl electrode were used as the counter electrode and reference electrode. As shown in Figure 4a, the paper-based electrode had larger response current density, and the relative standard deviation (RSD) of the paper-based WE was 5.21% (n = 3) in 2.5 mM Fe(CN)63−/4− solution. As the porous structure increased the effective surface area of the working electrode, it was useful to the electrochemical reaction, which helped to increase the effective working area and enhance the response current.
(2) Counter Electrode
The main function of the counter electrode is to conduct current. The electrochemical characterization of the paper-based Au electrode using as a counter electrode was investigated by cyclic voltammetry and compared with the commercial Pt electrode. A commercial Au electrode and an Ag/AgCl electrode were used as the working electrode and reference electrode. The RSD of the paper-based CE was 1.48% (n = 3) in 2.5 mM Fe(CN)63−/4− solution. As shown in Figure 4b, the cyclic voltammetric curves of the paper-based Au counter electrode and commercial Pt electrode were similar. This indicated that the paper-based Au electrode had good conductivity and was effective in current conduction as a CE.
(3) Reference Electrode
The feasibility of the simple reference electrode was verified as shown in Figure 4c. The paper-based RE and an Ag/AgCl electrode were used as reference electrodes with a commercial Au working electrode and a Pt counter electrode. The redox peak current value of the paper-based RE was consistent with that of the Ag/AgCl RE., while the redox peak position was negatively shifted in the negative direction. This might be because of the concentration of Cl. As shown in Figure 4d, the bigger the concentration of Cl was, the less the drift was.
Figure 5a shows the surface morphology of the paper-based RE. This RE mostly contained Ag and Cl elements (Figure 5b), which promoted the properties of the reference electrode.
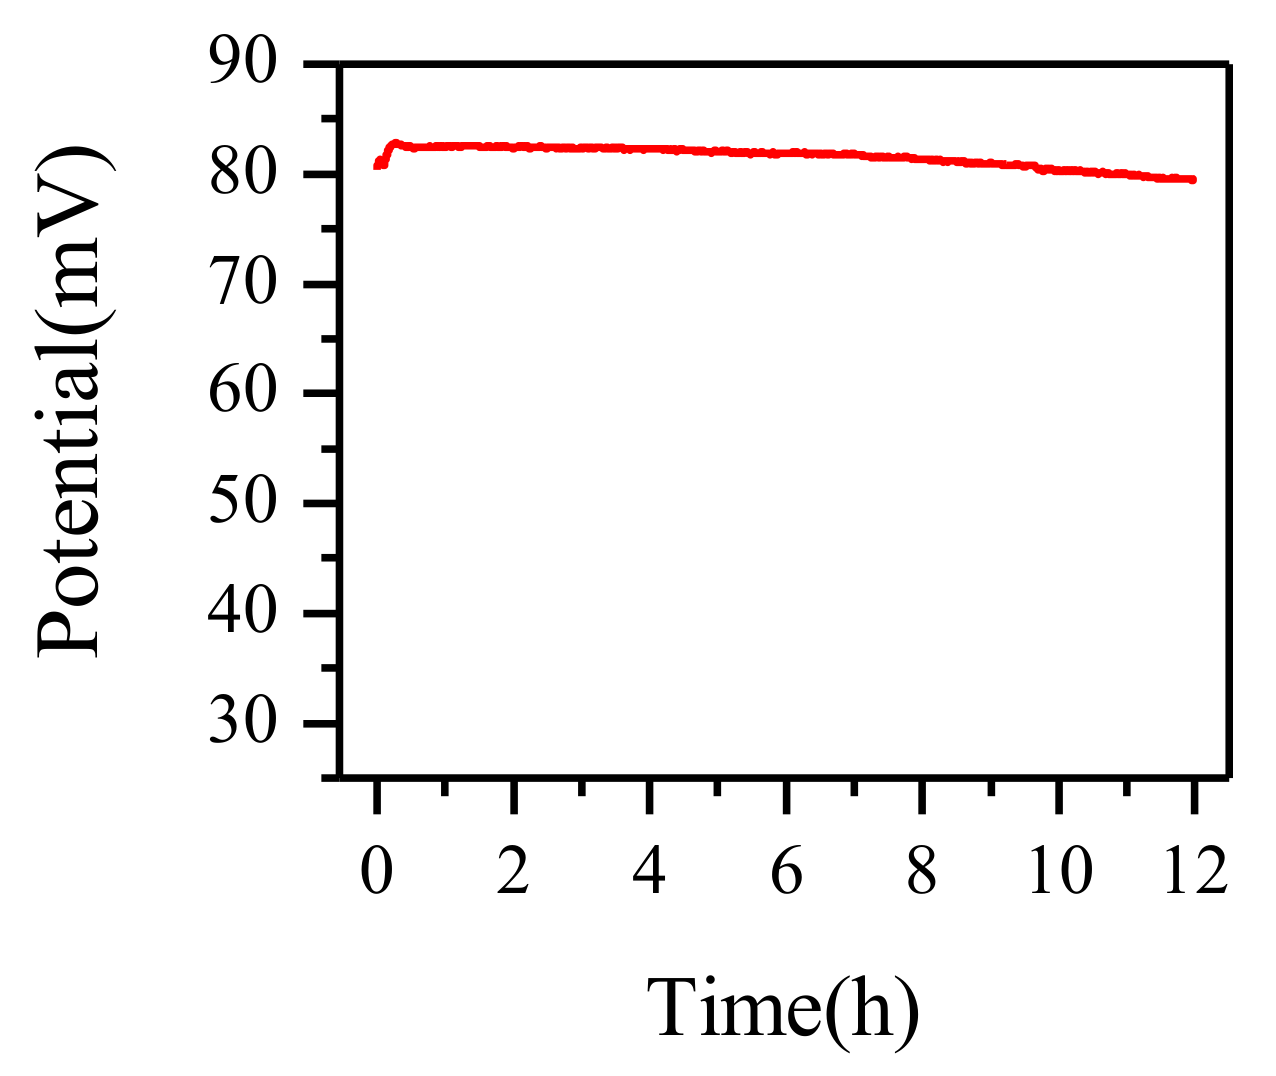
Potential stability was an important parameter in characterizing the RE. A well-operated RE must have little potential drift over time. As shown in Figure 6, during 12 h, the max drift value of the paper-based RE was 3.2 mV. The average of the per hour drift was only 0.27 mV. As for the reproducibility, the RSD of the paper-based RE was 0.37% (n = 3) in 2.5 mM Fe(CN)63−/4− solution.
Above all, the paper-based RE can be considered to have good stability and to be a suitable alternative to the commercial Ag/AgCl RE.

3.2. Optimization of Experimental Conditions

The experimental conditions were optimized in order to attain highly sensitive Cu2+ detection. In this paper, the effects of accumulation potential, accumulation time, and pH value on the peak current are discussed. All experiments had a single variable and the concentration of Cu2+ was 100 μg·L−1.

3.2.1. Optimization of Accumulation Potential

As shown in Figure 7a, with the accumulation potential shifting from −0.1 V to −0.2 V, the current response was increased. At −0.2 V, the response current achieved the biggest value. With the accumulation potential negative shifting further, the current response gradually decreased. The reason for this might be that the background current was also enhanced and the deposition of heavy metal ions was hindered by a hydrogen evolution reaction. Therefore, −0.2 V was selected in this work.

3.2.2. Optimization of Accumulation Time

The accumulation time was changed from 60 s to 180 s. As shown in Figure 7b, the longer the accumulation time was, the bigger the response current value. However, when the accumulation time was greater than 120 s, the growth rate slowed down. This might be due to the ions enriched on the electrode surface becoming saturated. Considering the efficiency, 120 s was selected for further work.

3.2.3. Optimization of pH Value

The pH value of the solution can be changed by adding HAC or NaOH, and during this process, the concentration of Cu2+ remained constant. As shown in Figure 7c, when the pH value was 4.4, the response current value reached the maximum. Analyzing the results, lower pH meant that the concentration of H+ was higher. H+ can be easily reduced to H2, and the reduction of heavy metal ions was blocked. While the pH was higher, heavy metal ions were prone to being hydrolyzed, affecting the determination. Thus, pH = 4.4 buffer solution was selected in this work.

3.3. Electrochemical Response to Cu2+ by Paper-Based Sensor Chip

Cu2+ was taken as the sample heavy metal ion in order to test the electrochemical properties of the paper-based sensor chip. The concentration of Cu2+ was tested in the range of 5–1000 μg·L−1. Each sample was tested three times.
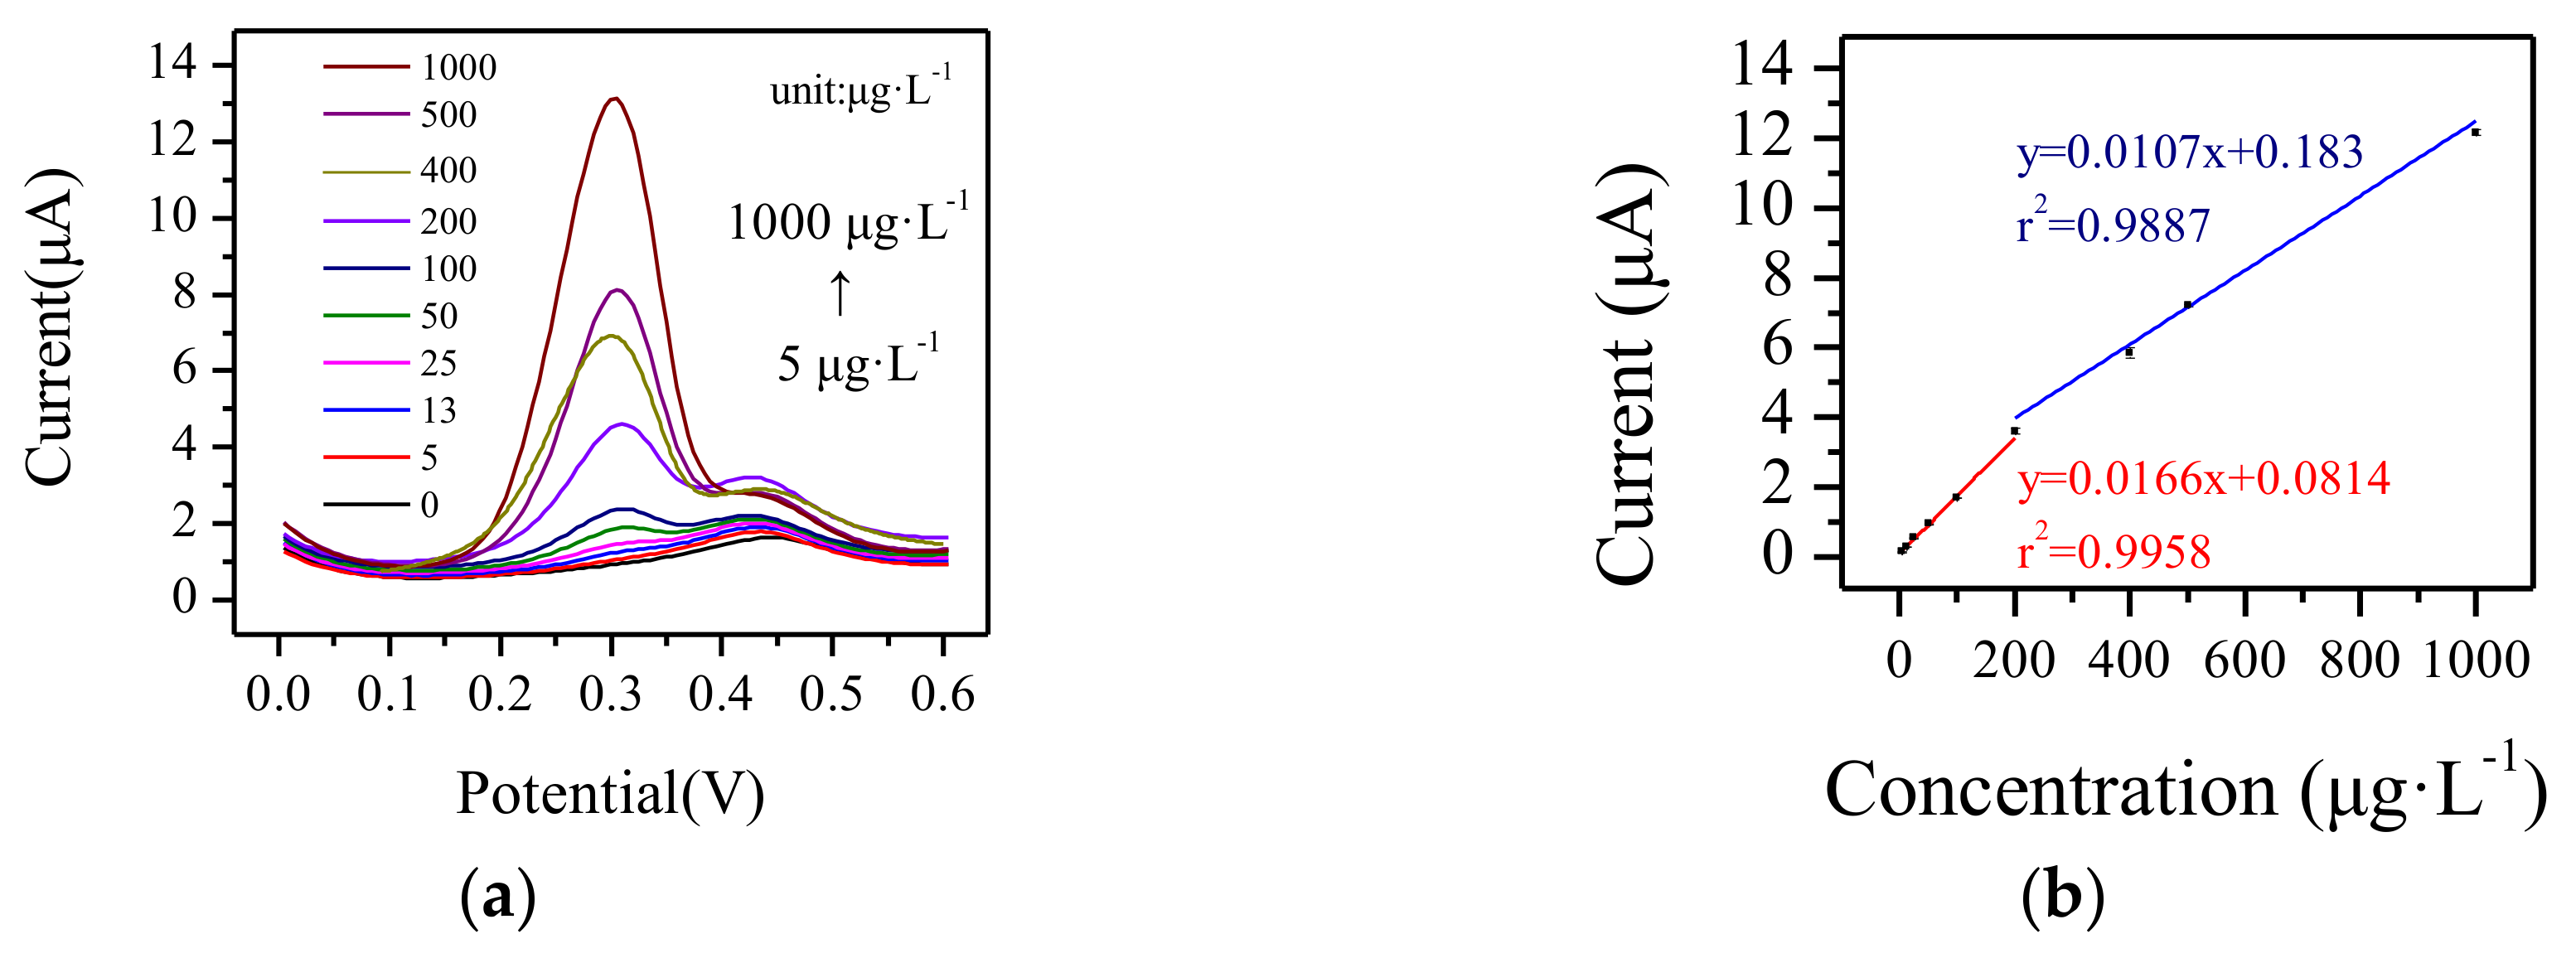
As shown in Figure 8a, with the increase of the Cu2+ concentration, the peak current at about 0.3 V increased linearly. This paper-based sensor chip displayed two linear ranges for Cu2+ determination. In the range from 5 μg·L−1 to 200 μg·L−1, the sensitivity was 0.0166 μA·μg−1·L with a linear coefficient of 99.58%. In the range of 200–1000 μg·L−1, the sensitivity was 0.0107 μA·μg−1·L and the linear coefficient was 98.87%. The detection limit was 2 μg·L−1. The detection range satisfied the environmental quality standard for surface water (GB 3838-2002) in China, for which the detection range for Cu2+ is from 10 μg·L−1 to 1000 μg·L−1.

3.4. Interference Studies

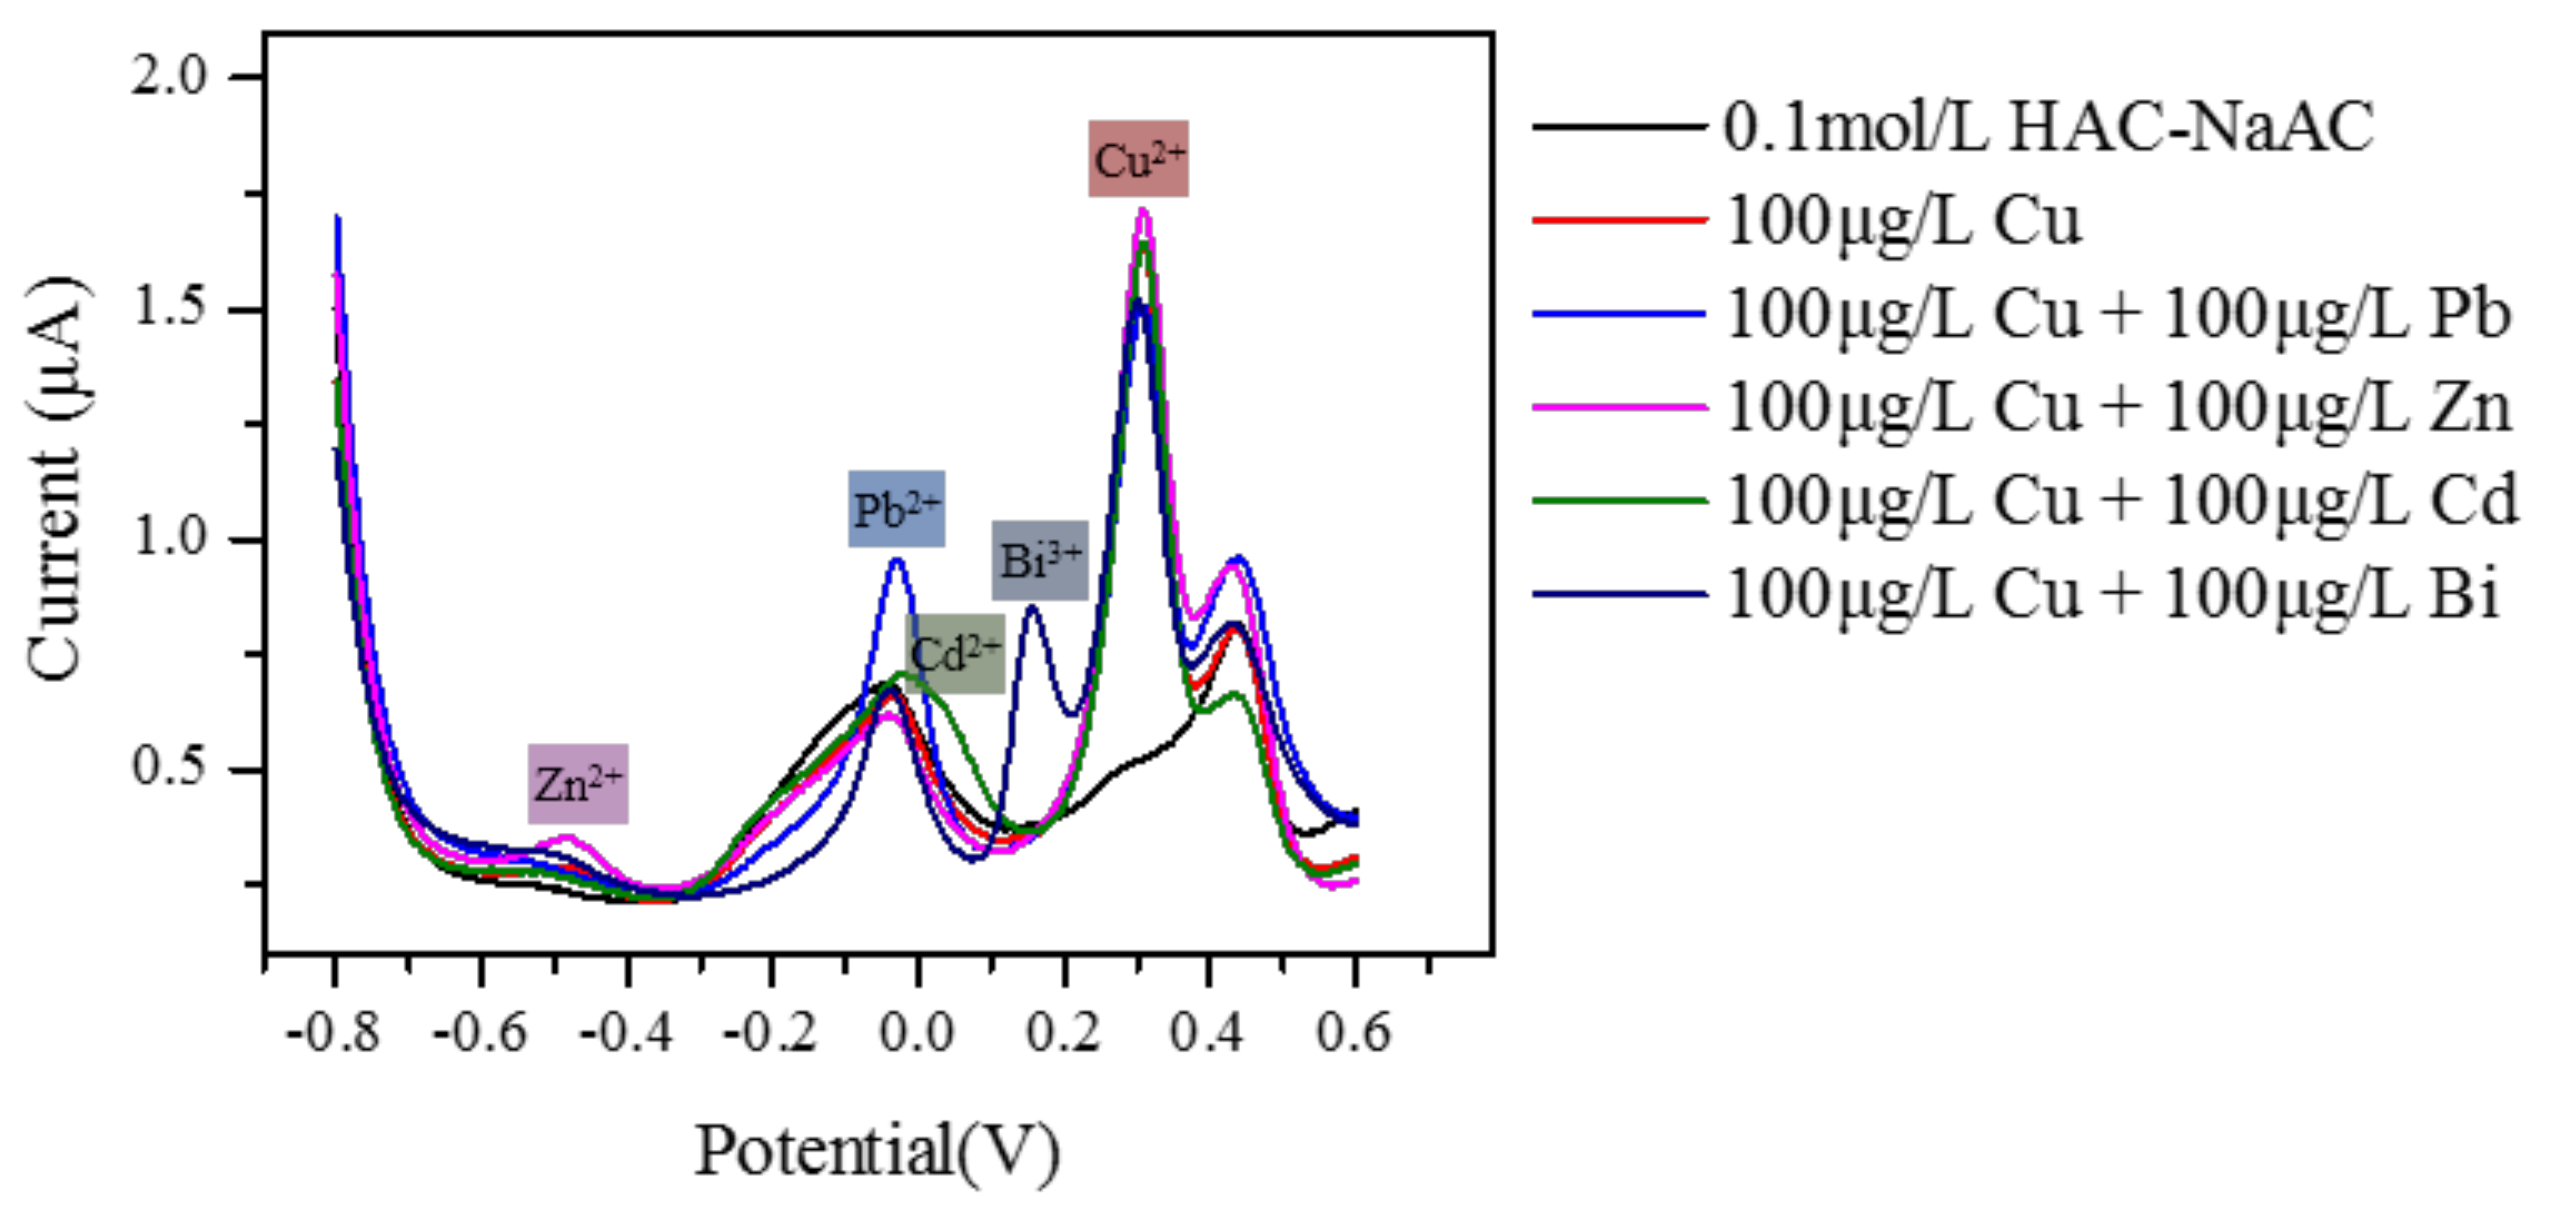
Pb2+, Cd2+, Zn2+, Bi3+, Cl, SO42−, CO32−, PO43−, Na+, and K+ were used as the interference ions. They were added to a 100 μg·L−1; Cu2+ sample solution separately. The results are shown in Figure 9 and Table 1.
It was found that different metal ions had different redox potentials and were evidently distinguished. From Table 1, when Pb2+ was added dropwise to the sample solution, the response current value was reduced by about 15%. This was possibly because of the stronger adhesion of Pb2+ to the electrode’s surface, which weakened the response of Cu2+. According to Table 1, the deviation between Cu2+ and Cd2+, Zn2+, and other common ions was less than 10%. In addition, Bi3+ can be used as a sensitive membrane to increase the current value [1]. However, the peak current was affected by concentration. Above all, it can be considered that this paper-based sensing chip showed good anti-interference properties.

3.5. Recovery Measurement in Real Samples (Cu2+)

The practical application of the paper-based sensor chip was investigated using the spike recovery method. Two water samples were taken from Lake A and Lake B in Beijing, China. Standard Cu2+ solution was added to the water samples in different concentrations. Then, the Cu2+ sample solutions were mixed with HAC–NaAC buffer solution with high concentration in a ratio of 1:30 (0.25 mL:7.5 mL) to make the pH equal to 4.4 and the final concentration of HAC–NaAC was 0.1 mol·L−1 after mixing. The concentration of each sample was measured 3 times using SWSV. The results are shown in Table 2. The recoveries for Cu2+ ranged from 96% to 109%, which indicated that the paper-based sensor chip can be used for metal ion detection in real water samples.

3.6. Reproducibility Study

In this paper, each experiment was tested three times and the reproducibility was estimated with three different paper-based sensor chips that were prepared independently using the same method. The values of relative standard deviation (RSD) were 2.14%, 1.64%, 3.16% for 100 μg·L−1, 300 μg·L−1, and 400 μg·L−1 Cu2+ and 1.42% for 3 μg·L−1 Hg2+, respectively. All the RSD were less than 5%, which verified that the reproducibility of the paper-based chip was acceptable.

3.7. Other Metal Ions Detection

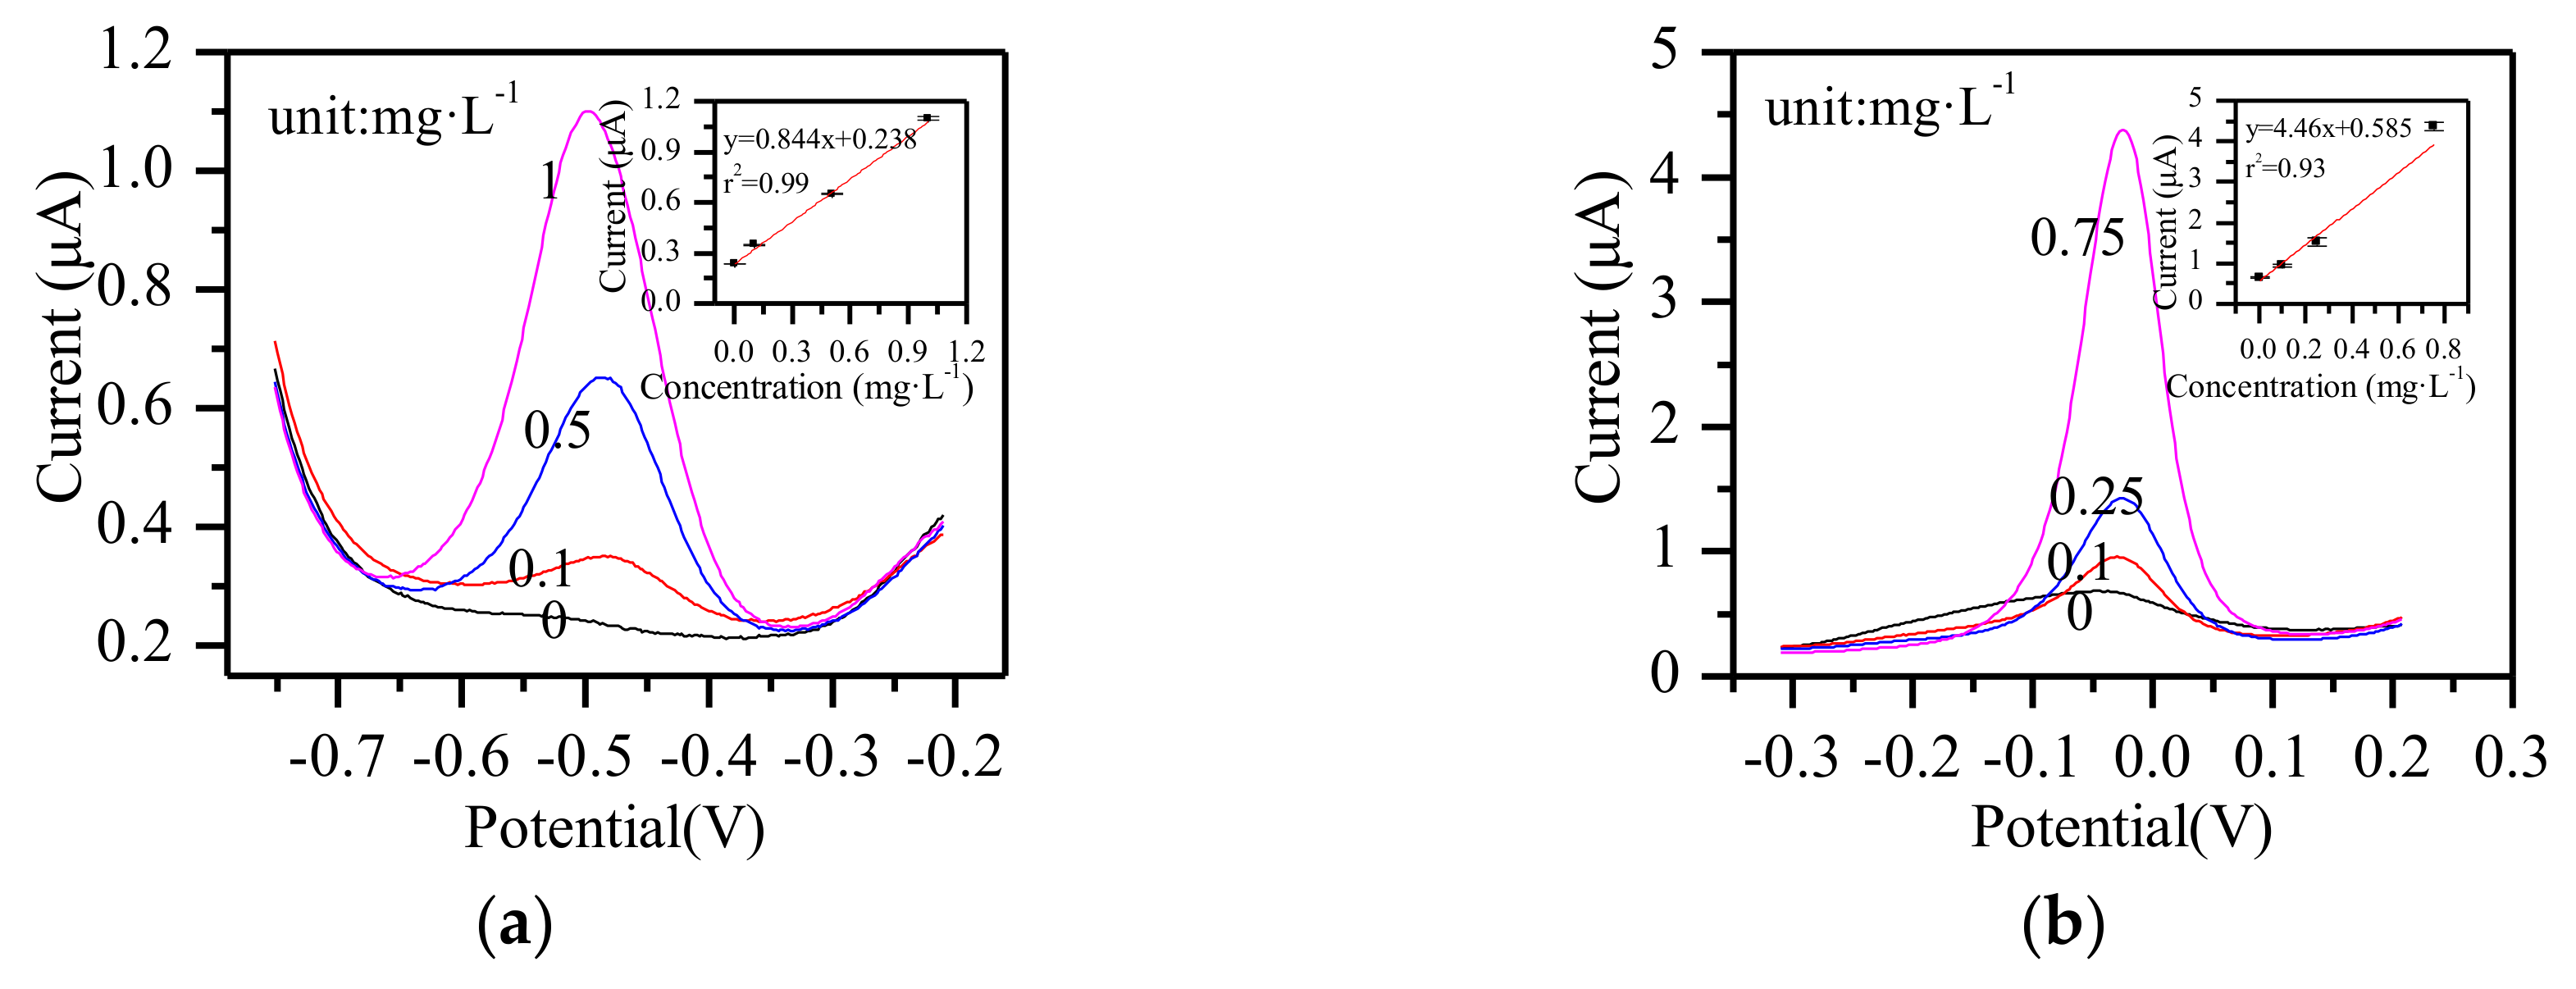
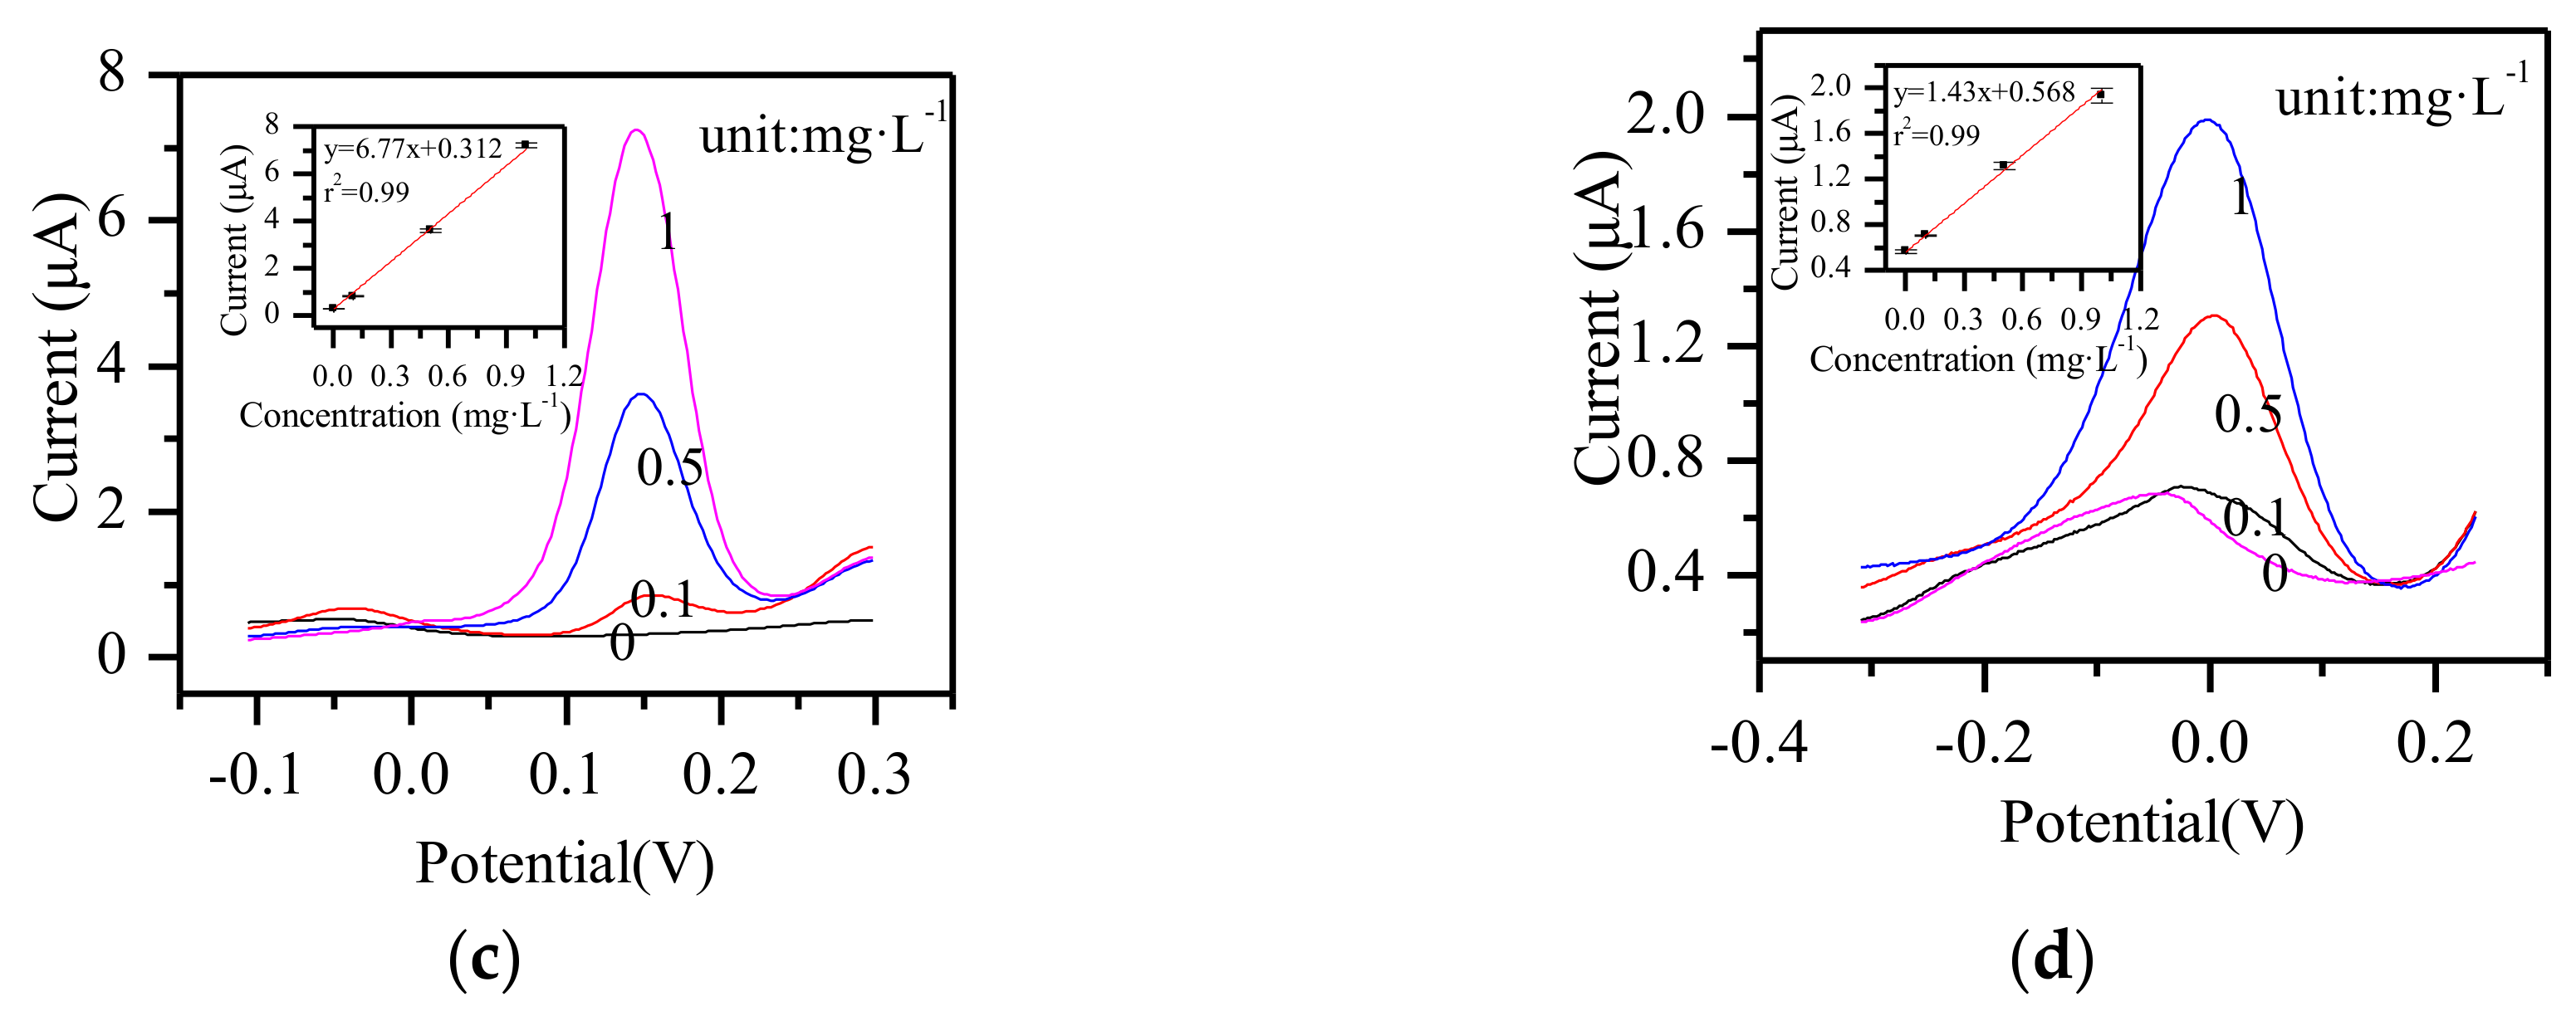
Other metal ions—Zn2+, Pb2+, Bi3+, and Cd2+—were detected by the paper-based sensor chip using SWSV, and the results are shown in Figure 10. From Figure 10a, with the increase of Zn2+ concentration in the range 0–1 mg·L−1, the peak current at about −0.5 V increased linearly. The sensitivity was 0.844 μA·mg−1·L with a linear coefficient of 99%. As shown in Figure 10b, in the range of 0–0.75 mg·L−1, the peak current of Pb2+ at about −0.12 V increased linearly. The sensitivity was 4.46 μA·mg−1·L and the linear coefficient was 93%. Figure 10c showed that the peak current of Bi3+ grew linearly from 0 mg·L−1 to 1 mg·L−1, and the sensitivity and linear coefficient were 6.77 μA·mg−1·L and 99%. Figure 10d showed that the peak current of Cd2+ grew linearly from 0 mg·L−1 to 1 mg·L−1, and the sensitivity and linear coefficient were 1.43 μA·mg−1·L and 99%. In this paper, there were only four data points listed for each ion, since it was a preliminary test. In order to obtain more accurate results, more experiments should be prepared. The experimental conditions also need to be optimized separately for each different heavy metal ion. The limit of detection of each metal ion can be obtained after precise detection by the paper-based sensor chip.

4. Conclusions

In summary, compared with a solid electrode, this paper-based sensor chip fabricated using magnetron sputtering technology effectively took advantage of the three-dimensional porous structure of the paper, which increased the effective working area of the electrode. The experimental results indicated that the chip had high sensitivity and a wide measurement range. The detection range met the requirements of the environmental quality standard for surface water in China, for which the range for Cu2+ is from 10 μg·L−1 to 1000 μg·L−1. This study promotes the development of on-site rapid detection technology for heavy metal ions.

Acknowledgments

We are sincerely grateful to the National Natural Science Foundation of China (61401433), National Basic Research Program of China (2015CB352100), and National Natural Science Foundation of China (61671433) for their support of this work.

Author Contributions

Xiaoqing Wang, Jizhou Sun and Chao Bian conceived and designed the experiments; Xiaoqing Wang performed the experiments and analyzed the data; Xin Guan contributed reagents and materials. Research discussions were executed by all authors.

Conflicts of Interest

The authors declare no conflict of interest.

References

  1. Zhao, G.; Wang, H.; Liu, G. Electrochemical determination of trace cadmium in soil by a bismuth film/graphene-beta-cyclodextrin-nafion composite modified electrode. Int. J. Electrochem. Sci. 2016, 11, 1840–1851. [Google Scholar]
  2. Zhan, S.S.; Wu, Y.G.; Wang, L.M.; Zhan, X.J.; Zhou, P. A mini-review on functional nucleic acids-based heavy metal ion detection. Biosens. Bioelectron. 2016, 86, 353–368. [Google Scholar] [CrossRef] [PubMed]
  3. Chen, X.; Ma, H. A selective fluorescence-on reaction of spiro form fluorescein hydrazide with Cu(II). Anal. Chim. Acta 2006, 575, 217–222. [Google Scholar] [CrossRef] [PubMed]
  4. Yang, X.J. Determination of heavy metal ions in waste water by the plame atomic absorption spectrometry. Chin. J. Spectrosc. Lab. 2010, 27, 247–249. [Google Scholar]
  5. Mende, M.; Schwarz, D.; Steinbach, C.; Boldt, R.; Schwarz, S. Simultaneous adsorption of heavy metal ions and anions from aqueous solutions on chitosan-Investigated by spectrophotometry and SEM-EDX analysis. Colloids Surf. A Physicochem. Eng. Asp. 2016, 510, 275–282. [Google Scholar] [CrossRef]
  6. Jian-Ying, Q.I.; Xiang-Ping, L.I.; Chen, Y.H.; Liu, J.; Wang, C.L.; Chang, X.Y. Determination of heavy metals in soil by dynamic reaction cell-inductively coupled plasma mass spectrum. Chin. J. Anal. Lab. 2008, 27, 30–33. [Google Scholar]
  7. Ensafi, A.A.; Khayamian, T.; Benvidi, A.; Mirmomtaz, E. Simultaneous determination of copper, lead and cadmium by cathodic adsorptive stripping voltammetry using artificial neural network. Anal. Chim. Acta 2006, 561, 225–232. [Google Scholar] [CrossRef]
  8. Lopez-Marzo, A.M.; Pons, J.; Blake, D.A.; Merkoci, A. High sensitive gold-nanoparticle based lateral flow Immunodevice for Cd2+ detection in drinking waters. Biosens. Bioelectron. 2013, 47, 190–198. [Google Scholar] [CrossRef] [PubMed]
  9. Shu, H.; Chang, G.; Su, J.; Cao, L.; Huang, Q.; Zhang, Y.; Xia, T.; He, Y. Single-step electrochemical deposition of high performance Au-graphene nanocomposites for nonenzymatic glucose sensing. Sens. Actuator B Chem. 2015, 220, 331–339. [Google Scholar] [CrossRef]
  10. Chen, X.; Liu, W.; Tang, L.; Wang, J.; Pan, H.; Du, M. Electrochemical sensor for detection of hydrazine based on Au@Pd core-shell nanoparticles supported on amino-functionalized TiO2 nanotubes. Mater. Sci. Eng. C Mater. Biol. Appl. 2014, 34, 304–310. [Google Scholar] [CrossRef] [PubMed]
  11. Wu, S.; Li, D.; Wang, J.; Zhao, Y.; Dong, S.; Wang, X. Gold nanoparticles dissolution based colorimetric method for highly sensitive detection of organophosphate pesticides. Sens. Actuator B Chem. 2017, 238, 427–433. [Google Scholar] [CrossRef]
  12. Xing, H.; Xu, J.; Zhu, X.; Duan, X.; Lu, L.; Wang, W.; Zhang, Y.; Yang, T. Highly sensitive simultaneous determination of cadmium (II), lead (II), copper (II), and mercury (II) ions on N-doped graphene modified electrode. J. Electroanal. Chem. 2016, 760, 52–58. [Google Scholar] [CrossRef]
  13. Wang, J.F.; Chao, B.; Tong, J.H.; Sun, J.Z.; Xia, S.H. Comparison of mercury-free microsensors based on gold nanoparticles for heavy metals detection. Chin. J. Anal. Chem. 2012, 40, 1791–1796. [Google Scholar] [CrossRef]
  14. Glavan, A.C.; Niu, J.; Chen, Z.; Güder, F.; Cheng, C.M.; Liu, D.R.; Whitesides, G.M. Analytical devices based on direct synthesis of DNA on paper. Anal. Chem. 2016, 88, 725–731. [Google Scholar] [CrossRef] [PubMed]
  15. Hamedi, M.M.; Ainla, A.; Güder, F.; Christodouleas, D.C.; Fernández-Abedul, M.T.; Whitesides, G.M. Integrating electronics and microfluidics on paper. Adv. Mater. 2016, 28, 5054–5063. [Google Scholar] [CrossRef] [PubMed]
  16. Ainla, A.; Hamedi, M.M.; Güder, F.; Whitesides, G.M. Electrical textile valves for paper microfluidics. Adv. Mater. 2017, 29, 1702894. [Google Scholar] [CrossRef] [PubMed]
  17. Marzo, A.M.L.; Pons, J.; Blake, D.A.; Merkoci, A. All-Integrated and highly sensitive paper based device with sample treatment platform for Cd2+ immunodetection in drinking/tap waters. Anal. Chem. 2013, 85, 3532–3538. [Google Scholar] [CrossRef] [PubMed]
  18. Liu, H.; Xiang, Y.; Lu, Y.; Crooks, R.M. Aptamer-based origami paper analytical device for electrochemical detection of adenosine. Angew. Chem. 2012, 51, 6925–6928. [Google Scholar] [CrossRef] [PubMed]
  19. Wang, X.; Yang, C.; Zhu, S.; Yan, M.; Ge, S.; Yu, J. 3D origami electrochemical device for sensitive Pb2þ testing based on DNA functionalized iron-porphyrinic metal-organic framework. Biosens. Bioelectron. 2017, 87, 108–115. [Google Scholar] [CrossRef] [PubMed]
  20. Ensafi, A.A.; Khayamian, T.; Benvidi, A.; Mirmomtaz, E. Electrogeneration of gold nanoparticles on porous-carbon paper-based electrodes and application to inorganic arsenic analysis in white wines by chronoamperometric stripping. Anal. Chim. Acta 2006, 561, 225–232. [Google Scholar] [CrossRef]
  21. Feng, L.; Li, H.; Niu, L.Y.; Guan, Y.S.; Duan, C.F.; Guan, Y.F.; Tung, C.H.; Yang, Q.Z. A fluorometric paper-based sensor array for the discrimination of heavy-metal ions. Talanta 2013, 108, 103–108. [Google Scholar] [CrossRef] [PubMed]
  22. Dungchai, W.; Chailapakul, O.; Henry, C.S. A low-cost, simple, and rapid fabrication method for paper-based microfluidics using wax screen-printing. Analyst 2011, 136, 77–82. [Google Scholar] [CrossRef] [PubMed]
  23. Sjoberg, P.; Maattanen, A.; Vanamo, U.; Novell, M.; Ihalainen, P.; Andrade, F.J.; Bobacka, J.; Peltonen, J. Paper-based potentiometric ion sensors constructed on ink-jet printed gold electrodes. Sens. Actuator B Chem. 2016, 224, 325–332. [Google Scholar] [CrossRef]
  24. Xu, Y.H.; Lou, B.H.; Lv, Z.Z.; Zhou, Z.X.; Zhang, L.B.; Wang, E.K. Paper-based solid-state electrochemiluminescence sensor using poly(sodium 4-styrenesulfonate) functionalized graphene/nafion composite film. Anal. Chim. Acta 2013, 763, 20–27. [Google Scholar] [CrossRef] [PubMed]
Figure 1. (a) Image of paper-based electrode chip and (b) SEM image of the electrode top surface of the junction of the hydrophilic/hydrophobic areas after hydrophobic treatment.
Micromachines 09 00150 g001
Figure 2. Images of paper-based sensor chip and the portable detection device.
Micromachines 09 00150 g002
Figure 3. SEM and EDS images of (a,b) nitrocellulose membrane (NC) paper, (c,d) inkjet-printed silver electrode, and (e,f) magnetron-sputtered Au electrode.
Micromachines 09 00150 g003
Figure 4. CV curves of (a) WE, (b) CE, and (c) RE using commercial electrodes (black curves) and paper-based electrodes (red curves) in 2.5 mM Fe(CN)63−/4− solution at 50 mV·s−1 rate and (d) the Nernst Response Diagram of the paper-based RE in different concentrations of Cl.
Micromachines 09 00150 g004
Figure 5. (a) SEM and (b) EDS of the paper-based RE.
Micromachines 09 00150 g005
Figure 6. Stability of the paper-based RE in 0.1 M KCl solution over 12 h.
Micromachines 09 00150 g006
Figure 7. The effects of (a) accumulation potential, (b) accumulation time, and (c) pH value on the peak current by square-wave stripping voltammetry (SWSV) at 100 μg·L−1 Cu2+, using the paper-based sensor chip.
Micromachines 09 00150 g007
Figure 8. (a) Current response of the paper-based sensor chip in different concentrations of Cu2+ by SWSV, and (b) corresponding linear calibration plots of the stripping peak current for Cu2+.
Micromachines 09 00150 g008
Figure 9. The effects of different interference ions on the response current of Cu2+. (In this figure, Cu means Cu2+, Pb means Pb2+, Zn means Zn2+, Cd means Cd2+, and Bi means Bi3+).
Micromachines 09 00150 g009
Figure 10. SWSV response of the paper-based sensor chip for (a) Zn2+, (b) Pb2+, (c) Bi3+, and (d) Cd2+.
Micromachines 09 00150 g010aMicromachines 09 00150 g010b
Table 1. Effect of interference ions on the peak current of Cu2+ (100 μg·L−1).
Interference IonsConcentration of Interference Ions (μg·L−1)Percentage of Peak Current Compared with 100 μg·L−1 Cu2+ (%)
Pb2+10086.17 ± 6.15
25084.23 ± 7.44
Cd2+100103.46 ± 9.97
50099.59 ± 7.38
Zn2+100107.62 ± 5.11
500104.16 ± 6.65
Bi3+100142.95 ± 5.23
500102.44 ± 6.02
Cl, SO42−, CO32−, PO43−, Na+, K+105, 105, 5 × 10⁴, 5 × 10⁴, 105, 1.1 × 10592.42 ± 4.19
Table 2. Recovery measurement of Cu2+ in real samples using the paper-based sensing chip (n = 3).
SamplesConcentration of Added Cu2+ (μg·L−1)Concentration Found (μg·L−1)Recovery (%)
10N-
2021.52 ± 0.60107.59 ± 2.99
100108.96 ± 1.16108.96 ± 1.16
20N-
4043.42 ± 0.30108.56% ± 0.74
7572.11 ± 1.1396.14% ± 1.50
(N: not found).