
Wide Field-of-View Fluorescence Imaging with Optical-Quality Curved Microfluidic Chamber for Absolute Cell Counting


Abstract
:
1. Introduction
2. Materials and Methods
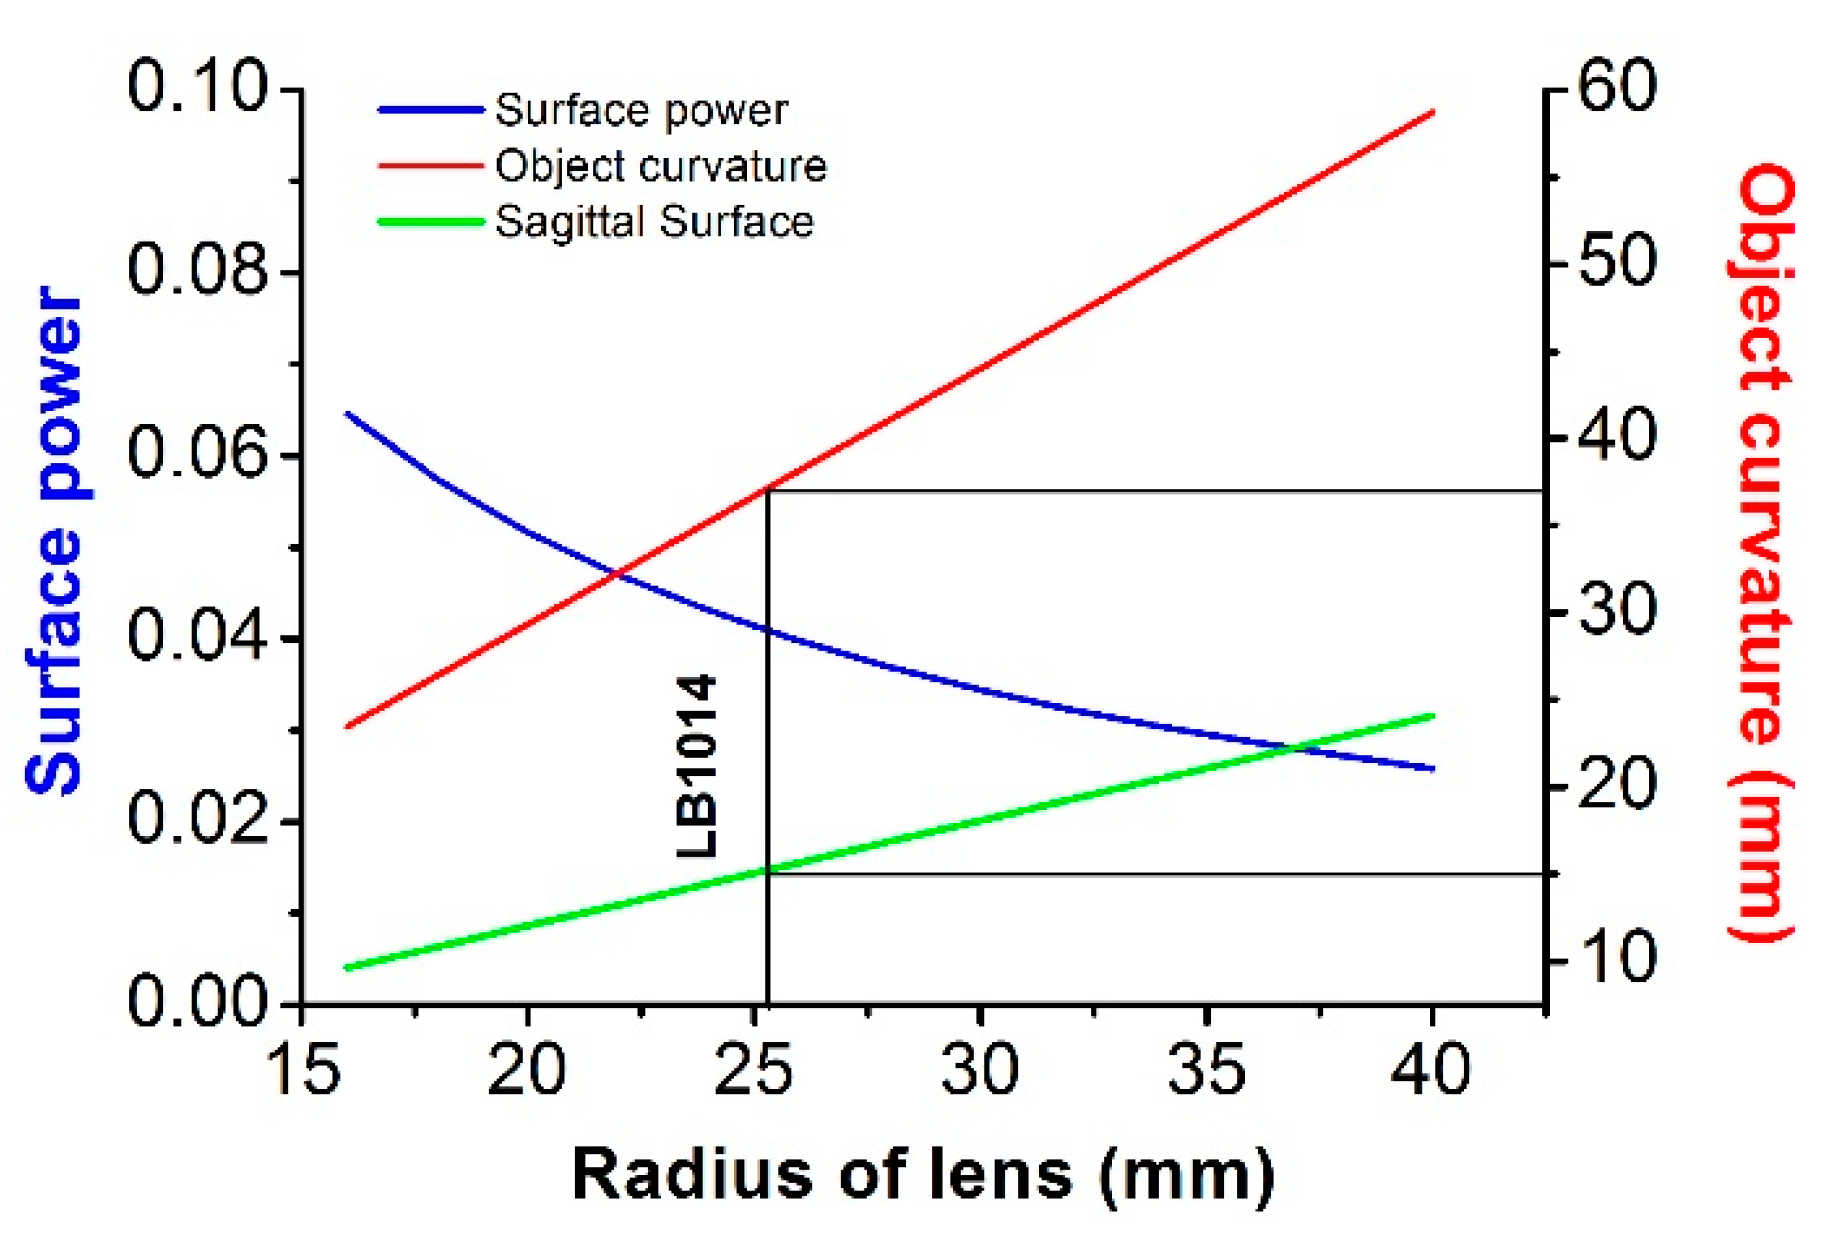
2.1. Theory
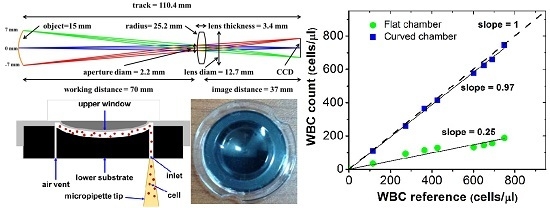
2.2. Imaging Setup
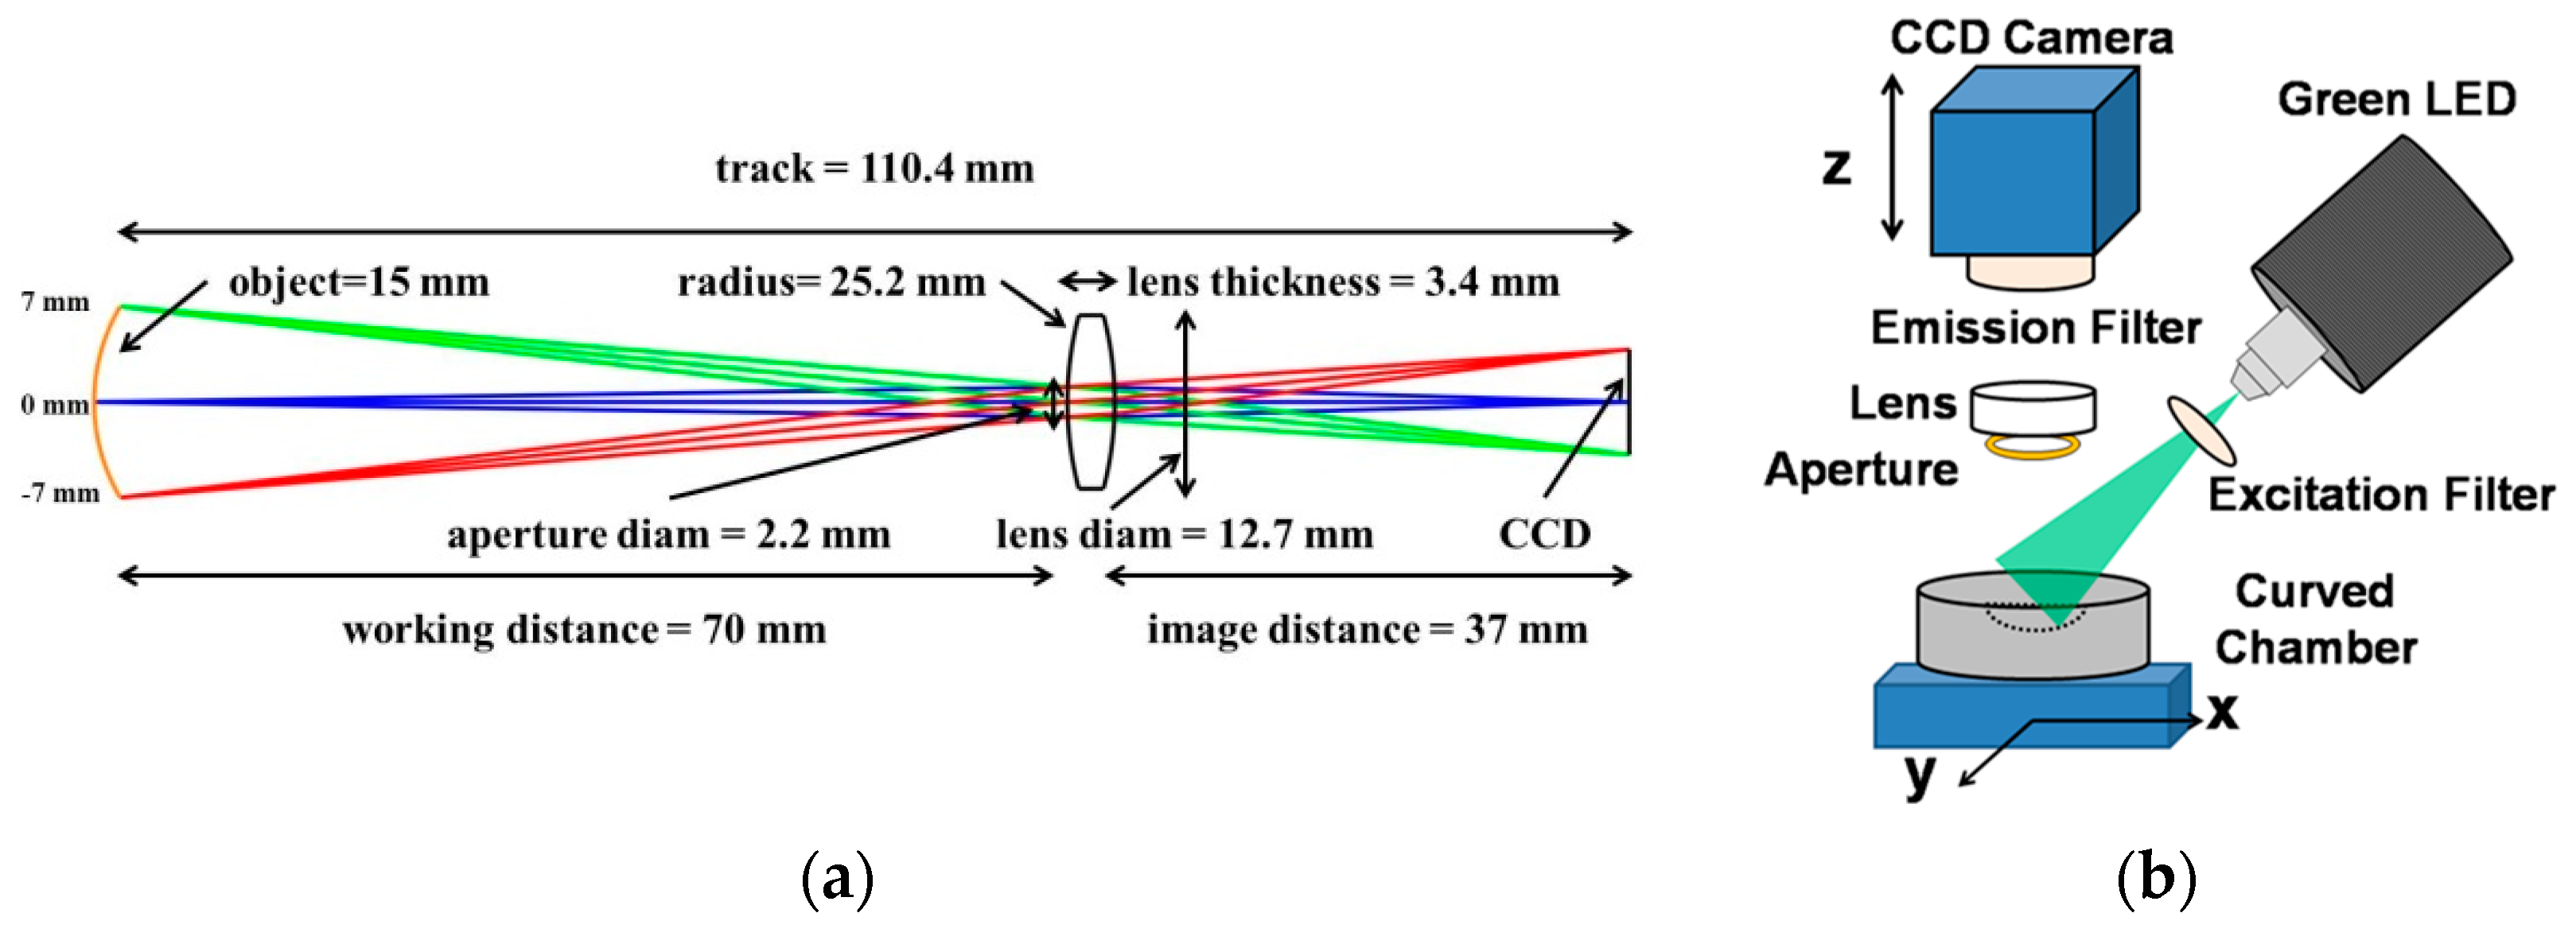
2.3. Fabrication of Curved Sample Chamber
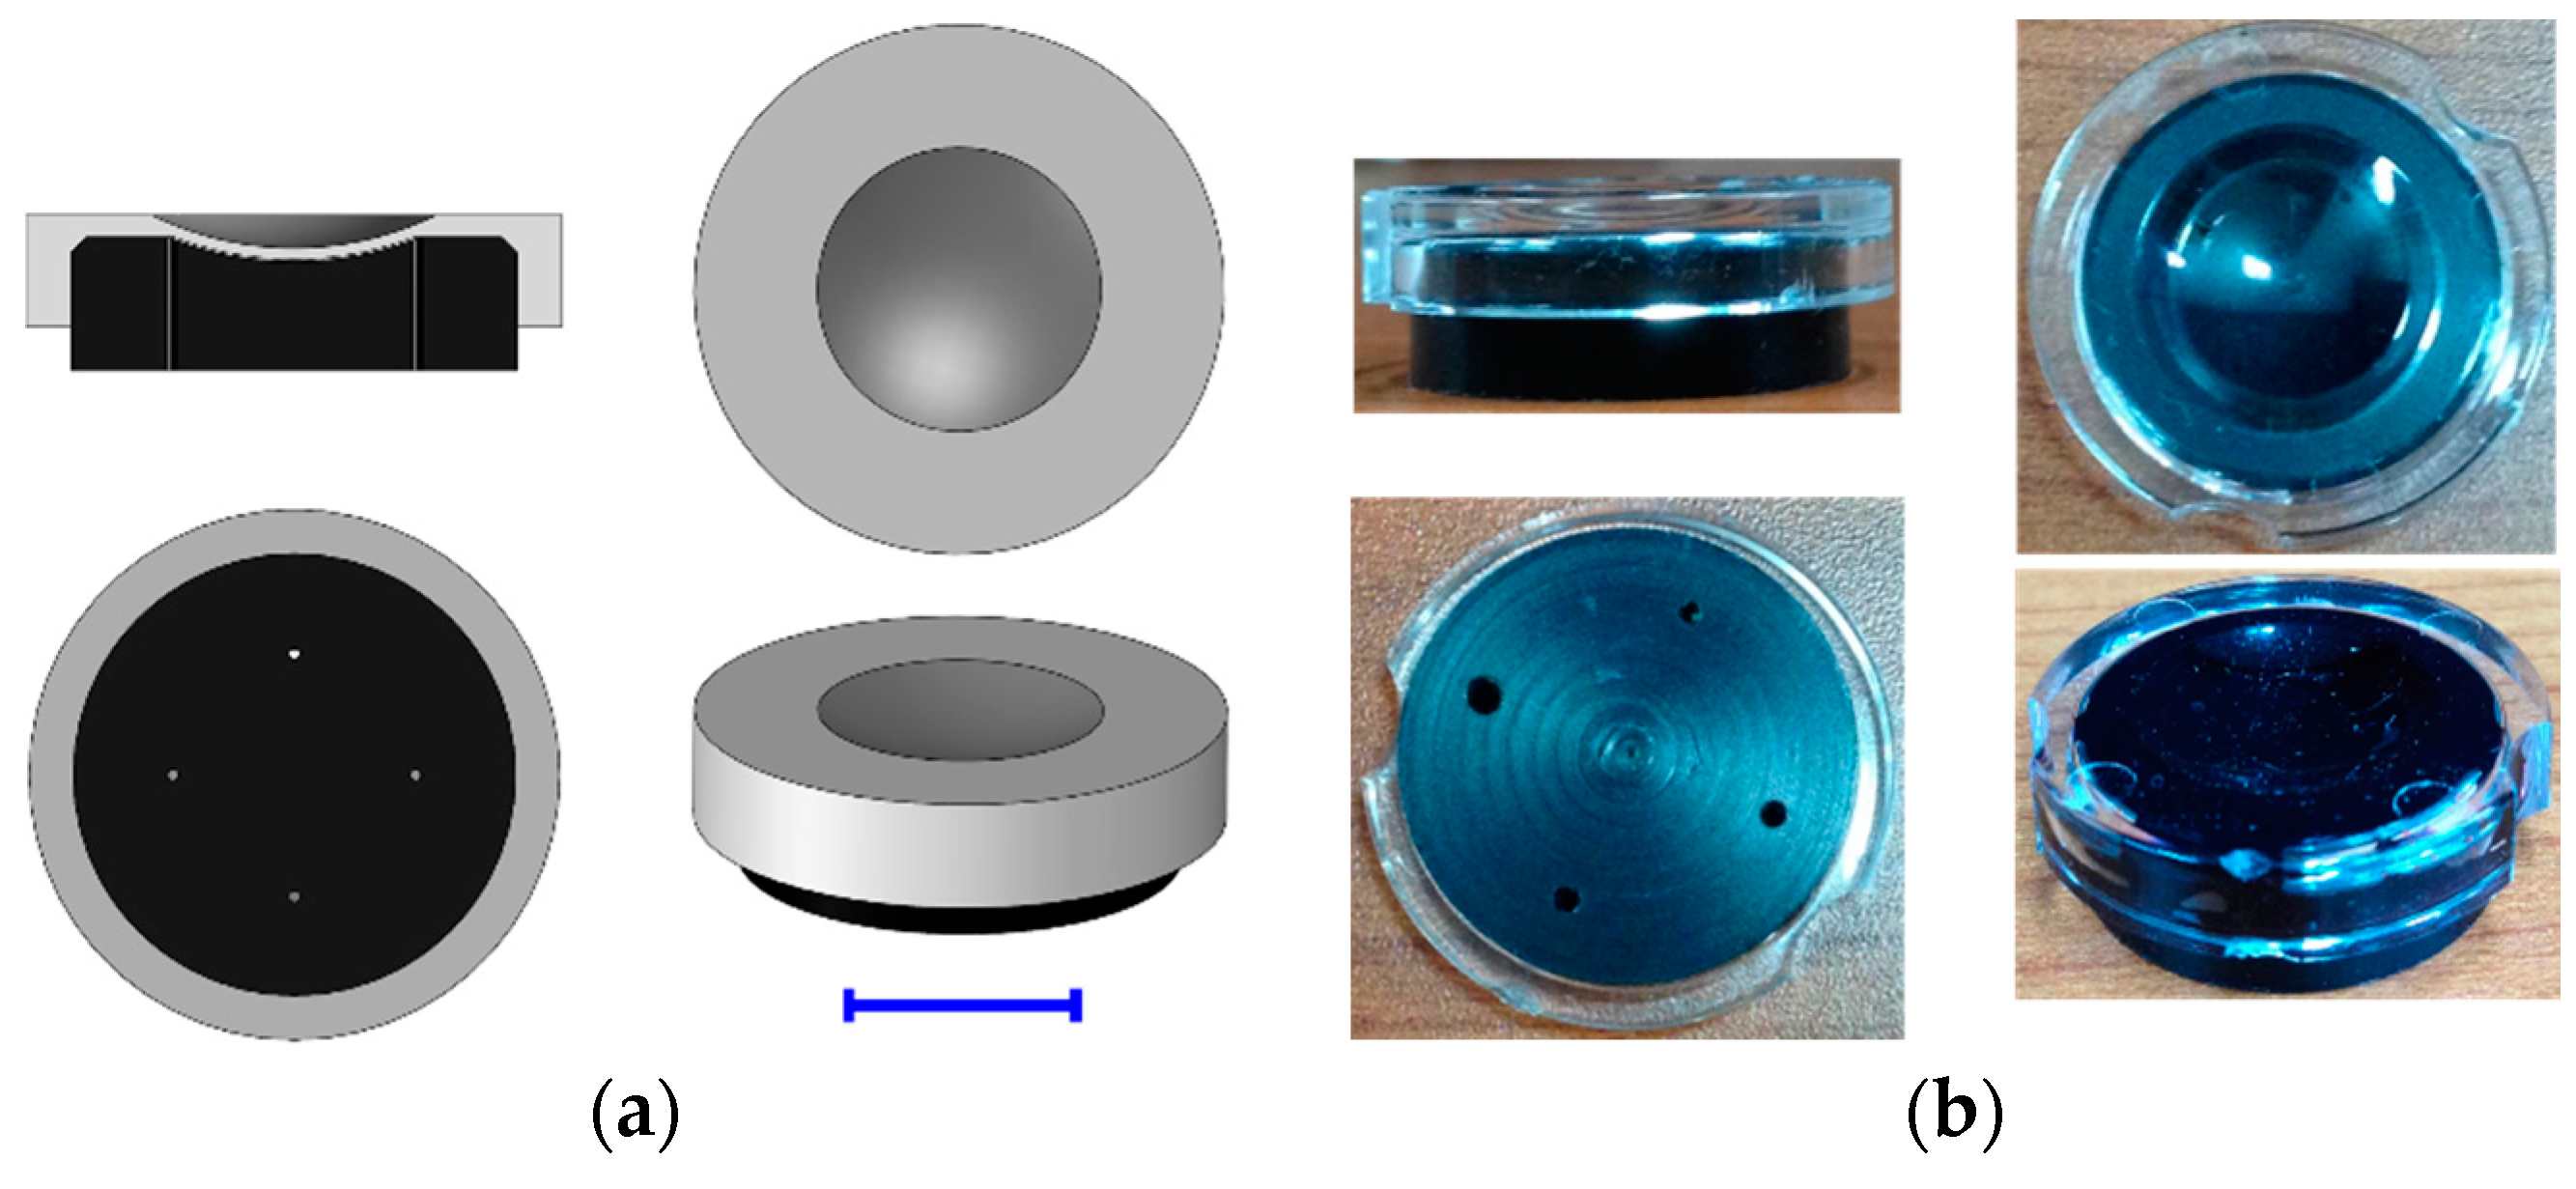
2.4. Sample Preparation
2.5. Image Acquisition and Cell Counting
3. Results and Discussion
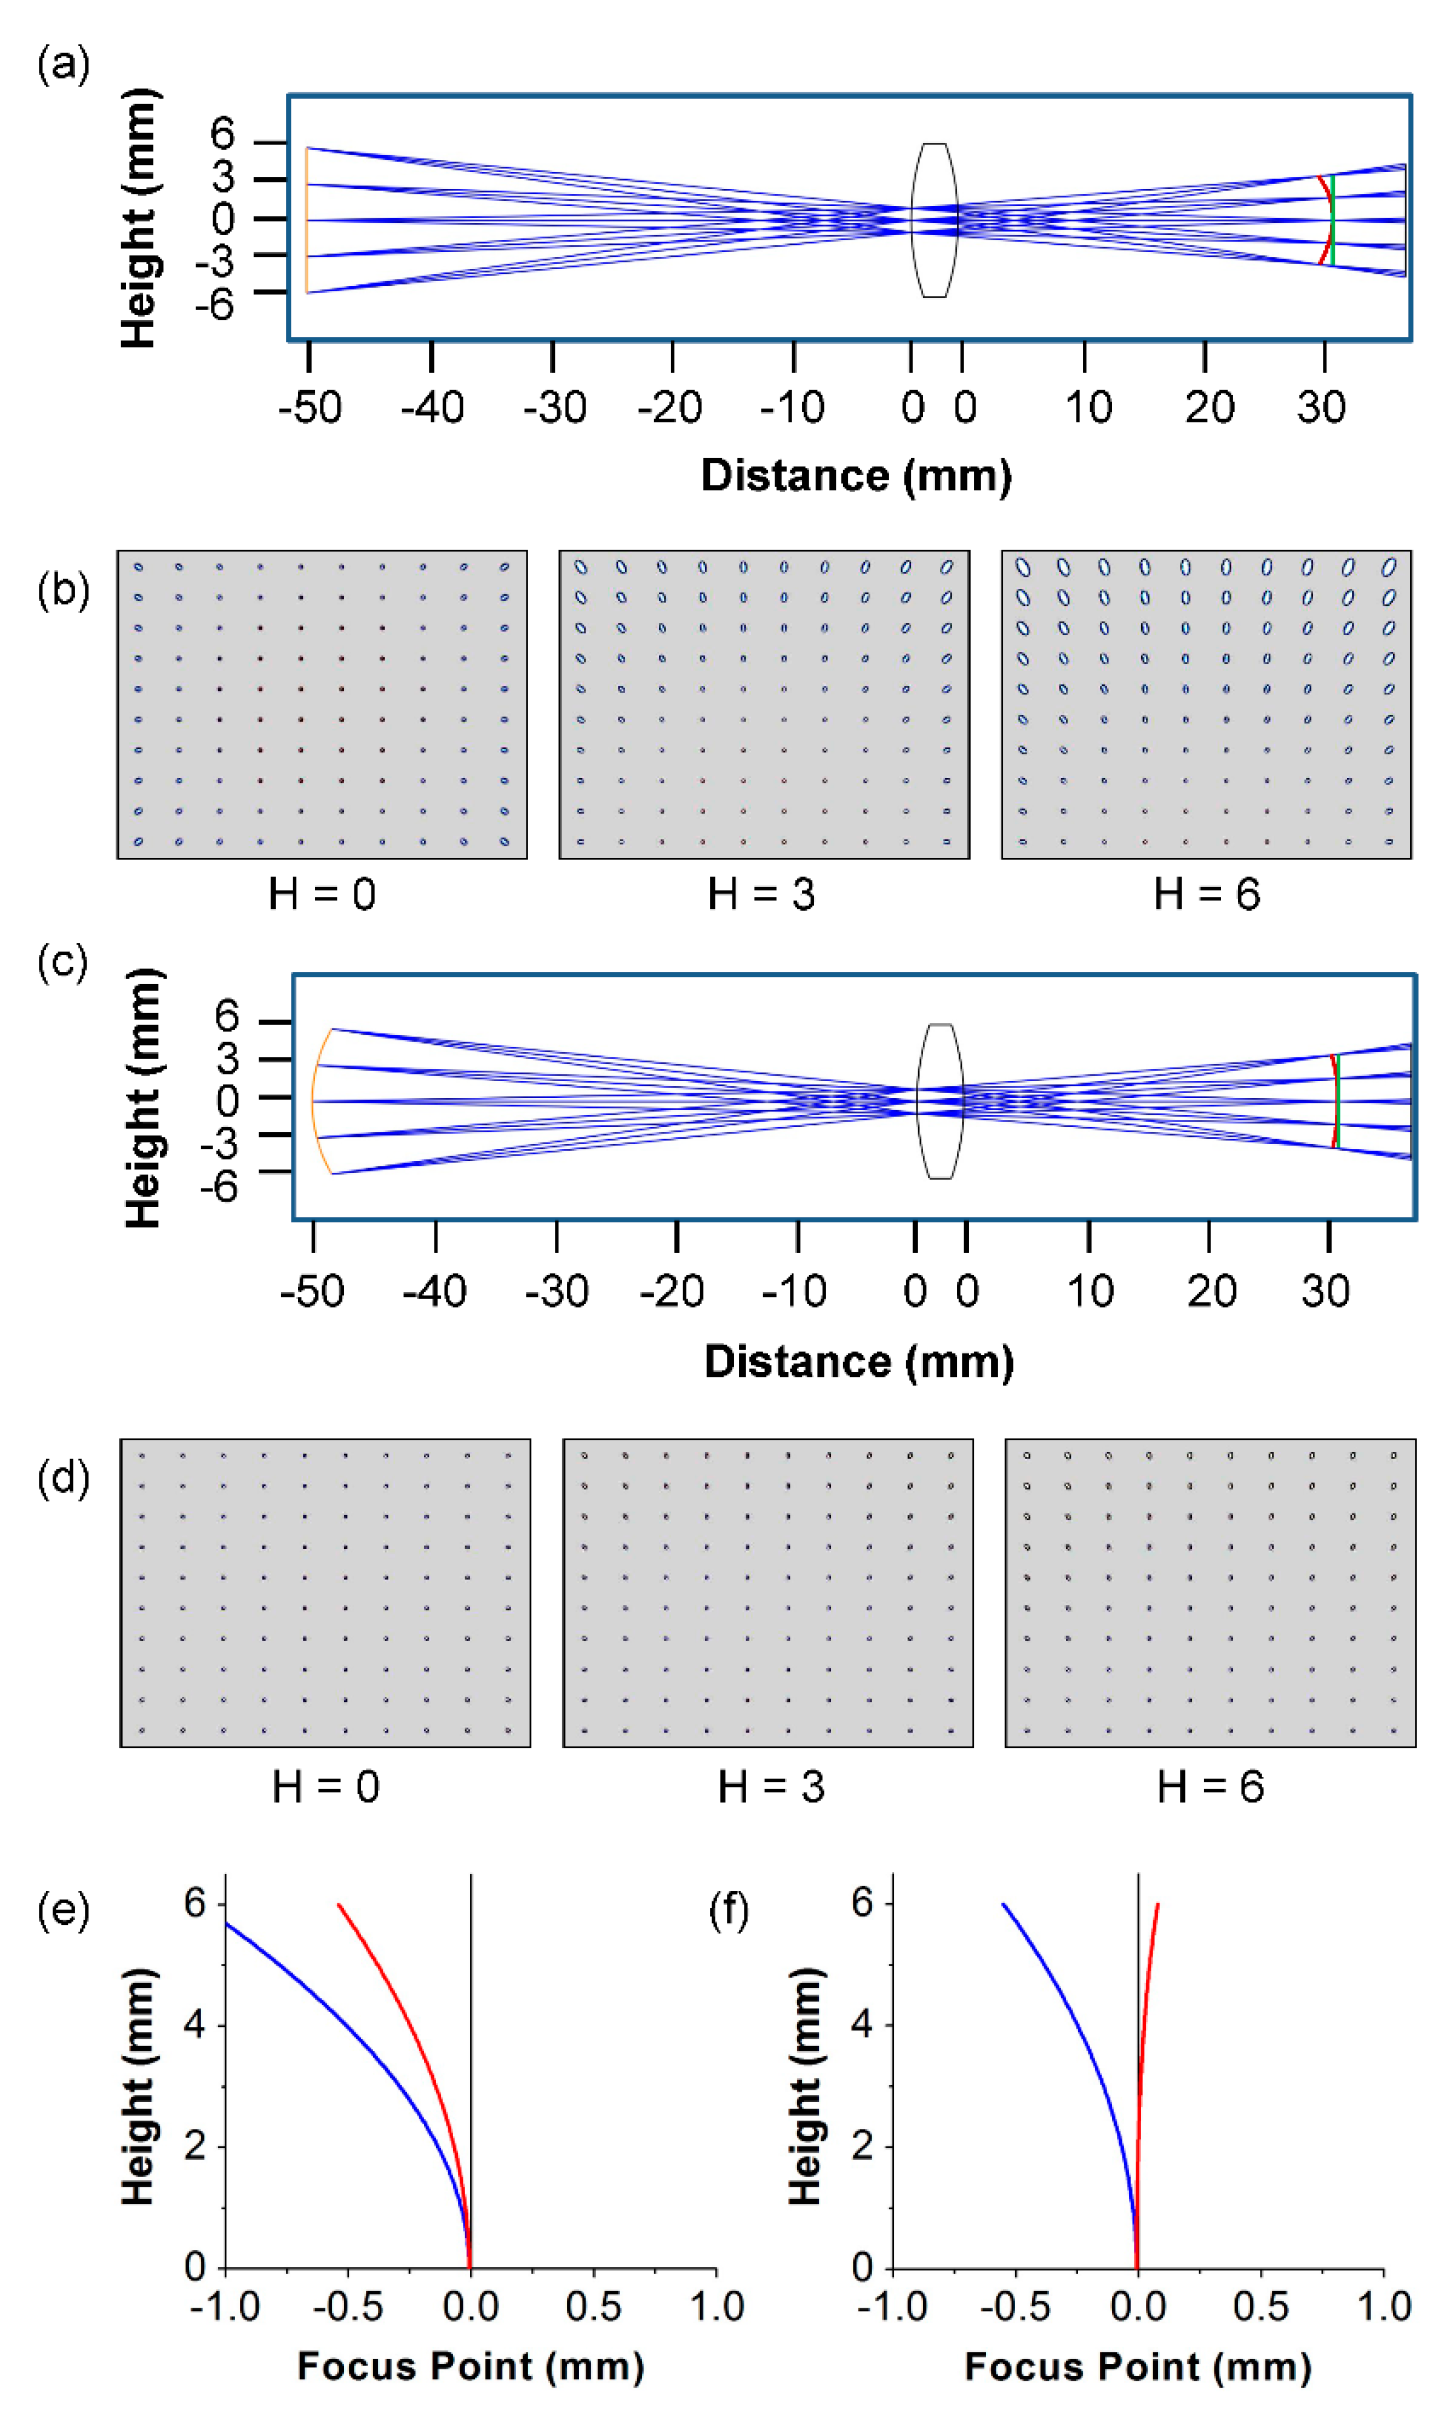
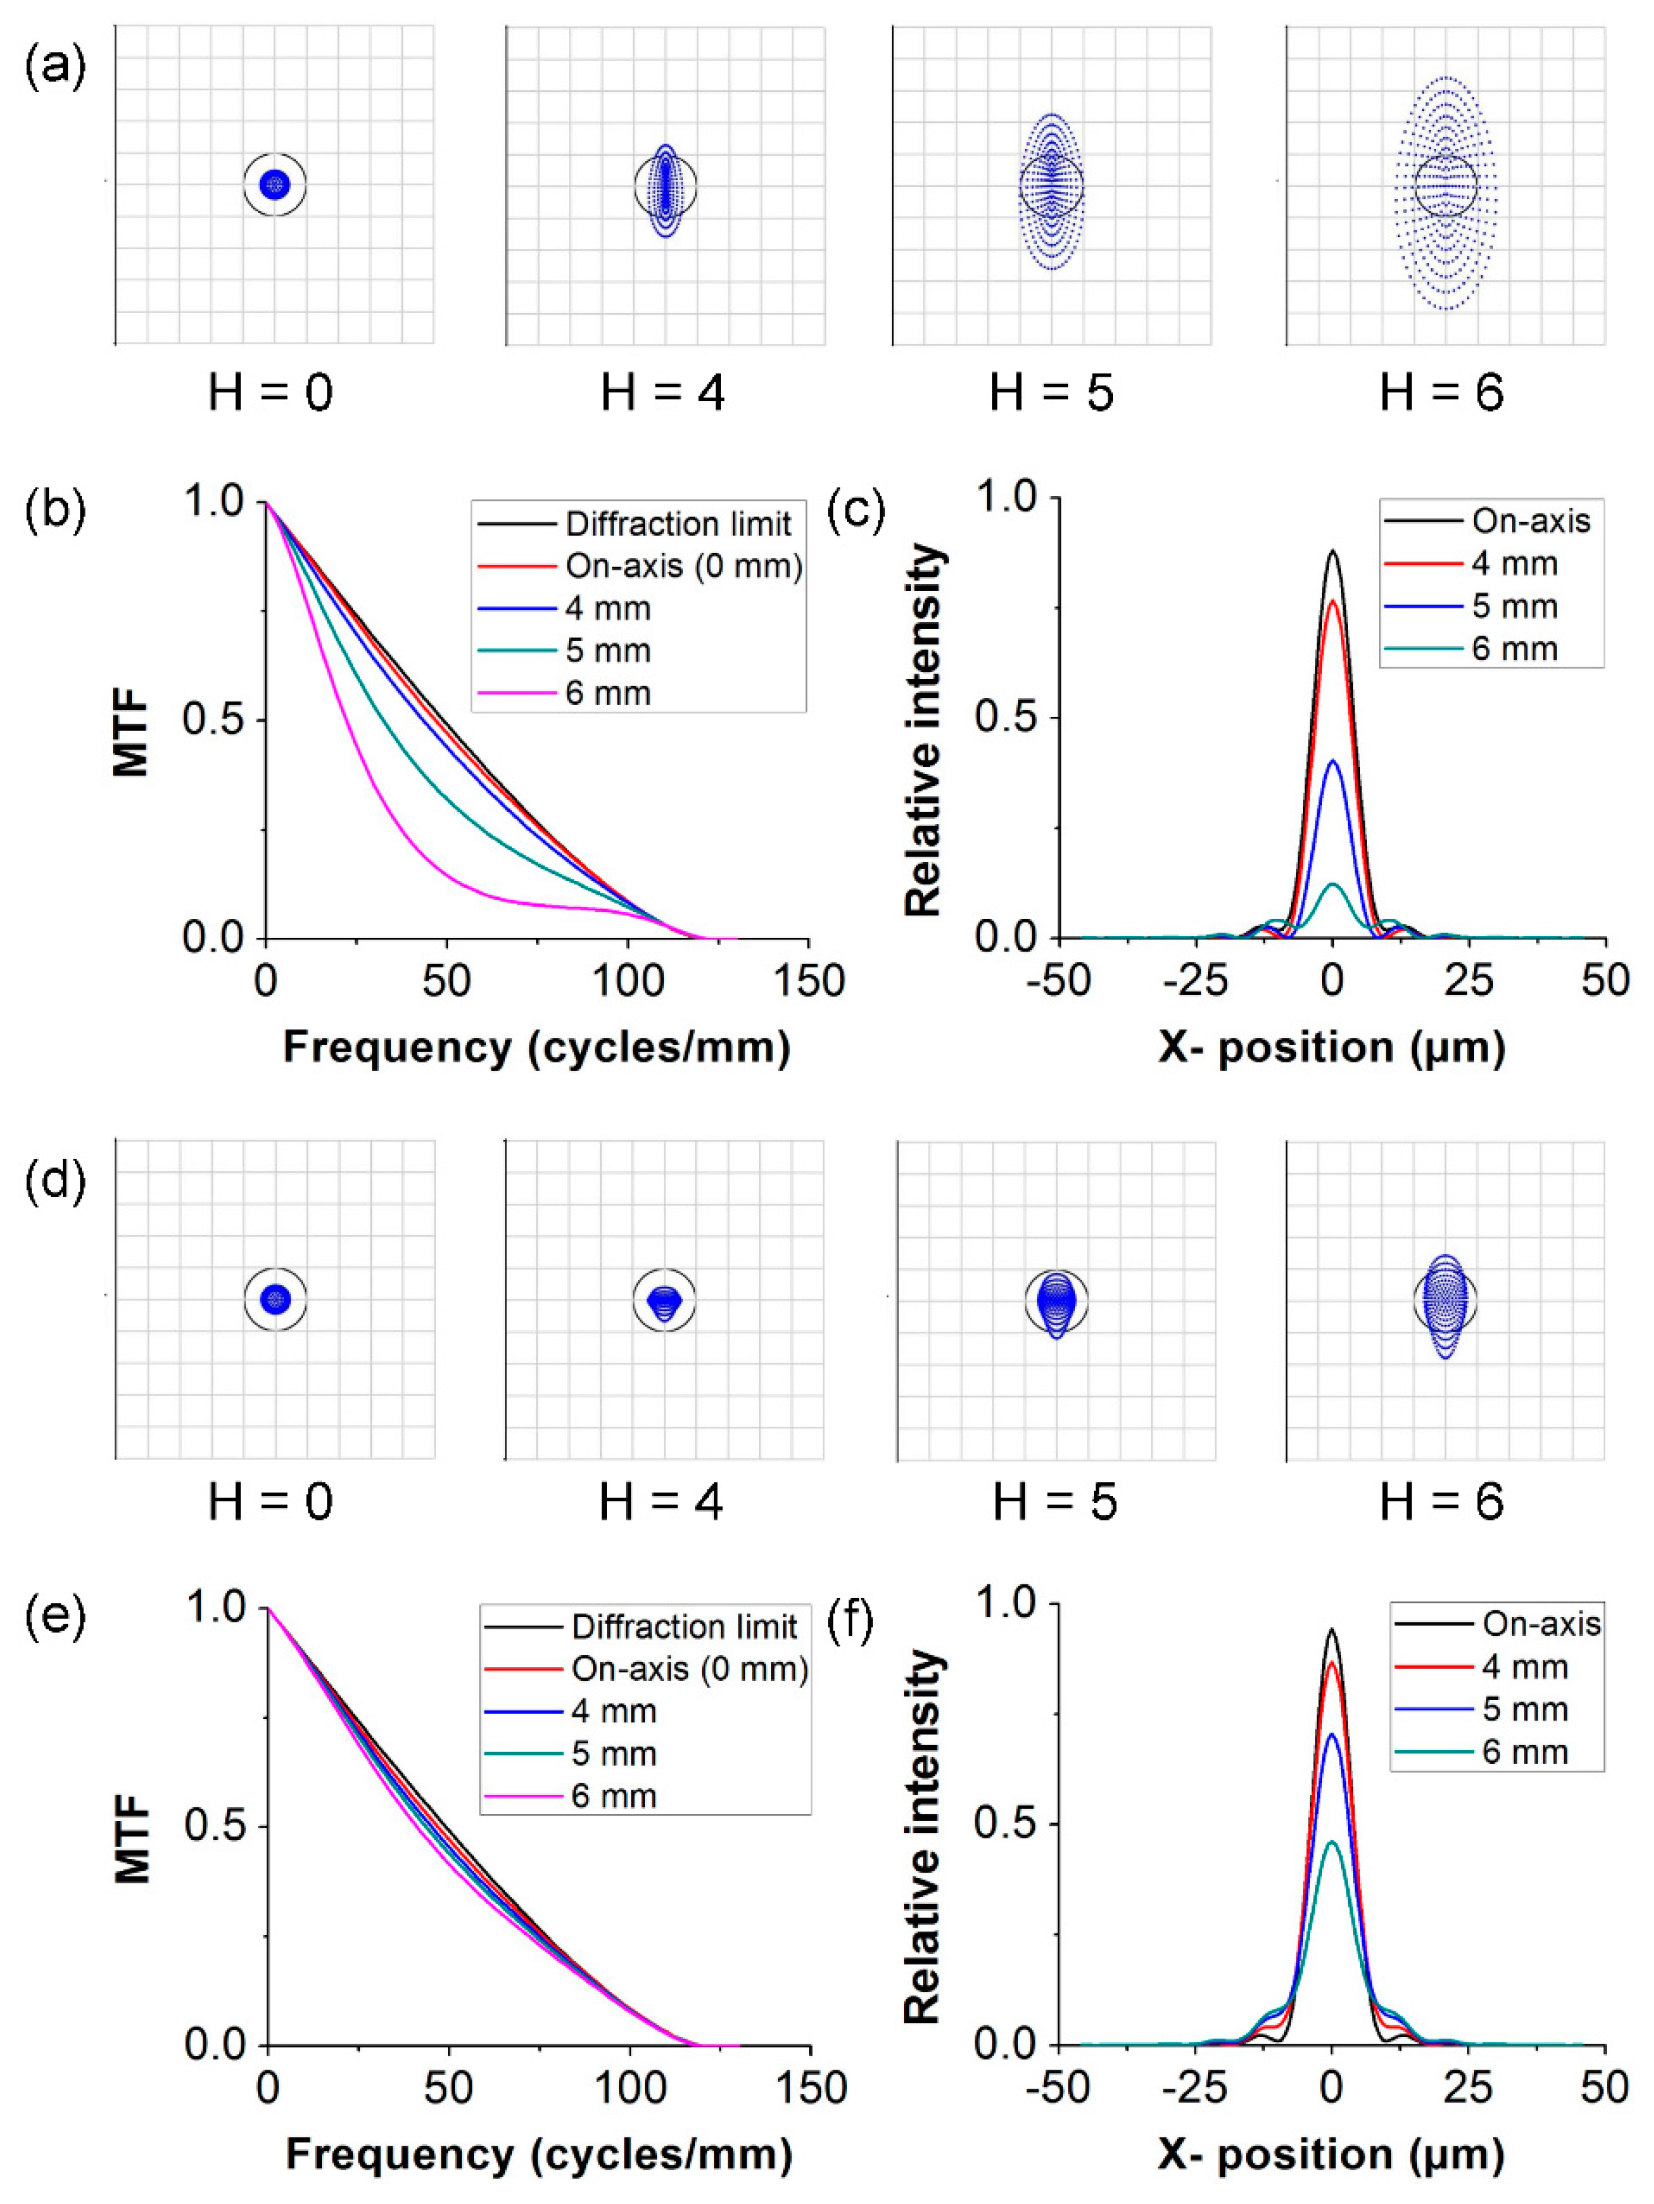
3.1. Simulation Study
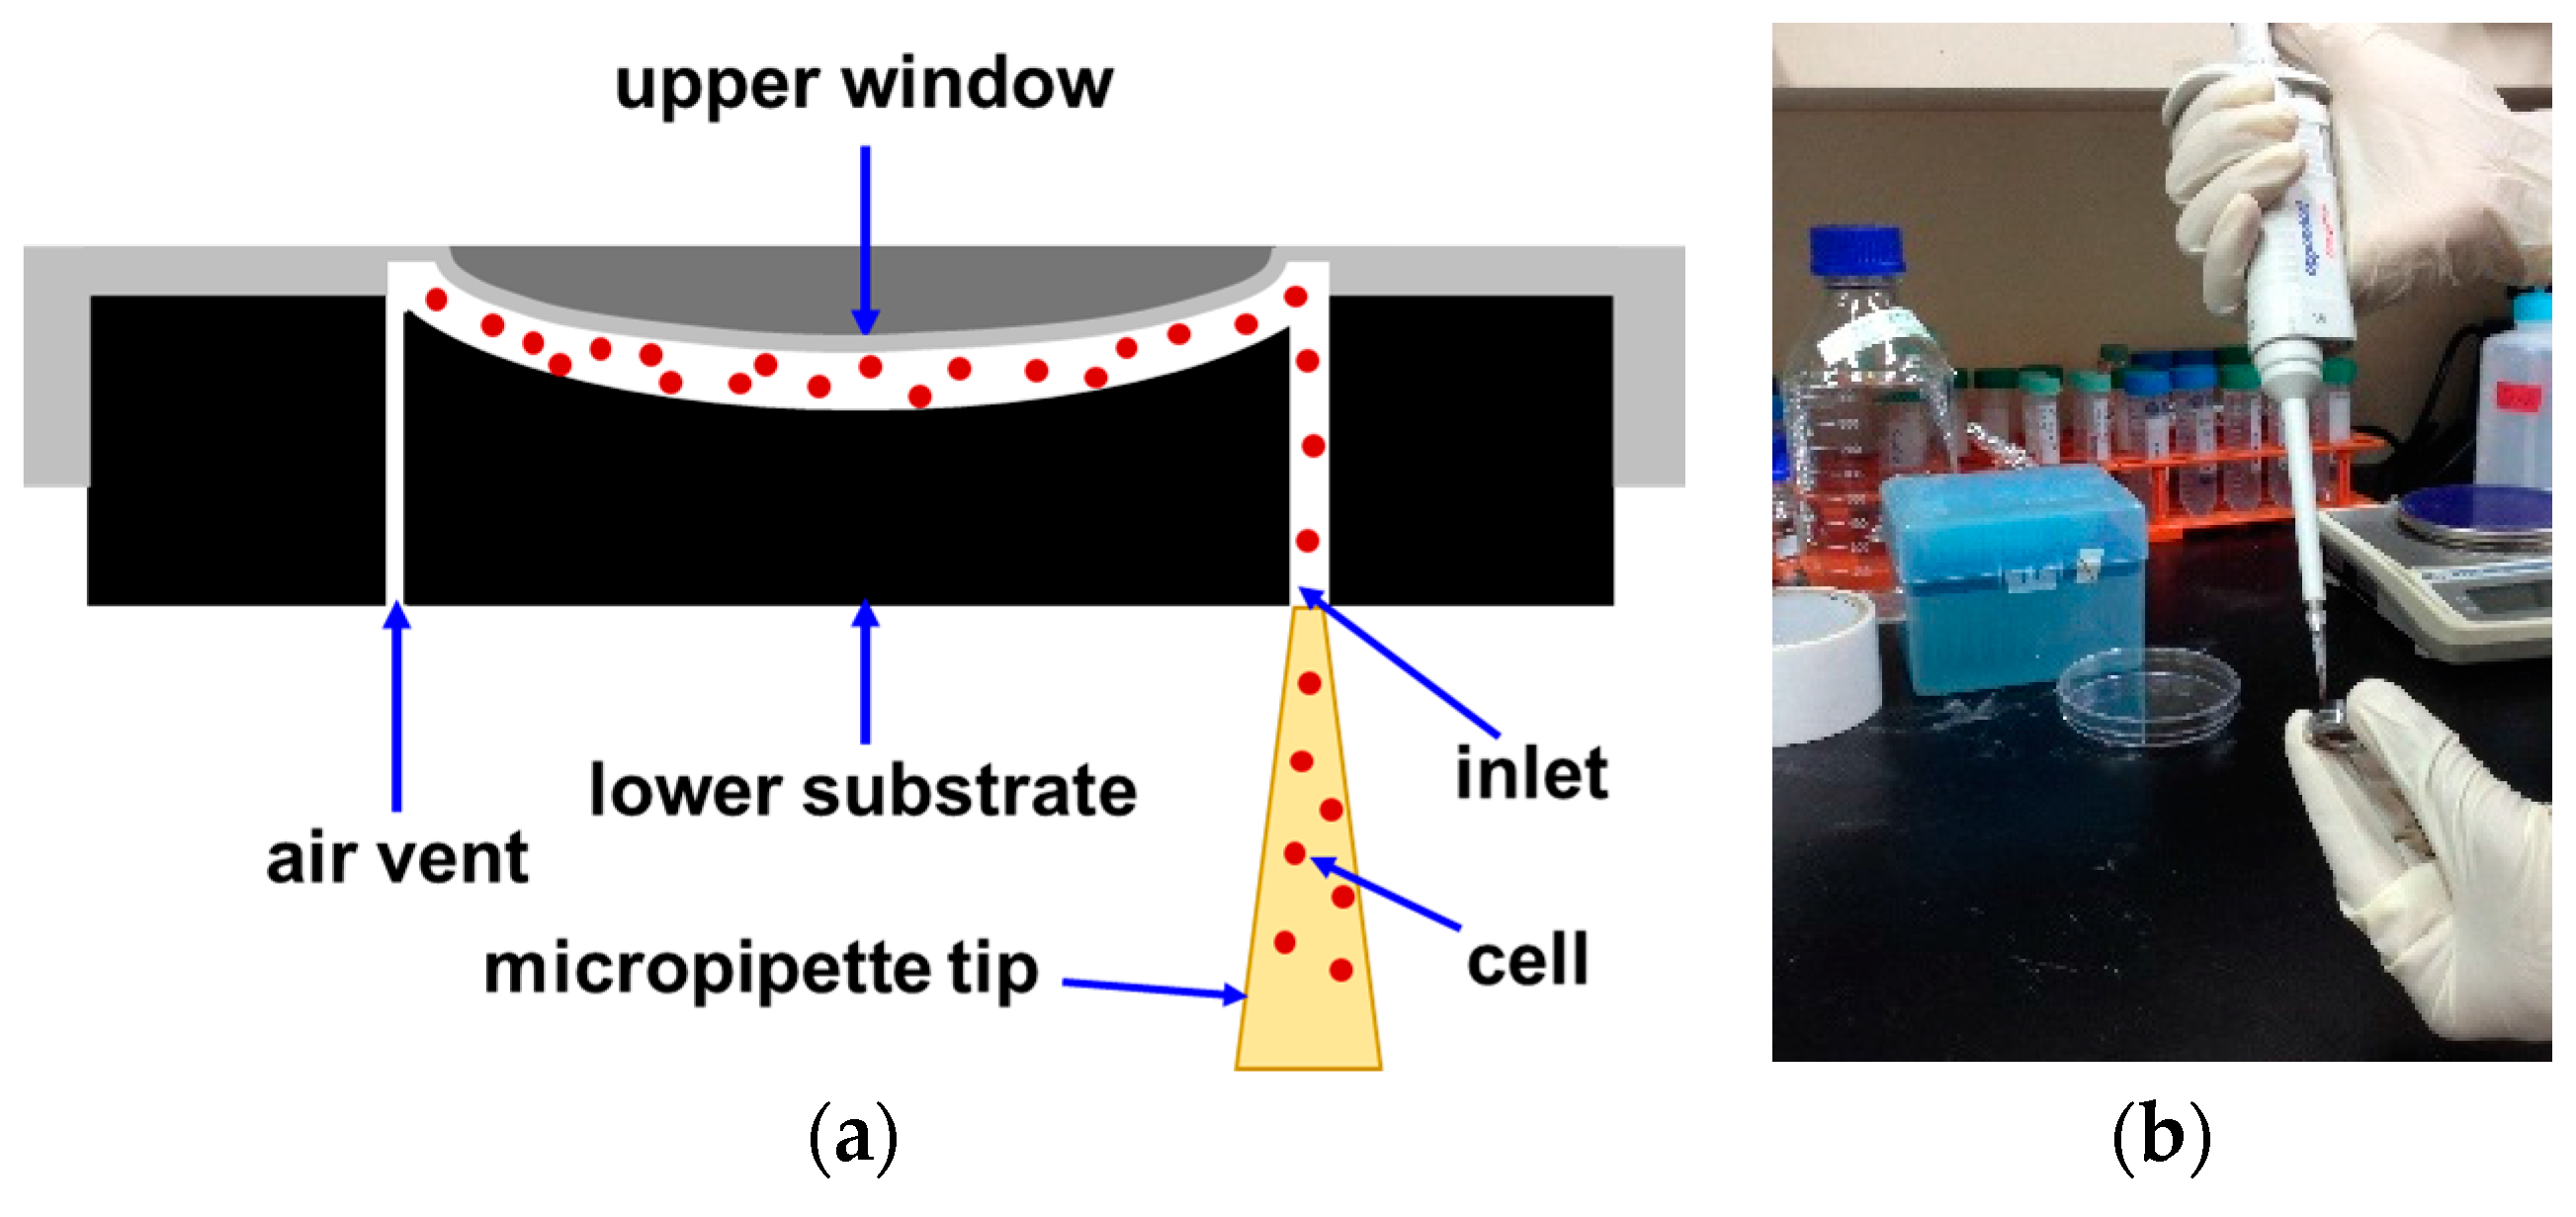
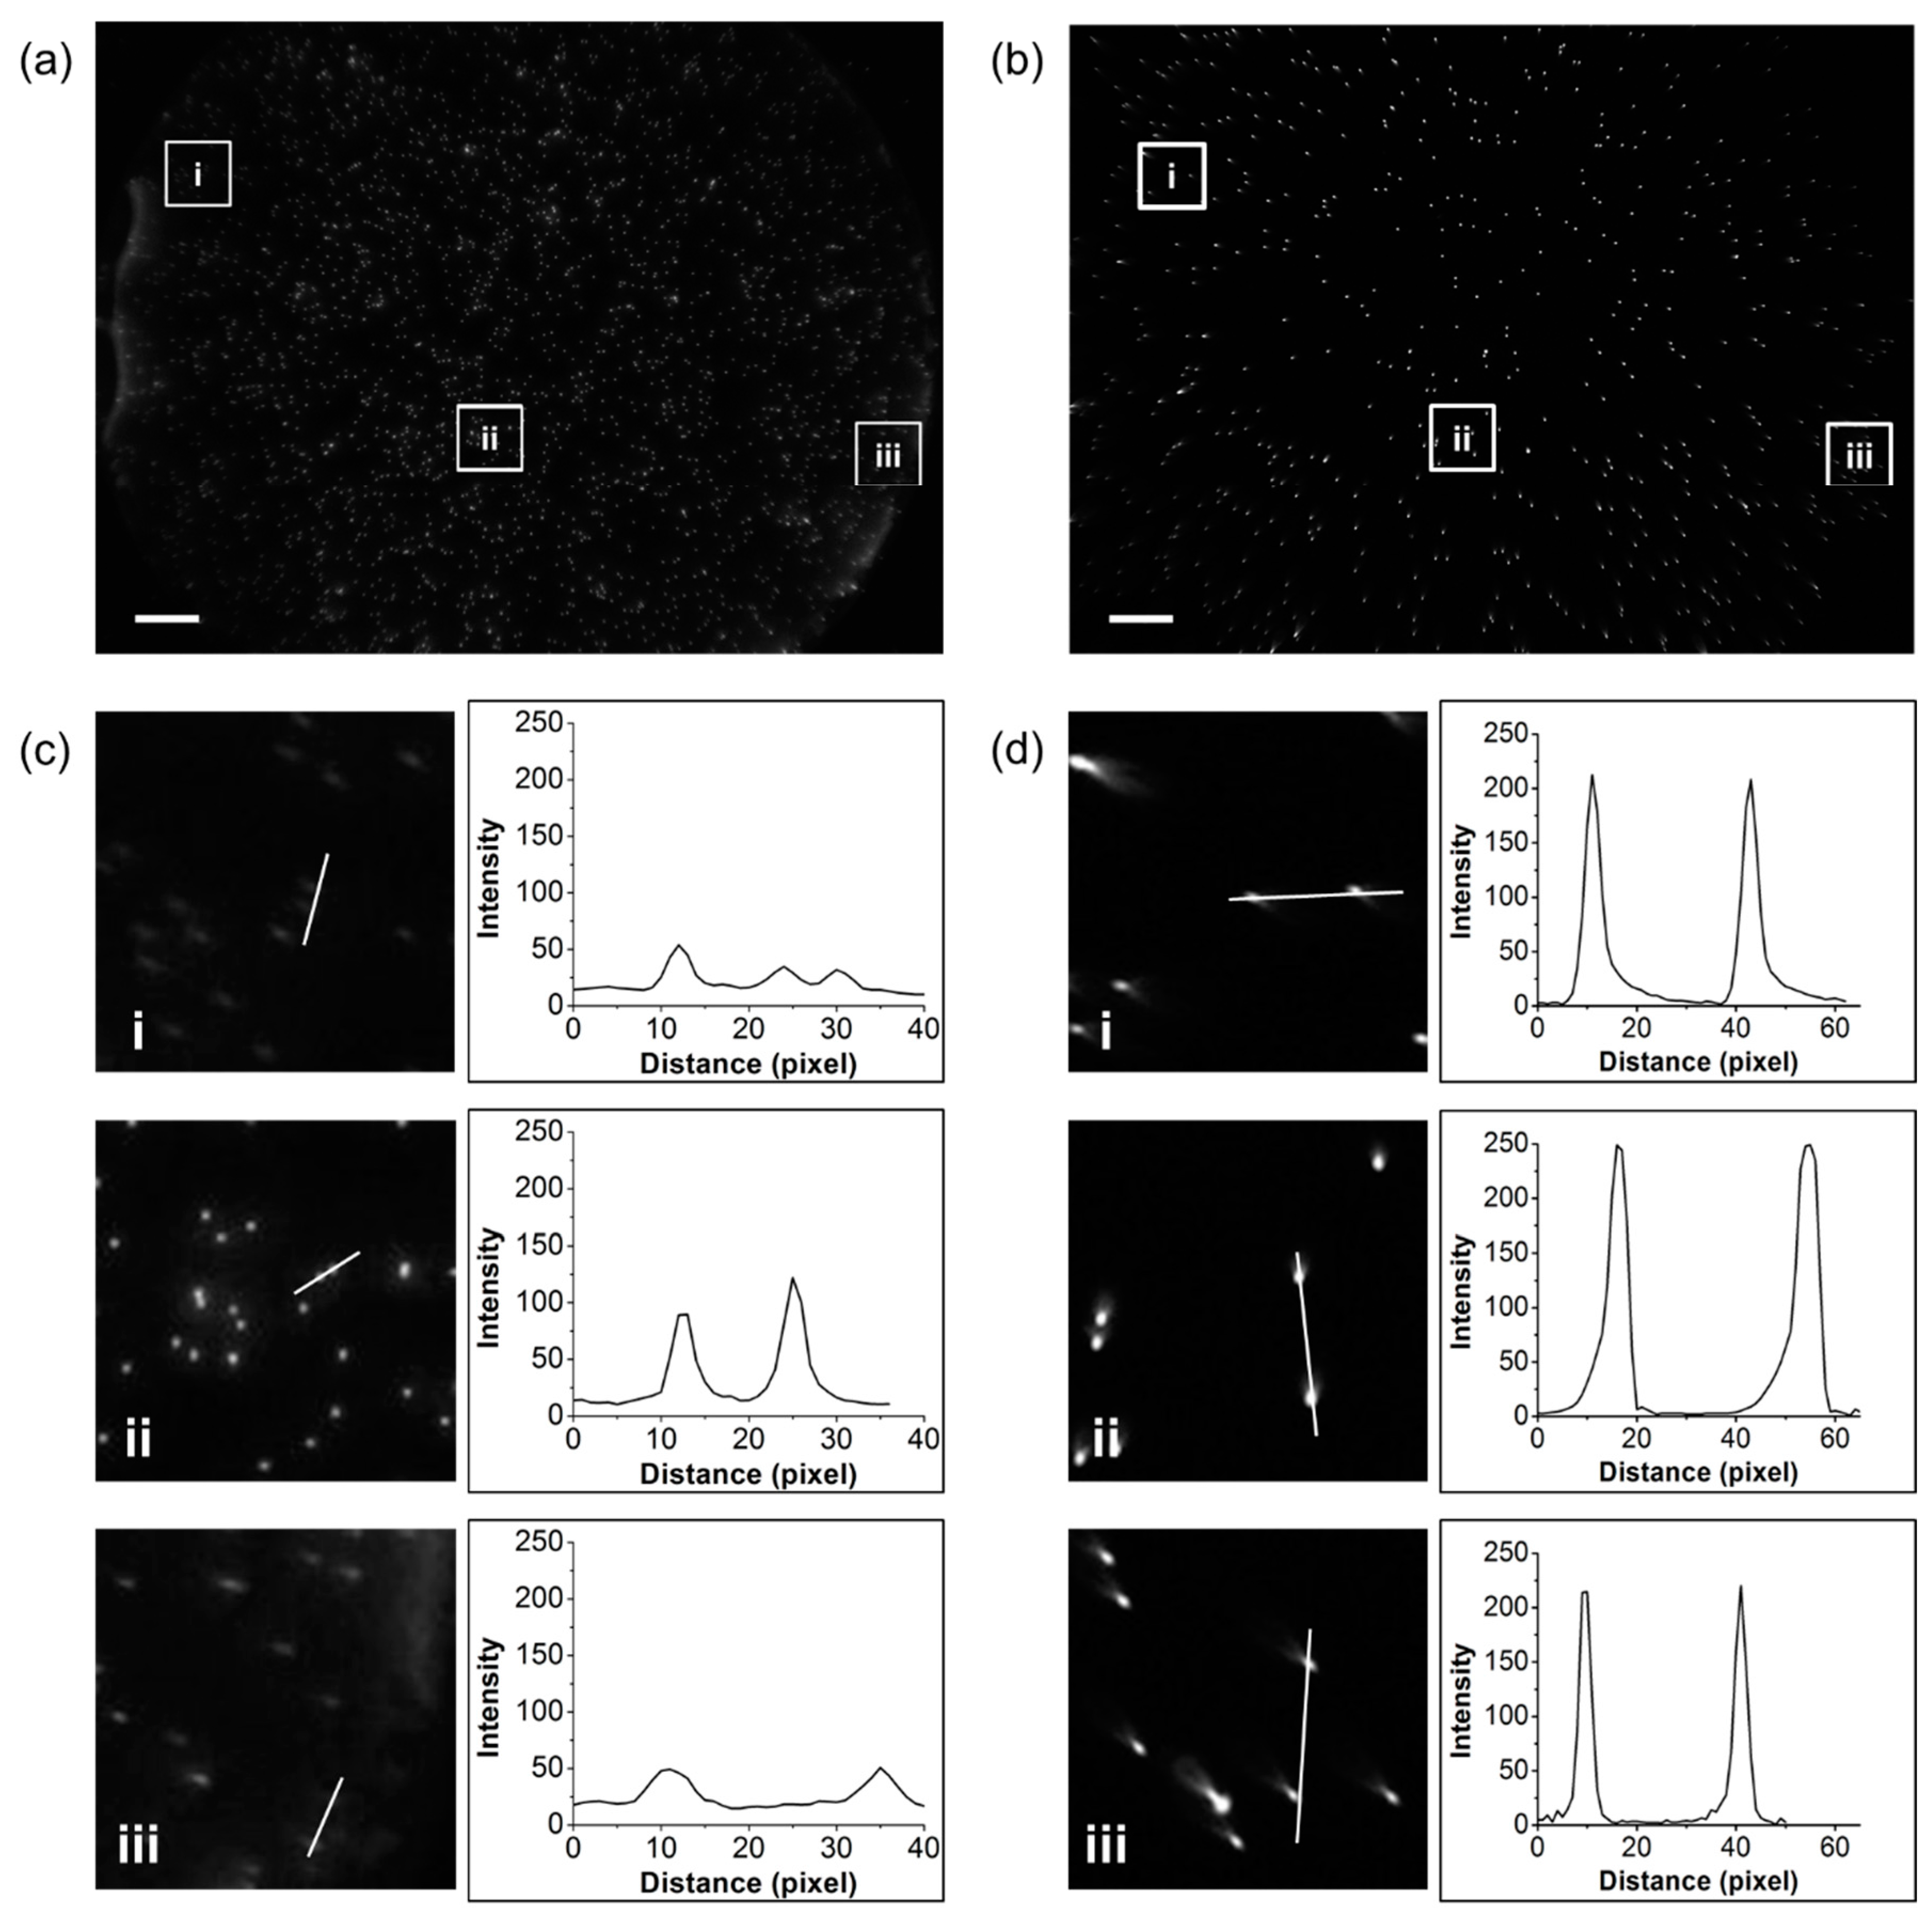
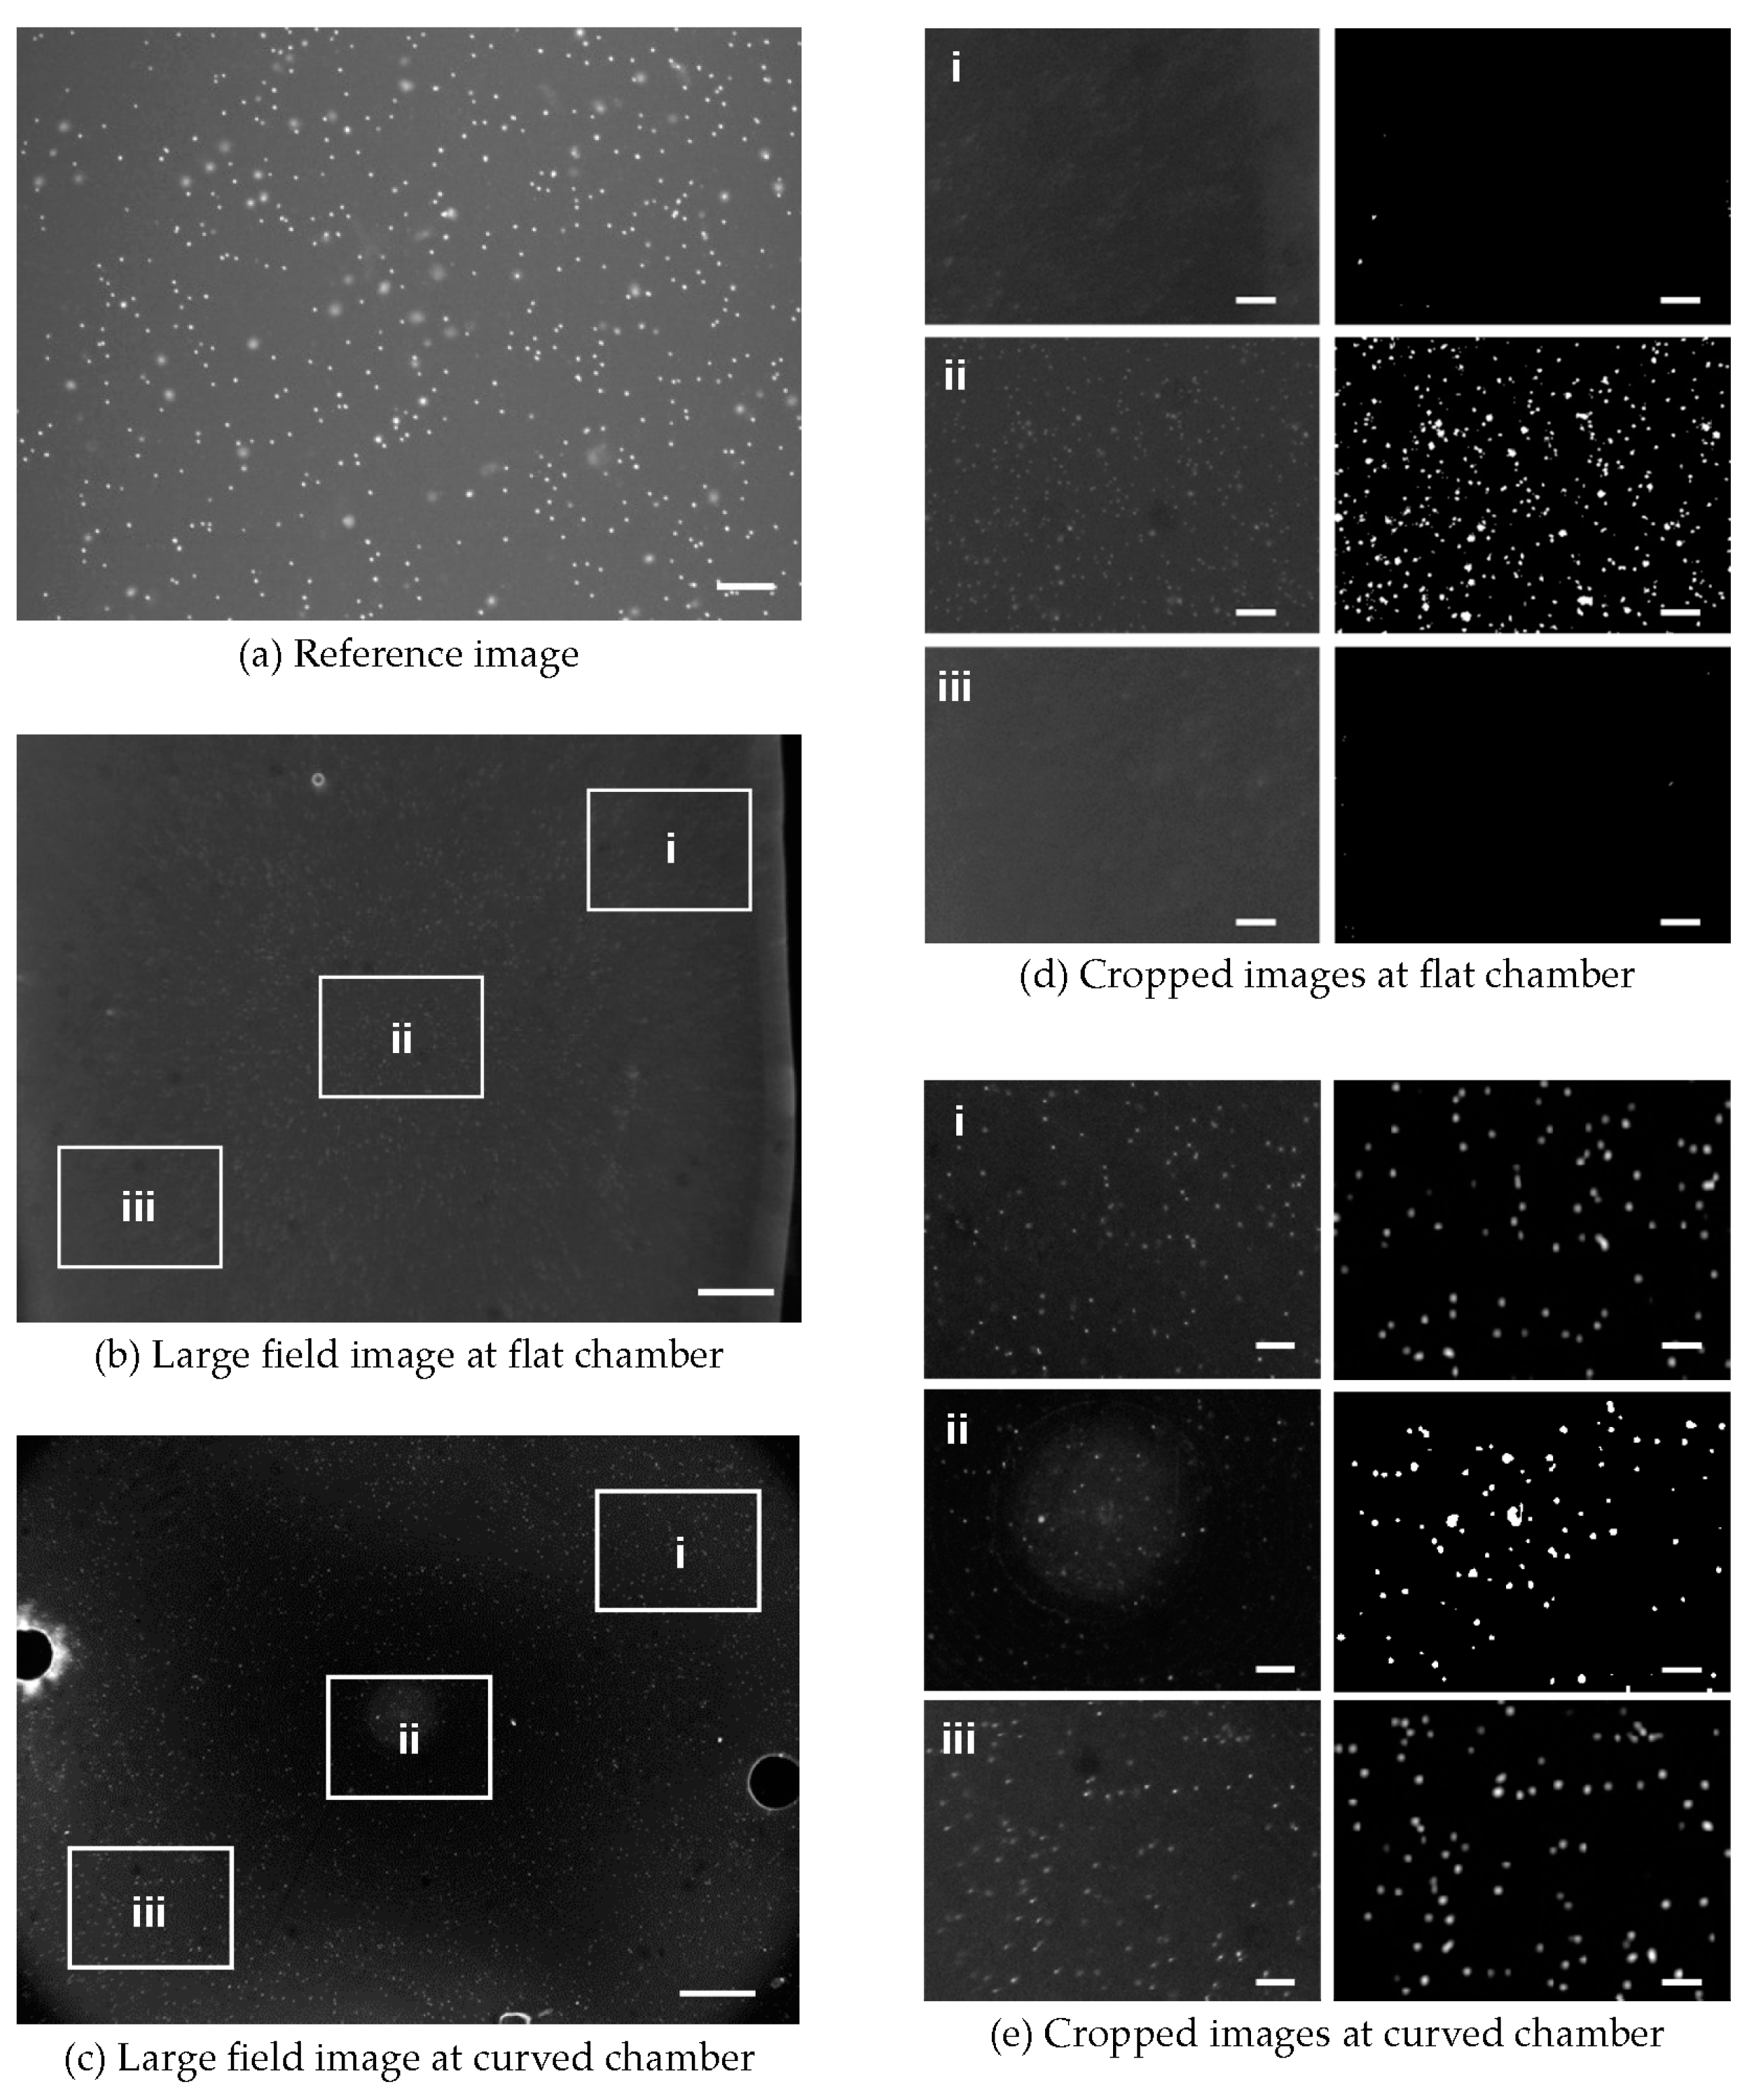
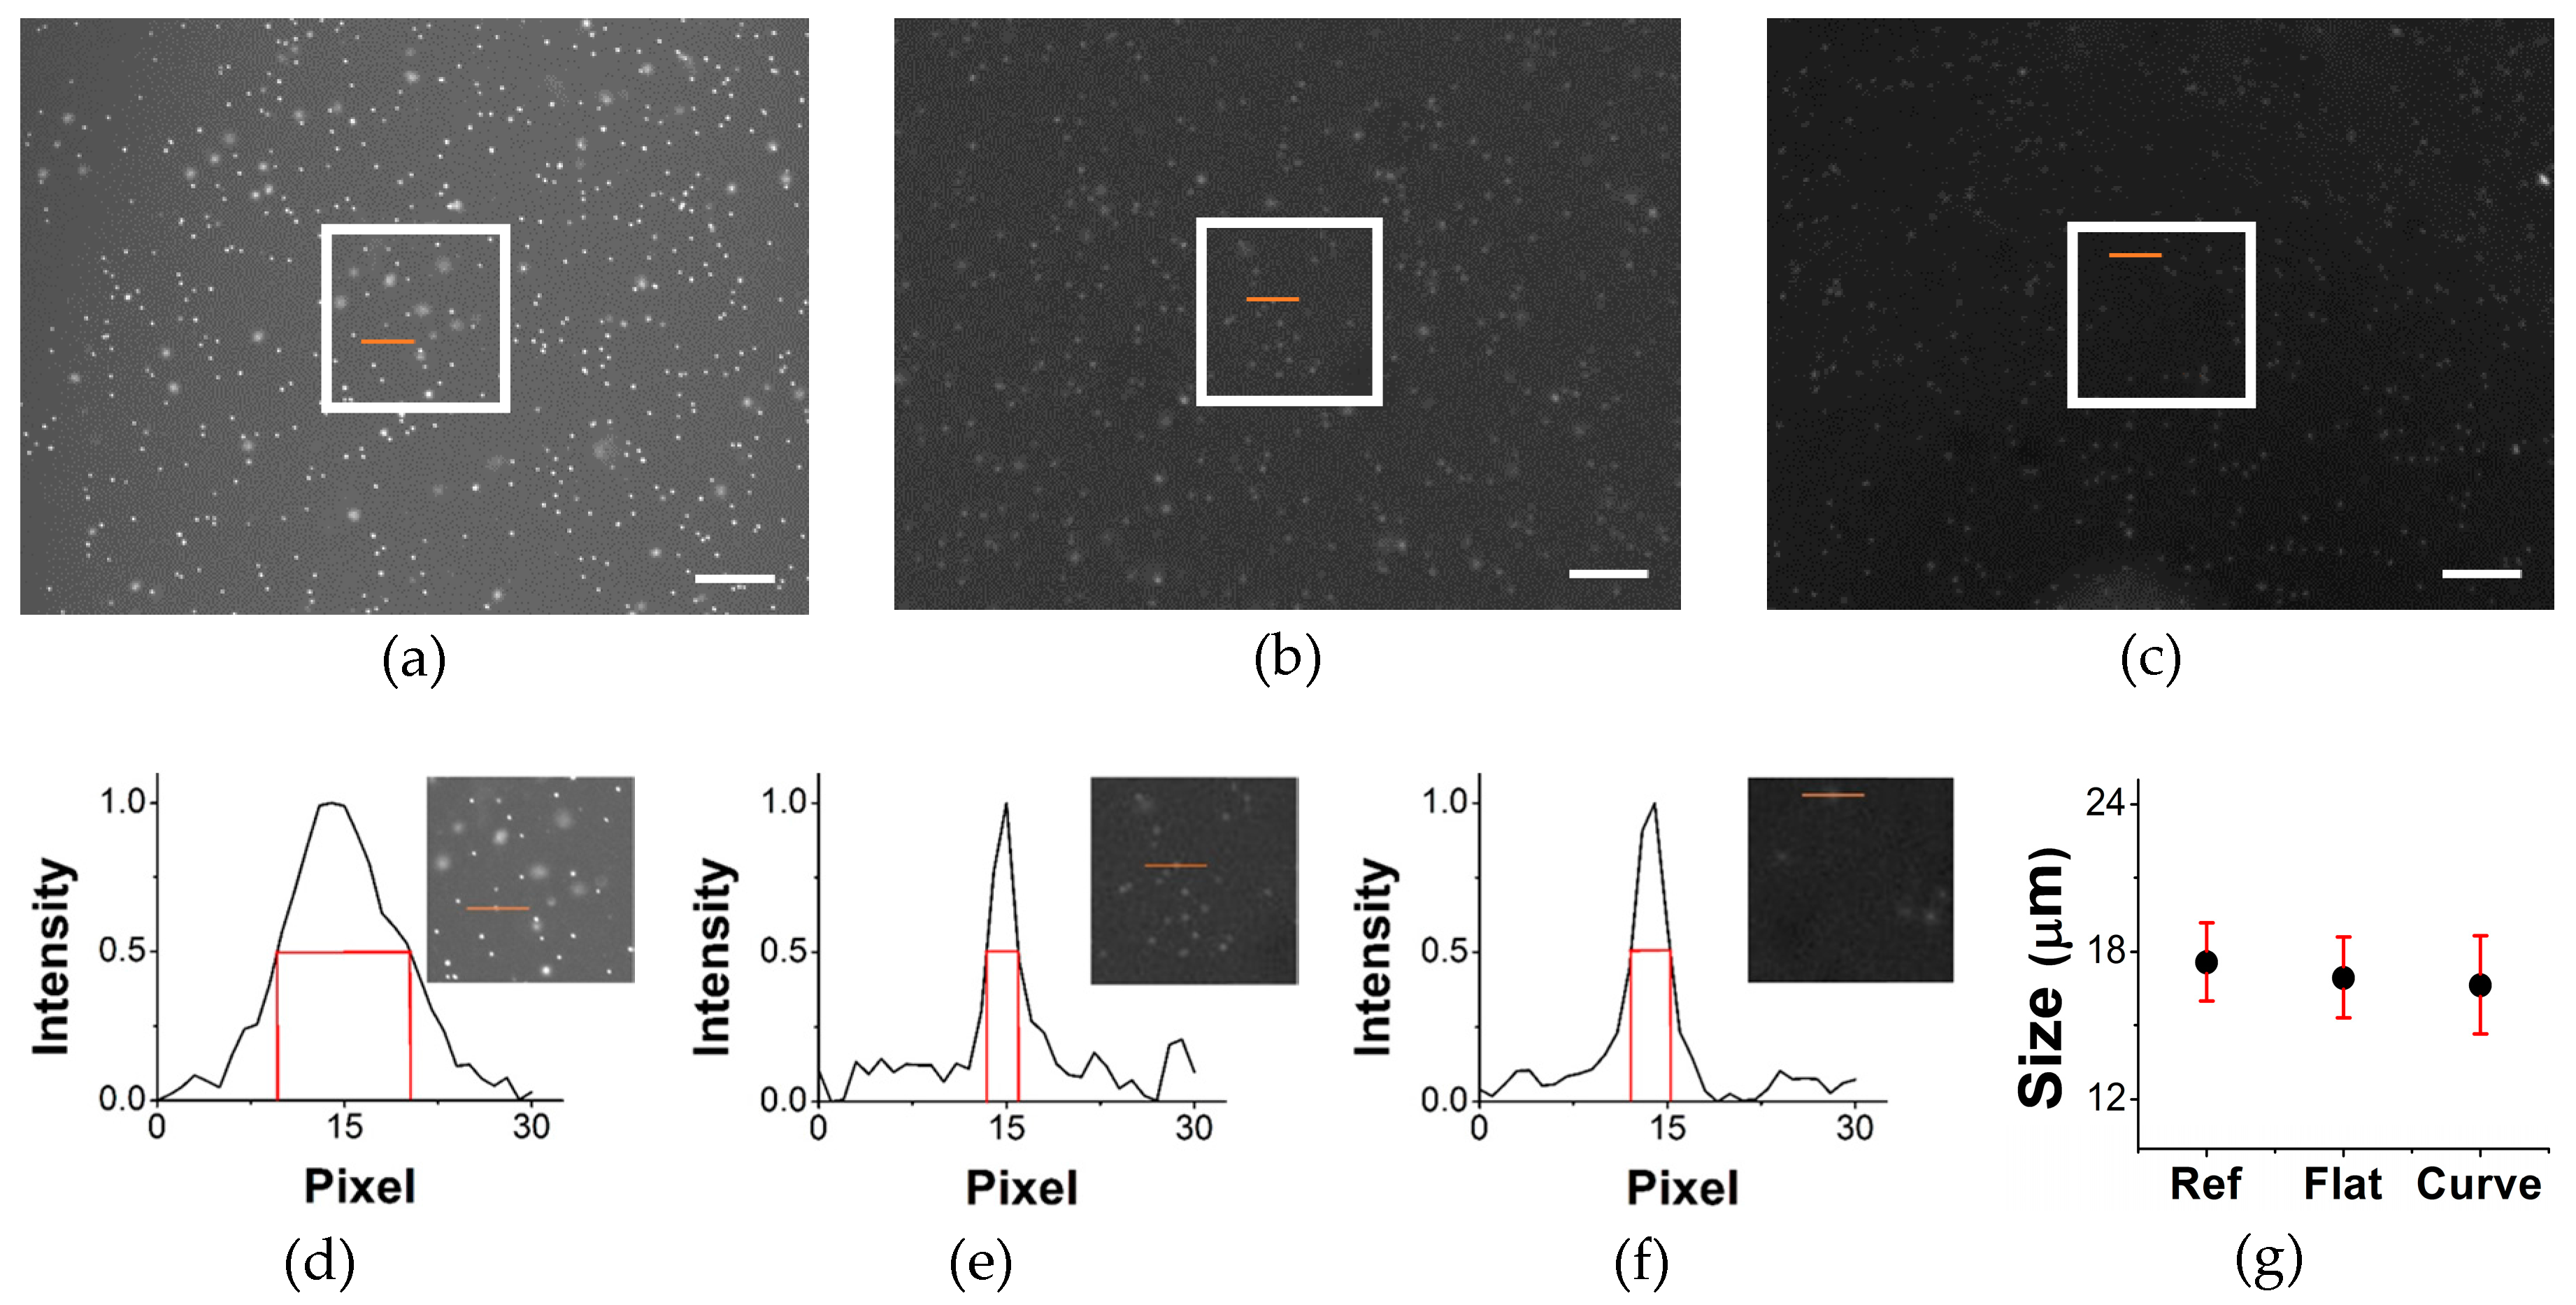
3.2. Validation Study
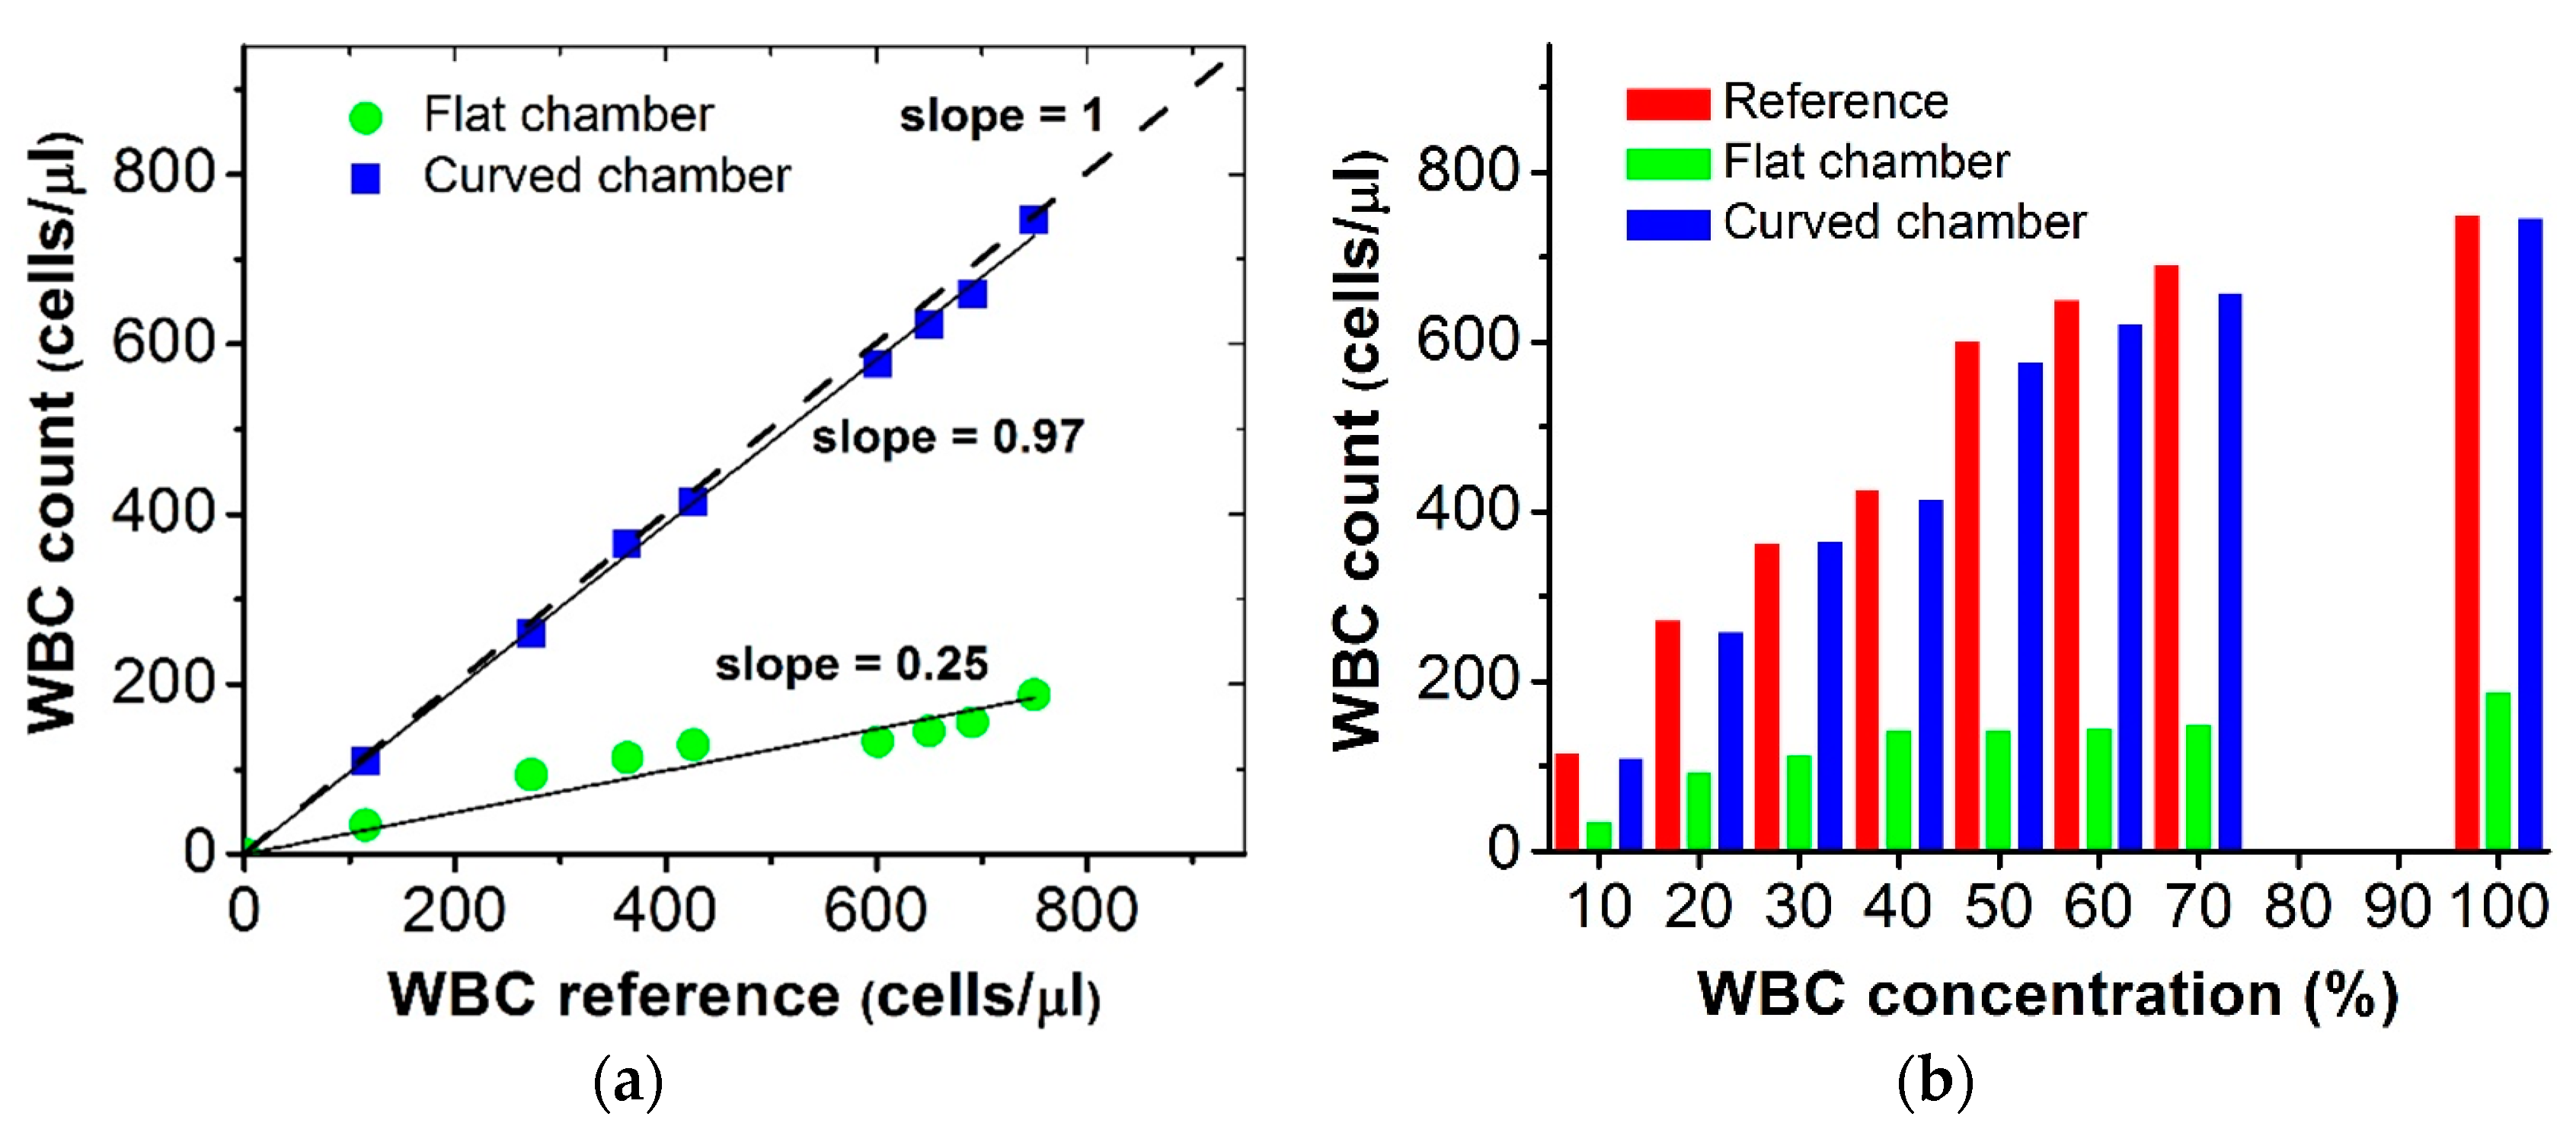
3.3. Absolute Counting of WBC
3.4. Advantages of Large FOV Imaging with Curved Sample Chamber
4. Conclusions
Acknowledgments
Author Contributions
Conflicts of Interest
References
- Jenkins, F.A.; White, H.E. Fundamentals of Optics, 4th ed.; Shirley, G., Ed.; McGraw-Hill: New York, NY, USA, 2001. [Google Scholar]
- Cybulski, J.S.; Clements, J.; Prakash, M. Foldscope: Origami-based paper microscopy. PLoS ONE 2014, 9, e98781. [Google Scholar] [CrossRef] [PubMed]
- Smith, Z.J.; Chu, K.; Espenson, A.R.; Rahimzadeh, M.; Gryshuk, A.; Molinaro, M.; Dwyr, D.M.; Lane, S.; Matthews, D.; Wachsmann-Hogiu, S. Cell-phone-based platform for biomedical device development and education application. PLoS ONE 2011, 6, e17150. [Google Scholar] [CrossRef] [PubMed]
- Breslauer, D.N.; Maamari, R.N.; Switz, N.A.; Lam, W.A.; Fletcher, D.A. Mobile phone based clinical microscopy for global health applications. PLoS ONE 2009, 4, e6320. [Google Scholar] [CrossRef] [PubMed]
- Zhu, H.; Sencan, I.; Wong, J.; Dimitrov, S.; Tseng, D.; Nagashima, K.; Ozcan, A. Cost-effective and rapid blood analysis on a cell-phone. Lab Chip 2013, 13, 1282–1288. [Google Scholar] [CrossRef] [PubMed]
- Choi, J.R.; Kim, K.J.; Kim, D.H. In situ fluorescence optical detection using a digital micromirror device (DMD) for 3D cell-based assays. J. Opt. Soc. Korea 2012, 16, 42–46. [Google Scholar] [CrossRef]
- Potsaid, B.; Finger, F.P.; Wen, J.T. Automation of challenging spatial-temporal biomedical observations with the adaptive scanning optical microscope (ASOM). IEEE Trans. Autom. Sci. Eng. 2009, 6, 525–535. [Google Scholar] [CrossRef]
- Hecht, E. Optics, 4th ed.; Addison Wesley: San Francisco, CA, USA, 2002; p. 226. [Google Scholar]
- Rim, S.B.; Catrysse, P.B.; Dinyari, R.; Huang, K.; Peumans, P. The optical advantages of curved focal plane arrays. Opt. Exp. 2008, 16, 4965–4971. [Google Scholar] [CrossRef]
- Jin, H.; Abelson, J.R.; Erhardt, M.K.; Nuzzo, R.G. Soft lithographic fabrication of an image sensor array on a curved substrate. J. Vac. Sci. Technol. B 2004, 22, 2548–2551. [Google Scholar] [CrossRef]
- Malyarchuk, V.; Jung, I.; Rogers, J.A.; Shin, G.; Ha, J.S. Experimental and modeling studies of imaging with curvilinear electronic eye cameras. Opt. Exp. 2010, 18, 27346–27358. [Google Scholar] [CrossRef] [PubMed]
- Jung, I.; Xiao, J.; Malyarchuk, V.; Lu, C.; Li, M.; Liu, Z.; Rogers, J.A. Dynamically tunable hemispherical electronic eye camera system with adjustable zoom capability. Proc. Natl. Acad. Sci. USA 2011, 108, 1788–1793. [Google Scholar] [CrossRef] [PubMed]
- Ozcan, A.; Demirci, U. Ultra wide-field lens-free monitoring of cells on-chip. Lab Chip 2008, 8, 98–106. [Google Scholar] [CrossRef] [PubMed]
- Greenbaum, A.; Luo, W.; Su, T.W.; Göröcs, Z.; Xue, L.; Isikman, S.O.; Coskun, A.F.; Mudanyali, O.; Ozcan, A. Imaging without lenses: Achievements and remaining challenges of wide-field on-chip microscopy. Nat. Methods 2012, 9, 889–895. [Google Scholar] [CrossRef] [PubMed]
- Seo, S.; Isikman, O.S.; Sencan, I.; Mudanyali, O.; Su, T.W.; Bishara, W.; Erlinger, A.; Ozcan, A. High-throughput lens-free blood analysis on a chip. Anal. Chem. 2010, 82, 4621–4627. [Google Scholar] [CrossRef] [PubMed]
- Su, T.W.; Erlinger, A.; Tseng, D.; Ozcan, A. Compact and light-weight automated semen analysis platform using lensfree on-chip microscopy. Anal. Chem. 2010, 82, 8307–8312. [Google Scholar] [CrossRef] [PubMed]
- Mudanyali, O.; Oztoprak, C.; Tseng, D.; Erlinger, A.; Ozcan, A. Detection of waterborne parasites using field-portable and cost-effective lensfree microscopy. Lab Chip 2010, 10, 2419–2423. [Google Scholar] [CrossRef] [PubMed]
- Göröcs, Z.; Ling, Y.; Yu, M.D.; Karahalios, D.; Mogharabi, K.; Lu, K.; Wei, Q.; Ozcan, A. Giga-pixel fluorescent imaging over an ultra-large field-of-view using a flatbed scanner. Lab Chip 2013, 13, 4460–4466. [Google Scholar] [CrossRef] [PubMed]
- Ulrich, W.; Shafer, D.; Bader, D.; Epple, A. Refractive Optical Imaging System, in Particular Projection Objective for Microlithography. U.S. Patent 7,511,890, 31 March 2006. [Google Scholar]
- Malacara, D.; Malacara, Z. Handbook of Optical Design, 2nd ed.; Marcel Dekker: New York, NY, USA, 2004. [Google Scholar]
- Hagen, N.; Tkaczyk, T. Foveated endoscopic lens. J. Biomed. Opt. 2012. [Google Scholar] [CrossRef] [PubMed]
- Zhu, H.; Yaglidere, O.; Su, T.; Tseng, D.; Ozcan, A. Cost-effective and compact wide-field fluorescence imaging on a cell-phone. Lab Chip 2010, 11, 315–322. [Google Scholar] [CrossRef] [PubMed]
- Lee, W.; Kwon, D.; Choi, W.; Jung, G.Y.; Jeon, S. 3D-printed microfluidic device for the detection of pathogenic bacteria using size-based separation in helical channel with trapezoid cross-section. Sci. Rep. 2015. [Google Scholar] [CrossRef] [PubMed]
- Smith, W.J. Modern Optical Engineering, 4th ed.; McGraw-Hill: New York, NY, USA, 2007; p. 90. [Google Scholar]
- Arpali, S.A.; Arpali, C.; Coskun, A.F.; Chiang, H.H.; Ozcan, A. High-throughput screening of large volumes of whole blood using structured illumination and fluorescent on-chip imaging. Lab Chip 2012, 12, 4968–4971. [Google Scholar] [CrossRef] [PubMed]
- Cho, M.O.; Chang, H.M.; Lee, D.; Yu, Y.G.; Han, H.; Kim, J.K. Selective detection and automated counting of fluorescently-labeled chrysotile asbestos using a dual-mode high-throughput microscopy (DM-HTM) method. Sensors 2013, 9, 5686–5699. [Google Scholar] [CrossRef] [PubMed]
- Shapiro, M.H. Practical Flow Cytometry, 4th ed.; Wiley-Liss: Hoboken, NJ, USA, 2003; pp. 18–20. [Google Scholar]


| Lens | Inner Surface of Sphere | Outer Surface of Sphere | ||||
|---|---|---|---|---|---|---|
| Radius | Height | Volume | Radius | Height | Volume | |
| (mm) | (mm) | (mm3) | (mm) | (mm) | (mm3) | |
| LB1014 | 15.06 | 1.25 | 71.88 | 15.56 | 1.75 | 144.09 |
| LB1258 | 18.08 | 1.03 | 59.114 | 18.58 | 1.53 | 132.89 |
| LB1378 | 24.12 | 0.8 | 47.96 | 24.62 | 1.3 | 128.41 |
| LB1844 | 30.135 | 0.605 | 34.42 | 30.635 | 1.105 | 116.10 |
© 2016 by the authors. Licensee MDPI, Basel, Switzerland. This article is an open access article distributed under the terms and conditions of the Creative Commons Attribution (CC-BY) license ( http://creativecommons.org/licenses/by/4.0/).
Share and Cite
Shourav, M.K.; Kim, K.; Kim, S.; Kim, J.K. Wide Field-of-View Fluorescence Imaging with Optical-Quality Curved Microfluidic Chamber for Absolute Cell Counting. Micromachines 2016, 7, 125. https://doi.org/10.3390/mi7070125
Shourav MK, Kim K, Kim S, Kim JK. Wide Field-of-View Fluorescence Imaging with Optical-Quality Curved Microfluidic Chamber for Absolute Cell Counting. Micromachines. 2016; 7(7):125. https://doi.org/10.3390/mi7070125
Chicago/Turabian StyleShourav, Mohiuddin Khan, Kyunghoon Kim, Subin Kim, and Jung Kyung Kim. 2016. "Wide Field-of-View Fluorescence Imaging with Optical-Quality Curved Microfluidic Chamber for Absolute Cell Counting" Micromachines 7, no. 7: 125. https://doi.org/10.3390/mi7070125