
Experimental Analysis of Porosity and Permeability in Pressed Paper


Abstract
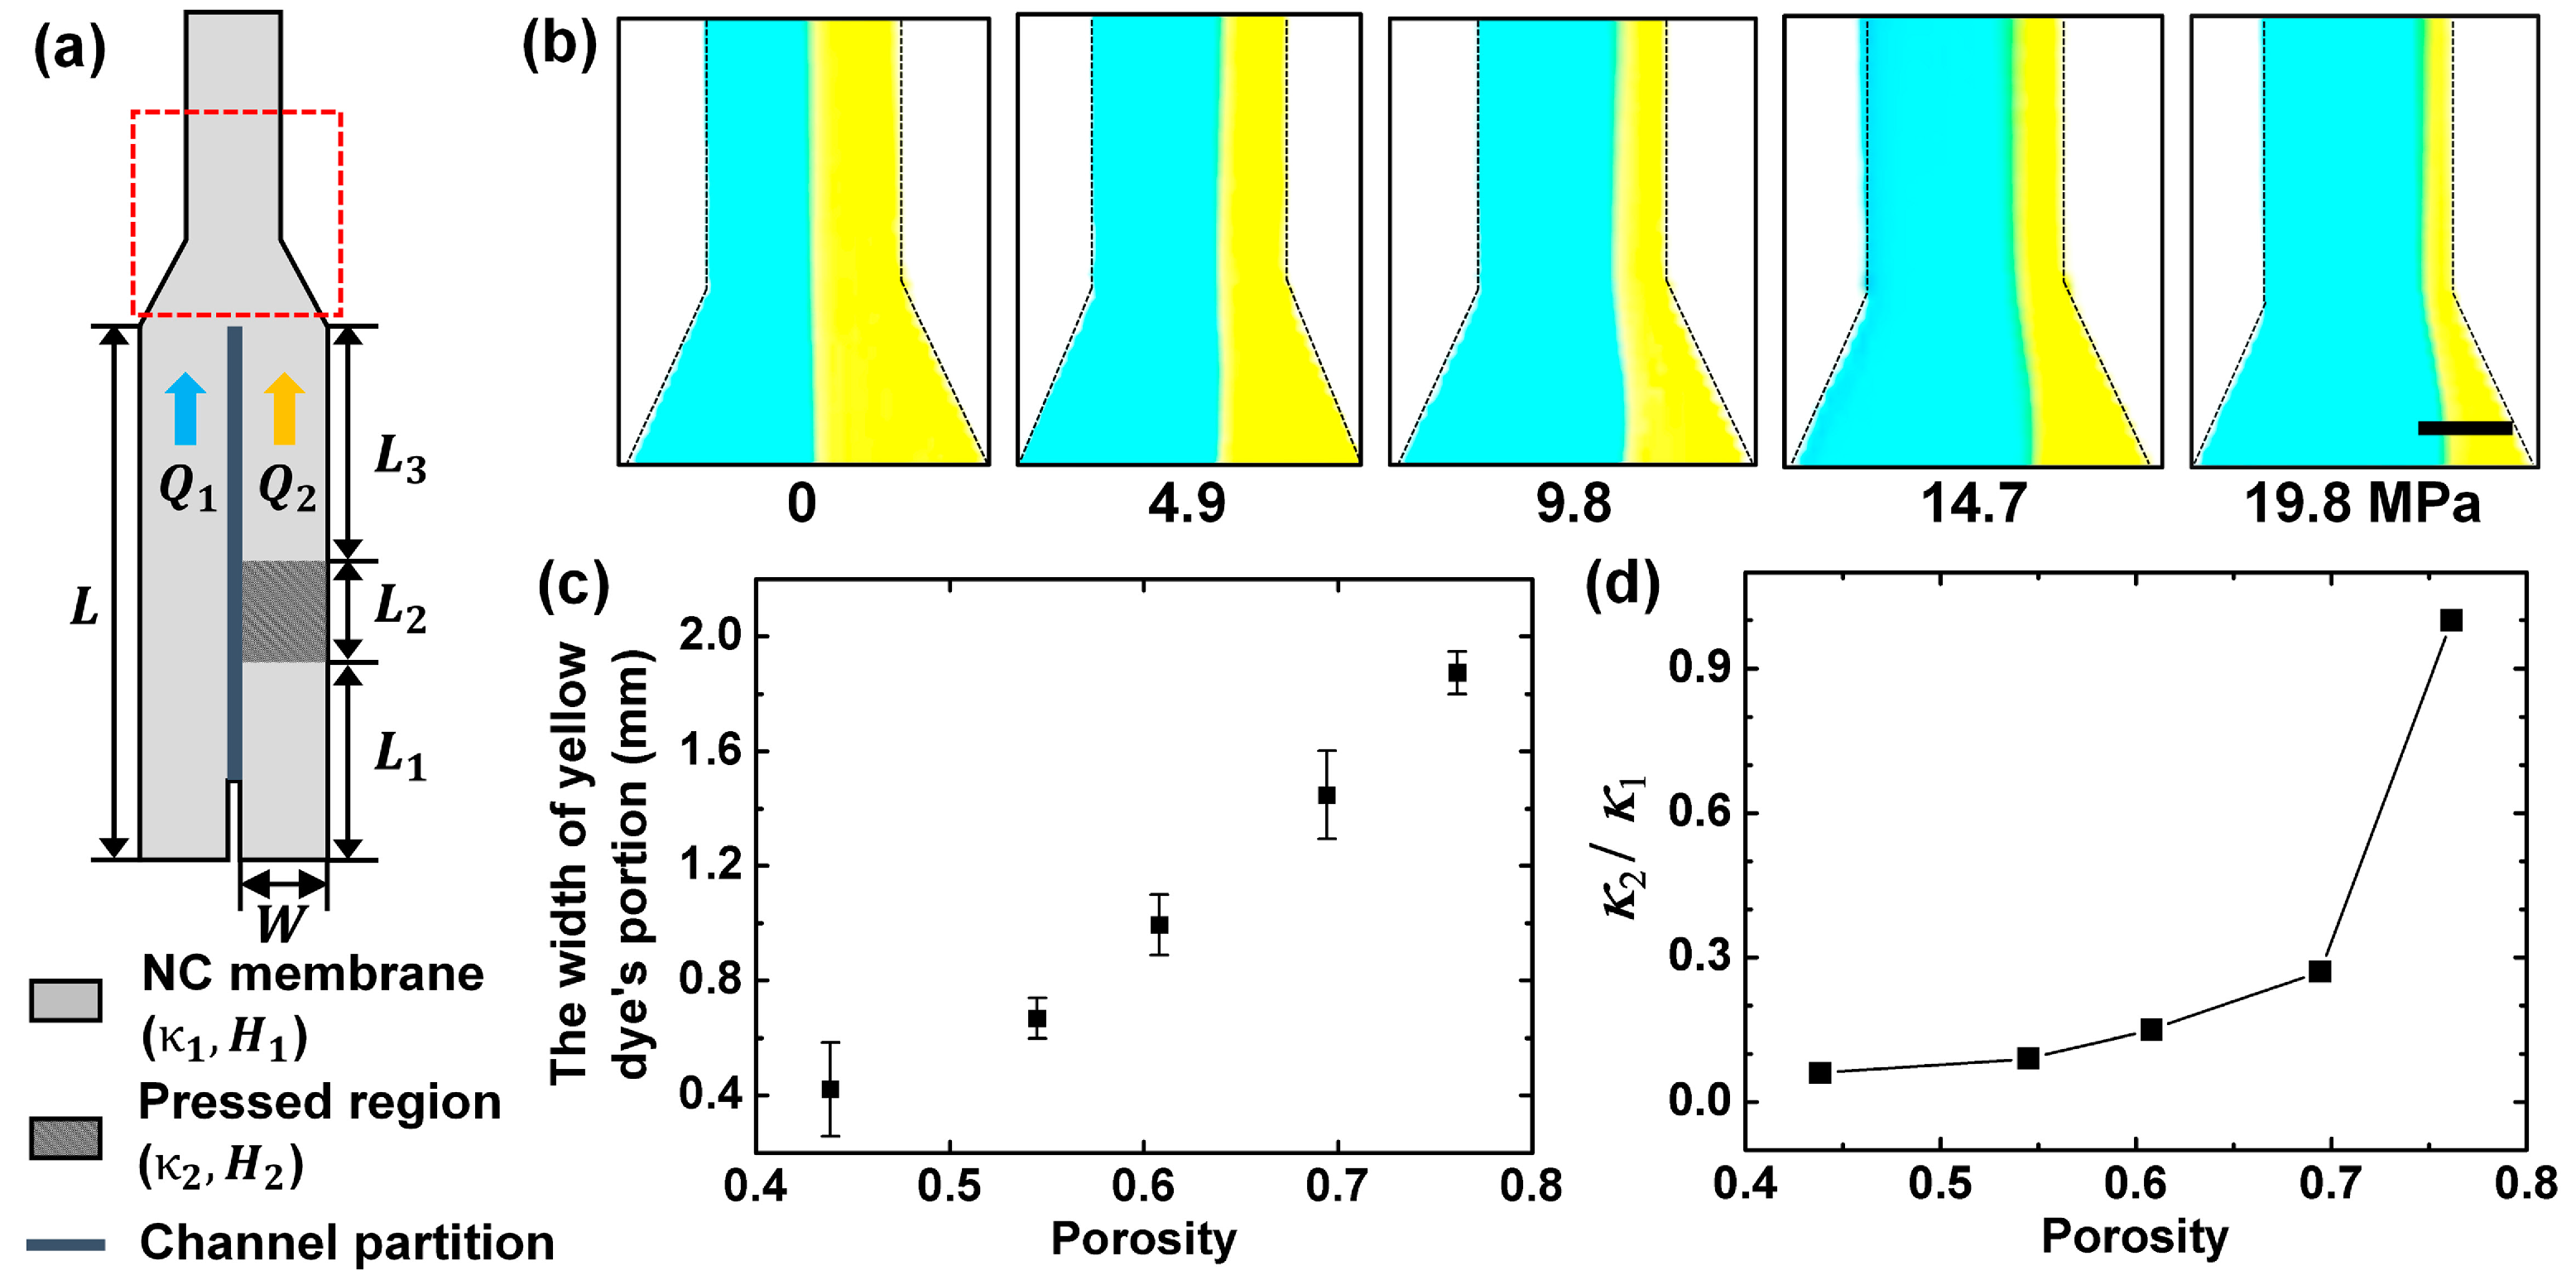
:
1. Introduction
2. Experimental
2.1. Materials
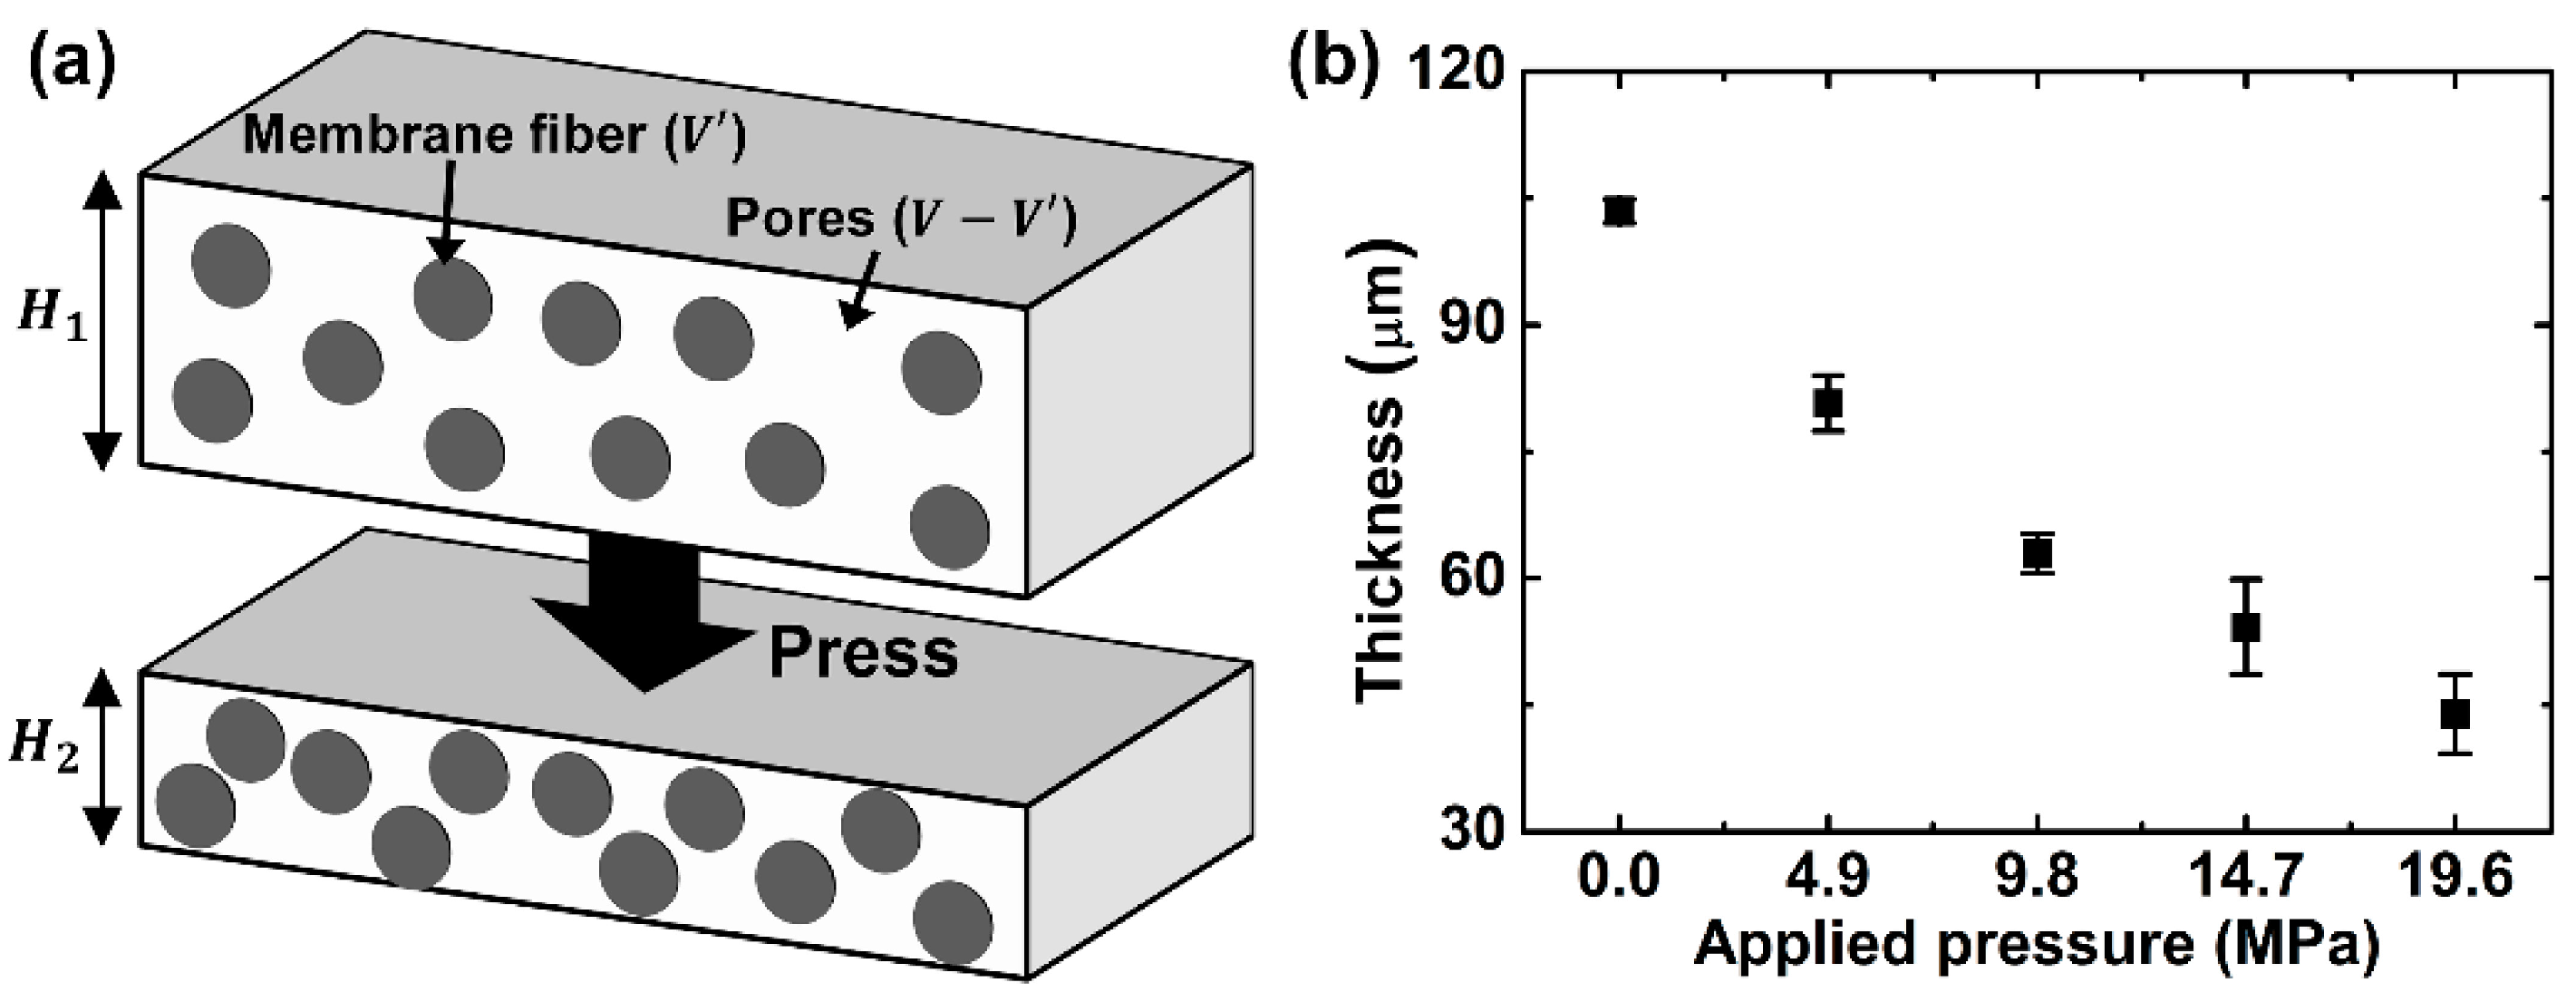
2.2. Thickness Measurement of Pressed Paper
2.3. Measurement of Decreased Flow Rate in Pressed Paper for Analyzing Decreased Permeability
2.4. Porosity Measurement of Unpressed Paper
2.5. Darcy’s Law
3. Results and Discussion
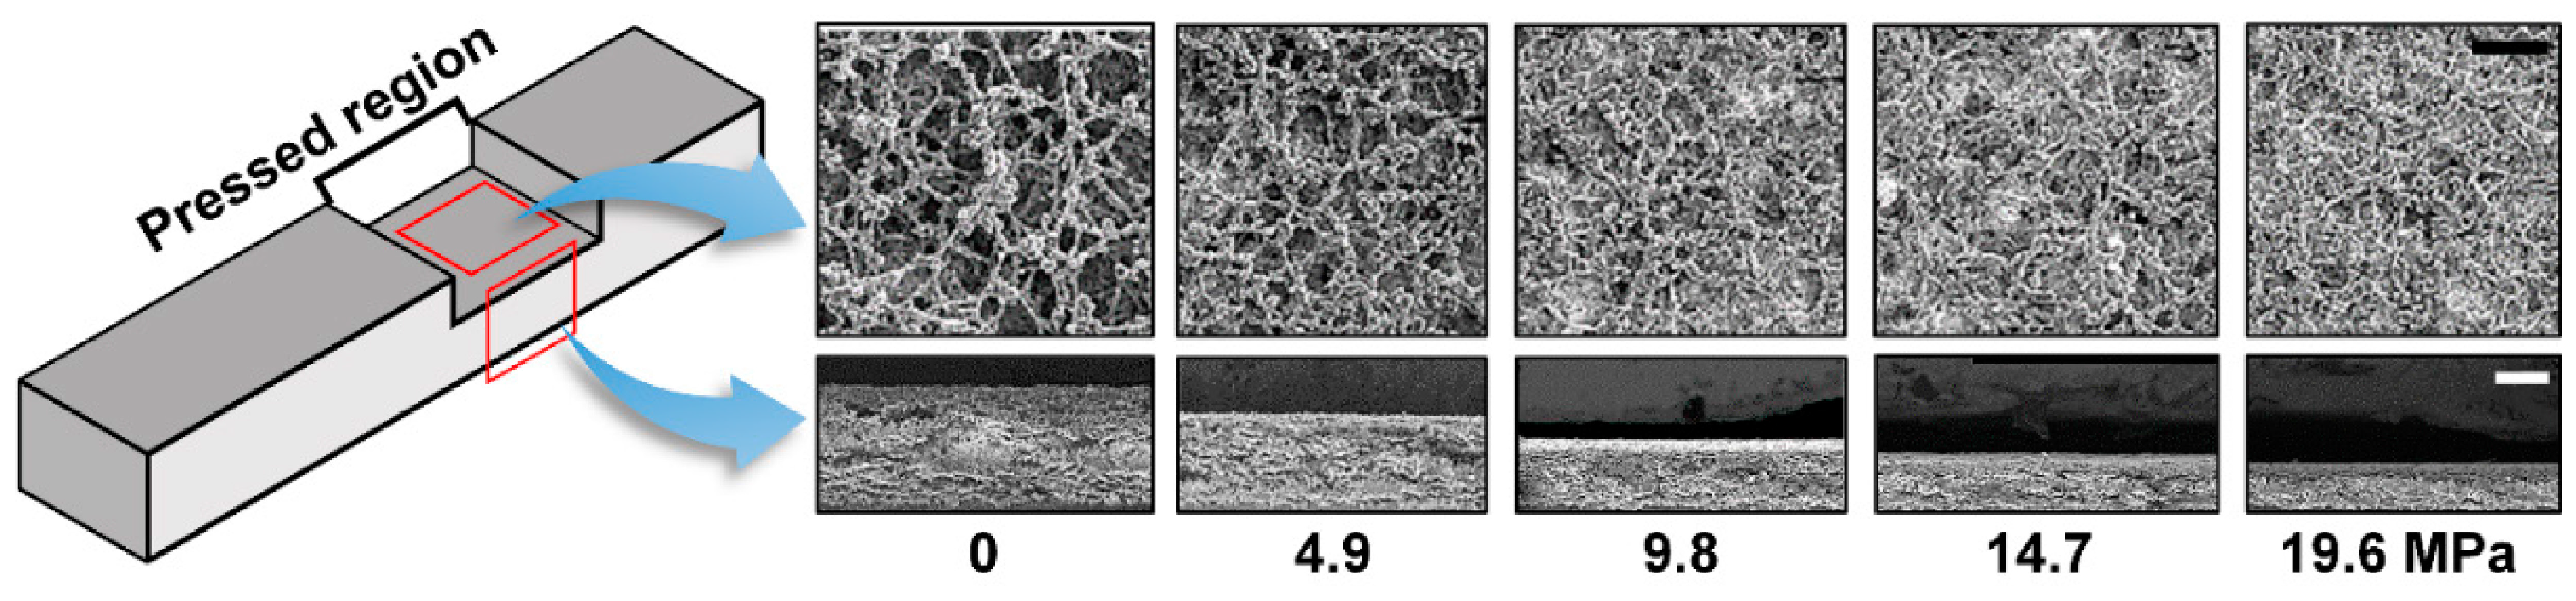
3.1. Pressed Paper
3.2. Porosity of Pressed Paper
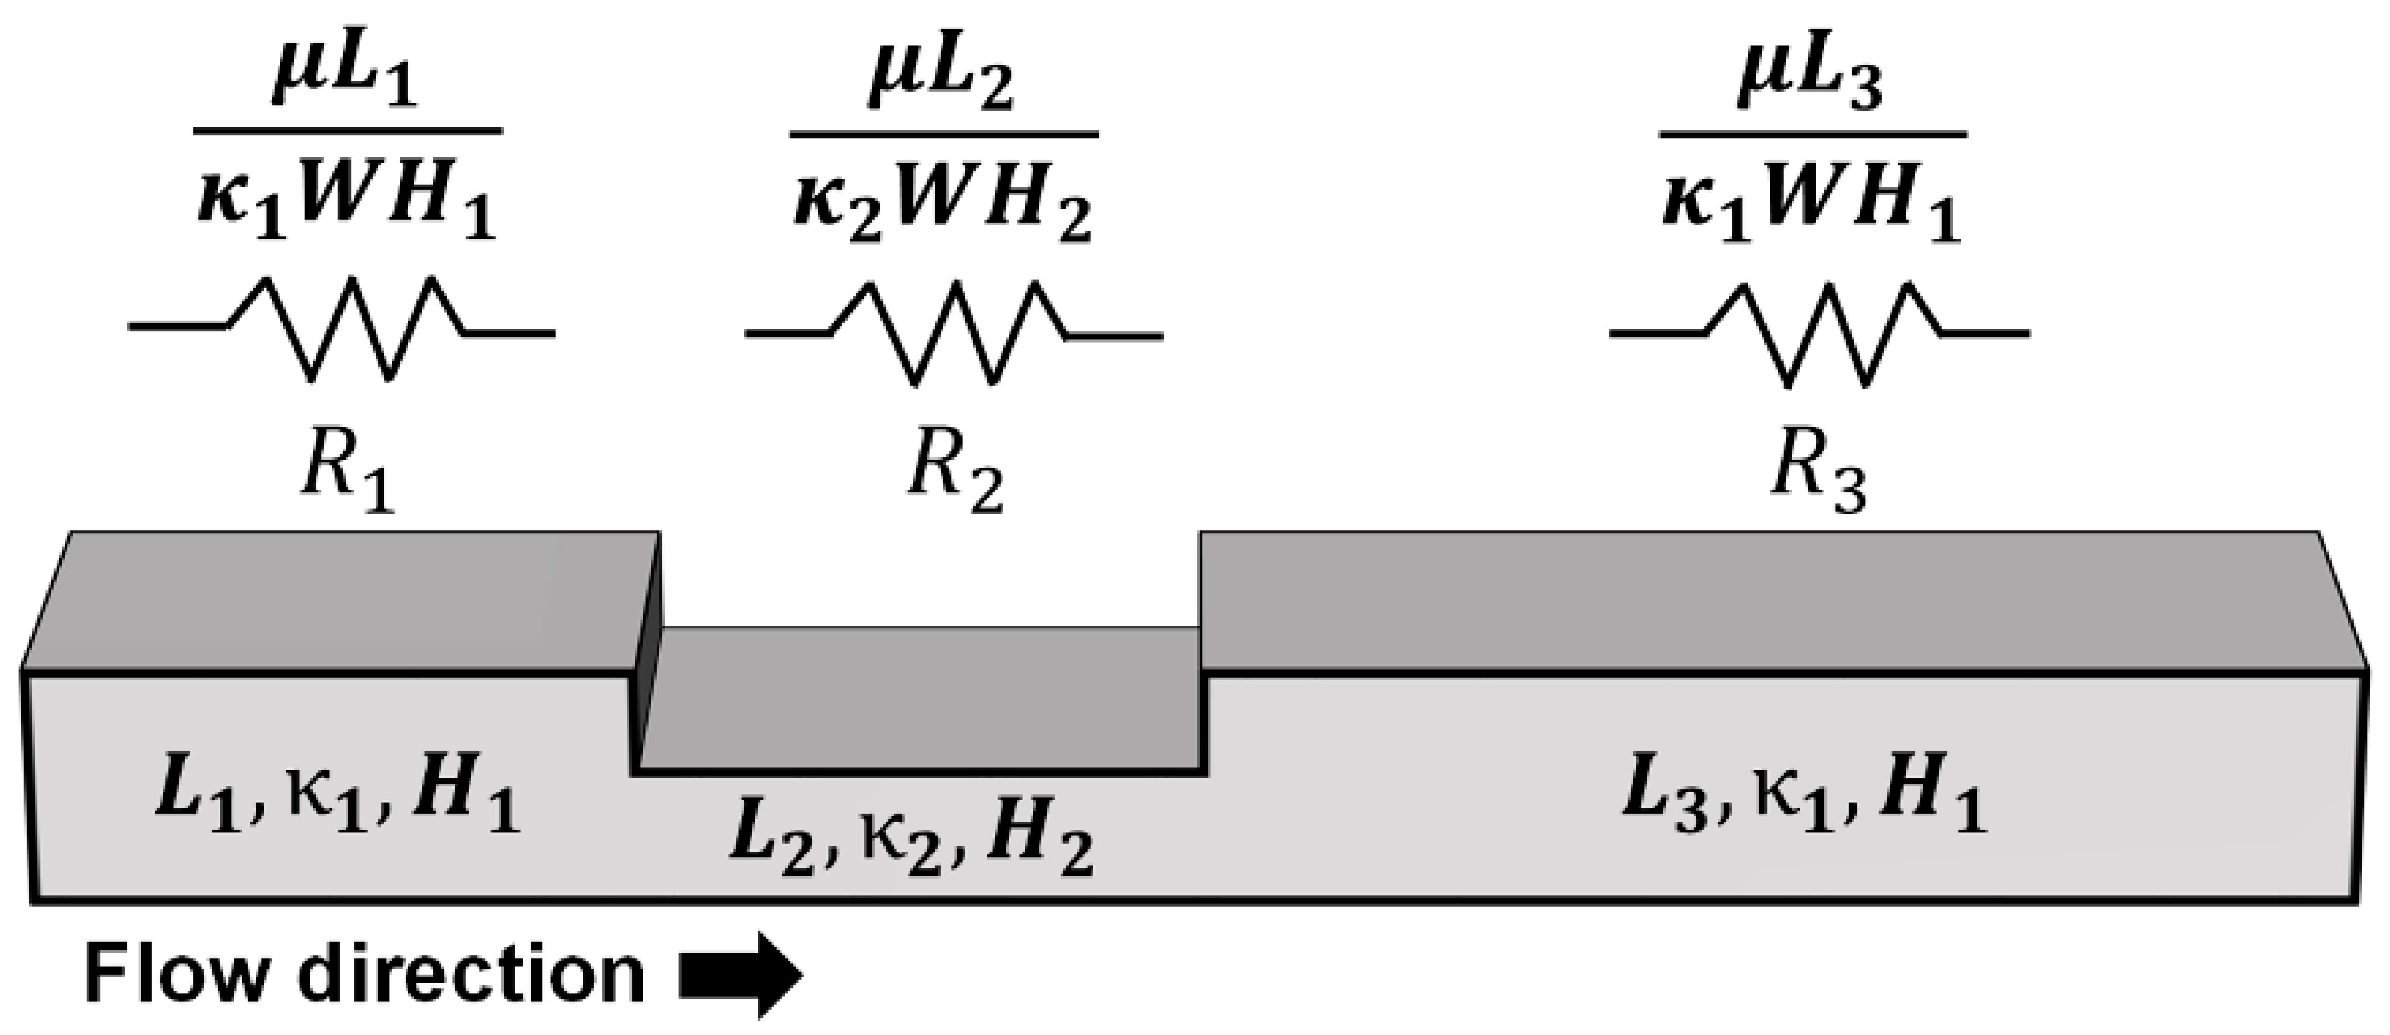
3.3. Flow Rate along Pressed Paper
3.4. Permeability of Pressed Paper
4. Conclusions
Acknowledgments
Author Contributions
Conflicts of Interest
References
- Cate, D.M.; Adkins, J.A.; Mettakoonpitak, J.; Henry, C.S. Recent developments in paper-based microfluidic devices. Anal. Chem. 2014, 87, 19–41. [Google Scholar] [CrossRef] [PubMed]
- Li, X.; Ballerini, D.R.; Shen, W. A perspective on paper-based microfluidics: Current status and future trends. Biomicrofluidics 2012, 6, 011301. [Google Scholar] [CrossRef] [PubMed]
- Mahadeva, S.K.; Walus, K.; Stoeber, B. Paper as a platform for sensing applications and other devices: A review. ACS Appl. Mater. Interfaces 2015, 7, 8345–8362. [Google Scholar] [CrossRef] [PubMed]
- Yetisen, A.K.; Akram, M.S.; Lowe, C.R. Paper-based microfluidic point-of-care diagnostic devices. Lab Chip 2013, 13, 2210–2251. [Google Scholar] [CrossRef] [PubMed]
- Carrilho, E.; Martinez, A.W.; Whitesides, G.M. Understanding wax printing: A simple micropatterning process for paper-based microfluidics. Anal. Chem. 2009, 81, 7091–7095. [Google Scholar] [CrossRef] [PubMed]
- Wang, J.; Monton, M.R.N.; Zhang, X.; Filipe, C.D.; Pelton, R.; Brennan, J.D. Hydrophobic sol–gel channel patterning strategies for paper-based microfluidics. Lab Chip 2014, 14, 691–695. [Google Scholar] [CrossRef] [PubMed]
- Martinez, A.W.; Phillips, S.T.; Butte, M.J.; Whitesides, G.M. Patterned paper as a platform for inexpensive, low-volume, portable bioassays. Angew. Chem. Int. Ed. 2007, 46, 1318–1320. [Google Scholar] [CrossRef] [PubMed]
- Asano, H.; Shiraishi, Y. Development of paper-based microfluidic analytical device for iron assay using photomask printed with 3D printer for fabrication of hydrophilic and hydrophobic zones on paper by photolithography. Anal. Chim. Acta 2015, 883, 55–60. [Google Scholar] [CrossRef] [PubMed]
- Gallibu, C.; Gallibu, C.; Avoundjian, A.; Gomez, F.A. Easily fabricated microfluidic devices using permanent marker inks for enzyme assays. Micromachines 2016, 7, 6. [Google Scholar] [CrossRef]
- Yu, J.H.; Jeong, S.-G.; Lee, C.-S.; Hwang, J.-Y.; Kang, K.-T.; Kang, H.; Lee, S.-H. Fabrication of a paper-based analytical device for multiple colorimetric analysis via inkjet-printing and paper-cutting. BioChip J. 2015, 9, 139–143. [Google Scholar] [CrossRef]
- Chen, H.; Cogswell, J.; Anagnostopoulos, C.; Faghri, M. A fluidic diode, valves, and a sequential-loading circuit fabricated on layered paper. Lab Chip 2012, 12, 2909–2913. [Google Scholar] [CrossRef] [PubMed]
- Fu, E.; Liang, T.; Spicar-Mihalic, P.; Houghtaling, J.; Ramachandran, S.; Yager, P. Two-dimensional paper network format that enables simple multistep assays for use in low-resource settings in the context of malaria antigen detection. Anal. Chem. 2012, 84, 4574–4579. [Google Scholar] [CrossRef] [PubMed]
- Osborn, J.L.; Lutz, B.; Fu, E.; Kauffman, P.; Stevens, D.Y.; Yager, P. Microfluidics without pumps: Reinventing the T-sensor and H-filter in paper networks. Lab Chip 2010, 10, 2659–2665. [Google Scholar] [CrossRef] [PubMed]
- B Lutz, B.; Liang, T.; Fu, E.; Ramachandran, S.; Kauffman, P.; Yager, P. Dissolvable fluidic time delays for programming multi-step assays in instrument-free paper diagnostics. Lab Chip 2013, 13, 2840–2847. [Google Scholar] [CrossRef] [PubMed]
- Noh, H.; Phillips, S.T. Fluidic timers for time-dependent, point-of-care assays on paper. Anal. Chem. 2010, 82, 8071–8078. [Google Scholar] [CrossRef] [PubMed]
- Shin, J.H.; Park, J.; Kim, S.H.; Park, J.-K. Programmed sample delivery on a pressed paper. Biomicrofluidics 2014, 8, 054121. [Google Scholar] [CrossRef] [PubMed]
- Vernhes, P.; Bloch, J.-F.; Blayo, A.; Pineaux, B. Effect of calendering on paper surface micro-structure: A multi-scale analysis. J. Mater. Process. Technol. 2009, 209, 5204–5210. [Google Scholar] [CrossRef]
- Vernhes, P.; Dubé, M.; Bloch, J.-F. Effect of calendering on paper surface properties. Appl. Surf. Sci. 2010, 256, 6923–6927. [Google Scholar] [CrossRef]
- Litvinov, V.; Farnood, R. Modeling of the compression of coated papers in a soft rolling nip. J. Mater. Sci. 2010, 45, 216–226. [Google Scholar] [CrossRef]
- Whitaker, S. Flow in porous media I: A theoretical derivation of Darcy's law. Transp. Porous Med. 1986, 1, 3–25. [Google Scholar] [CrossRef]
- Washburn, E.W. The dynamics of capillary flow. Phys. Rev. 1921, 17, 273. [Google Scholar] [CrossRef]
- Fu, E.; Ramsey, S.A.; Kauffman, P.; Lutz, B.; Yager, P. Transport in two-dimensional paper networks. Microfluid. Nanofluid. 2011, 10, 29–35. [Google Scholar] [CrossRef] [PubMed]
- Hong, S.; Kim, W. Dynamics of water imbibition through paper channels with wax boundaries. Microfluid. Nanofluid. 2015, 19, 845–853. [Google Scholar] [CrossRef]
- Mendez, S.; Fenton, E.M.; Gallegos, G.R.; Petsev, D.N.; Sibbett, S.S.; Stone, H.A.; Zhang, Y.; López, G.P. Imbibition in porous membranes of complex shape: Quasi-stationary flow in thin rectangular segments. Langmuir 2009, 26, 1380–1385. [Google Scholar] [CrossRef] [PubMed]
- Nabovati, A.; Llewellin, E.W.; Sousa, A.C. A general model for the permeability of fibrous porous media based on fluid flow simulations using the lattice Boltzmann method. Compos. A Appl. Sci. Manuf. 2009, 40, 860–869. [Google Scholar] [CrossRef]
- Costa, A. Permeability-porosity relationship: a reexamination of the Kozeny-Carman equation based on a fractal pore-space geometry assumption. Geophys. Res. Lett. 2006, 33, L02318. [Google Scholar] [CrossRef]
- Rasi, M. Permeability Properties of Paper Materials. Ph.D. Thesis, University of Jyväskylä, Jyväskylä, Finland, 17 December 2013. [Google Scholar]

© 2016 by the authors. Licensee MDPI, Basel, Switzerland. This article is an open access article distributed under the terms and conditions of the Creative Commons by Attribution (CC-BY) license ( http://creativecommons.org/licenses/by/4.0/).
Share and Cite
Park, J.; Shin, J.H.; Park, J.-K. Experimental Analysis of Porosity and Permeability in Pressed Paper. Micromachines 2016, 7, 48. https://doi.org/10.3390/mi7030048
Park J, Shin JH, Park J-K. Experimental Analysis of Porosity and Permeability in Pressed Paper. Micromachines. 2016; 7(3):48. https://doi.org/10.3390/mi7030048
Chicago/Turabian StylePark, Juhwan, Joong Ho Shin, and Je-Kyun Park. 2016. "Experimental Analysis of Porosity and Permeability in Pressed Paper" Micromachines 7, no. 3: 48. https://doi.org/10.3390/mi7030048