1. Introduction
Nowadays microfluidic devices for handling fluids are widespread and the potential application of micromixers is increasing every day in many scientific and industrial contexts. The diminutive scale of the flow channels in microfluidic systems increases the surface to volume ratio and is, therefore, advantageous in many applications. Microfluidic technology provides the possibility of replacing large conventional laboratory equipment, reducing costs, decreasing consumption, making the analysis faster and increasing safety and reliability [
1]. These characteristics explain the exponential increase of research on micromixers in various fields. In particular, food industry and all biological and chemical processes which require a mixing of samples and reactants, such as enzyme reactions and protein folding [
2], or, similarly, processes for environment monitoring, such as detection of groundwater contamination [
3], could benefit from these devices.
In principle, the mixing of two or more different fluids depends on convection and diffusion. Mixing within microfluidic devices, typically operating at Reynolds numbers smaller than 100, is heavily dependent on molecular diffusion [
4], which is a very slow process [
5]. Accordingly, in absence of any transverse convection, complete mixing of two fluids conveyed in a simple channel, as in a T-mixer, normally needs a long time and long channel length [
6]. To decrease the mixing length and the mixing time different strategies have been developed, whereby micromixers can be classified into two broad categories: active and passive [
6,
7,
8,
9]. Active mixers employ an external force to enhance the mixing of fluid samples such as periodic variation of pumping, electrokinetic instability, acoustically induced vibration, electrowetting induced merging of droplets, magneto-hydrodynamic action, small impellers, piezoelectrically vibrating membrane or integrated micro valves and pumps [
10,
11,
12,
13]. However, the application of these kinds of devices is limited because of complex and expensive fabrication process, energy consumption, heat generation, and non-compatibility with biological or delicate samples. In contrast, passive mixers use the flow energy to create multi-lamellae structures, which are stretched and recombined to promote mixing by diffusion [
14]. In particular, the mechanisms of fluid parallel lamination, focusing, chaotic advection, intersecting channels, convergent-divergent channels, and split-and-recombine are used [
15,
16].
Static mixers have been intensively studied in the last two decades not only because of their excellent performance in the field of mixing and two-phase dispersion but also because of their ability to redesign a discontinuous process into a continuous one [
17]. The split-and-recombine (SAR) principle is one of the most studied mechanisms introduced in static mixers because of its interesting characteristics. At low Reynolds numbers (Re < 50), SAR mixers provide laminar flow and mixing is predominantly due to lamination of multiple streams in both horizontal and vertical directions. As the Reynolds numbers increase, vortexes build up inside the channels, which ultimately yield chaotic mixing [
17].
Good mixing performance and low pressure loss are two important design factors of any mixer. Low pressure drop is very crucial for industrial production because it reduces the energy requirements. Good mixing efficiency is particularly important for fast complex chemical reactions where the reaction yields are strongly affected by mixing quality [
1]. Degree of mixing can be achieved directly including experimentally [
4] and numerically [
18]; indirect methods include Poincare section analysis [
19] and residence time distribution (RTD) evaluation [
20].
It is evident from the literature that the majority of micromixers operate optimally at either high (Re ≥ 100) or low (Re ≤ 20) Reynolds numbers; in particular, micromixers based on the SAR principle offer better mixing efficiency over other types of passive micromixers at low Reynolds numbers, even if they show high-pressure drop due to their complex three dimensional structure [
21]. Developing smart and simple geometries that ensure good performance over the widest possible range of Reynolds numbers, with acceptable pressure drop, is the current focus. In this paper, two new passive SAR based micromixers, the Y-Y and the H-C mixers, are designed and investigated along with a well-known Tear-drop mixer. The basic idea and design of a Tear-drop mixer was presented in [
22]; a slightly modified version of the Tear-drop micromixer consisting of plate symmetrical modules was constructed and presented in [
23]. Currently, it is a commercial product, which gives good mixing efficiency over a range of Reynolds numbers from 1 to 100, where more than twenty elements are used.
In this study a comparative analysis among the three micromixers, made up of four elements, is presented. Experimental tests and numerical simulations are conducted to find out mixing efficiency and pressure drop at Reynolds numbers up to 100.
2. Experimental Investigation
2.1. Geometry
Figure 1,
Figure 2 and
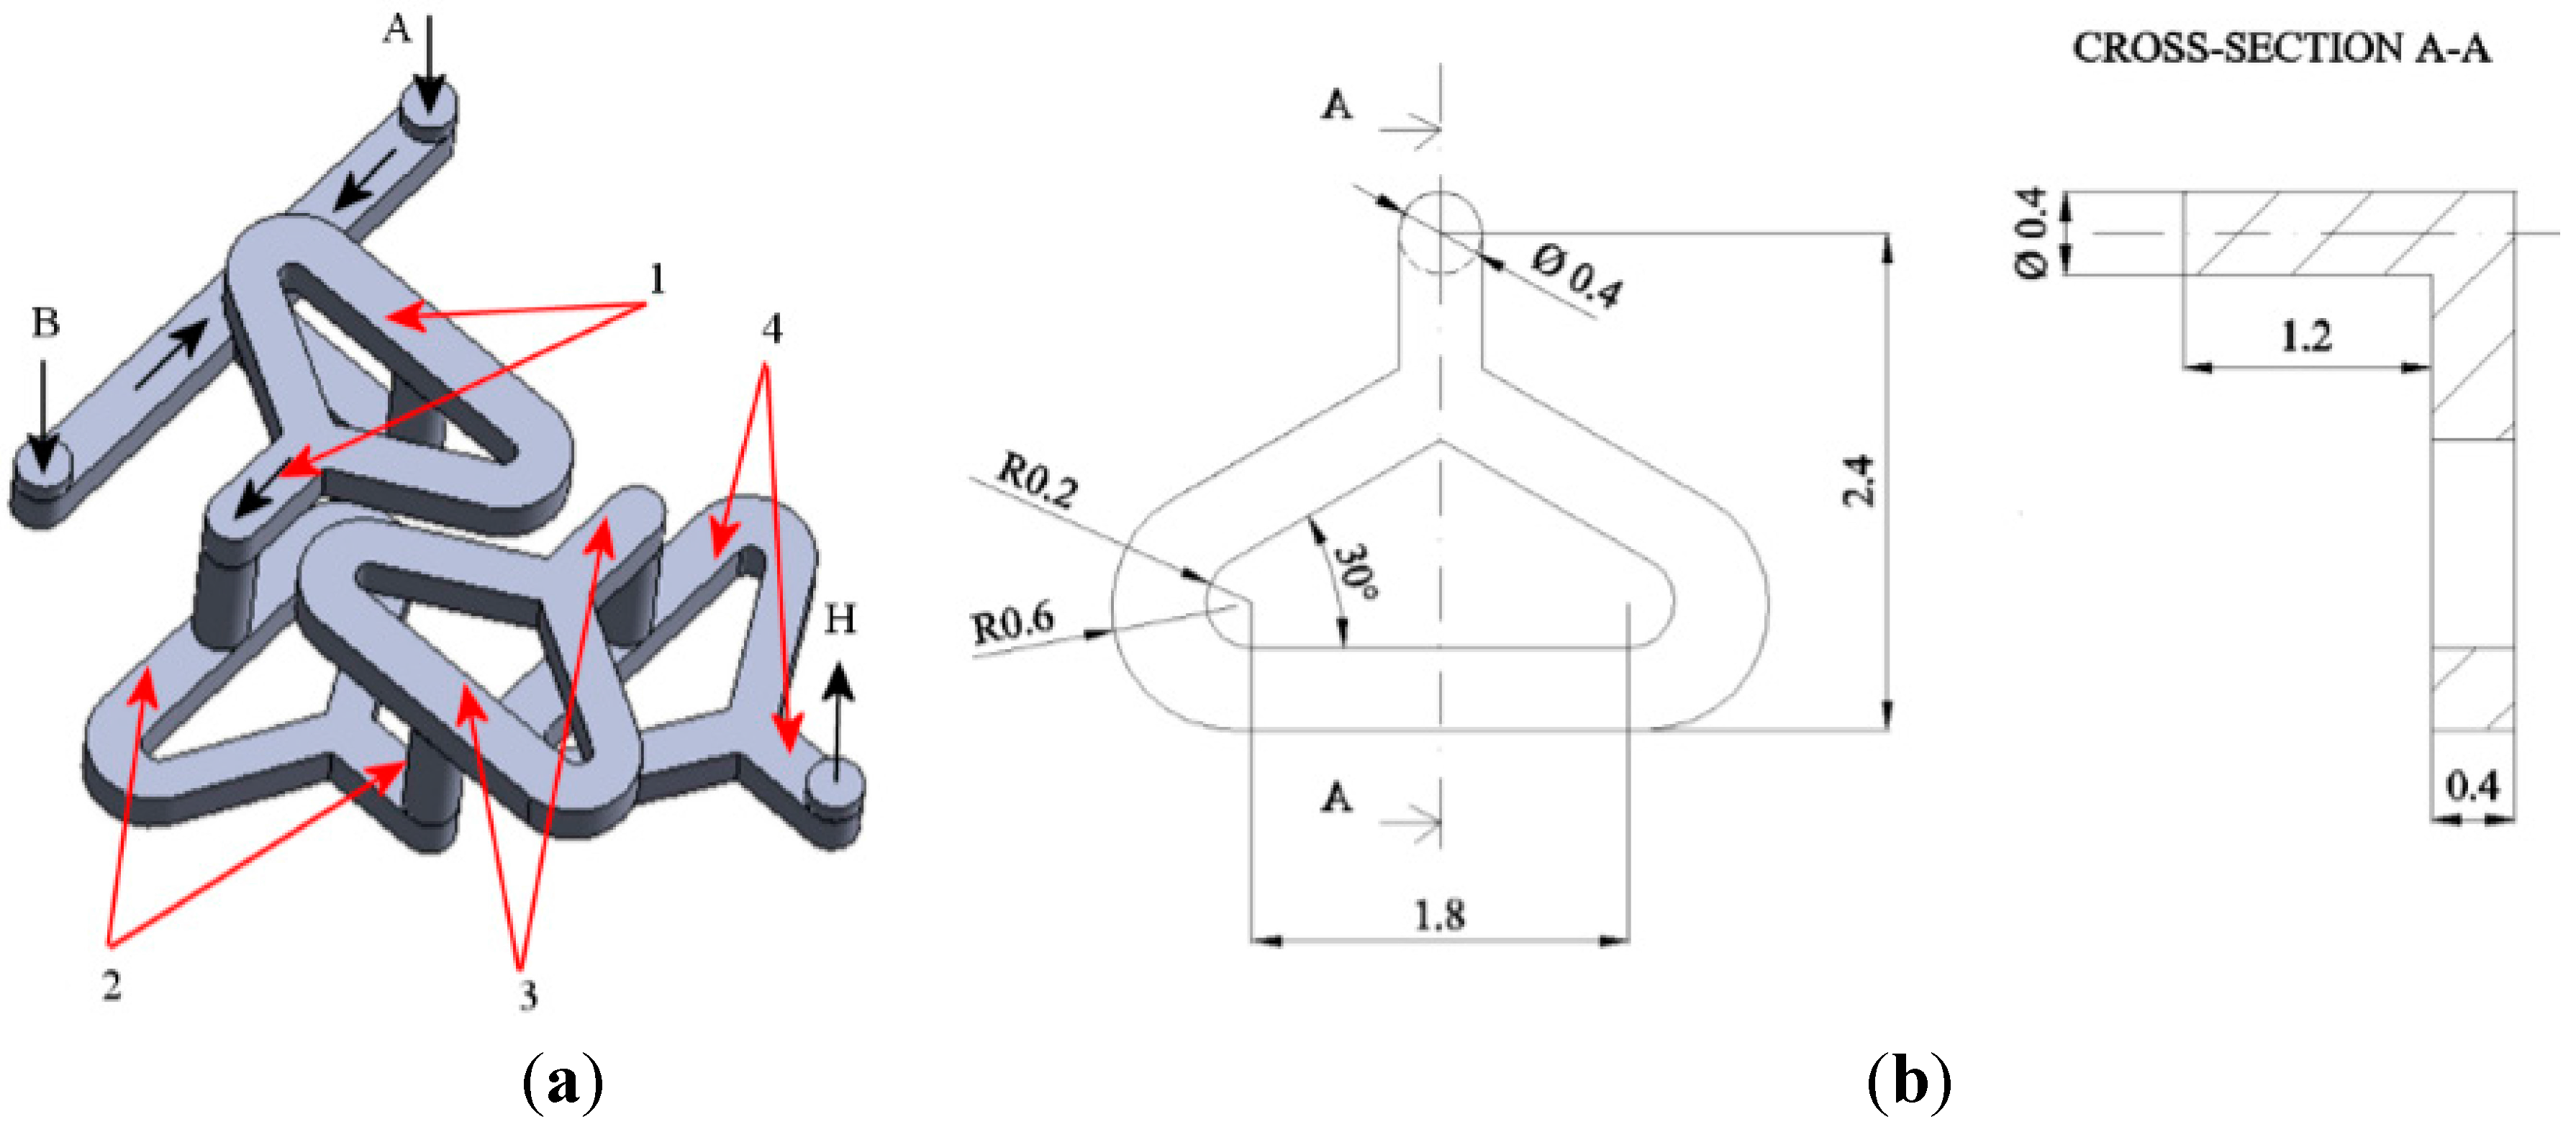
Figure 3 show the fluid volume of the Tear-drop, the Y-Y and the H-C micromixers respectively, with some important dimensions. Each mixer is made up by four identical elements, denoted as 1, 2, 3, and 4, connected in series; the basic element of each mixer has a specific geometry. The sequence has the aim to produce repeated folding and layering of the fluids, to reduce diffusion distance and thereby mixing time. Two individual species enter via inlet A and inlet B (cylindrical ducts: diameter Φ = 0.4 mm for the Y-Y and the Tear-drop mixers; diameter Φ = 0.6 mm for the H-C mixer) the mixer and flow through its elements, until they exit via outlet H.
As shown in
Figure 1, the mixing channel of the well-known Tear-drop mixer is 0.4 mm deep and 0.4 mm wide.
As shown in
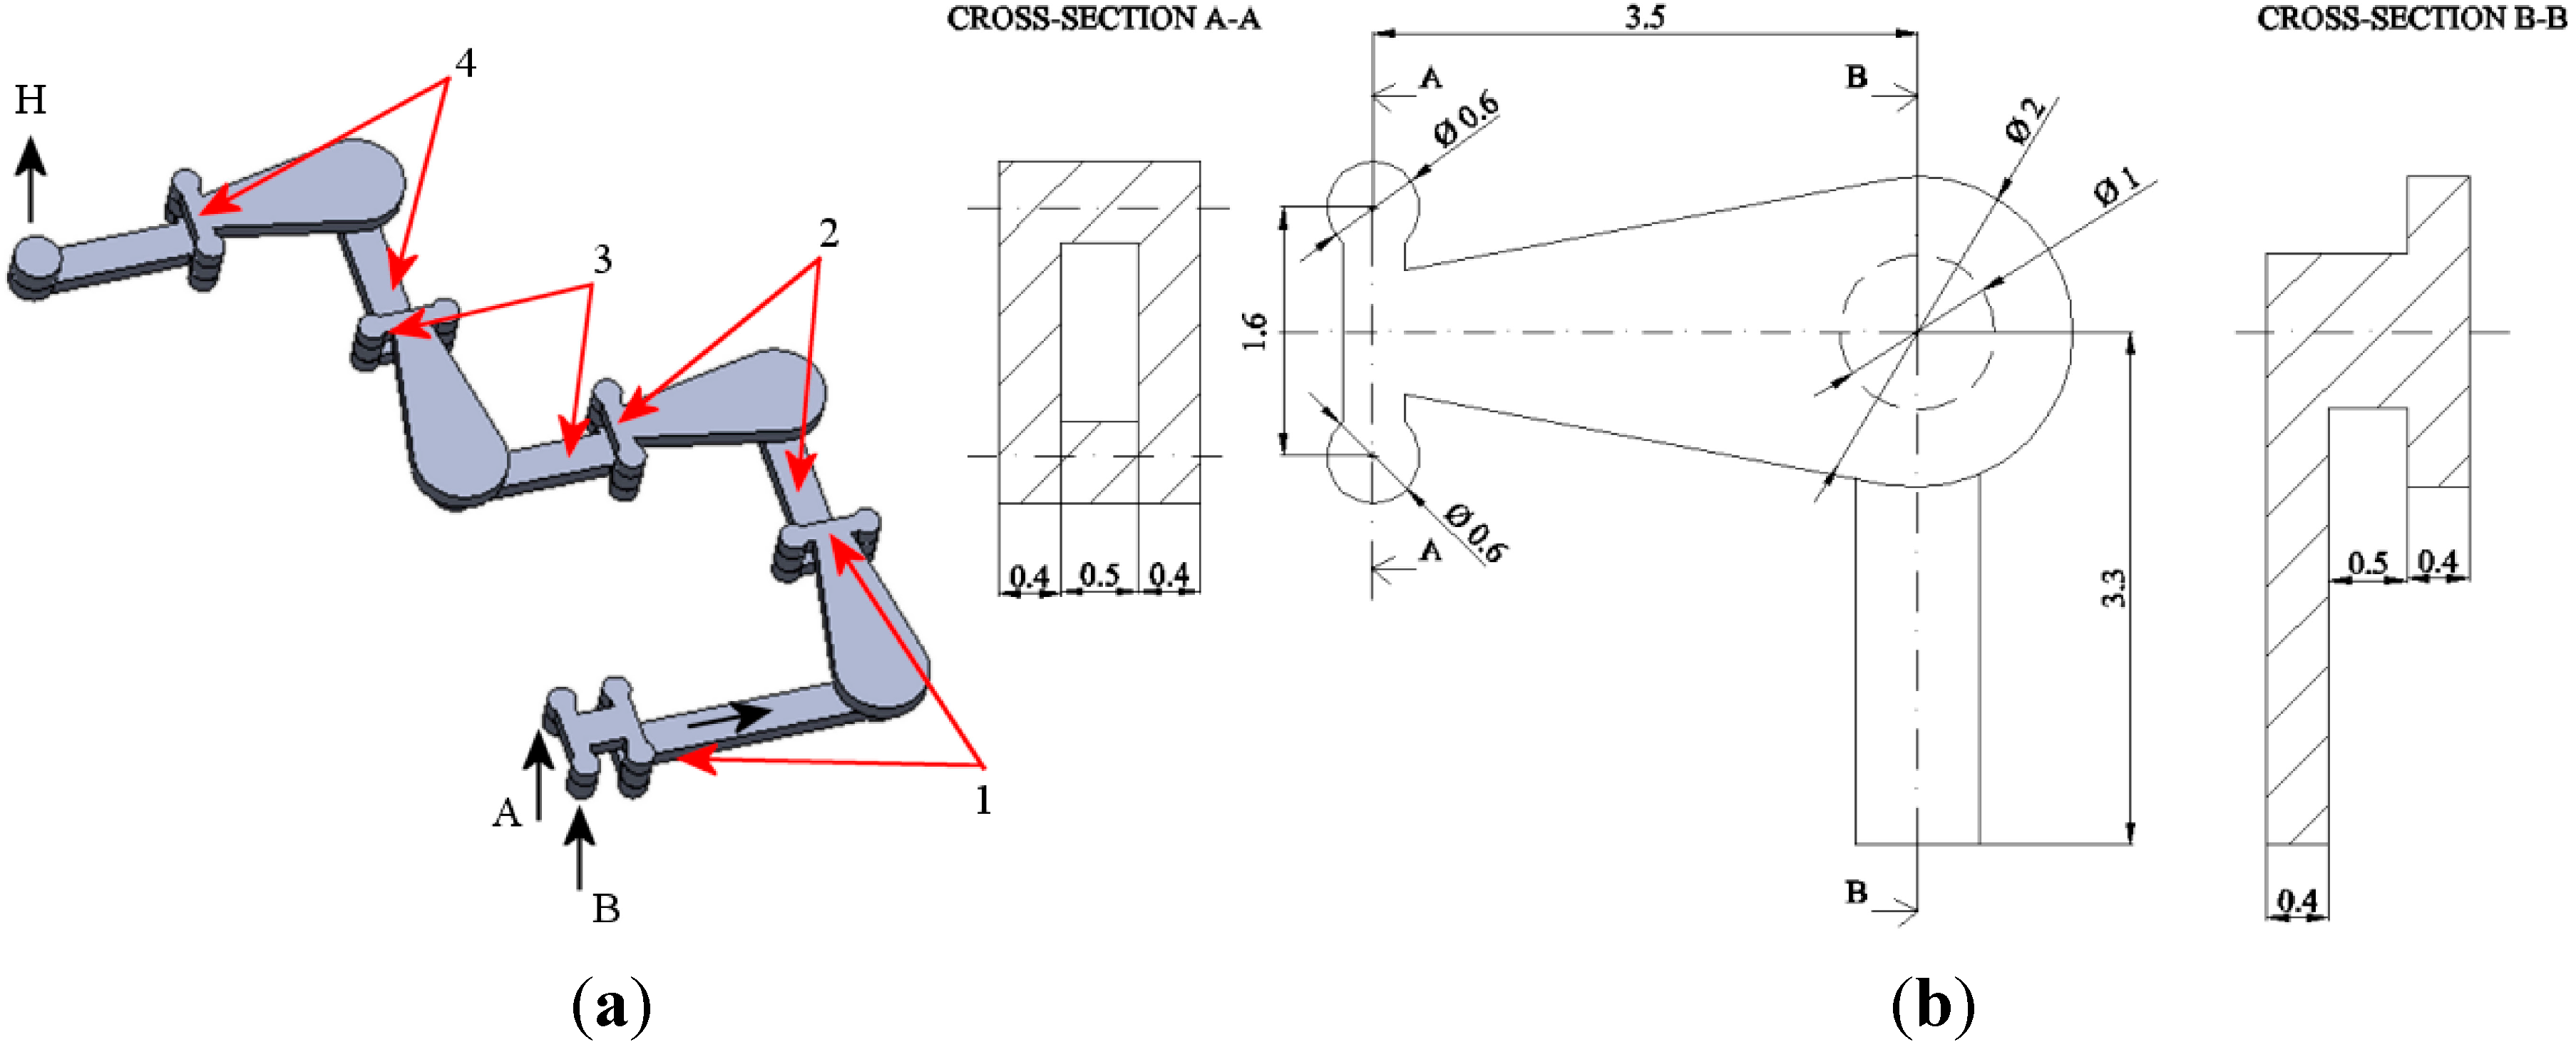
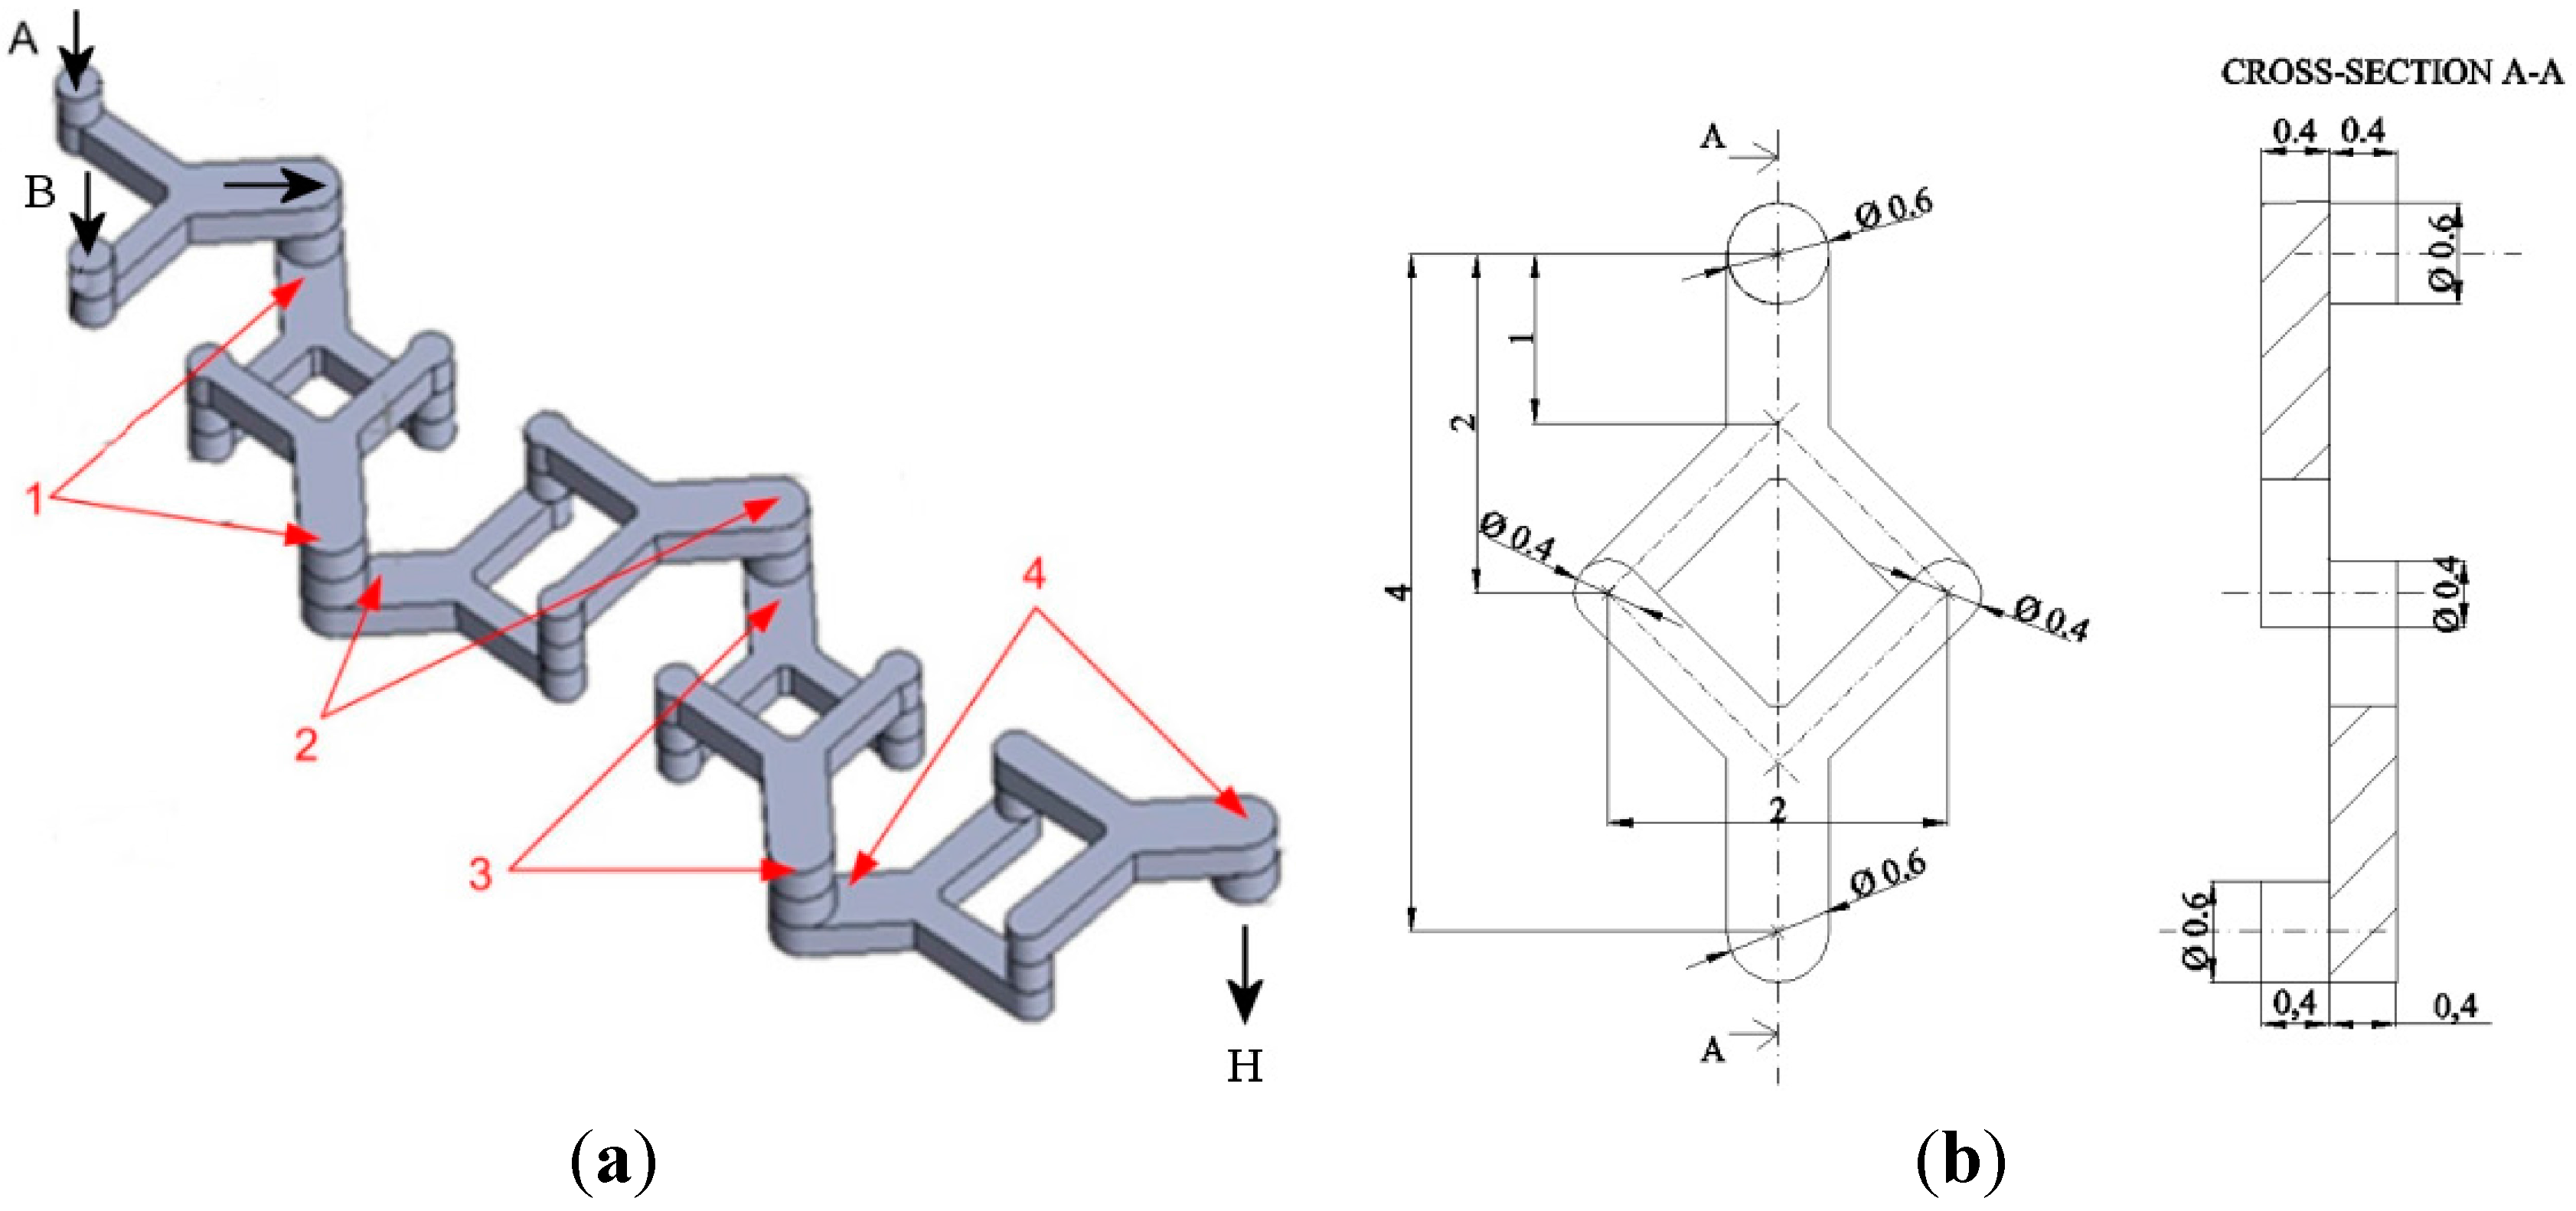
Figure 2, each element of the Y-Y mixer is made up of two Y channels laying over parallel planes connected by vertical ducts; the width of the mixing channel varies from 0.4 to 0.6 mm, while the depth is 0.4 mm. The H-C micromixer, shown in
Figure 3, was designed on the fundamental knowledge of Chain mixer [
24] and H mixer [
25]. In fact, each element is made up by a Chain segment and a H-shape segment. Aim of the Chain segment is to make 90° rotation of flow, folding the stream and then splitting and recombining it to enhance the mixing; on the other hand, the H-shape segment makes it possible to move part of the flow, which is initially at the central zone of the channel, close to the walls and vice versa. Thus, both the Chain and the H-shape modules contribute to improve mixing efficiency. The width of the mixing channel varies from 2 to 0.4 mm, while its depth is 0.4 mm.
The geometries of the three mixers were micromilled in polycarbonate by a computer numerical control (CNC) Milling and Engraving Machine P20S (KUHLMANN, Bad Lauterberg/Harz, Germany) at I.T.D. s.a.s. di Borgna Daniela e Borgna Eugenio & C. (Turin, Italy). The prototypes were made up by overlapping and then clamping a central lamina and two covers, one of them provided by two entrances and one exit port. The dimensions of prototypes were verified by a profilometer and a maximum error of 1% was found. On the Y-Y mixer, the axis of the ducts connecting parallel millings were found to be not well perpendicular to the millings themselves; in this case, only a visual inspection was possible and no quantitative measurements were carried out.
Figure 1.
Geometry of the Tear-drop micromixer (dimensions in mm): (a) three-dimensional view; (b) top view of one element and cross-section.
Figure 1.
Geometry of the Tear-drop micromixer (dimensions in mm): (a) three-dimensional view; (b) top view of one element and cross-section.
Figure 2.
Geometry of the Y-Y micromixer (dimensions in mm): (a) three-dimensional view; (b) top view of one element and cross-section.
Figure 2.
Geometry of the Y-Y micromixer (dimensions in mm): (a) three-dimensional view; (b) top view of one element and cross-section.
Figure 3.
Geometry of the H-C micromixer (dimensions in mm): (a) three-dimensional view; (b) top view of one element and cross-sections.
Figure 3.
Geometry of the H-C micromixer (dimensions in mm): (a) three-dimensional view; (b) top view of one element and cross-sections.
2.2. Experimental Setup and Measurements
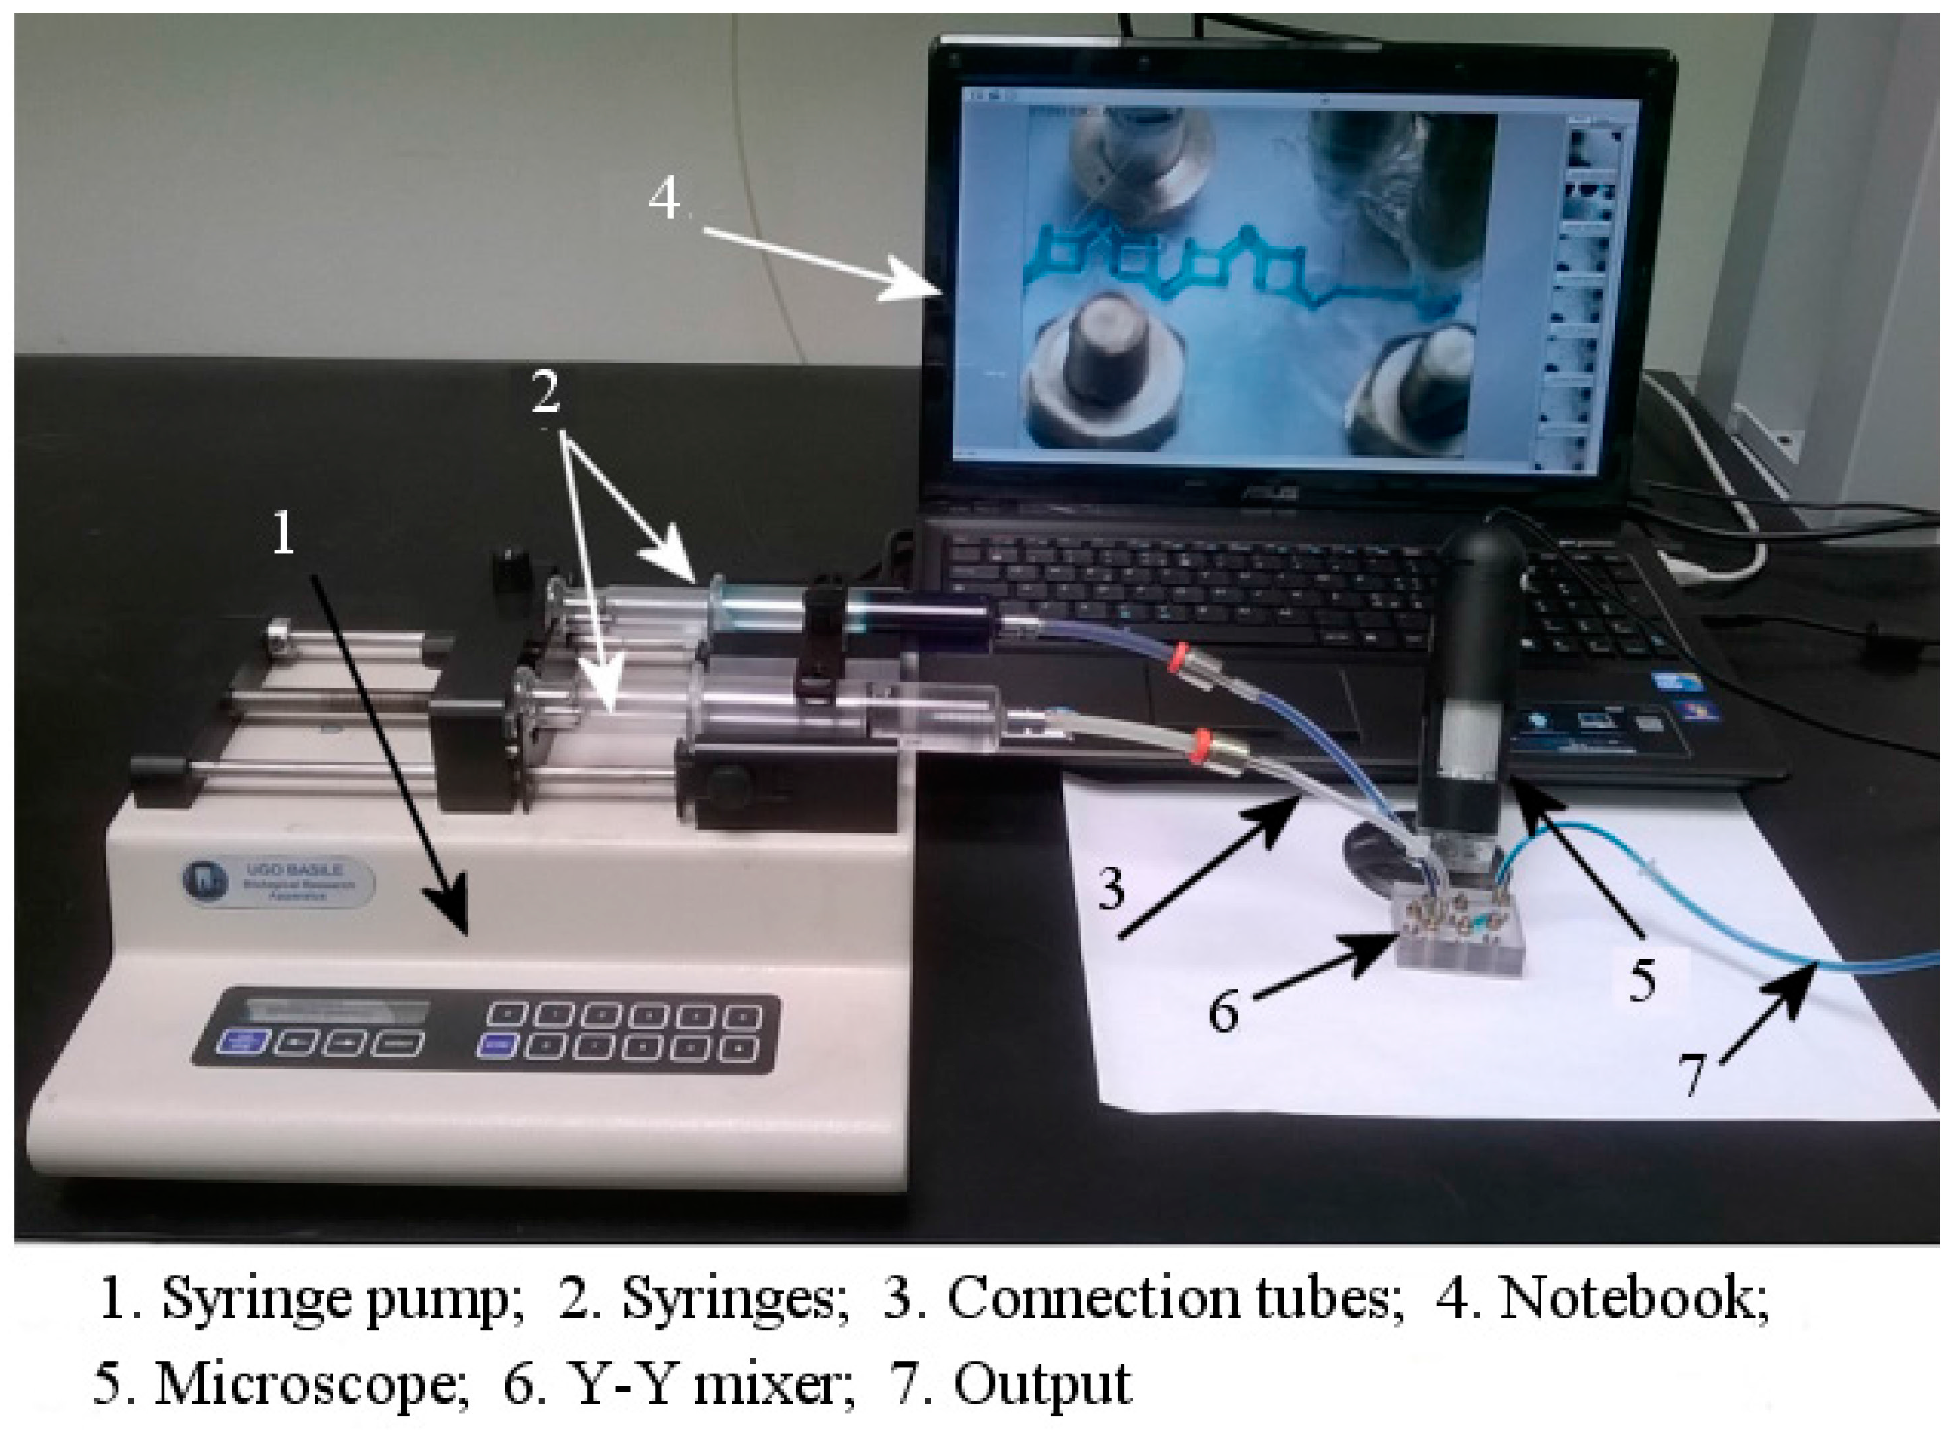
The experimental setup used for investigation is shown in
Figure 4.
Figure 5 shows an image of the prototypes of the three micromixers after filling with fluids, during an experiment at Reynolds numbers Re = 1. Commercial liquid food dye (Rebecchi F.lli Valtrebbia, Rivergaro, Italy) was used for tests and it was assumed to have properties identical to those of water. Before experiments, equipment was always cleaned and dried. All tests were performed at room temperature (25 °C).
Figure 4.
Experimental setup.
Figure 4.
Experimental setup.
Figure 5.
Micromixers after filling with fluids at Re = 1.
Figure 5.
Micromixers after filling with fluids at Re = 1.
At first, a calibration was carried out at four target areas, close to the exit of each element (denoted as C, D, E, and F in
Figure 5); this way, problems related to dissimilarities in lighting could be overcome. The micromixer was filled, using a syringe, by a mixture of blue dye and water at known concentrations, from 0 up to 100%. Images of the bottom side of the prototype were captured by a high-speed image-acquainting microscope (Veho model VMS-004D-400x USB, two Megapixel Cmos lens (interpolated)) and then converted into grey-scale images. Using a first custom made Matlab code, an average value of the grey intensity distribution inside each image of the target area was picked up. This way it was possible to find a linear relationship between the mixture concentration value and each grey intensity.
Then, two programmable syringe pumps (KDS 210 series, KD Scientific, errors less than 1%, according to the catalogue) were used to individually supply the inlet ports A and B of the micromixer with water and a blue food dye respectively, at the same flow-rate. Reynolds numbers Re were calculated from the set values of flow-rate by using the following formula:
where ρ is the fluid density; µ is the fluid dynamic viscosity;
v is the fluid velocity, evaluated at the rectangular channel after the inlets, where the fluids meet each other at the first time, and
d is the characteristic length of the channel, put equal to the depth of rectangular channel (0.4 mm), as it is the smallest dimension of the channel.
Going from calibration to experiments, the operating conditions, such as prototype position and lighting, were kept the same.
For each flow-rate value, an image of the bottom side of the prototype, to include all the fluid path, was captured; tests were carried out over Reynolds numbers ranging from 1 to 100. Colored images were then converted in grey-scale and post-processed by a second custom made Matlab code.
From each main image, four cropped images of the fluid at the four target areas were taken. The grey level distribution associated at each pixel of the image was then converted into a concentration distribution, by means of the previously obtained calibration curve. Finally, the standard deviation of mass fraction of blue dye at each image of the target area was worked out, as an index of homogeneity of the mixture.
The same procedure was repeated for all the mixers under study.
Finally, pressure drop between the inputs and the output of the microchannel was measured using a digital differential manometer (Digibar, HBM GmbH, Darmstadt, Germany; measuring range = 0 to 500 mbar, sensitivity = 0.5 mbar).
4. Numerical Investigation
The commercial CFD software Ansys Fluent 15 (Canonsburg, PA, USA) was employed to numerically determine mixing efficiency and pressure drop of all three micromixers.
The flow was assumed to be steady state, laminar, Newtonian and incompressible; therefore, ignoring the body force and gravity, governing equations are the continuity equation, Navier–Stokes equation and species convection-diffusion equation, given respectively by:
where
is the fluid velocity vector, ρ is the fluid density,
P is the pressure, µ is the fluid dynamic viscosity,
C is the species mass concentration and
D is the diffusion coefficient of the species.
The fluids were assumed to have a dynamic viscosity of 1.003 × 10⁻³ kg/(m·s), a density of 998.2 kg/m3 and a diffusion coefficient of 10−9 m2/s, which is a typical value for an aqueous solution at room temperature. Both entrances were set to “velocity inlets”; the exit port was set to “pressure outlet”, with a gauge pressure of 0 Pa. At all walls a no-slip boundary condition was applied.
To get a general qualitative idea of fluid blending, preliminary simulations were carried out without activating the species transport model, so to obtain an overall distribution of fluid particles for the three mixers. Then, mixing of liquids was simulated; to obtain more accurate results, the second order upwind scheme for momentum and pressure was employed.
Numerical results were processed to work out the standard deviation σ of mass fraction of blue dye at a cross-section close to the exit of each element of the mixer. To this aim, Equation (2) was used, where, in this case, N is the number of sample cells in the cross section; Ci is the mass fraction of blue dye at a sample cell i; Cm is mean mass fraction of blue dye detected at the cross section.
Tetrahedral cells of almost equal volume were used to discretize the computational domain. A grid sensitivity test was performed for the mixing efficiency to determine the optimum number of grid points for each micromixer. Grid systems with 2.5 × 10⁵, 3 × 10⁵, and 5 × 10⁵ nodes were found to be optimal for the Tear-drop, the Y-Y, and the H-C mixers, respectively.
5. Results and Discussion
The purpose of this study is to make a comparative analysis among two novel micromixers, the Y-Y and the H-C ones, and a well-known micromixer, the Tear-drop one. The analysis was carried out numerically and experimentally keeping constant flow-rate and comparing mixing ability after the same number of elements. Pressure drop was also evaluated. The micromixer that, at a certain flow rate, is able to give a mixing efficiency equal or even better than that of another, requiring, at the same time, less energy to be actuated (its pressure drop is the lowest), can be considered the mixer with the best geometry.
Firstly, in order to examine the flow pattern inside the channel, preliminary simulations were carried out without molecular diffusion. The analysis of path lines distribution, in fact, permits qualitative forecasting of mixing quality: the more segregated are the path lines, the larger the interfacial area between the fluids to be mixed will be and the mixing performance will be better.
Figure 6 shows the path lines distribution at the exit of the three mixers in case of Reynolds numbers Re = 1, 50 and 100, as displayed by the Ansys CFD-post software. In case of the Tear-drop mixer, the segregation of path lines is satisfactory, except at Re = 50, where clusters of path lines of the same fluid can be detected. On the other hand, the Y-Y and the H-C mixers show well segregated path lines at all Reynolds numbers. Therefore, the Y-Y and the H-C micromixers are expected to have a better mixing ability than the Tear-drop one, at the mid-range of Reynolds numbers. Back-turning of some of the path lines at Re > 50 is due to the fact that, increasing flow-rate, the flow no longer follows the channel geometry precisely and some swirling effects occur; in any case, the path lines exit the mixer.
Secondly, mixing efficiency of the Tear-drop, the Y-Y, and the H-C mixers was evaluated experimentally and numerically at a range of Reynolds numbers from 1 to 100. It should be remarked that, since the exact composition of the commercial liquid food dye used for experiments was unknown, the value assigned at the diffusion coefficient during simulations (
D = 1 × 10
−9 m
2/s) was not completely accurate. Nevertheless, simulations were repeated at Re = 1, 30, 100 using a diffusion coefficient one order of magnitude lower than the previous one (
D = 1 × 10
−10 m
2/s) and no significant variation between results was found; in particular, the variation was lower than 4%.
Figure 7 shows the concentration distribution of fluids along the length of the Tear-drop, the Y-Y, and the H-C mixers in both experimental and numerical simulation. As seen, a real reasonable agreement between simulation and experimental results may truly be reported. However, there are still apparent differences in some sections. The main reason lies in the fact that simulation images show horizontal mid-plane. Therefore, it was not possible to take into consideration the multiple laminations of fluid layers. By contrast, the experimental images cover the whole depth of the channel viewable from above.
Figure 6.
Path lines at the exit of the micromixers at different Reynolds numbers.
Figure 6.
Path lines at the exit of the micromixers at different Reynolds numbers.
Figure 7.
Comparison between the images of the Tear-drop, the Y-Y, and the H-C mixers taken from computer simulation and experiments.
Figure 7.
Comparison between the images of the Tear-drop, the Y-Y, and the H-C mixers taken from computer simulation and experiments.
Figure 8 compares the mixing efficiency of the Tear-drop, the Y-Y, and the H-C mixers after four elements; as shown, experimental and numerical data have the same trend. It is also clear, experimental and numerical mixing efficiency curves show reasonable agreement; in fact, a maximum relative error of 0.1% between experimental and numerical values was obtained for the Y-Y and the H-C mixers. In the case of the Tear-drop mixer, the relative error is definitely higher; this can be explained considering some limitation of the experimental tests. In general, since fluid streams appeared as transparent layers, it was challenging to discern between well mixed regions and overlapping fluids. Furthermore, in the case of the Tear-drop mixer, channels belonging to different elements looked overlapped in a top or bottom view (see
Figure 7), making the experimental analysis particularly difficult.
Figure 8 highlights that the efficiency of the Y-Y and the H-C mixers does not depend on Reynolds numbers, contrary to that of the Tear-drop mixer, which is reduced at the middle range of Reynolds numbers (10 ≤ Re ≤ 40) to less than 85% (numerical results). A decrease of efficiency at the mid-range of Reynolds numbers can be explained considering that, increasing the flow velocity, there is a shorter residence time for the fluid particles to diffuse. Nevertheless, since at the mid-range of Reynolds numbers swirling effects start to be introduced [
27], if these effects are accentuated by the geometry of the micromixer, then fluid path lengthening can compensate for residence time reduction. This is, in our opinion, the case of the Y-Y and the H-C mixers. In particular, it can be noted that the two novel mixers provide a double 90° change of direction before splitting the flow, which promotes the swirling effect; conversely, the Tear-drop mixer splits the flow after only one 90° change of direction.
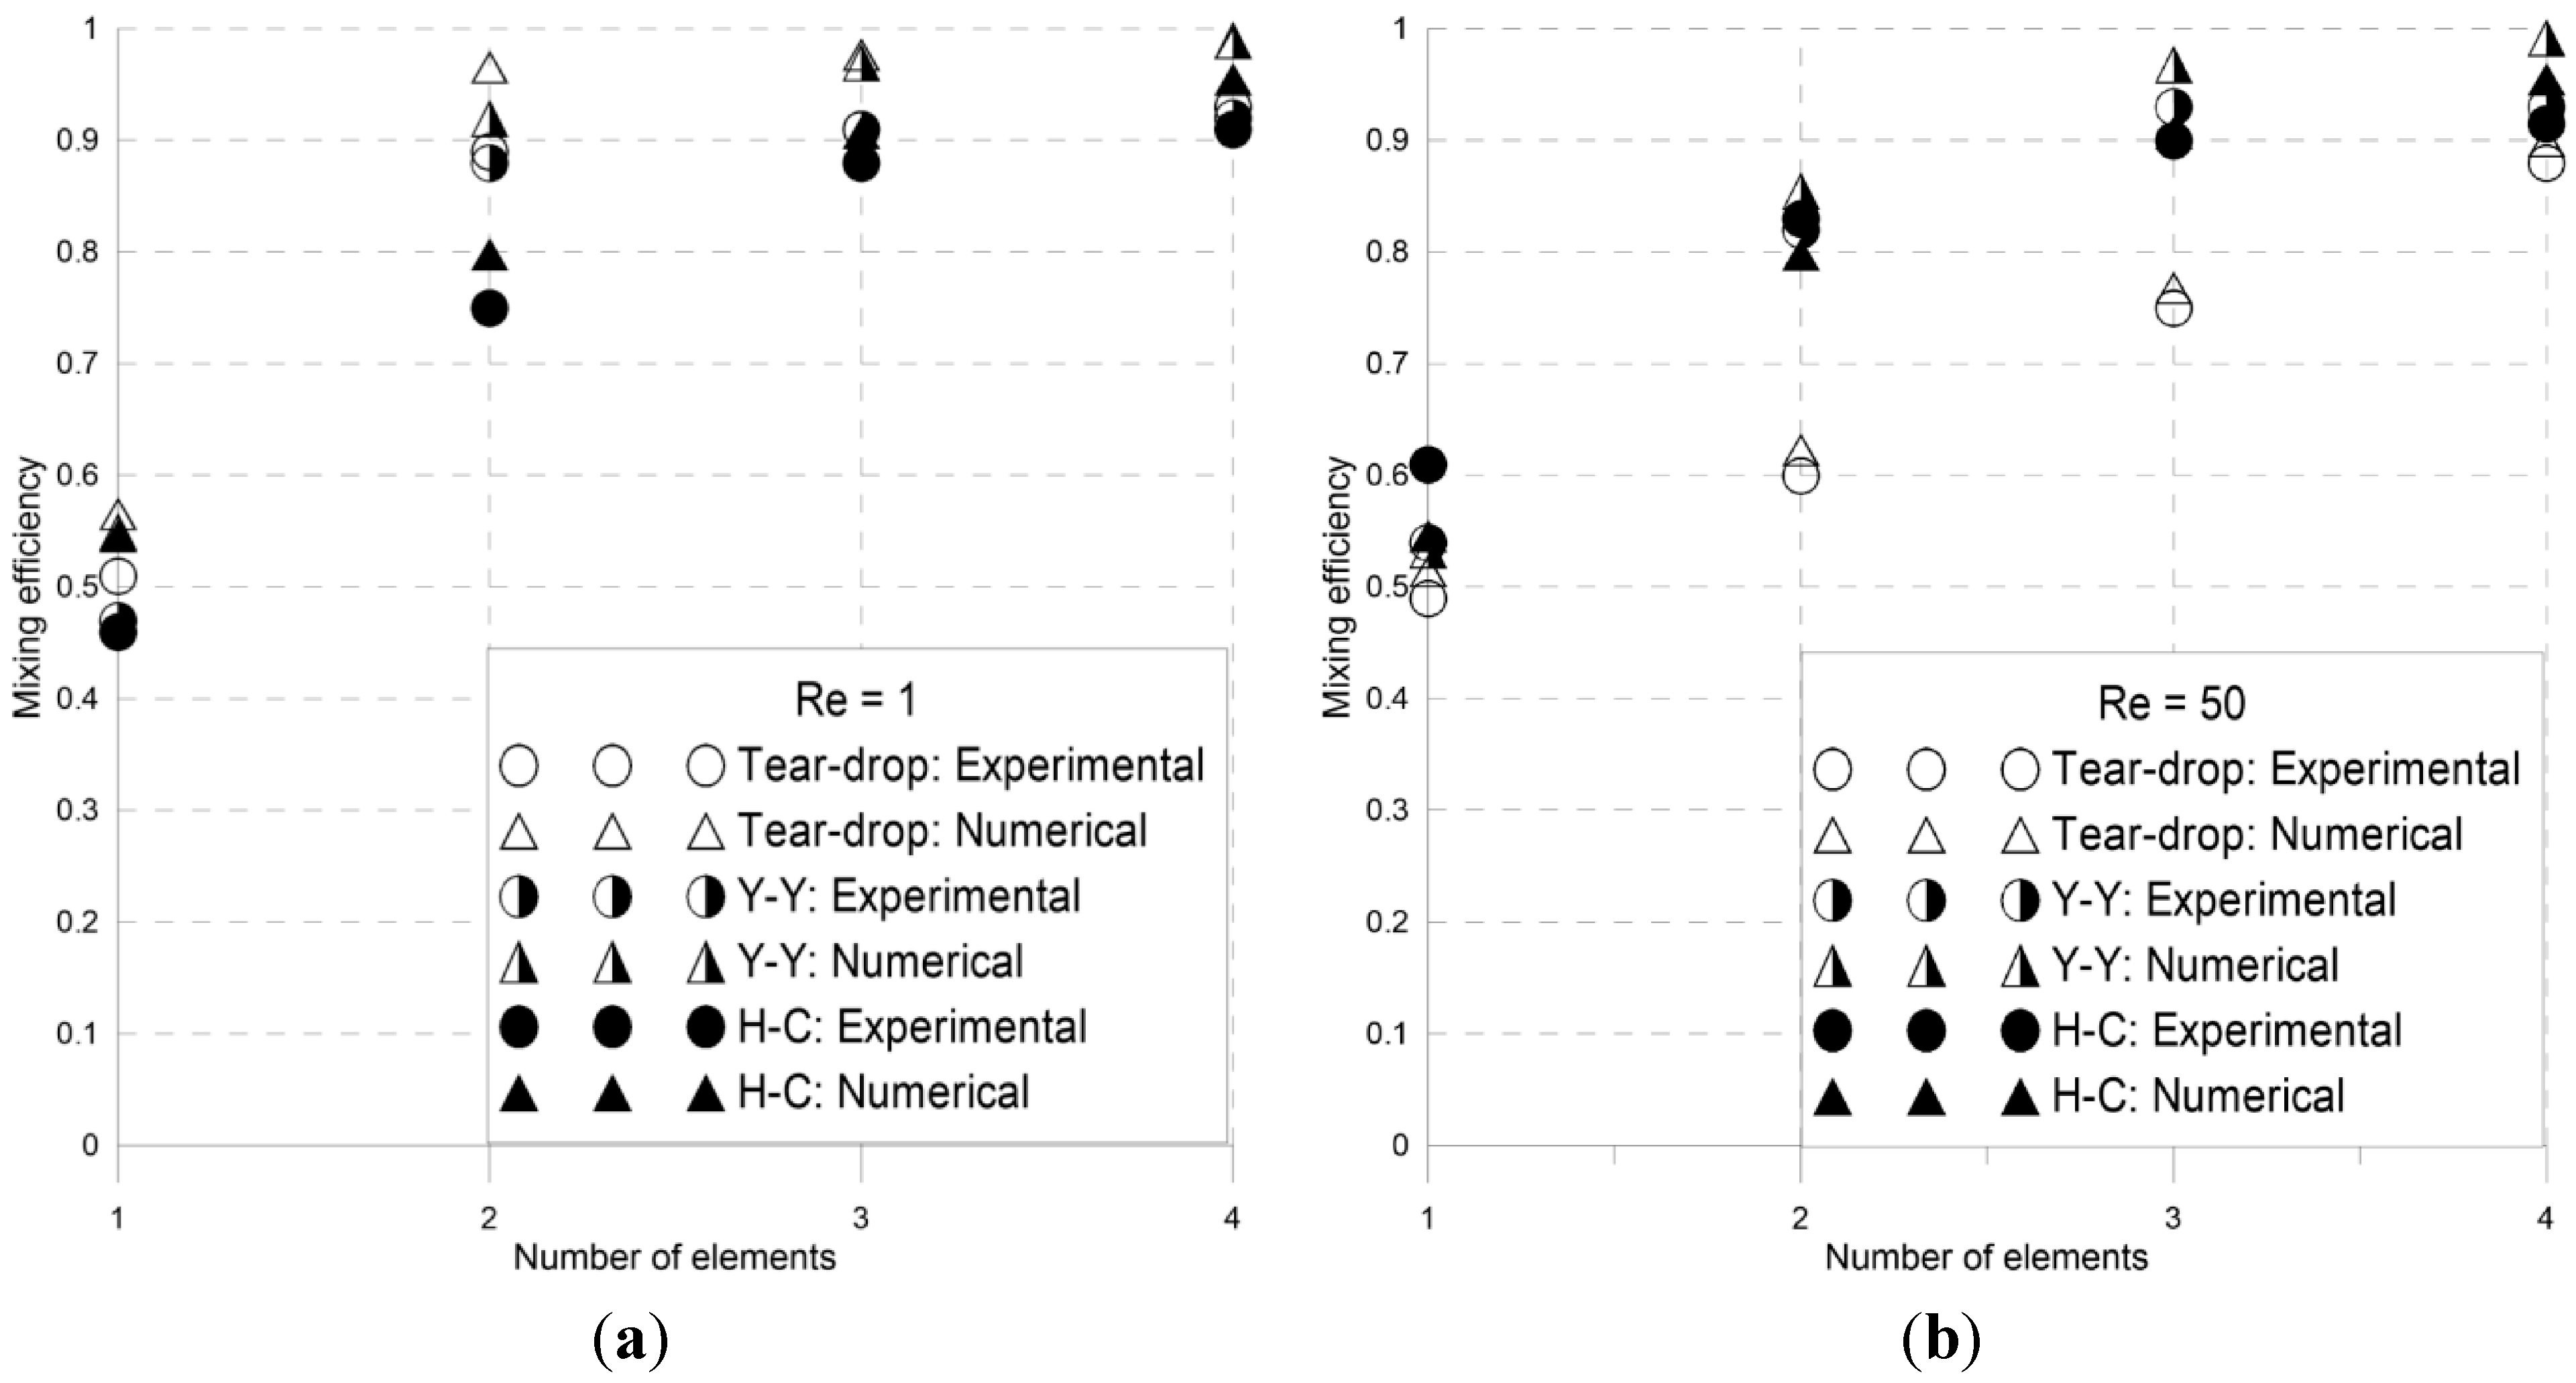
Figure 9 demonstrates the dependency of mixing efficiency on the number of elements at Re = 1 (a) and at Re = 50 (b). As expected, mixing efficiency increases with the number of elements. At low Reynolds numbers, the efficiency of all three mixers is less than 60% after the first element; it gradually increases with the number of elements until reaching a value of already about 90% at the exit of the third element. Increasing Reynolds numbers up to 50, the performance of the Tear-drop mixer is clearly reduced.
Figure 8.
Experimental and numerical mixing efficiency of the Tear-drop, the Y-Y and the H-C mixers after four elements, varying Reynolds numbers.
Figure 8.
Experimental and numerical mixing efficiency of the Tear-drop, the Y-Y and the H-C mixers after four elements, varying Reynolds numbers.
Figure 9.
Experimental and numerical mixing efficiency of the Tear-drop, the Y-Y, and the H-C micromixers, varying their number of elements: (a) Re = 1; (b) Re = 50.
Figure 9.
Experimental and numerical mixing efficiency of the Tear-drop, the Y-Y, and the H-C micromixers, varying their number of elements: (a) Re = 1; (b) Re = 50.
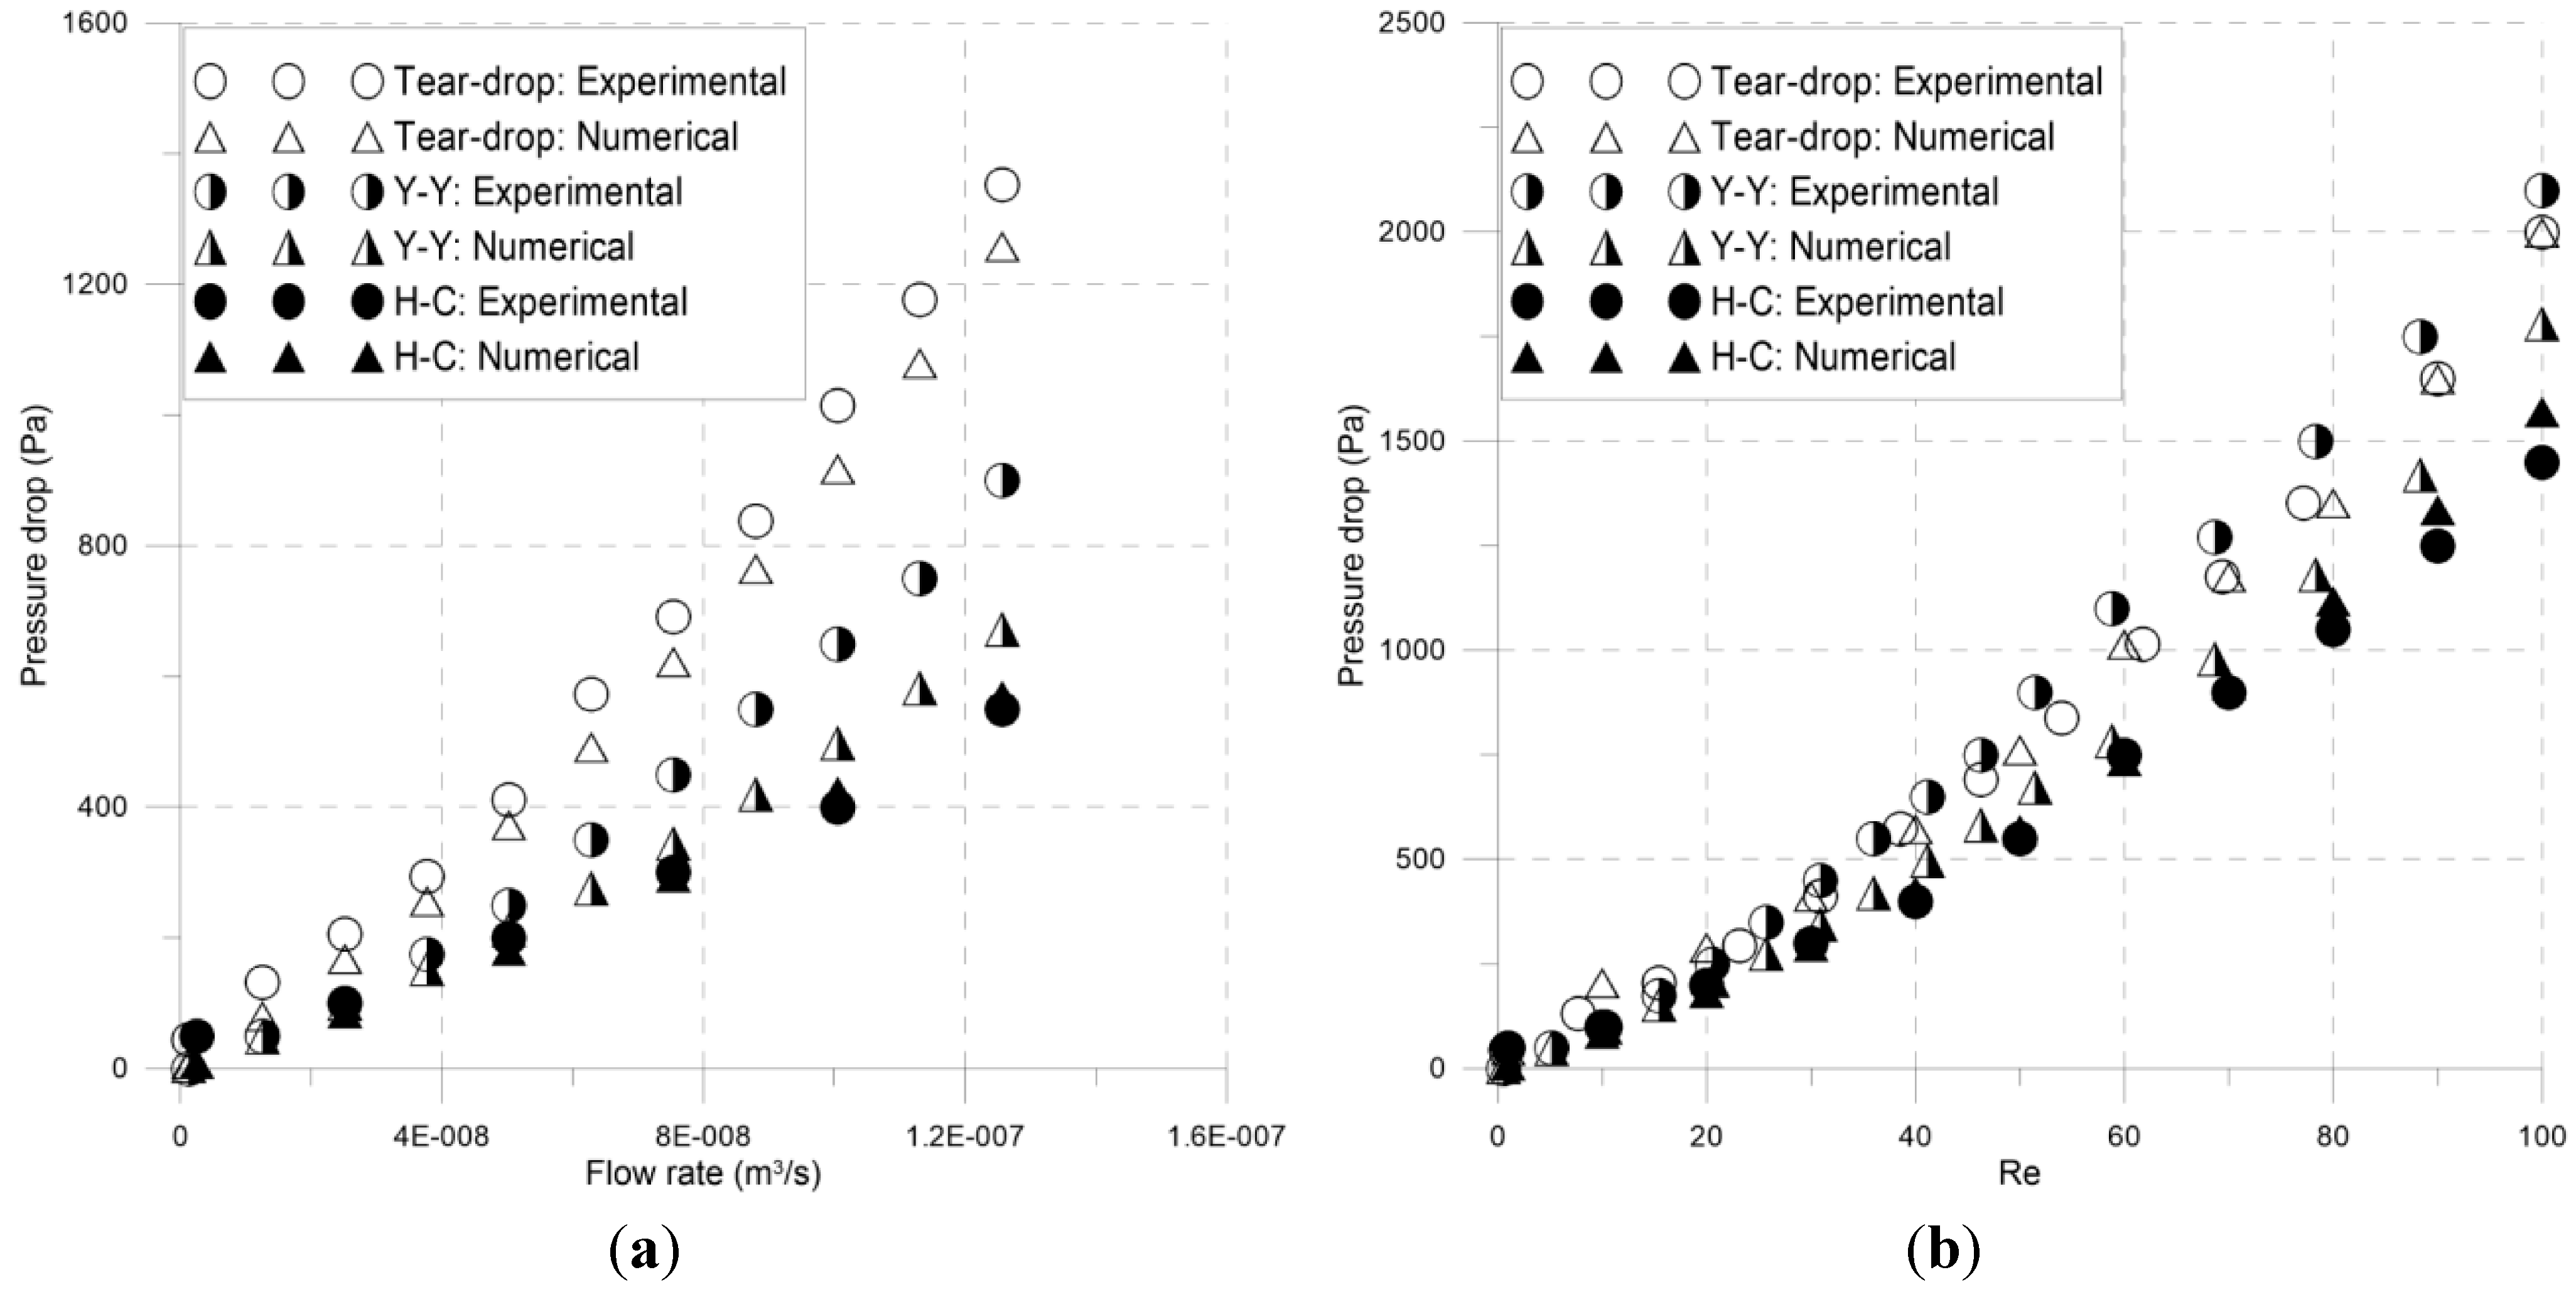
Finally, the pressure drop of the micromixers was evaluated experimentally as well as numerically. For a better understanding,
Figure 10 shows pressure drop dependency both on flow rate (a) and on Reynolds numbers (b). Numerical and experimental curves have the same trend and the maximum relative error is of about 10% at the highest flow rate, except for the Y-Y mixer, for which a maximum error of 16% is detected; this can be explained by some defects of the prototype geometry. As shown, pressure drop is linearly dependent on flow rate almost up to Reynolds numbers Re = 50. Increasing flow rate, the pressure drop characteristic deviates from linearity and an exponential increase can be detected; this behavior is due to flow regime transition [
27]. While at low Reynolds numbers a straight laminar flow occurs and the fluid follows the channel geometry even in bends, at Reynolds numbers of about 50, some swirling effects start to be introduced; as a consequence, an increase of pressure drop can be detected.
As shown, keeping the flow rate constant, the Tear-drop and the H-C mixers have respectively the highest and the lowest pressure drop; the Y-Y mixer shows relatively higher pressure drop than the H-C mixer.
Figure 10.
Numerical and experimental pressure drop of the Tear-drop, the Y-Y, and the H-C micromixers: (a) varying flow rate; (b) varying Reynolds numbers.
Figure 10.
Numerical and experimental pressure drop of the Tear-drop, the Y-Y, and the H-C micromixers: (a) varying flow rate; (b) varying Reynolds numbers.
6. Conclusions
Two novel SAR passive micromixers, the Y-Y and the H-C ones, were developed and studied numerically and experimentally. Their performance was compared to that of a well-known micromixer, the Tear-drop one. All micromixers are made up of four identical elements; their structure is simple and no grooves are present. An image analysis technique was used to evaluate mixture homogeneity at four target areas along the mixer. Numerical simulations, carried out on a model of the mixer, were found to be a useful support for observing the complex three-dimensional flow inside the channels. A good agreement was found between numerical and experimental results. Over the examined range of Reynolds numbers, the Y-Y and the H-C micromixers showed at their exit an almost flat mixing characteristic, with a mixing efficiency higher than 90%; conversely, the Tear-drop mixer showed a relevant decrease of mixing efficiency at the mid-range. The decreased performance of the Tear-drop mixer at the mid-range of Reynolds numbers can be explained considering that, increasing the flow velocity, there is a shorter residence time for the fluid particles to diffuse. In the Y-Y and H-C mixers, their geometries promote a certain swirling effect already at the mid-range of Reynolds numbers; as a consequence, fluid path lengthening compensates for residence time reduction. In particular, the novel two mixers provide a double 90° change of direction before splitting the flow, while the Tear-drop mixer splits the flow after only one 90° change of direction.
Furthermore, at the same flow rate, pressure drop within the Y-Y and the H-C micromixers, i.e., their energy requirement, is significantly less than that within the Tear-drop mixer.
In the present study, the micromixers were studied as stand-alone systems. Future work will be focused on the effect of integration in a complex microfluidic system. Residence time distribution (RTD) is also worth to be examined, as it is another important parameter to make comparison among different micromixers.

