Article

All Silicon Micro-GC Column Temperature Programming Using Axial Heating

1
School of Mechanical Engineering, Georgia Institute of Technology, Atlanta, GA 30324, USA
2
Department of Chemistry, Spelman College, Atlanta, GA 30314, USA
3
Food Processing Center, Georgia Tech Research Institute (GTRI), Atlanta, GA 30318, USA
*
Author to whom correspondence should be addressed.
Micromachines 2015, 6(7), 865-878; https://doi.org/10.3390/mi6070865
Submission received: 14 May 2015 / Revised: 19 June 2015 / Accepted: 3 July 2015 / Published: 10 July 2015
(This article belongs to the Special Issue Micro/Nano Devices for Chemical Analysis)

Abstract

:
In this work we present a high performance micro gas chromatograph column with a novel two dimensional axial heating technique for faster and more precise temperature programming, resulting in an improved separation performance. Three different axial resistive heater designs were simulated theoretically on a 3.0 m × 300 μm × 50 μm column for the highest temperature gradient on a 22 by 22 μm column. The best design was then micro-fabricated and evaluated experimentally. The simulation results showed that simultaneous temperature gradients in time and distance along the column are possible by geometric optimization of the heater when using forced convection. The gradients along the column continuously refocused eluting bands, offsetting part of the chromatographic band spreading. The utility of this method was further investigated for a test mixture of three hydrocarbons (hexane, octane, and decane).

1. Introduction

There have been many efforts to miniaturize the gas chromatography column system since its introduction by Terry [1] and subsequent efforts by Reston and Kolesar [2] in 1990. Sandia National Lab was the first to integrate a gas chromatography (GC) column, preconcentrator, and chemical sensor arrays into a hybrid system for fast detection of specific analysis commonly present in chemical warfare. Chia-Juang Lu [3] developed the first-generation hybrid MEMS gas chromatograph system, which uses air as the carrier gas and an anodic bonding technique for sealing the silicon etched column to a Pyrex glass. In this system the temperature is regulated using a Kapton embedded resistive wire, with the heat generated by the wire conducted to the bottom of the column. The limitations of this method include the temperature’s non-uniformity and the process of heating the column is slow. Significant progress has been made by different research groups [4,5,6,7,8] to miniaturize the GC system to a portable low power, low cost GC system capable of separating and detecting all the volatile organic compounds (VOCs) in a short time; however, band broadening and slow temperature programming are shortcomings of these instruments.
Temperature is the most prominent variable that has significant impact on separation performance, sorbent selectivity and peak spreading of MEMS GC system. Temperature changes the average kinetic energy rate of diffusion and interaction of compounds in the stationary phase. Two methods used commonly for controlling the temperature on a chip are the isothermal and temperature-programmed GC methods. The isothermal GC method provides a higher resolution than the temperature-programmed method, at the cost of a longer processing time and a relatively narrow boiling temperature range. For both methods, the column maintains a constant temperature at any given time. In 1951, Zhukhoviskii [9] introduced the axial temperature gradient, where the temperature is not only varying with time but also in location along the length of the column. Axial temperature-programmed in certain conditions demonstrated an effective method for improving the band broadening and band coelution; however, this method was not adopted for the standard 30 meter column due to the complexity of controlling the temperature at different locations along the column. Phillips [10,11] demonstrated the use of an axial temperature gradient by utilizing direct resistive heating on a short standard column capillary. However, even though Philips and Zhukhoviskii improved the band broadening, they faced many challenges coating the GC column with different thicknesses and generating a temperature gradient. Recently, Zhao [12] demonstrated implementation of this technique on a short micro pack column capillary for separation of a complex mixture of saturated hydrocarbons in the range between C1 and C7.
The advancements in micro-fabrication processing and the rise of MEMS GC systems have made it possible to implement an axial temperature gradient which is impractical for standard capillary GC. Axial heating is a good method to integrate into a MEMS GC system mainly due to the small thermal mass, low power consumption, portability and short analysis time of the columns. Despite the tremendous improvement in separation efficiency, the new GC MEMS column still has not resolved issues such as experimental time, peak coelution, and power consumption, especially for separating a complex mixture. Developing a low powered, faster heating time would be advantageous in shortening the separation time and improving the resolution.
Resistive heaters are the standard methods utilized for temperature programming of MEMS columns. As outlined previously, there are two modes: isothermal GC [3] and temperature-programmed [13]. Resistive heater integration on silicon has been demonstrated by many research groups for temperature programming and isothermal analysis; however, the amount of time and power required to ramp and sustain the column at a desired temperature is too large for a portable system. Therefore, fabrication of an all silicon column with a small thermal mass and a heater capable of operating in the temperature ranges of 30–130 °C in less than a minute is vital to design a fast, low-power, temperature programmed, and portable GC systems.

2. Experimental Section

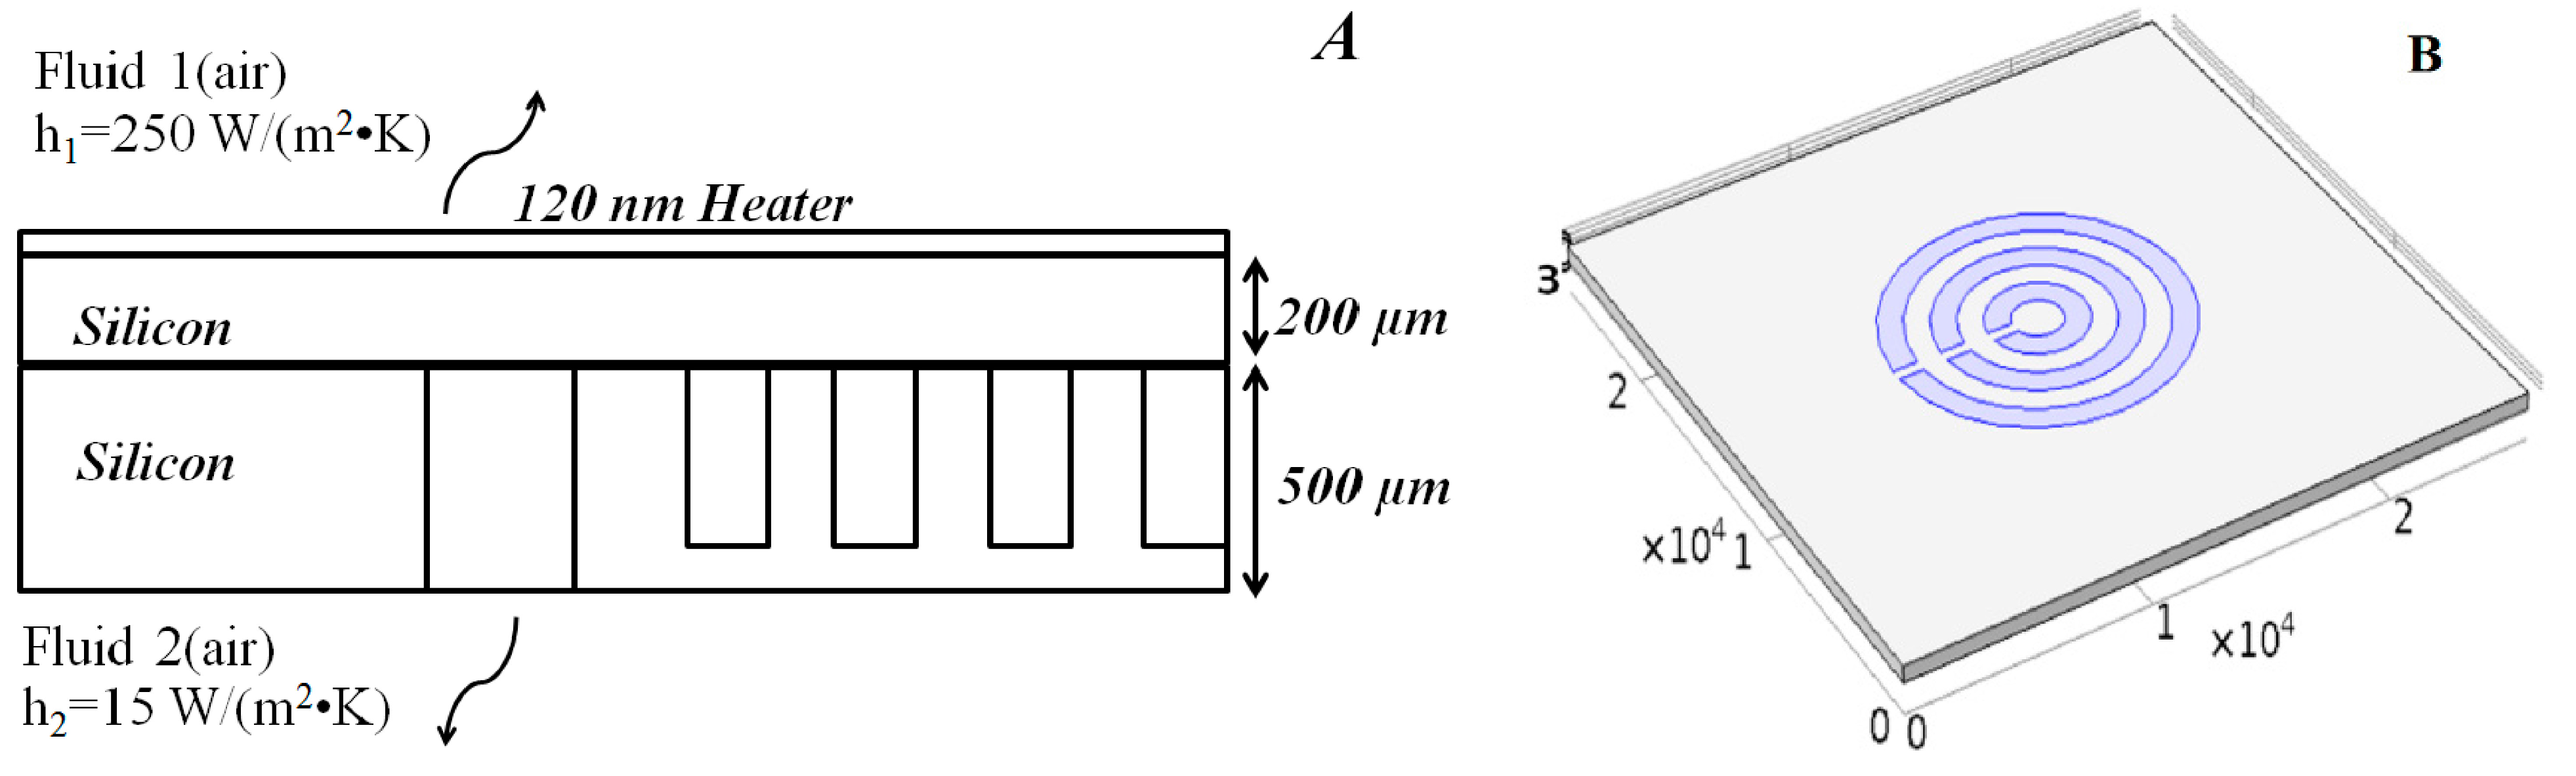
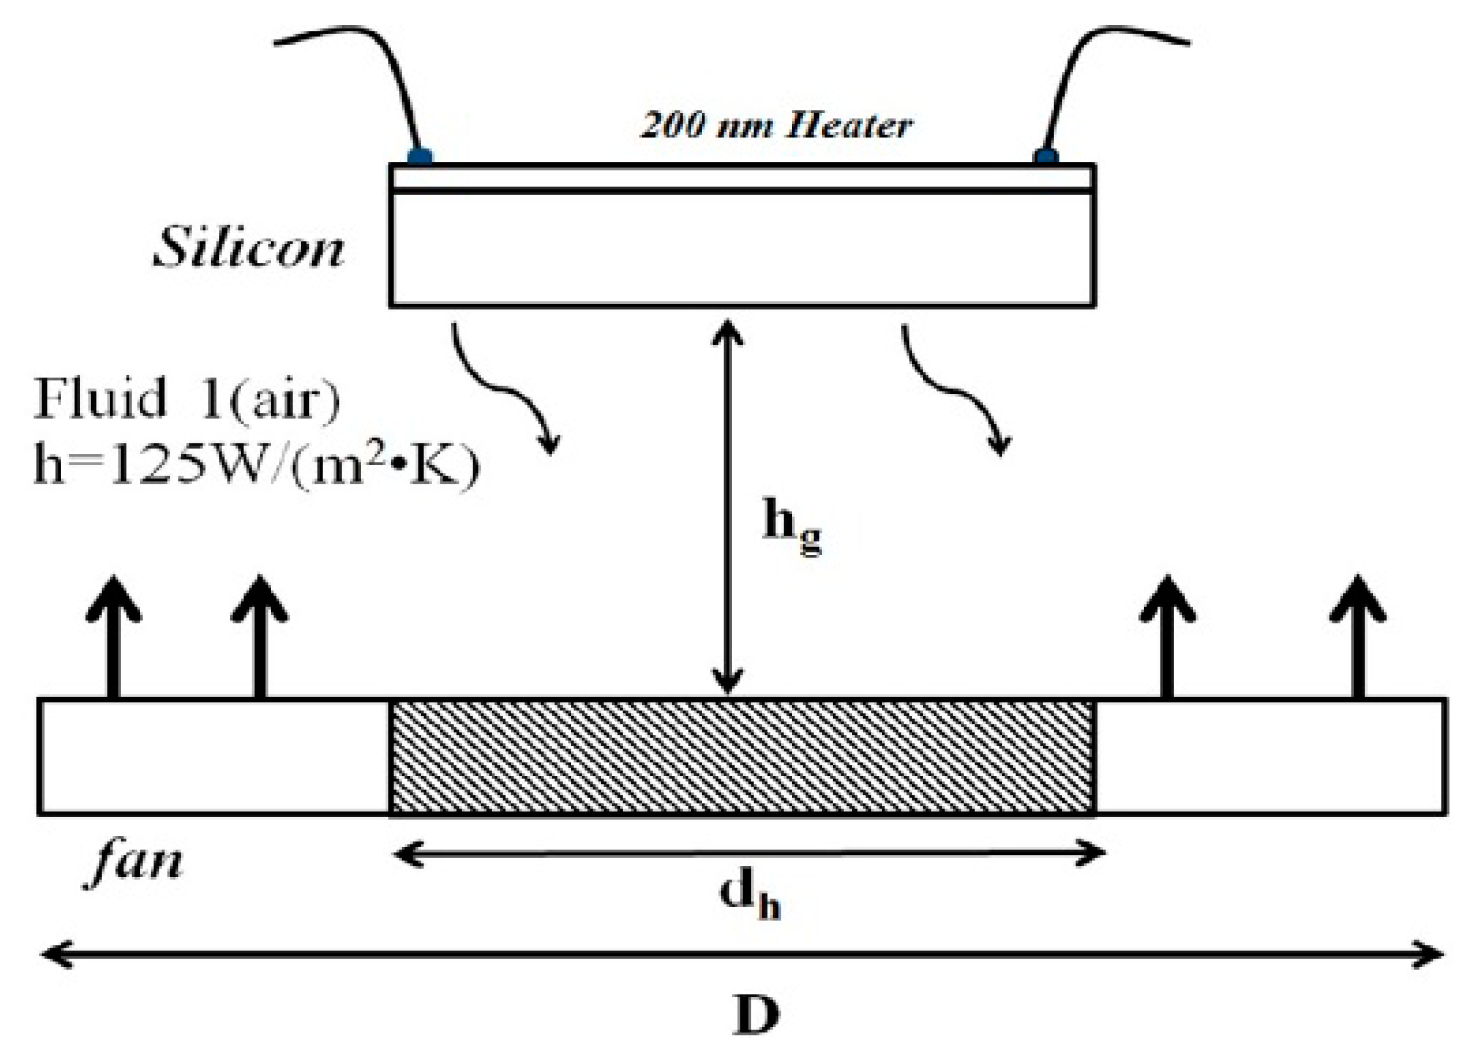
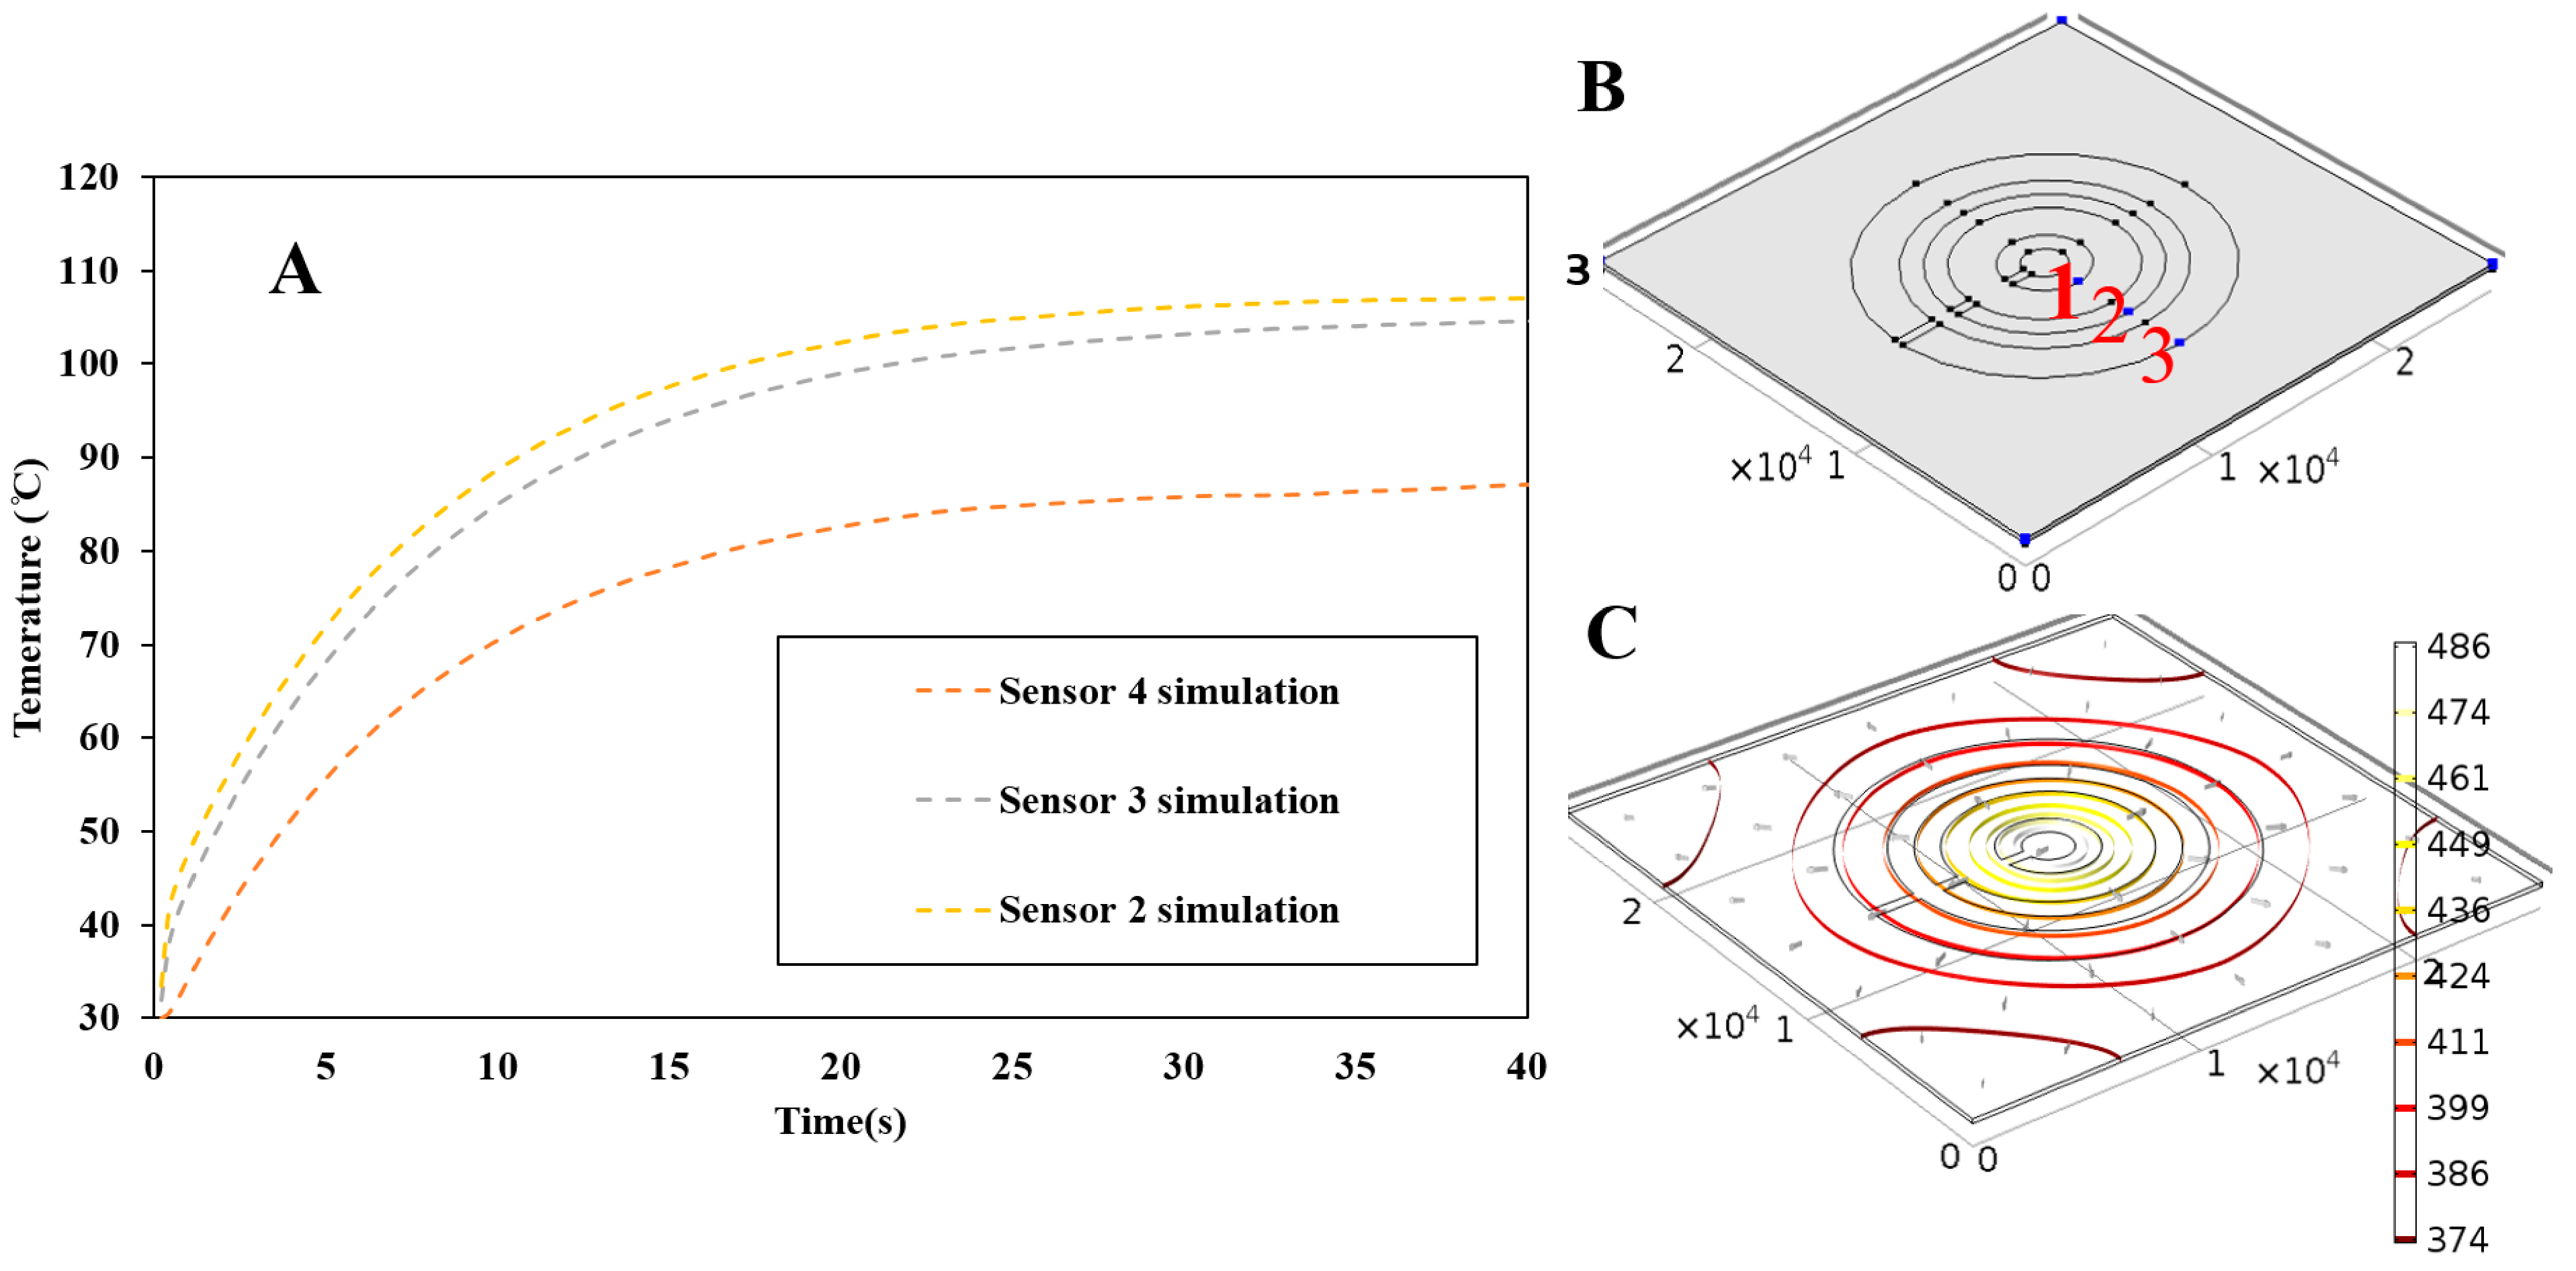
2.1. Computational Modeling

Precise temperature control of a GC column is the most important variable affecting separation performance and peak spreading. In conventional GC systems, for precise temperature control and fast ramping, columns are temperature controlled using a convection oven. However, the time and power required to rapidly increase and sustain the oven’s temperature for each temperature set-point is critical. As a result, each sample may take several hours to process. In order to reduce the wait time and minimize the power consumption, we designed a novel heating technique by controlling the temperature gradient throughout the length of the column and provide a rapid heating and cooling response time. The heating elements operate in two modes; (1) isothermal mode (2) simultaneous temperature gradients along the column mode. It was explicitly shown that the temperature gradient along the capillary column improves the band spreading and compression, which ultimately reduces band broadening.
On the reverse side of the column, an axial negative temperature gradient is generated by applying a fixed voltage across the heating element. The temperature is hotter in the center (inlet of the column) than the perimeter (outlet) of the micro-GC, using a linear temperature profile. As the sample passes through different temperature zones, the diffusion rate changes so that the front of the separation peak moves slower relative to the trailing edge of the peak, thereby improving the resolution of the compounds passing through the column. As a result for a given number of theoretic plates, a shorter column length can be used. Typically, shortening the length of a GC column reduces the analysis time at the expense of resolution; however, thermal refocusing of the eluting band will improve the resolution of the shorter columns. The gradient along the column continuously refocuses the eluting bands, offsetting part of the chromatographic band spreading and consequently sharpens the peaks as they move down the column. The more volatile compounds move faster at a higher temperature and will focus at a lower temperature, exiting the column quicker than the non-volatile compounds. The band broadening of compounds as they move down the length of the column could be explained by the following equation [11]:
σ = H R ( X )
where σ is the band standard deviation, R(X) is the distance as a function of radius, and H is the column efficiency. The assumption is that the efficiency of a column is independent of time and the position along the column for a MEMS GC, mainly due to the short length of the column and a small pressure drop. The variance of a band increases in direct proportion to the distance moved down the column and can be explained with the following equation:
( 2 d t ) =   H u ¯ ( k + 1 )
where k is the capacity factor and u is the linear velocity.
L = a b r 2 + ( d r ) 2
On the top of the column, four resistance-heating elements are integrated for side-by-side comparison of the isothermal analysis with the radial heating analysis.
The main challenge facing the implementation of the axial heating design is the ability to control the temperature profile along the length of the column. To achieve this, three heating element designs were investigated to form a hot spot. The heaters were made of a material with high thermal conductivity, so that the applied voltage to the heater dissipates in a relatively short time. Even though the most widely used material for micro-fabrication of resistance heaters on silicon is gold, platinum was chosen due to the material’s resistivity. Figure 1 shows the heater design and Table 1 summarizes the dimensions of the designed heater.
Figure 1. (A) Side view of GC column with heat losses; (B) layout the heater.
Micromachines 06 00865 g001
Table 1. The dimensions and resistance of the designed heater.
HeaterResistance(Ω)
Length (mm)Thickness (nm)Platinum LayerGold Layer
4.711257.841.52
11.0012518.293.54
17.2812528.755.55
In order to investigate the simultaneous temperature gradients induced by the heater on silicon, a new heater was designed and simulated using COMSOL Multiphysics® (COMSOL Group, Stockholm, Sweden). The 3D simulation was performed by coupling the electric current and heat transfer, and applying the numerical methods described in our previous thermal simulations [14,15]. For simplicity, the following assumptions were made: (1) the effect of the insulating SiO2 layer was insignificant to the overall heat transfer simulation; (2) the convection heat transfer from the edges of the silicon to the surroundings were assumed to be small; (3) the heat losses due to the traverse of helium gas through the column was compensated by increasing the natural convention coefficient on the reverse side of the column; and (4) the heat losses due to low temperatures were small compared to the combined heat loss, and were neglected.
The resistance heating layer was the active surface and simulated with the shell conductive AC/DC layer which is governed by:
t . ( d σ t V ) = 0
where d is the thickness of platinum thin film (125 nm), sigma is the electrical conductivity (S/m), V is the electric potential (V), and ∇t denoted the gradient operation in the tangential directions. The electrical conductivity of the heater was adjusted by a temperature dependent equation:
σ = 1 ρ 0 [ 1 + α ( T T 0 ) ]
where ρ0 is the resistivity at temperature T00 = 2.41×10⁻⁷ Ω·m), α is the thermal coefficient of resistance of Platinum (α = 2.43× 10⁻³ K−1) [16].
The heat generated by the joule heating was coupled with the heat transfer module. The highly conductive layer feature of the heat transfer interface was used for joule heating of the thin layer. The power per unit area (W/m2) generated inside the thin conductive layer is governed by:
q p r o d = d Q D C
where QDC is the power density. At the steady-state, the heat generated by the joule heating is conducted to the silicon column and some dissipates by forced and natural convection from the top and bottom of the silicon piece to the surrounding air.

2.2. Device Fabrication and Characterization

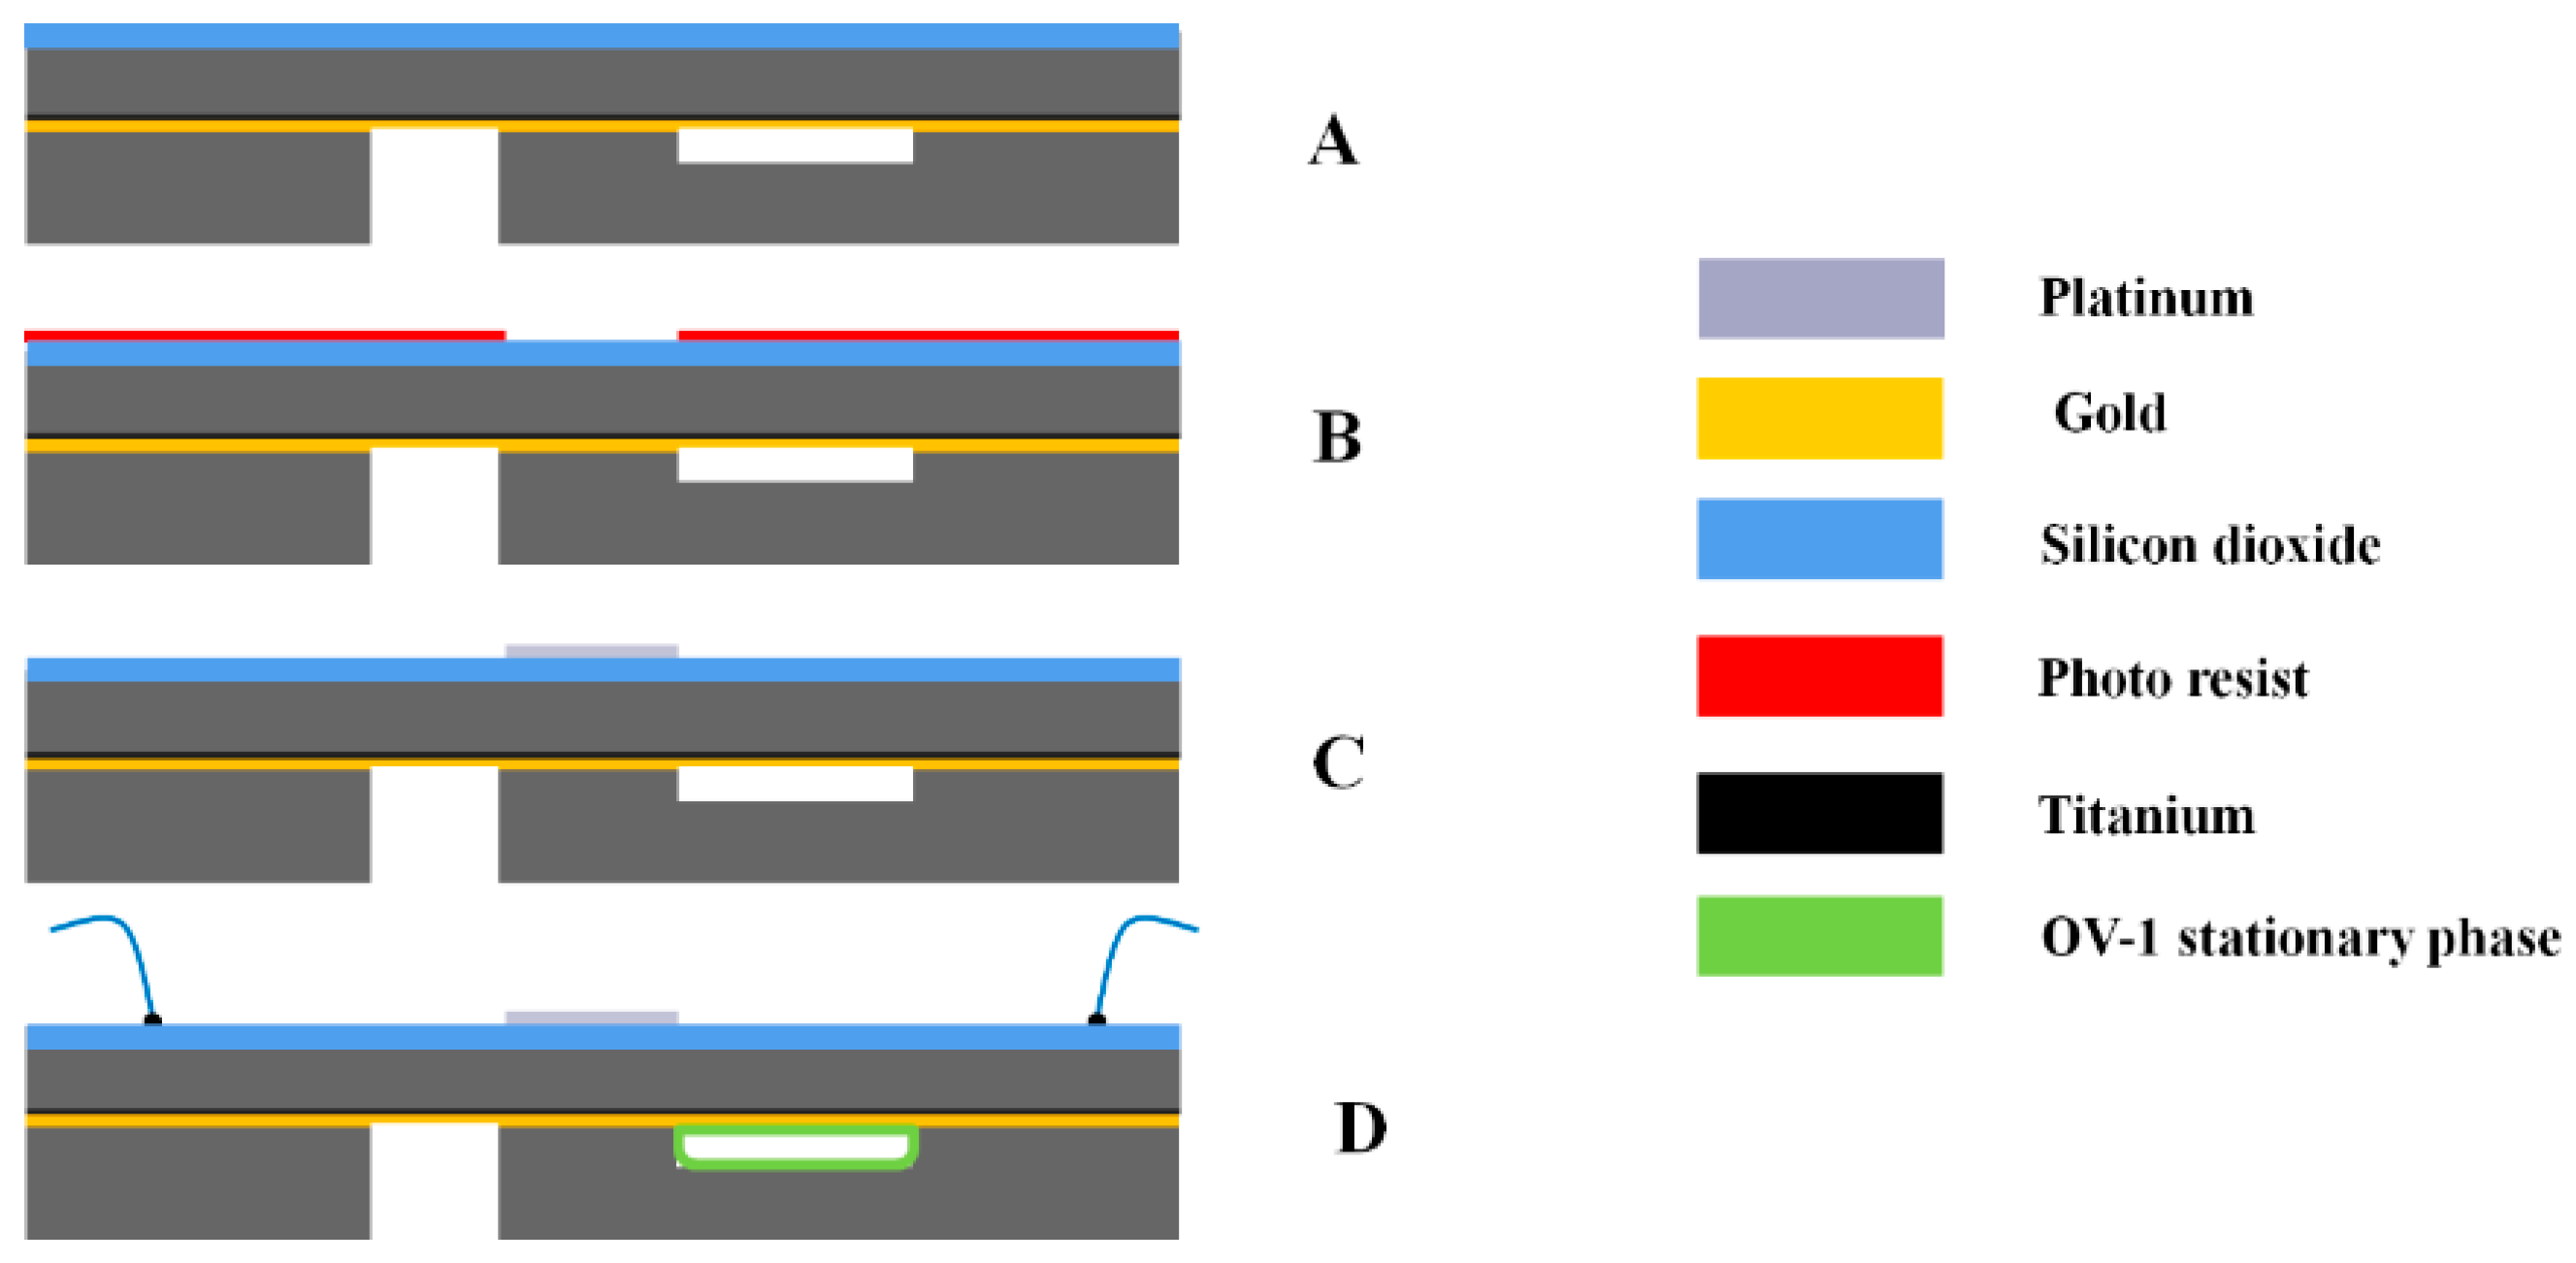
2.2.1. Chip Fabrication

The process for fabrication an all-silicon GC columns was described in our previous work [17,18]. To investigate the axial temperature gradient, three heater designs were investigated. To fabricate the integrated heaters and a temperature sensor on a previously micro-fabricated column, ShipleyMICROPOSIT® S1318 photoresist (Dow, Midland, MI, USA) was spin-coated on the column at 1000 rpm for 40 s. The column was then soft-baked at 160 °C for 60 s and was then exposed using MA-6 mask aligner (SÜSS MicroTec AG, Garching, Germany). The column was then immersed in RA6 developer for 15 s and was post–baked at 90 °C for 3 min. Denton Explorer was used to deposit 10 nm of Titanium as an adhesion layer subsequently 120 nm of platinum was deposited. The column was then immersed in acetone for several minutes and then was rinsed with deionized (DI) water. Figure 2 shows the fabrication process flow of the heaters.
Figure 2. (A) 200 nm oxide grown thermally; (B) the top-side is coated with photoresists; (C) 115 nm of Ti/Pt deposited using E-beam evaporator; (D) wire bonded the heaters to the package.
Micromachines 06 00865 g002

2.2.2. Stage Assembly

A flexible stage was designed to reduce the conductive loss and improve the convective loss by exposing one side to a natural convention and the other side to a forced convection, controlled by an axial fan. Two probes were used to apply a constant power to the heater while another two probes concurrently measured the temperature of the sensor at different locations on the chip. A 6 digit Agilent meter was employed for measuring the resistance change of the platinum sensors. The schematic of the experimental apparatus and the location of the fan relative to the column are presented in Figure 3.
Figure 3. Experimental setup.
Micromachines 06 00865 g003

3. Results and Discussions

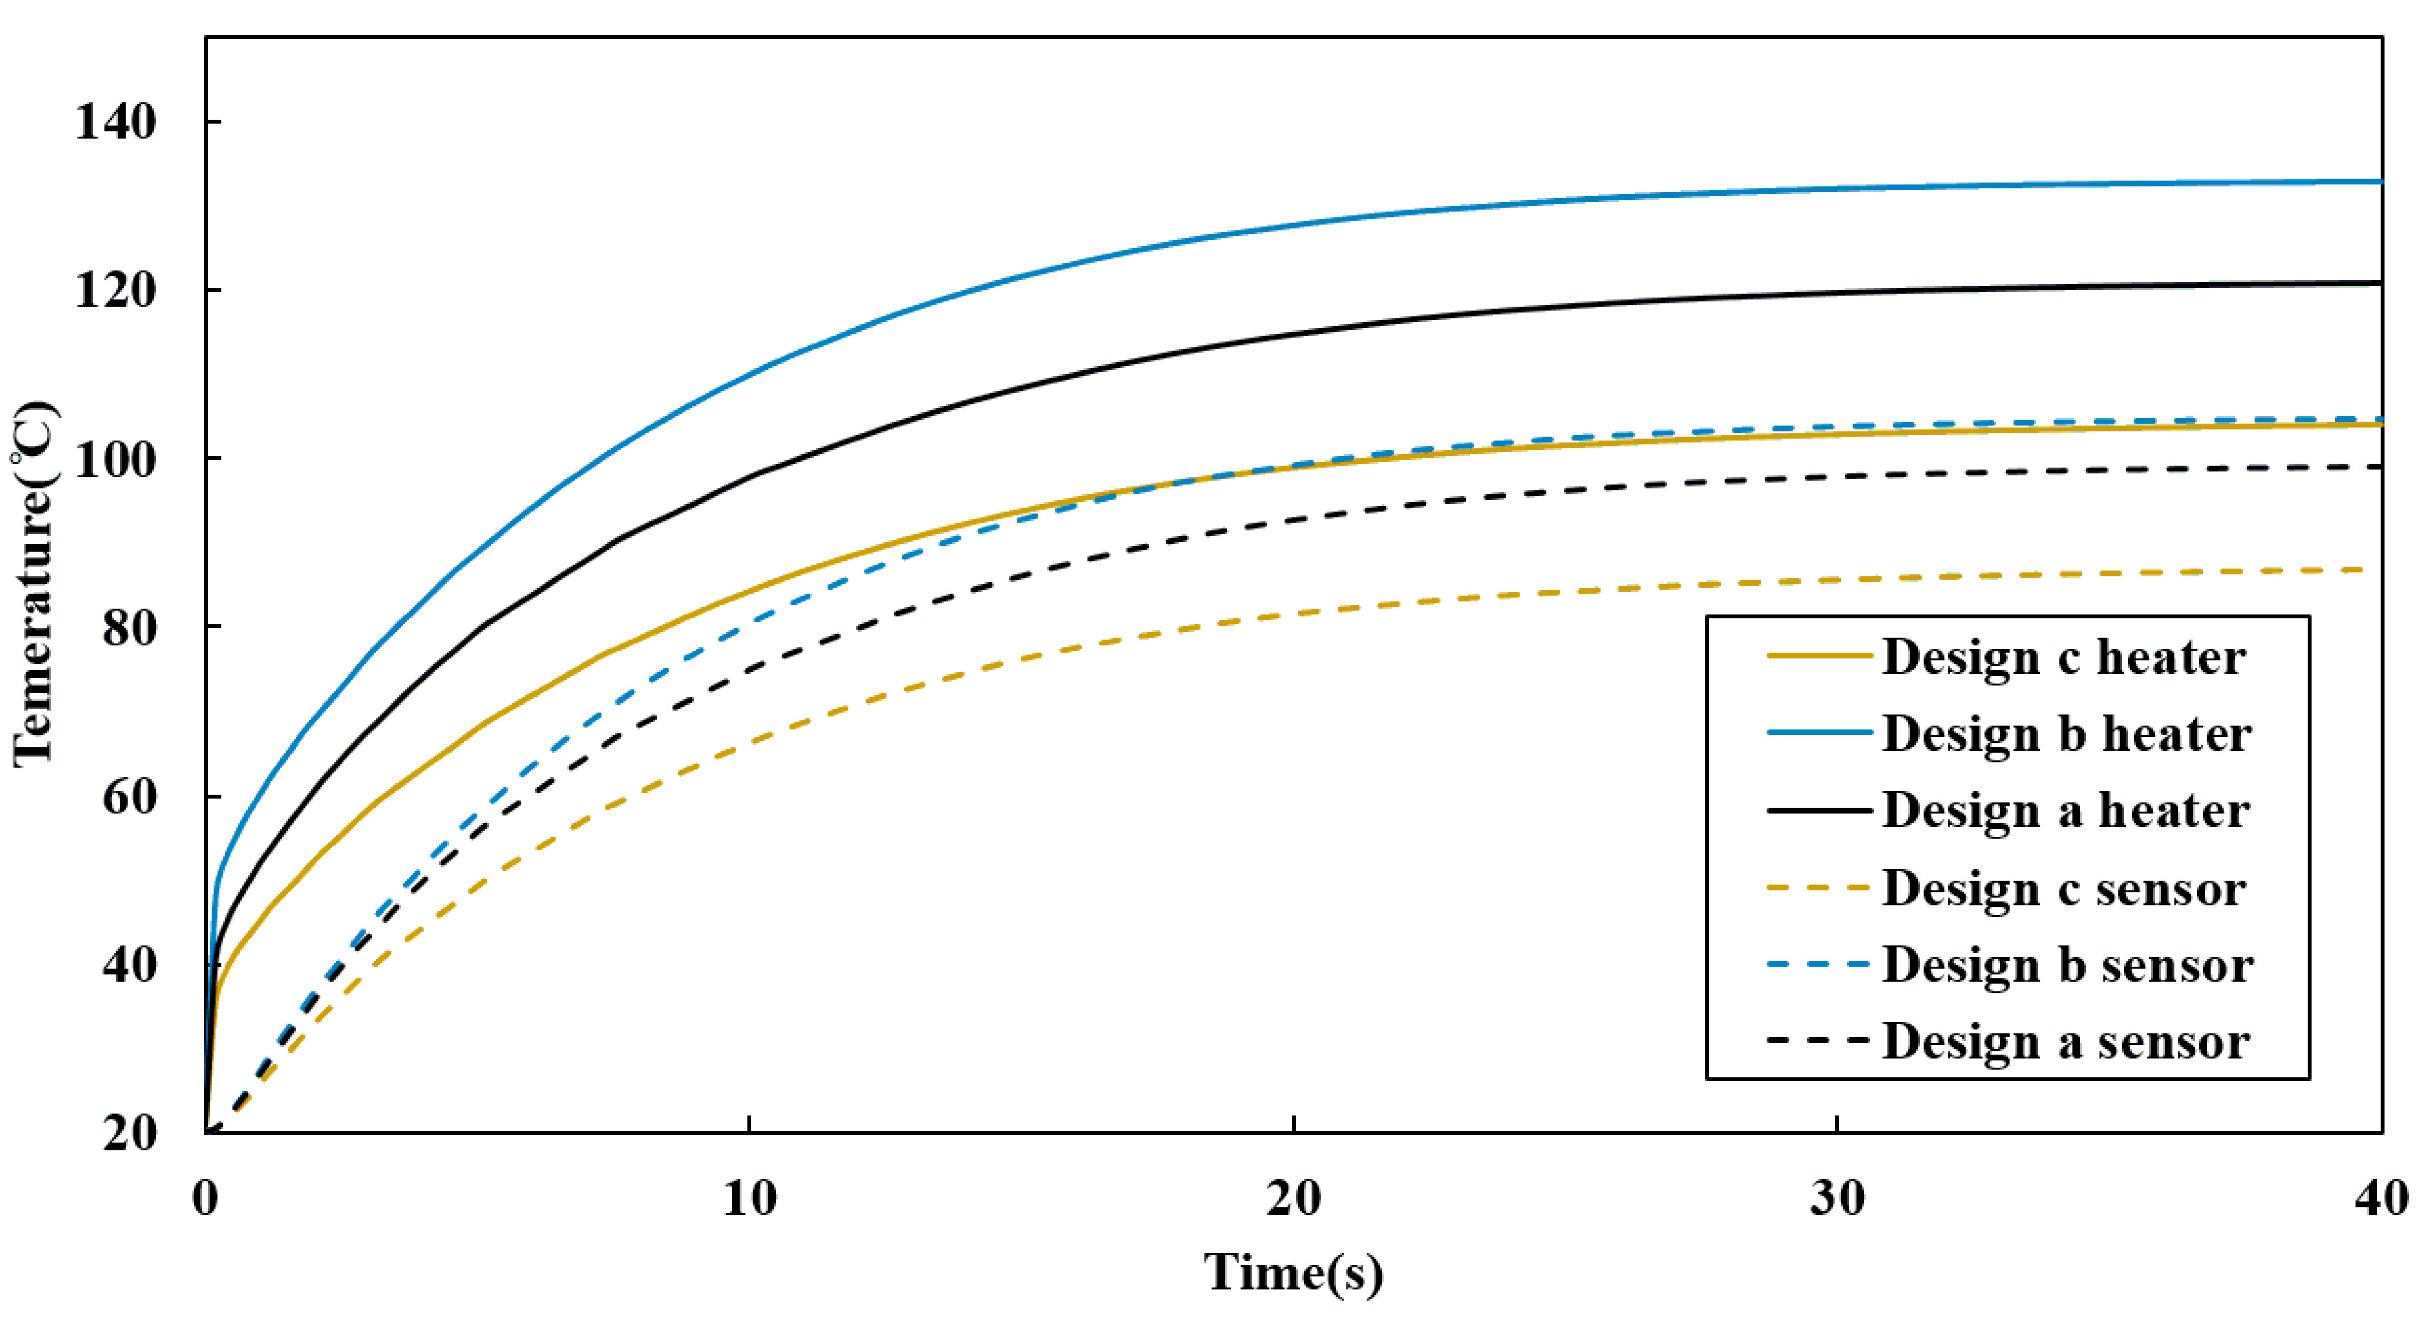
3.1. Computational Modeling
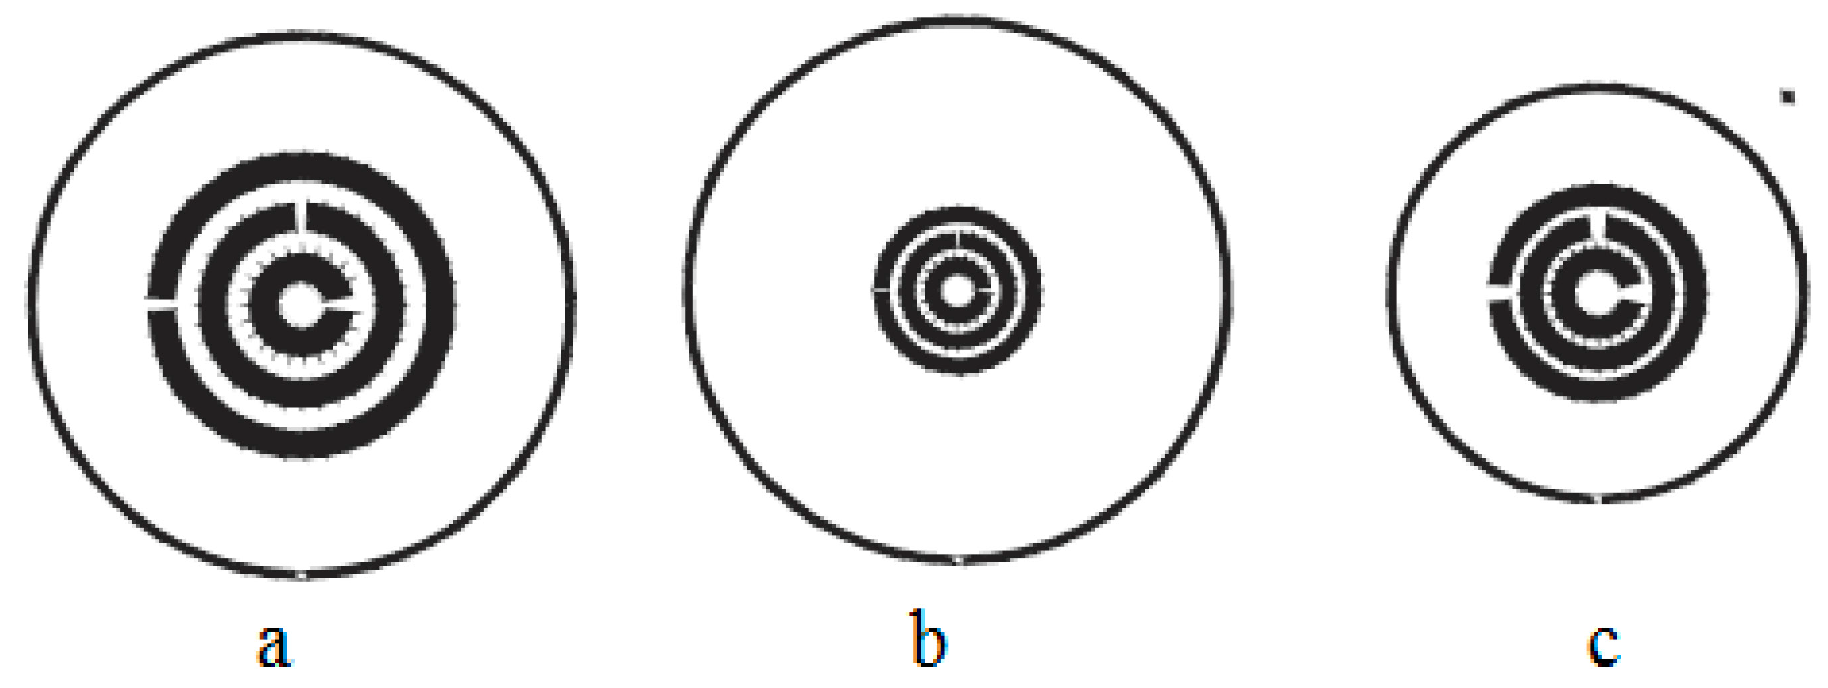
The simulation method was carried out through a transient response, using the room temperature as the initial condition. Figure 4 presents the structure of the column and the calculated temperature field when 6 W power was applied and the force convection heat transfer coefficient was at 150 W/m2K.
Figure 4. (A) Temperature distribution with 6 W of electrical power dissipated in the heating element on the GC silicon column and surrounding air at ambient temperature of 20 °C and (B) sensors location; (C) temperature profile.
Micromachines 06 00865 g004
After validation of the model, three heater and temperature sensor designs were investigated. Figure 5 shows the three different heater size and temperature sensor designs. Table 2 provides the dimensions and calculated resistance value of the heaters for each design. The simulation method depicted in Figure 6 shows design b as the best heater design, which provides the largest temperature gradient on the chip.
Figure 5. Mask designs of the radial heater and the temperature sensor: (a) Design a; (b) Design b; (c) Design c.
Micromachines 06 00865 g005
Table 2. The dimensions of the three heater designs and the theoretically calculated the platinum resistance.
DesignRadius 1Radius 2Length (mm)Track Resistance (Ω)
Design a0.0010.001756.286.97
0.002250.00314.1415.68
0.00350.0042521.9924.40
Design b0.000750.001254.717.84
0.001750.0022510.9918.30
0.002750.0032517.2828.75
Design c0.0010.0026.285.22
0.0030.00418.8515.68
0.0050.00631.4226.14
Figure 6. Simulated transient response of temperature over time after applying 6 W of electrical dissipation to the heater, for the three designs.
Micromachines 06 00865 g006

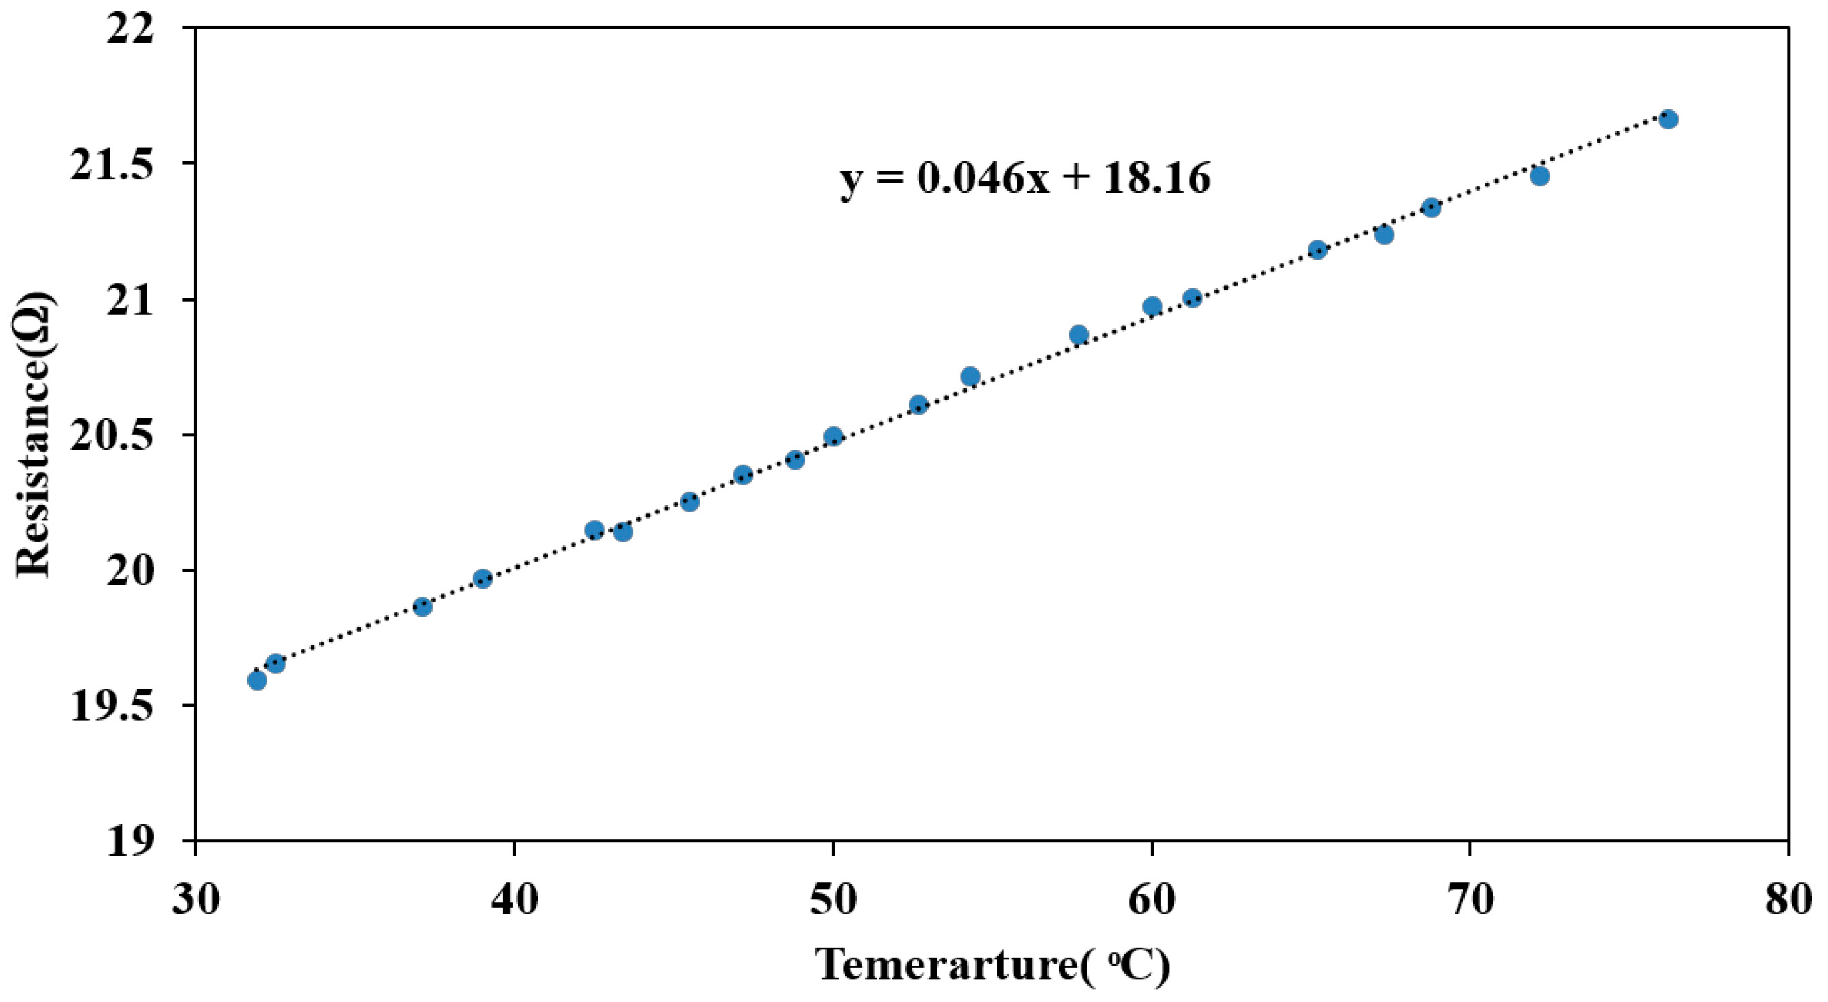
3.2. Heater Characterization

To validate the simulation data, the electrical properties of a thin film of platinum were characterized. The experiment was carried out by placing the column on a temperature controlled probing station while the change in resistance of the sensor was measured using a digital multimeter. The measurement was performed in a temperature range from 30 to 80 °C and a thermocouple (with accuracy of 0.1 °C) was used to measure the temperature. The Temperature Coefficient of Resistance (TCR) and the base line resistance of the thin film of platinum were calculated by plotting (Figure 7) the measured resistance of the sensor against temperature of the thermocouple and fitting it to the following equation:
R = R 0 α ( T T 0 ) + R 0
where R0 is the base resistance at the base temperature To, α was calculated by dividing the slope of the linear fit with R0, which is the intercept on the y axis. Hence, α = 2.54 × 10⁻³ and R0 = 18.16 Ω. The TCR values of the thin film platinum were 65% smaller than bulk platinum due to impurities in the platinum and also the surface roughness quality of the platinum film [16].
Figure 7. Temperature calibration data for the heater where each data point was obtained by subjecting the column to a uniform temperature on a heated plate.
Micromachines 06 00865 g007

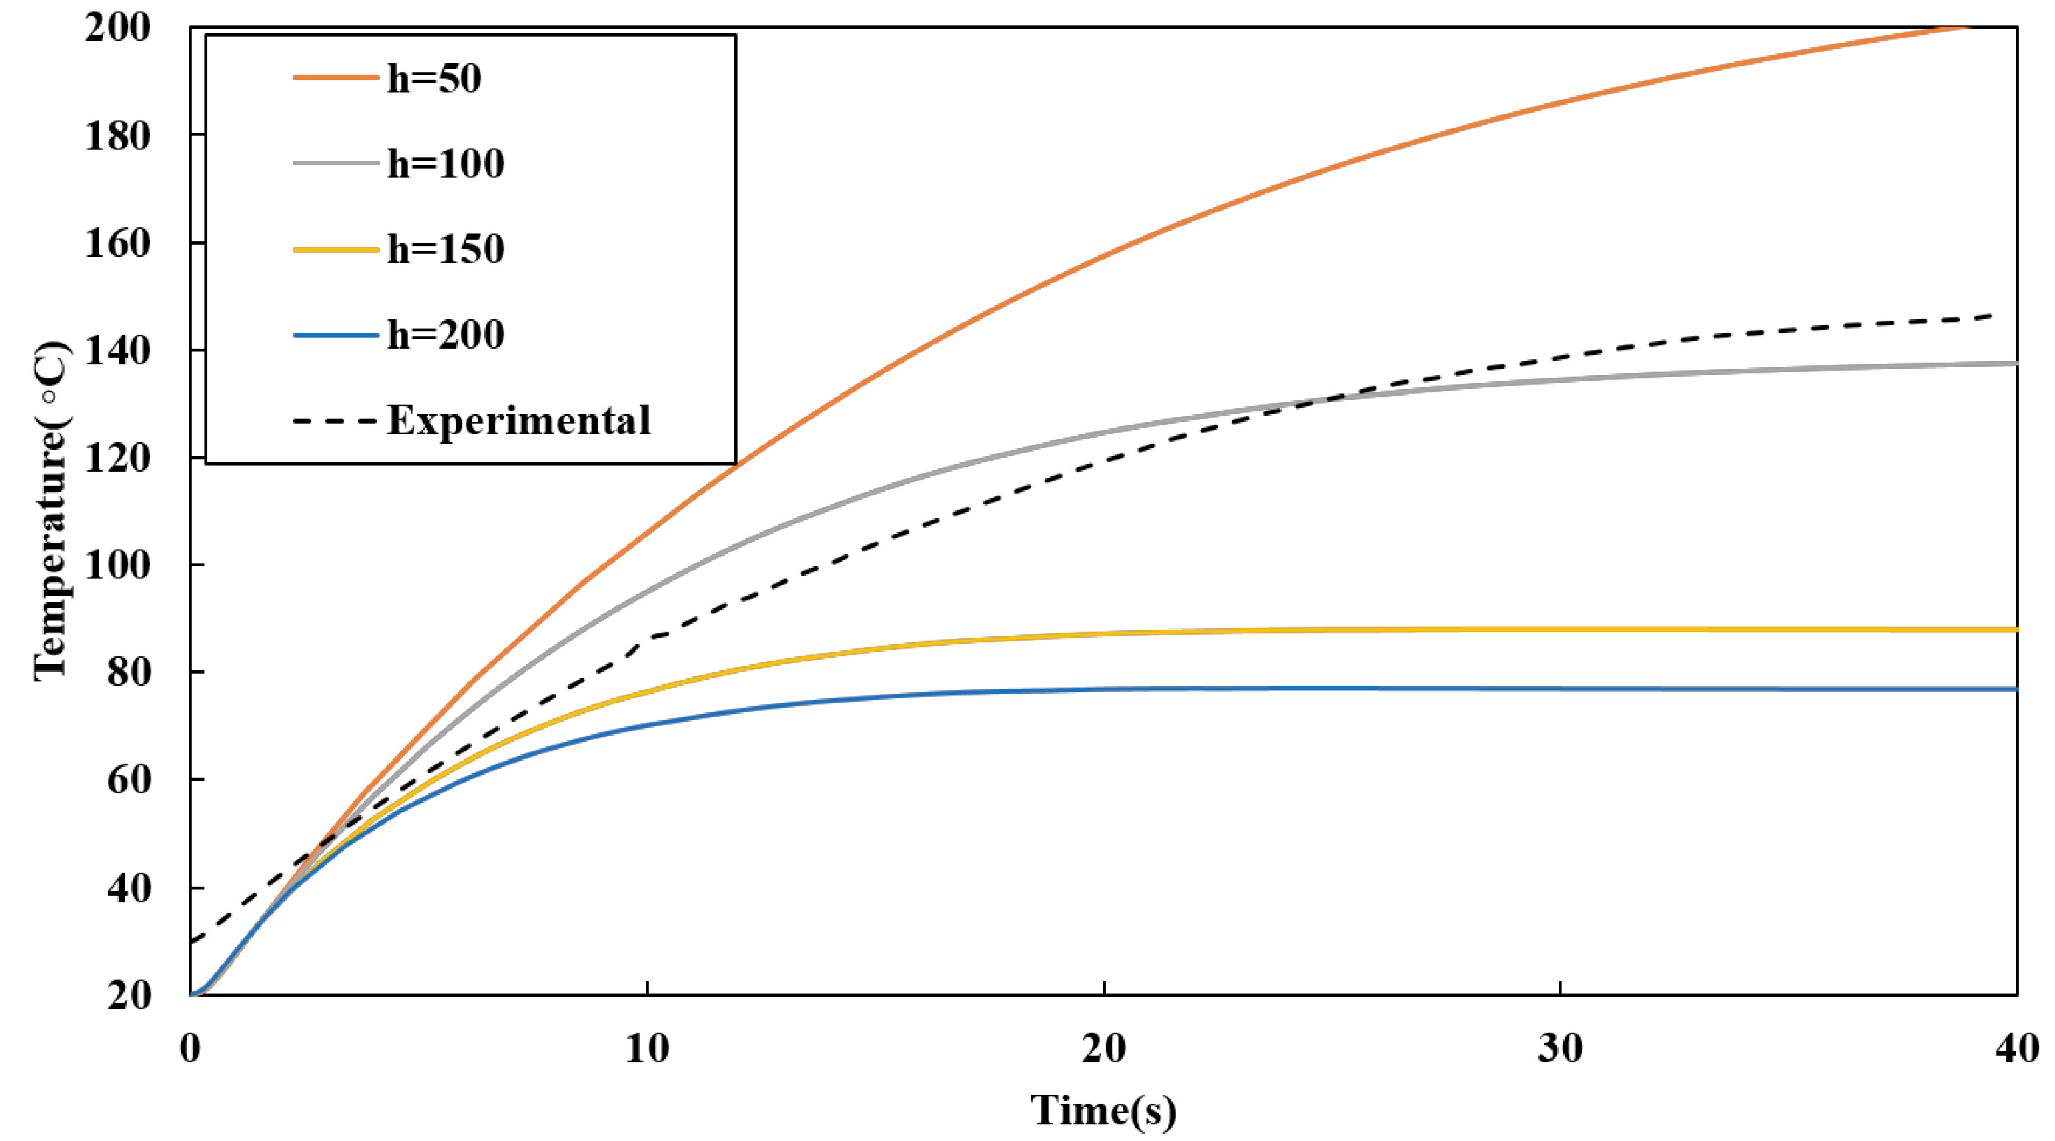
3.3. Coefficient of Convection Characterization

The convective heat transfer coefficient is critical factor affecting the temperature gradient generated in the column. At a higher convective coefficient a larger temperature gradient is produced at the cost of increasing the power consumption. To obtain a value for the coefficient of convective heat transfer, a model of the column heating geometry was simulated with different heat transfer coefficients of convection, and compared to the experimental data collected with the fan operating at 12 V. Figure 8 shows the convective heat transfer coefficient produced by the fan and was measured to be 125 W/m2 based on the distance from the column, which agrees with previously reported data [19].
Figure 8. Plot of simulated average temperature transient response of the resistor film with 2 W electrical power applied to the heater compared to experimentally measured temperature on the micro-GC column with convection heat transfer coefficient in air as a parameter.
Micromachines 06 00865 g008

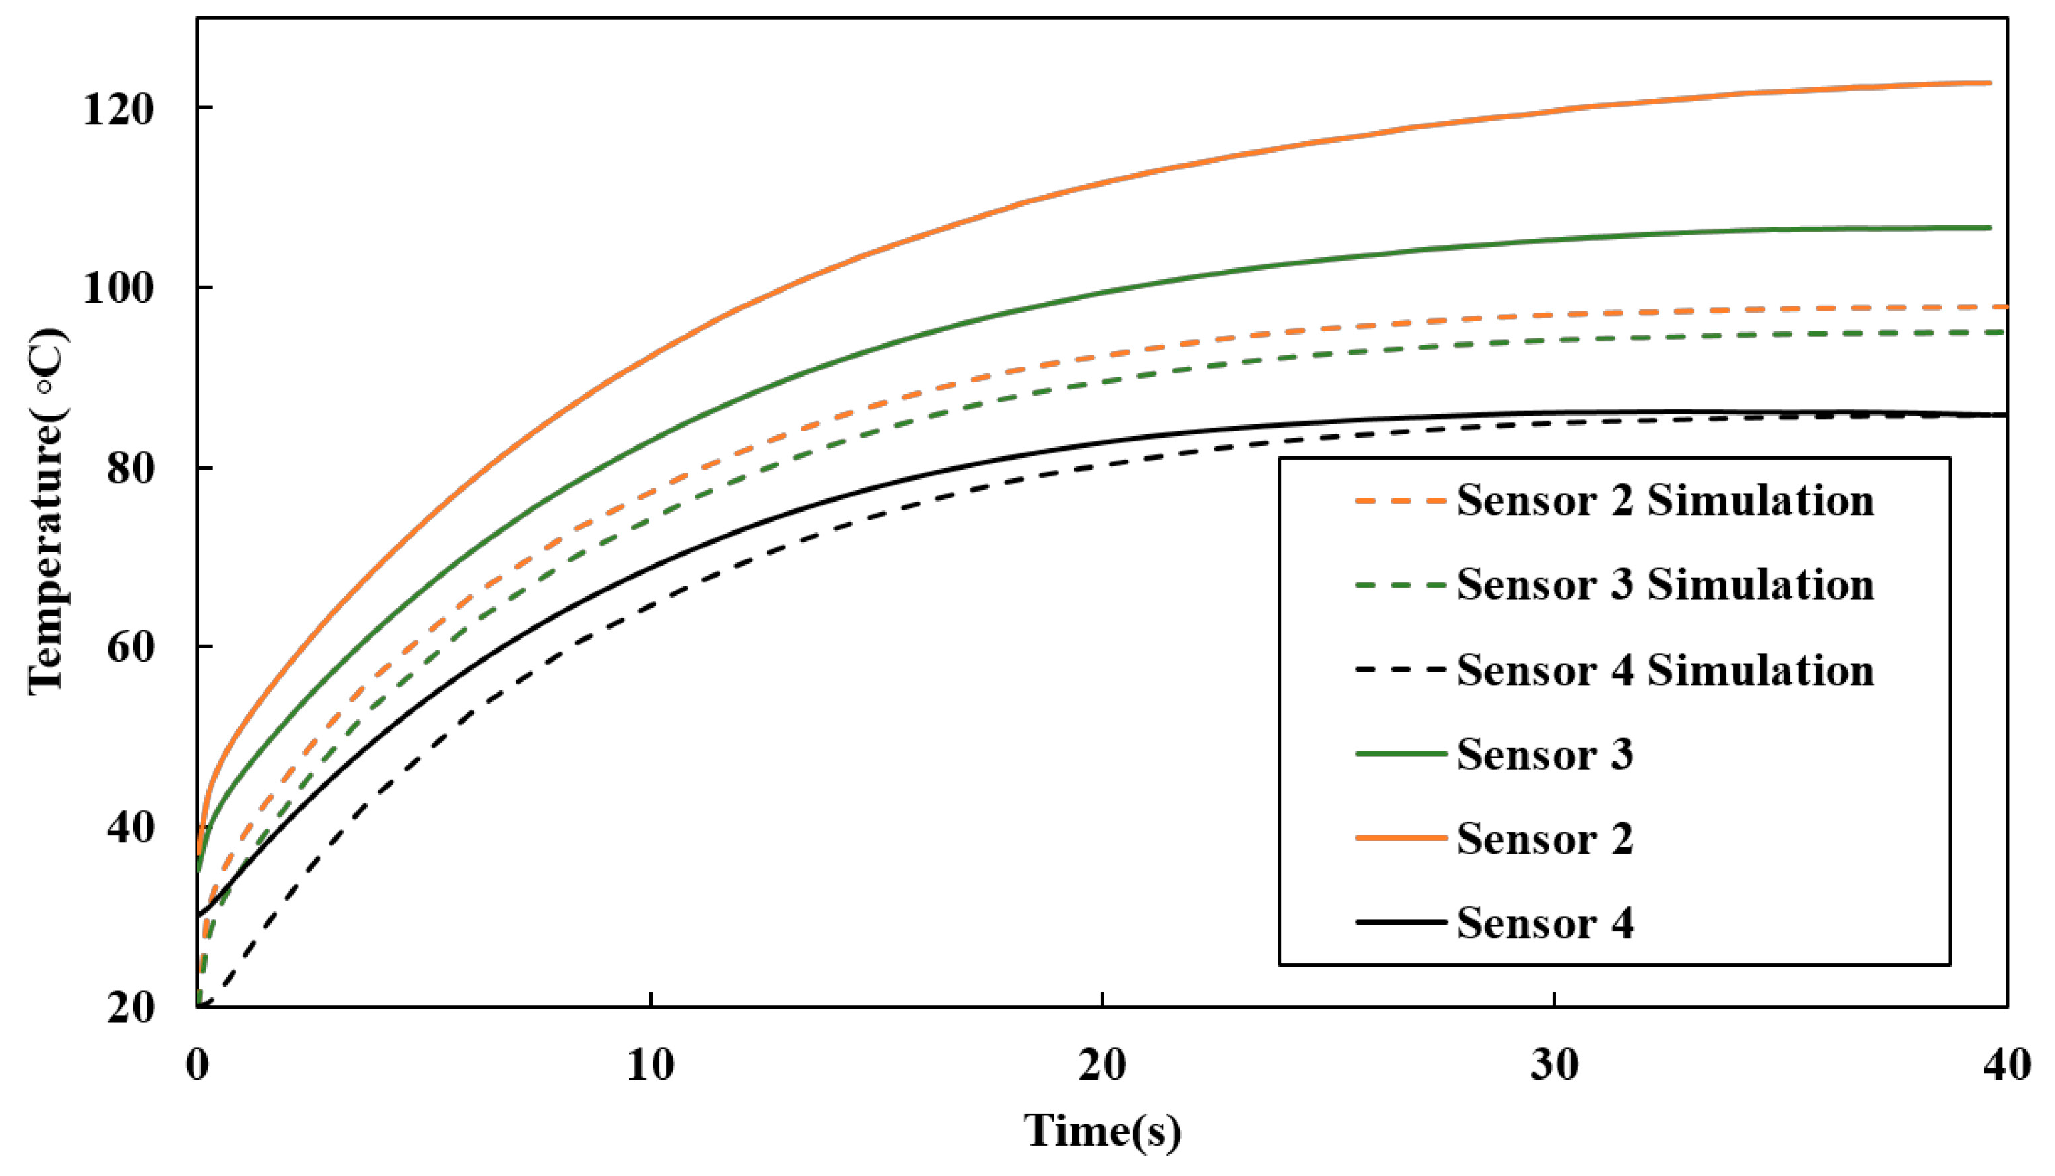
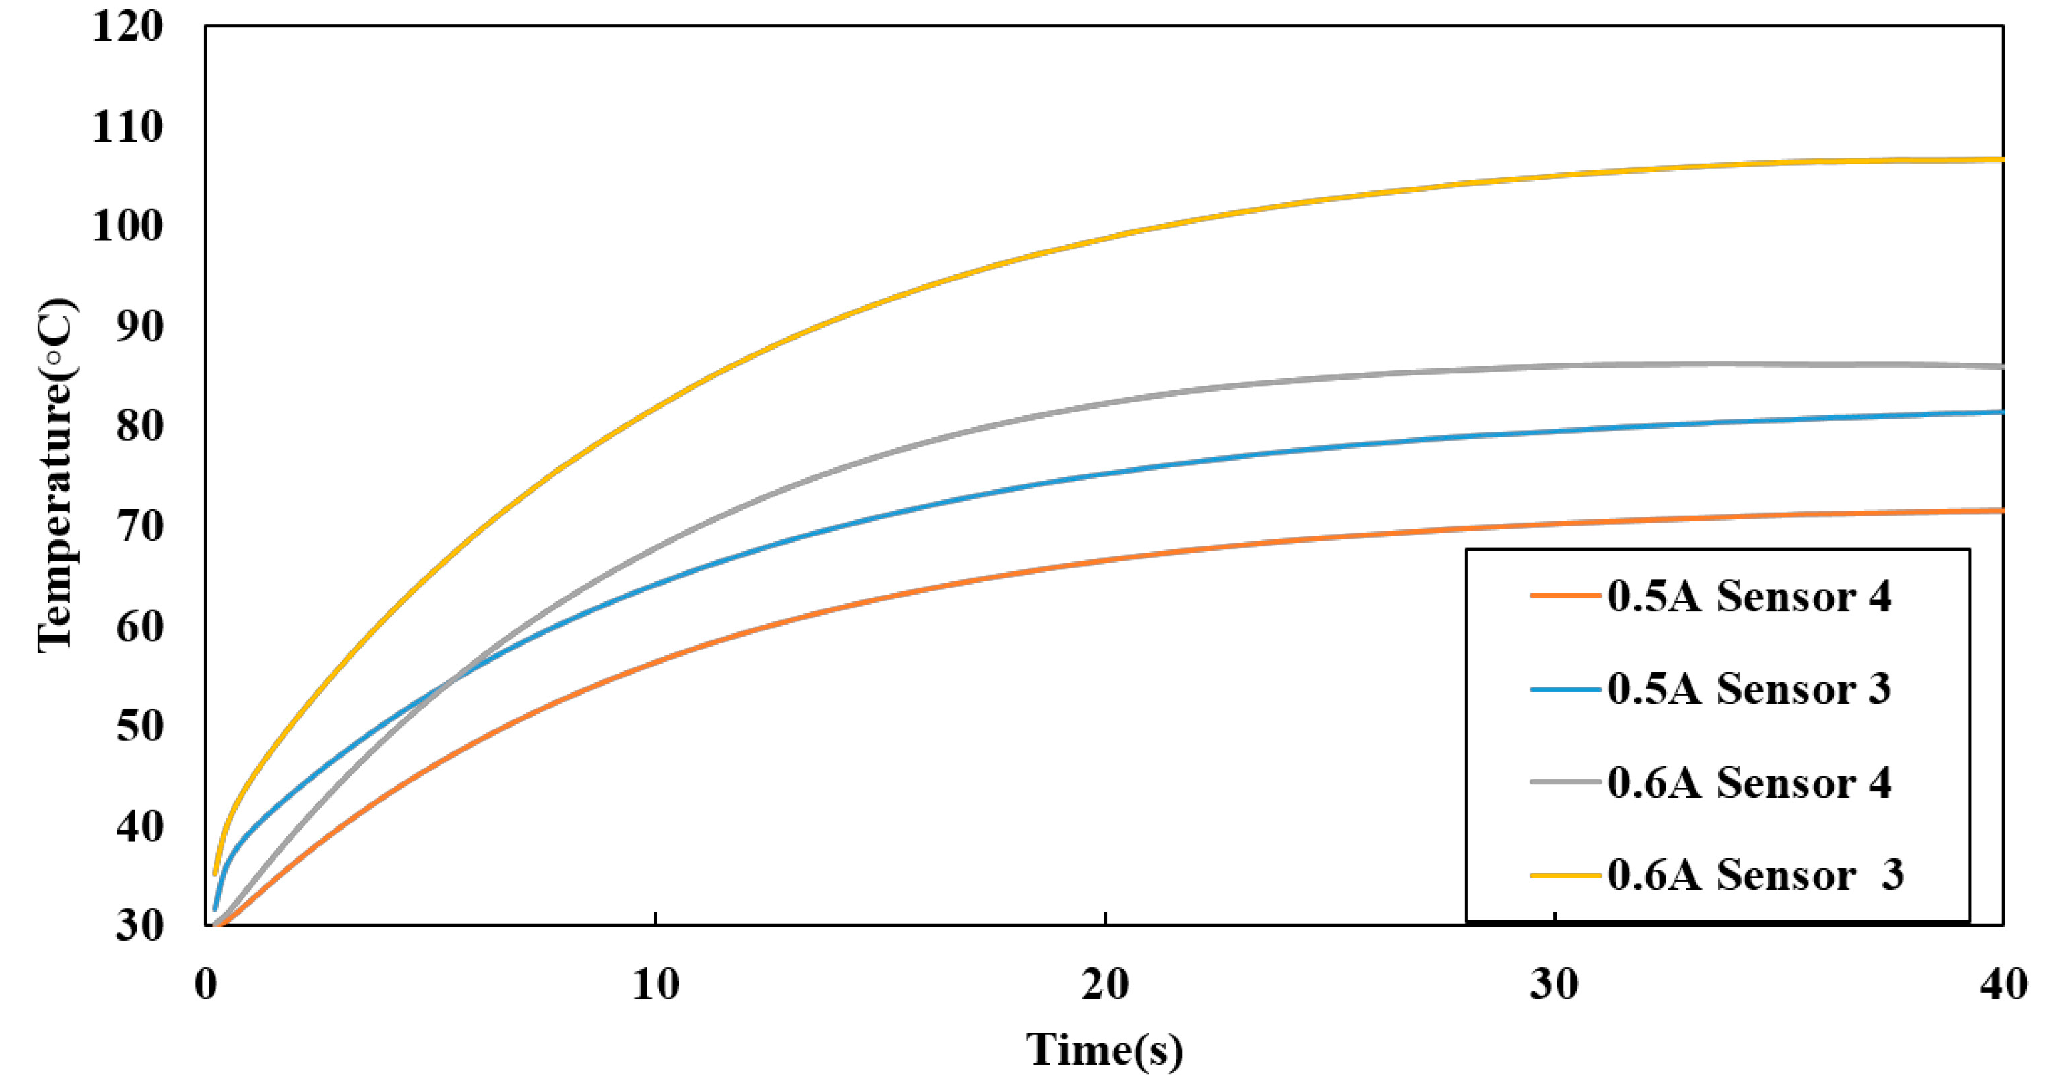
3.4. Experimental Setup

To test the effectiveness of the heater, the heat transfer performance on the chip was quantified by measuring the resistance change of the platinum sensors at different locations and using temperature profiles using infrared thermography. Here, the 700 μm thick column is heated by resistive heating and cooled by an axial flow fan. A fixed current of 0.6 A is applied to the center of the platinum heater, resulting in heating of the column by joule resistive heating. A 12 V DC fan was employed by placing it at a 20 mm distance from the chip to generate sufficient convective heat transfer in order to cool the column. A thermal image of the GC column was captured using a Ti27 infrared digital camera (Fluke, Everett, WA, USA) with an InSb detector. Furthermore, the temperature of the column at different locations was measured using temperature sensors embedded on the column. A calibration of the temperature sensors were carried out prior to the tests to ensure an accurate temperature measurement.
Figure 9 shows the transient response of the heater in response to an applied current of 0.6 A. Here the temperature is measured at three different locations on the column. The total power applied to the chip was calculated to be 10 W, which is sufficient to generate a temperature gradient of 40 °C in less than 40 s.
Figure 9. Transient response of heater design b with a 0.5 A applied constant current.
Micromachines 06 00865 g009
A transient simulation of the heater temperature was performed and the results were compared with the experimental data collected for the 26 by 26 mm column. The simulation data was modified based on the TCR and thermal resistivity of the platinum heater. The simulation response shows a strong agreement between the measured temperatures and the simulation data.
There was a small discrepancy between the experimental and simulation data as a result of the impinging airflow produced by the fan, which results in variation in the local heat transfer coefficient across the column.
The fan to column distance was fixed at 20 mm [19], and the fan was blowing air axially and perpendicular to the surface of the column. The applied power results in the joule heating of the silicon, and the temperature was measured at three different locations on the chip. Figure 10 shows the transient response of the GC column with an embedded heater at two different power levels (I2R0), where I is the high current value and R0 is the base resistance. As expected, the transient heating time constant increases with power and provided a larger temperature gradient from the center to the edge of the column. We expected significant improvement in column performance when the gradient produced results in a temperature different of more than 40 degrees.
Temperature distribution across the silicon column was further investigated using an infrared camera, to confirm the temperature gradients produced at different levels of heat transfer by force convection. Silicon was assumed to diffuse and gray with an emissivity of 0.65 for temperature estimates. Figure 11 shows the IR image of the temperature distribution on the column.
Figure 10. Transient response of the heater at two different power levels.
Micromachines 06 00865 g010
Figure 11. Temperature distribution in Kelvin, estimated from IR thermal imaging with an applied voltage of 13 V applied to heater b with forced convection present.
Micromachines 06 00865 g011

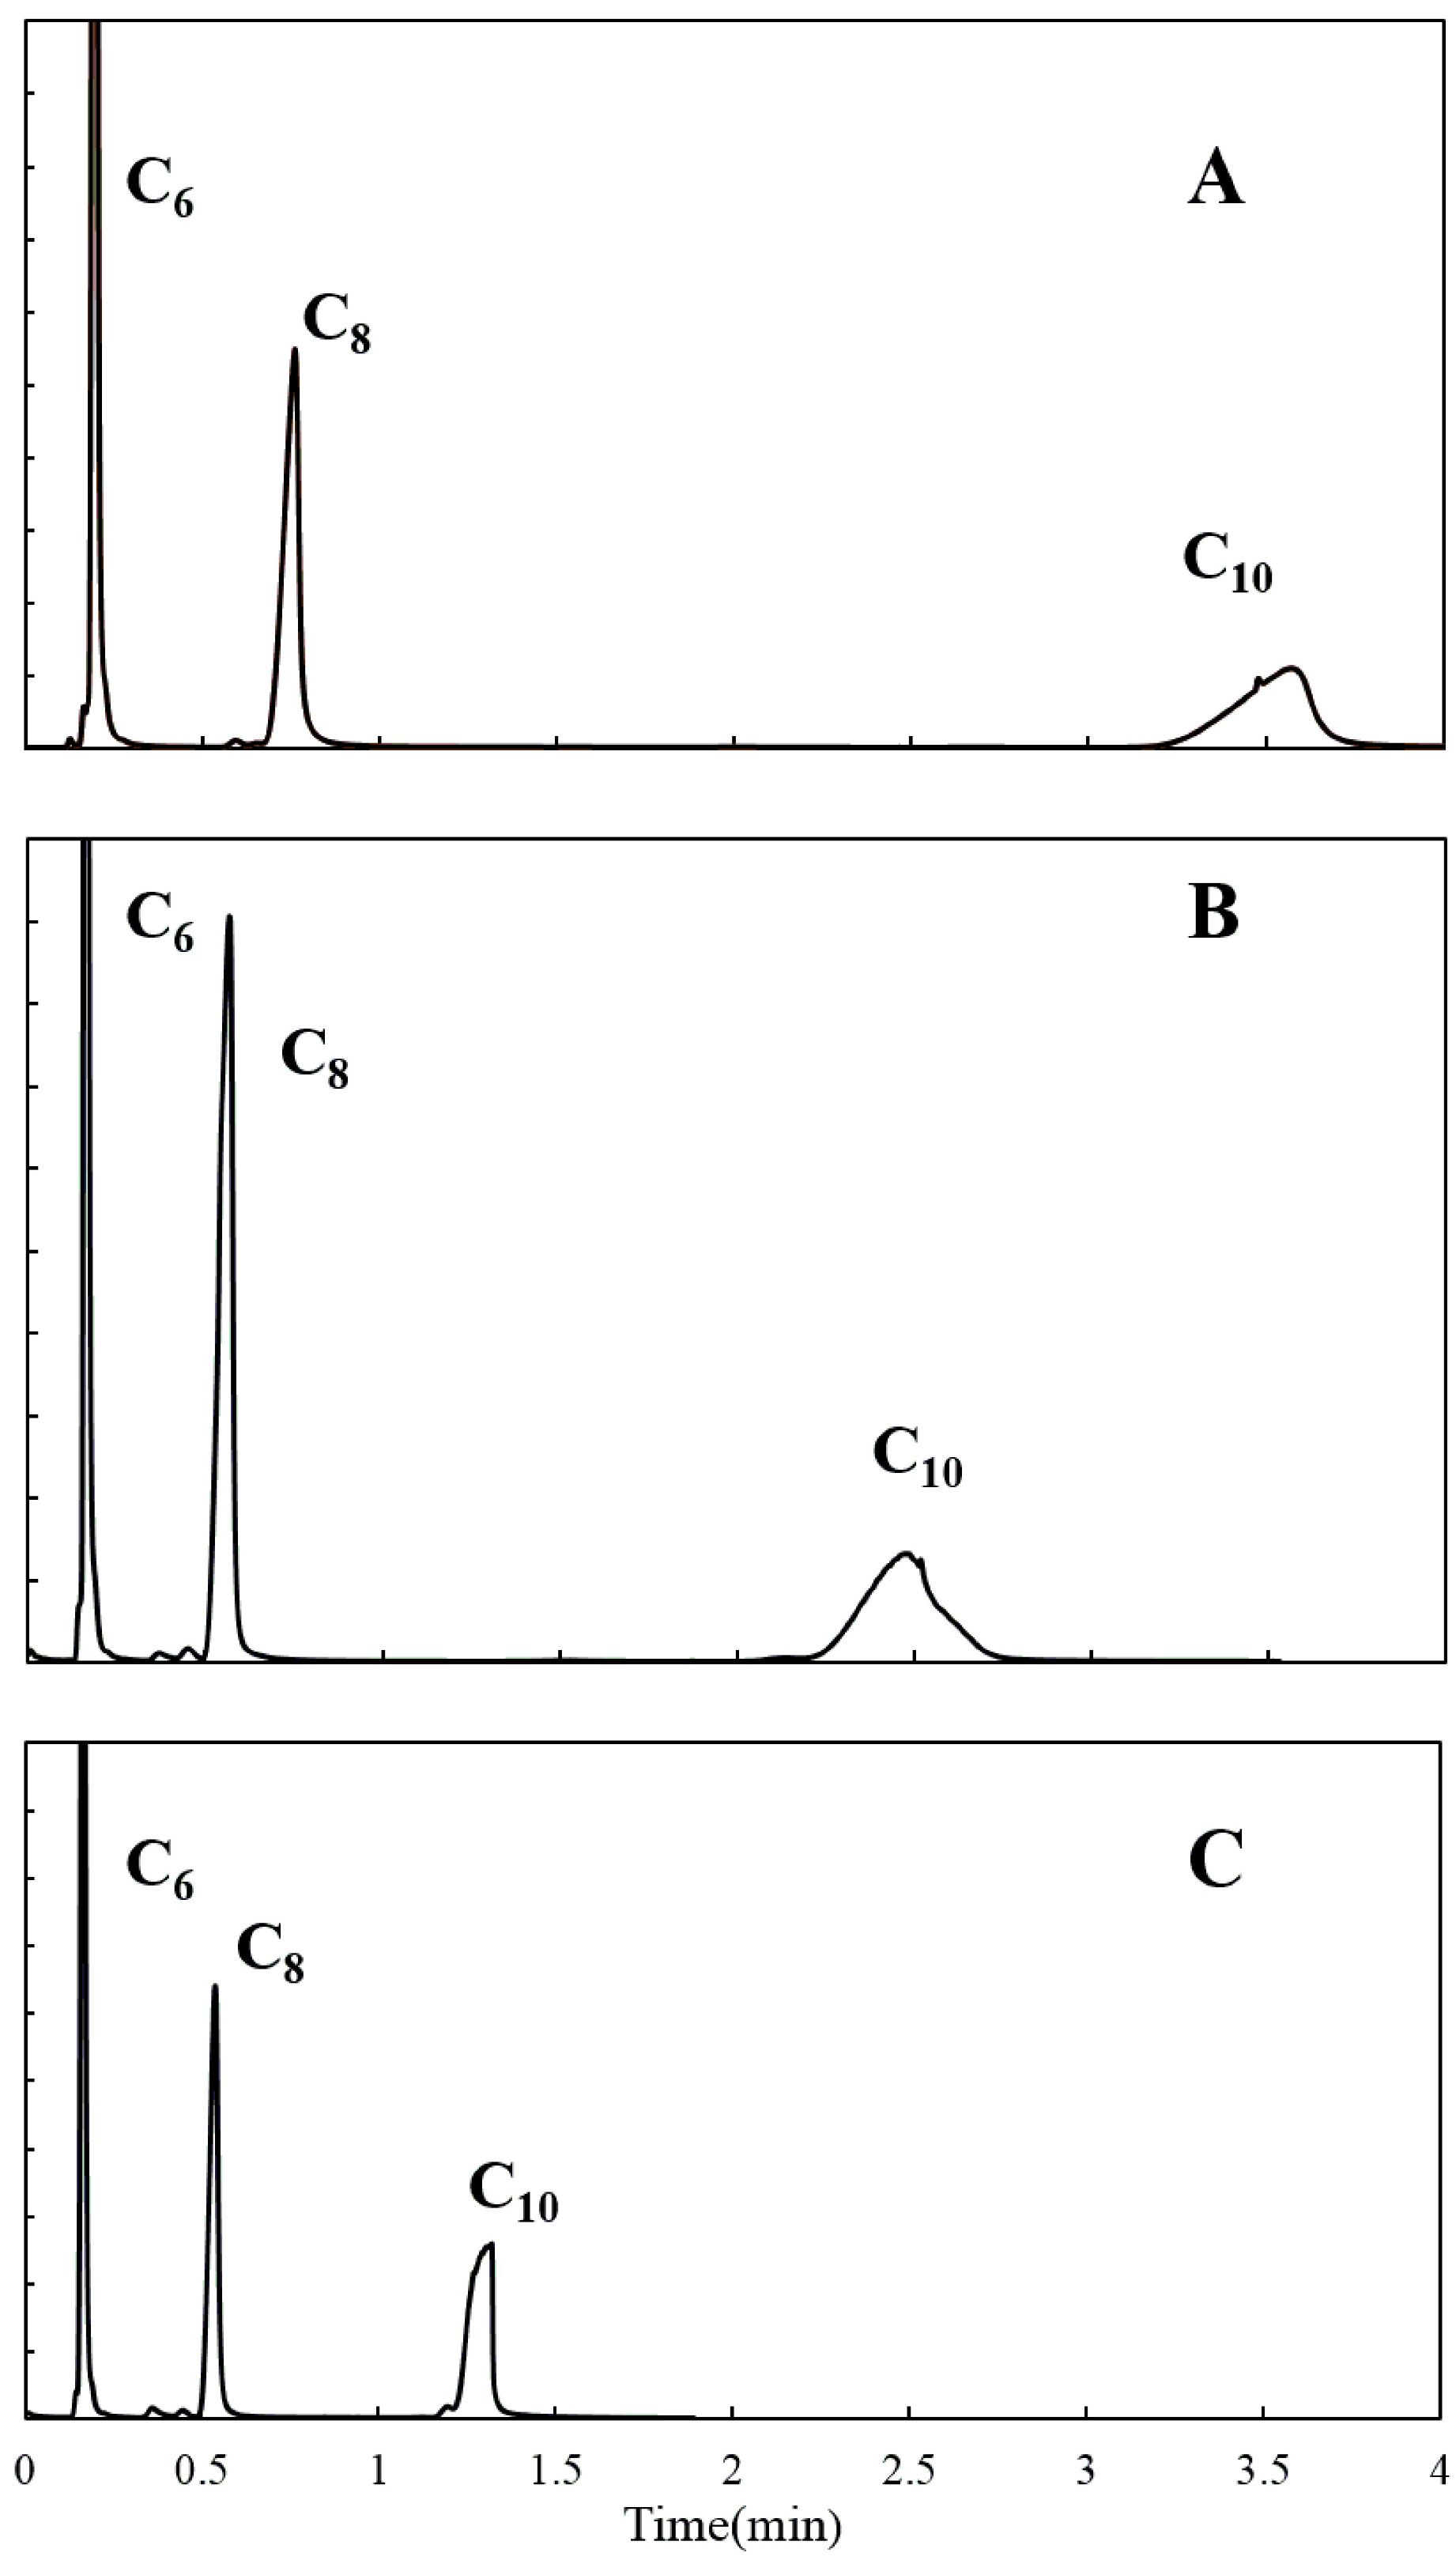
3.5. Column Performance Evaluation

To evaluate the focusing of the peaks band, the 3 meter GC column was operated in isothermal, temperature gradient (TG), and temperature gradient programmed mode. A simple mixture of hydrocarbons (hexane, octane, and decane) was prepared to test the device over an appreciable range of volatilities.
The column was connected to an Agilent 6890 GC-FID (Agilent Technologies, Santa Clara, CA, USA) and the chromatograms of the three compounds were obtained by injecting 1 μL of the mixture sample (split ratio of 400:1, Pressure 16 psi, and 60 °C center temperature. Figure 12A displays the chromatogram obtained for the isothermal run. The peak widths and shapes of hexane (C6) and octane (C8) are acceptable for the length of the chromatographic column, however the peak shape and peak asymmetry of decane (C10) are in clear need of improvement. These runs were performed in triplicate, and the results are consistent within acceptable ranges of statistical variations typically observed in conventional chromatography (5% coefficient of variation or less for retention times, peak area, and peak asymmetry).
Figure 12B shows a chromatogram obtained for a run in which the device was operated isothermally at 60 °C in the thermal gradient mode. The application of the axial thermal gradient is observed to reduce the residence time of the analytes through the system, which results in a reduction in the retention times for all 3 compounds. But more importantly, the peak widths of the analytes are reduced as well, due to the reduction of the peak broadening that typically occurs as the compounds are travelling through the column. Table 3 shows that the peak focusing is significant (from 10%–20% for the compounds in the test sample) and compound specific. It is also observed that for the decane peak the severe tailing that was occurring at isothermal conditions (Figure 12A) has been corrected, and the peak asymmetry has improved substantially. These series of runs were also run in triplicate, and chromatograms were consistent within acceptable statistical ranges. The chromatogram shown in Figure 12B, thus, demonstrates the utility of the negative thermal gradient in the improvement of chromatographic resolution.
Figure 12. Chromatograph achieved using the 3 meter column at pressure 16 psi and inlet temperature of 240 °C with OV-1 stationary phase using (A) 60 °C isothermal temperature (B) temperature gradient with center temperature of 60 °C (C) Temperature gradient programmed at 250 °C/min from 60 to 110 °C.
Micromachines 06 00865 g012
Table 3. Peak focusing calculated for Temperature gradient GC (TGGC) and Temperature programmed gradient GC (TPGGC).
PeakTGGCTPGGC
C611.19%19.15%
C820.60%67.94%
C1012.41%69.03%
Figure 12C shows a chromatogram obtained for a run in which the device was operated in a multidimensional temperature programming mode, meaning that there is a temperature program in time (ranging between 60 and 110 °C at 4.2 °C/s) that is superimposed on the temperature program in distance (the negative thermal gradient that was applied in Figure 12B). The combined effect of these two temperature program regimes is a further reduction in retention times that is accompanied with additional peak focusing. Once again, these improvements are compound specific, but significant enhancement is observed for all compounds in the mixture. For a late eluting compound like decane, the impact of both temperature programs is particularly salient. The fast temperature program in time is responsible for the sharp reduction in retention time, and the temperature programming in distance is responsible for the reduction in the peak width, which enhances the peak height due to the fact that the peak area is unchanged. This combined effect is quite advantageous for separations on columns whose length is markedly shorter than those used in conventional chromatography, because it provides a tool to enhance the chromatographic resolution. Overall, the decane peak’s retention time has been reduced by over a factor of 2, and its peak height has been enhanced by over a factor of 2 between the conditions used in Figure 12A,C. Similar optimization of bi-dimensional temperature programs were tested for compound mixtures containing a wider variety of chemical functional groups (such as alcohols, ketones, and fatty acid methyl esters), and similar observations were obtained.

4. Conclusions/Outlook

In this work, we investigated the effects of temperature gradients as a function of time and position, T(t,x), along the length of a micro-GC column. Three different heater designs were evaluated through numerical modeling using COMSOL Multiphysics. A detailed geometry of the GC column with thin film resistive heaters was used as a basis for the simulation, to investigate the heating and cooling rate, power consumption, and temperature distribution of the new axial heating method for the all silicon micro-GC column. The best geometry with the maximum temperature gradient was selected for microfabrication and evaluated experimentally. The temperature distribution was evaluated using several embedded temperature sensors and IR imaging. The effectiveness of the heater was investigated by separating a mixture of compounds using a 3 meter micro-GC column. The results with a 30 °C gradient from the center to the edge of the column demonstrate enhanced separations for a test mixture of three hydrocarbons that span a range of boiling points of over 100 °C. The dual temperature programming (in time and space) produced improvements in peak focusing that result in significant increases in peak height. This novel temperature programming method demonstrates that the performance of micro-GC columns can be improved using thermal programing techniques to increase analytical performance.

Acknowledgments

The authors would like to thank the staff of Nanotechnology Research Center and the Agricultural Technology Research Program (ATRP) at Georgia Tech Research Institute for financial support.

Author Contributions

Milad Navaei designed and conducted laboratory experiments, analyzed data and wrote the paper. Alireza Mahdavifar helped with the simulation analysis. Jean-Marie D. Dimandja helped with the chromatography experiments. Peter Hesketh provided assitance with technical and cleanroom process. Gary McMurray helped with directing the project.

Conflicts of Interest

The authors declare no conflict of interest.

References

  1. Terry, S.C.; Jerman, J.H.; Angell, J.B. A gas chromatographic air analyzer fabricated on a silicon wafer. IEEE Trans. Electron Devices 1979, 26, 1880–1886. [Google Scholar] [CrossRef]
  2. Reston, R.R.; Kolesar, E.S. Silicon-micromachined gas chromatography system used to separate and detect ammonia and nitrogen dioxide. I. Design, fabrication, and integration of the gas chromatography system. J. Microelectromech. Syst. 1994, 3, 134–146. [Google Scholar] [CrossRef]
  3. Lu, C.-J.; Steinecker, W.H.; Tian, W.-C.; Oborny, M.C.; Nichols, J.M.; Agah, M.; Potkay, J.A.; Chan, H.K.L.; Driscoll, J.; Sacks, R.D.; et al. First-generation hybrid MEMS gas chromatograph. Lab Chip 2005, 5, 1123–1131. [Google Scholar] [CrossRef] [PubMed]
  4. Yamanaka, T.; Matsumoto, R.; Nakamoto, T. Study of recording apple flavor using odor recorder with five components. Sens. Actuators B Chem. 2003, 89, 112–119. [Google Scholar] [CrossRef]
  5. Albert, K.J.; Walt, D.R.; Gill, D.S.; Pearce, T.C. Optical multibead arrays for simple and complex odor discrimination. Anal. Chem. 2001, 73, 2501–2508. [Google Scholar] [CrossRef] [PubMed]
  6. Kim, S.K.; Chang, H.; Zellers, E.T. Microfabricated gas chromatograph for the selective determination of trichloroethylene vapor at sub-parts-per-billion concentrations in complex mixtures. Anal. Chem. 2011, 83, 7198–7206. [Google Scholar] [CrossRef] [PubMed]
  7. Zampolli, S.; Elmi, I.; Mancarella, F.; Betti, P.; Dalcanale, E.; Cardinali, G.C.; Severi, M. Real-time monitoring of sub-ppb concentrations of aromatic volatiles with a MEMS-enabled miniaturized gas-chromatograph. Sens. Actuators B Chem. 2009, 141, 322–328. [Google Scholar] [CrossRef]
  8. Garg, A.; Akbar, M.; Vejerano, E.; Narayanan, S.; Nazhandali, L.; Marr, L.C.; Agah, M. Zebra G.C: A mini gas chromatography system for trace-level determination of hazardous air pollutants. Sens. Actuators B Chem. 2015, 212, 145–154. [Google Scholar] [CrossRef]
  9. Zhukhovitskii, A.A.; Zolotareva, O.V.; Sokolov, V.A.; Turkel’taub, N.M. New method of chromatographic analysis. Dokl. Akad. Nauk SSSR 1951, 77, 435–438. [Google Scholar]
  10. Jain, V.; Phillips, J.B. High-speed gas chromatography using simultaneous temperature gradients in both time and distance along narrow-bore capillary columns. J. Chromatogr. Sci. 1995, 33, 601–605. [Google Scholar] [CrossRef]
  11. Phillips, J.B.; Jain, V. On-column temperature programming in gas chromatography using temperature gradients along the capillary column. J. Chromatogr. Sci. 1995, 33, 541–550. [Google Scholar] [CrossRef]
  12. Zhao, H.; Yu, L.; Zhang, J.; Guan, Y. Characteristics of TGPGC on short micro packed capillary column. Anal. Sci. 2002, 18, 93–95. [Google Scholar] [CrossRef] [PubMed]
  13. Agah, M.; Potkay, J.A.; Lambertus, G.; Sacks, R.; Wise, K.D. High-performance temperature-programmed microfabricated gas chromatography columns. J. Microelectromechan. Syst. 2005, 14, 1039–1050. [Google Scholar] [CrossRef]
  14. Mahdavifar, A.; Aguilar, R.; Peng, Z.; Hesketh, P.J.; Findlay, M.; Stetter, J.R.; Hunter, G.W. Simulation and fabrication of an ultra-low power miniature microbridge thermal conductivity gas sensor. J. Electrochem. Soc. 2014, 161, B55–B61. [Google Scholar] [CrossRef]
  15. Mahdavifar, A.; Navaei, M.; Aguilar, R.; Hesketh, P.J.; Hunter, G.; Findlay, M.; Stetter, J.R. Transient Thermal Response of Micro TCD for Identification of Gases. In Proceedings of the 224th ECS Meeting, San Francisco, CA, USA, 27 October–1 November 2013. Abstract 2795.
  16. Butts, D.A.; Taarea, D. Chapter 19—Electrical properties. In Smithells Metals Reference Book, 8th ed.; Gale, W.F., Totemeier, G.C., Eds.; Butterworth-Heinemann: Oxford, UK, 2004. [Google Scholar]
  17. Navaei, M.; Xu, J.; Mahdavifar, A.; Dimandja, J.; McMurray, G.; Hesketh, P. Micro-fabrication of all silicon 3-meter GC column using gold eutectic fusion bonding. J. Electrochem. Soc. 2015, in press. [Google Scholar]
  18. Navaei, M.; Xu, J.; Hesketh, P.; Wallace, R.; McMurray, G. Micro gas chromatography system for detection of volatile organic compounds released by Fungi. In Proceedings of the 224th ECS Meeting, San Francisco, CA, USA, 27 October–1 November 2013.
  19. Stafford, J.; Walsh, E.; Egan, V.; Grimes, R. Flat plate heat transfer with impinging axial fan flows. Int. J. Heat Mass Transf. 2010, 53, 5629–5638. [Google Scholar] [CrossRef]

