Article

Analysis of the Micromachining Process of Dielectric and Metallic Substrates Immersed in Water with Femtosecond Pulses

Laser Research Centre, Vilnius University, Saulėtekio Av. 10, Vilnius LT-10223, Lithuania
*
Author to whom correspondence should be addressed.
Micromachines 2015, 6(12), 2010-2022; https://doi.org/10.3390/mi6121471
Submission received: 29 October 2015 / Revised: 8 December 2015 / Accepted: 14 December 2015 / Published: 17 December 2015
(This article belongs to the Special Issue Laser Micromachining and Microfabrication)

Abstract

:
Micromachining of 1 mm thick dielectric and metallic substrates was conducted using femtosecond pulse generated filaments in water. Several hundred microjoule energy pulses were focused within a water layer covering the samples. Within this water layer, non-linear self-action mechanisms transform the beam, which enables higher quality and throughput micromachining results compared to focusing in air. Evidence of beam transformation into multiple light filaments is presented along with theoretical modeling results. In addition, multiparametric optimization of the fabrication process was performed using statistical methods and certain acquired dependencies are further explained and tested using laser shadowgraphy. We demonstrate that this micromachining process exhibits complicated dynamics within the water layer, which are influenced by the chosen parameters.

Graphical Abstract

1. Introduction

Laser micromachining is a unique tool that has been studied for more than several decades [1]. In recent times, much more attention has been directed to femtosecond micromachining regimes. In this case, ultra-short laser pulses are employed that enable access to high intensity (> 10 12 W / cm 2 ) light that builds up due to sharp focusing and high temporal compression of the laser pulses. At such high intensities, additional laser-matter interaction mechanisms take effect [2]. Namely, energy can be efficiently absorbed through non-linear absorption mechanisms. Theoretically, any type of material can therefore be machined [3]. In the case of pulse propagation in transparent media, additional effects come into play: beam self-actions may lead to significant intensity profile transformations and multifilamentation [4] that affect experimental outcomes (modified shape, length, quality of micromachined grooves [5]). Such laser systems present the ability to perform a substantially higher number of micromachining tasks and are invariant to the type of material; in addition, the active non-linear phenomena provide additional degrees of freedom when optimization or delicate tailoring procedures are required.
Non-transparent materials are typically cut and drilled by direct ablation techniques (front side) [6,7,8,9,10]. While experimental setups are easily controlled, they suffer from lack in fabrication throughput and end-quality of the machined samples. In addition, spatio-temporal enhanced front-side ablation [11,12,13] is used when high quality cuts or precise patterns are required. For transparent materials, all of the above-mentioned techniques are applicable, and, in addition, several modification-based techniques exist: chemical etching of laser-induced bulk modifications [14,15,16,17,18,19], dicing techniques [20,21] etc. These techniques demonstrate the exceptional quality of the machined samples and very good fabrication throughput results; however, they are not applicable for all transparent materials and involve working with highly toxic chemicals. Though the techniques presented above are capable of performing quality fabrication, implementation typically requires high numerical aperture (NA) focusing conditions, precise positioning and motion translation stages and additional components leading to high equipment cost and complex operation [22]. Furthermore, gases and nanoparticles, some of which are toxic [23,24,25], are produced during fabrication processes and inevitably contaminate the ambient air. Moreover, in order to achieve greater fabrication quality, one must sacrifice time-efficiency or vice versa as in the case of conventional (mechanical) machining methods [26].
In the case of material removal via ablation, even though femtosecond laser micromachining is best suited in terms of quality relative to other laser systems, imperfections (heat affected areas, cracks, edge chipping, conicity [27,28]) still occur during fabrication and are due to several reasons. Firstly, heat build-up in the impinged regions may occur during multiple pulse interaction leading to heat affected zones (HAZ), cracking and chipping [29,30]. Secondly, when fabricating with Gaussian pulses, the energy stored in the tail of the pulse is considerably less than at the center, and even though the tails do not produce strong ablation, absorption of energy still occurs and is transformed into thermal energy, which leads to HAZ, ripple formation or even melted regions [31].
In this paper, we present cutting and drilling results for metallic and dielectric material fabrication by employing a novel micromachining approach [32,33]. We demonstrate that the addition of a thin water layer on top of the samples results in superior micromachining quality and throughput due to additional spatial shaping of ultrashort pulses, cooling and the cleaning properties of the covering fluid. This suggested approach is advantageous in various ways: e.g., axial translation is not required while several-millimeter deep structures can be fabricated, and additional cooling is provided due to the added water layer, which prevents temperature and tensile stress gradient formation. Temperature-induced tensile stress is particularly a problem for micromachining brittle material, since absorption of the beam’s peripheral region and plasma-material coupling [34] leads to local heat build-up and ultimately to cracking and shattering of the samples. Due to a portion of the energy being absorbed in the water and ablation processes occurring there, cavitation bubbles form that remove ablated particles upon collapse during fabrication, and prevent debris redeposition on the samples [35]. Moreover, the system is simple, and is comprised of only a few components making it easy to use relative to other femtosecond micromachining systems. Since a water layer is added on top of the samples, additional degrees of freedom arise in terms of optimization. Therefore, full empirical understanding of the process requires testing the experimental outcomes. For optimization purposes, it was decided to vary the repetition rate of the laser (reciprocal to pulse energy), since this parameter is easily varied by the laser software and can remain stable throughout the operation, the focal position of the beam (position of focus relative to the surface of the sample), the scanning speed (pulse overlap) of the beam along the surface of the sample, and thickness of the water layer covering the samples. We demonstrate successful optimization of the process by using design of experiment (DOE) [36] techniques. In addition, we introduced a shadowgraphic imaging system that helps explain acquired dependencies.

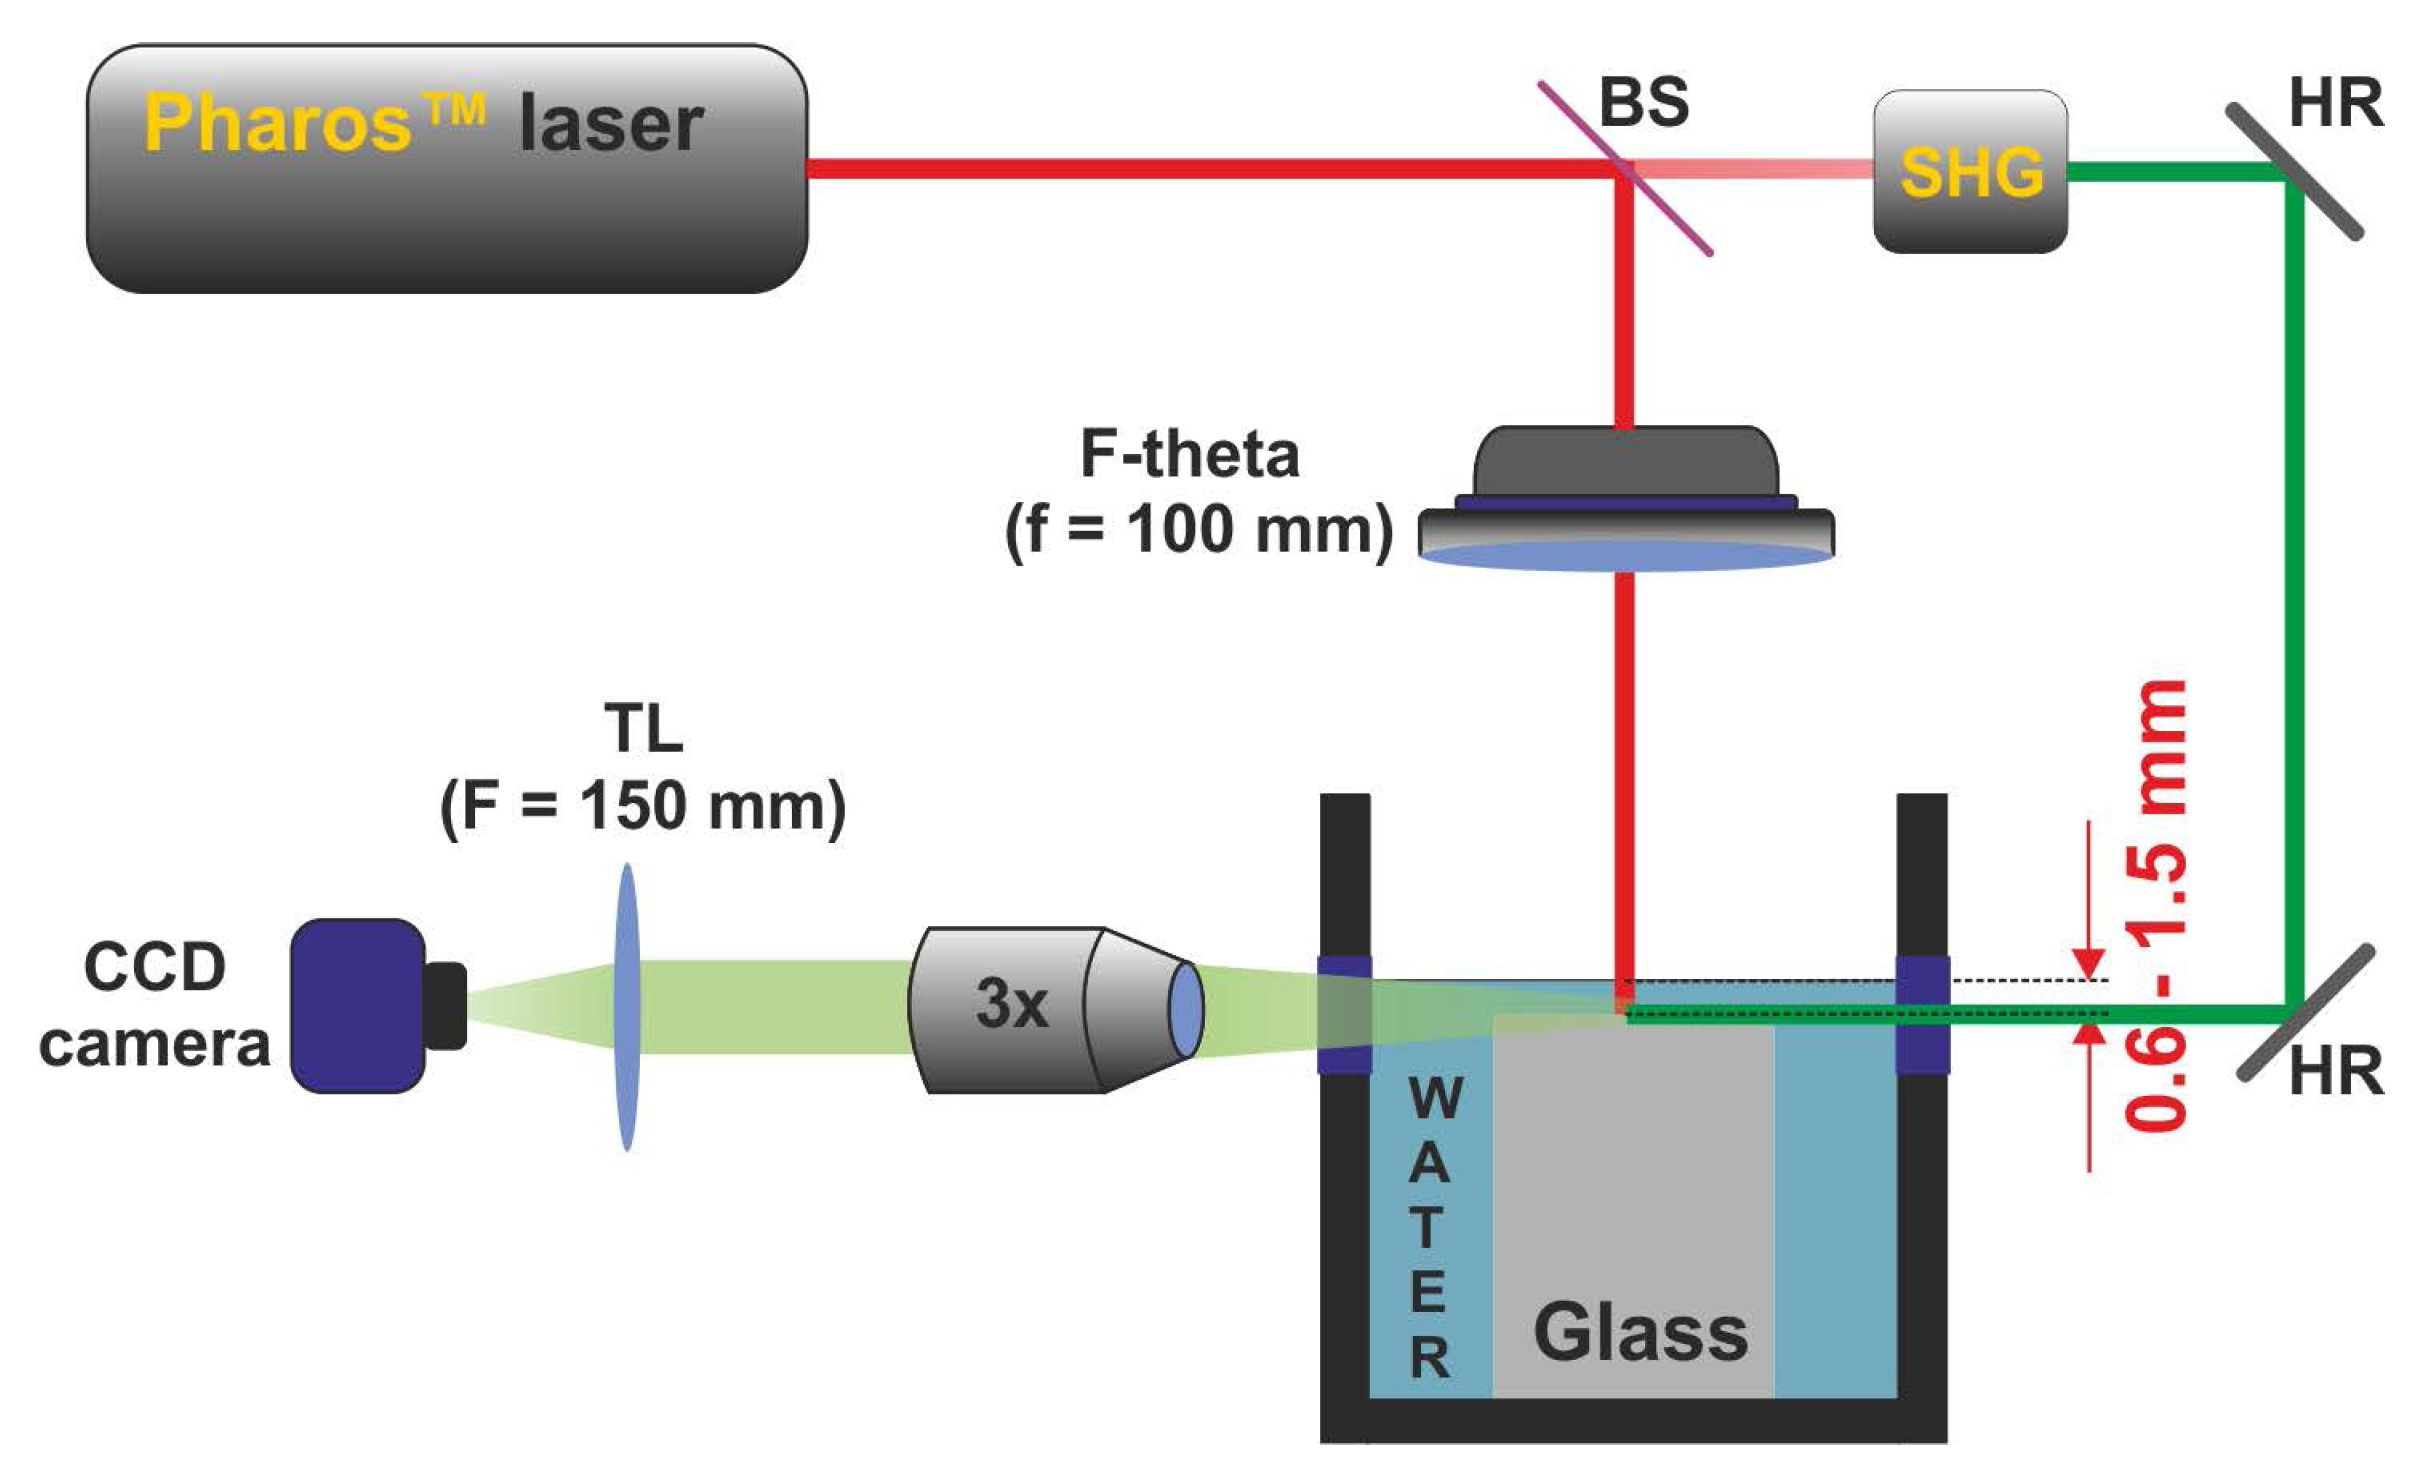
2. Experimental Section

The experiments were carried out using the Yb:KGW femtosecond laser system Pharos® (Light Conversion Ltd, Vilnius, Lithuania). A two-axis galvanometric scanner (ScanLab Inc., Garching, Germany) was controlled by fabrication software SCA (Workshop of Photonics Ltd, Vilnius, Lithuania). The beam was focused using an f-theta lens (f = 100 mm) below the samples, which were covered with a water layer so that filament formation would occur near the interface of the samples. The investigated samples were 1 mm thick soda-lime glass and stainless steel. An illustration of the micromachining setup is displayed in Figure 1.
Figure 1. Micromachining setup. The laser beam directed by a scanner is focused using an f-theta lens onto a sample that is covered with a thin layer of water. Within the water layer, the pulses undergo transformation to multiple filaments, which are used for micromachining. Average laser power—10 W, repetition rate—33.3–600 kHz, pulse duration—260 fs, wavelength—1026 nm.
Micromachines 06 01471 g001

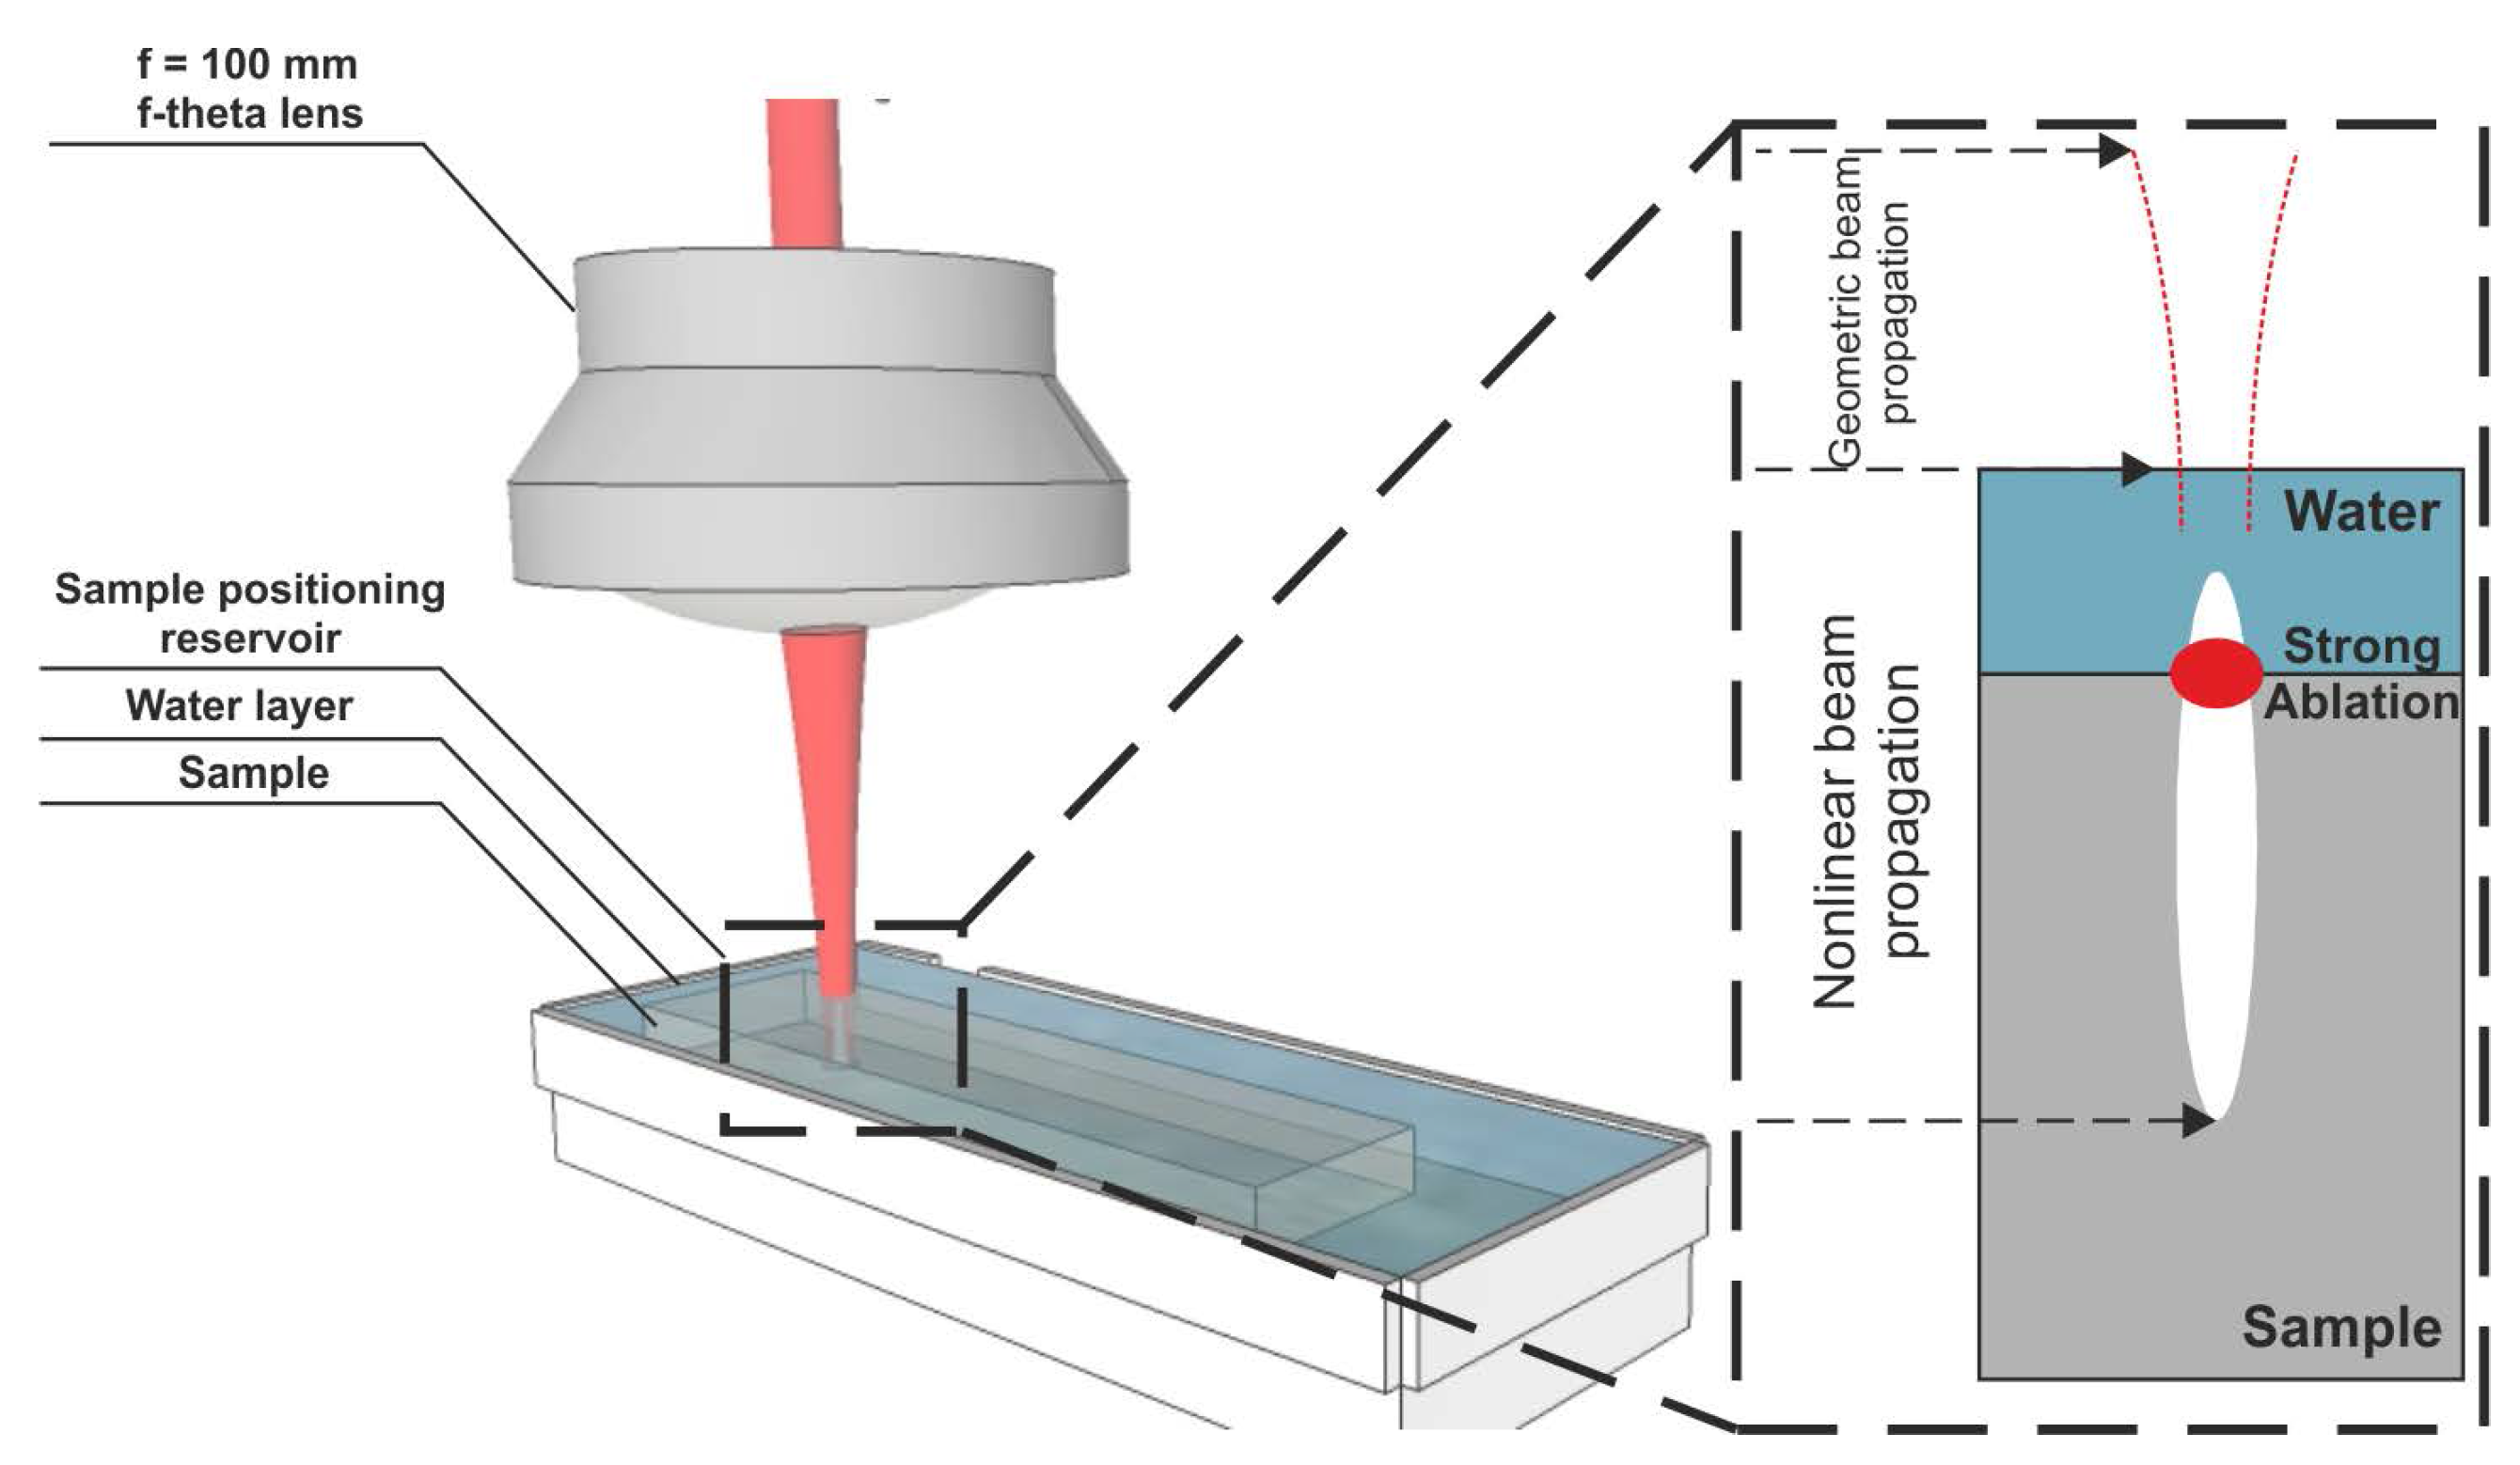
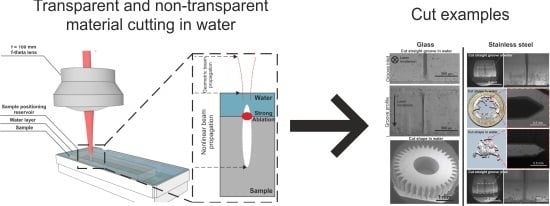
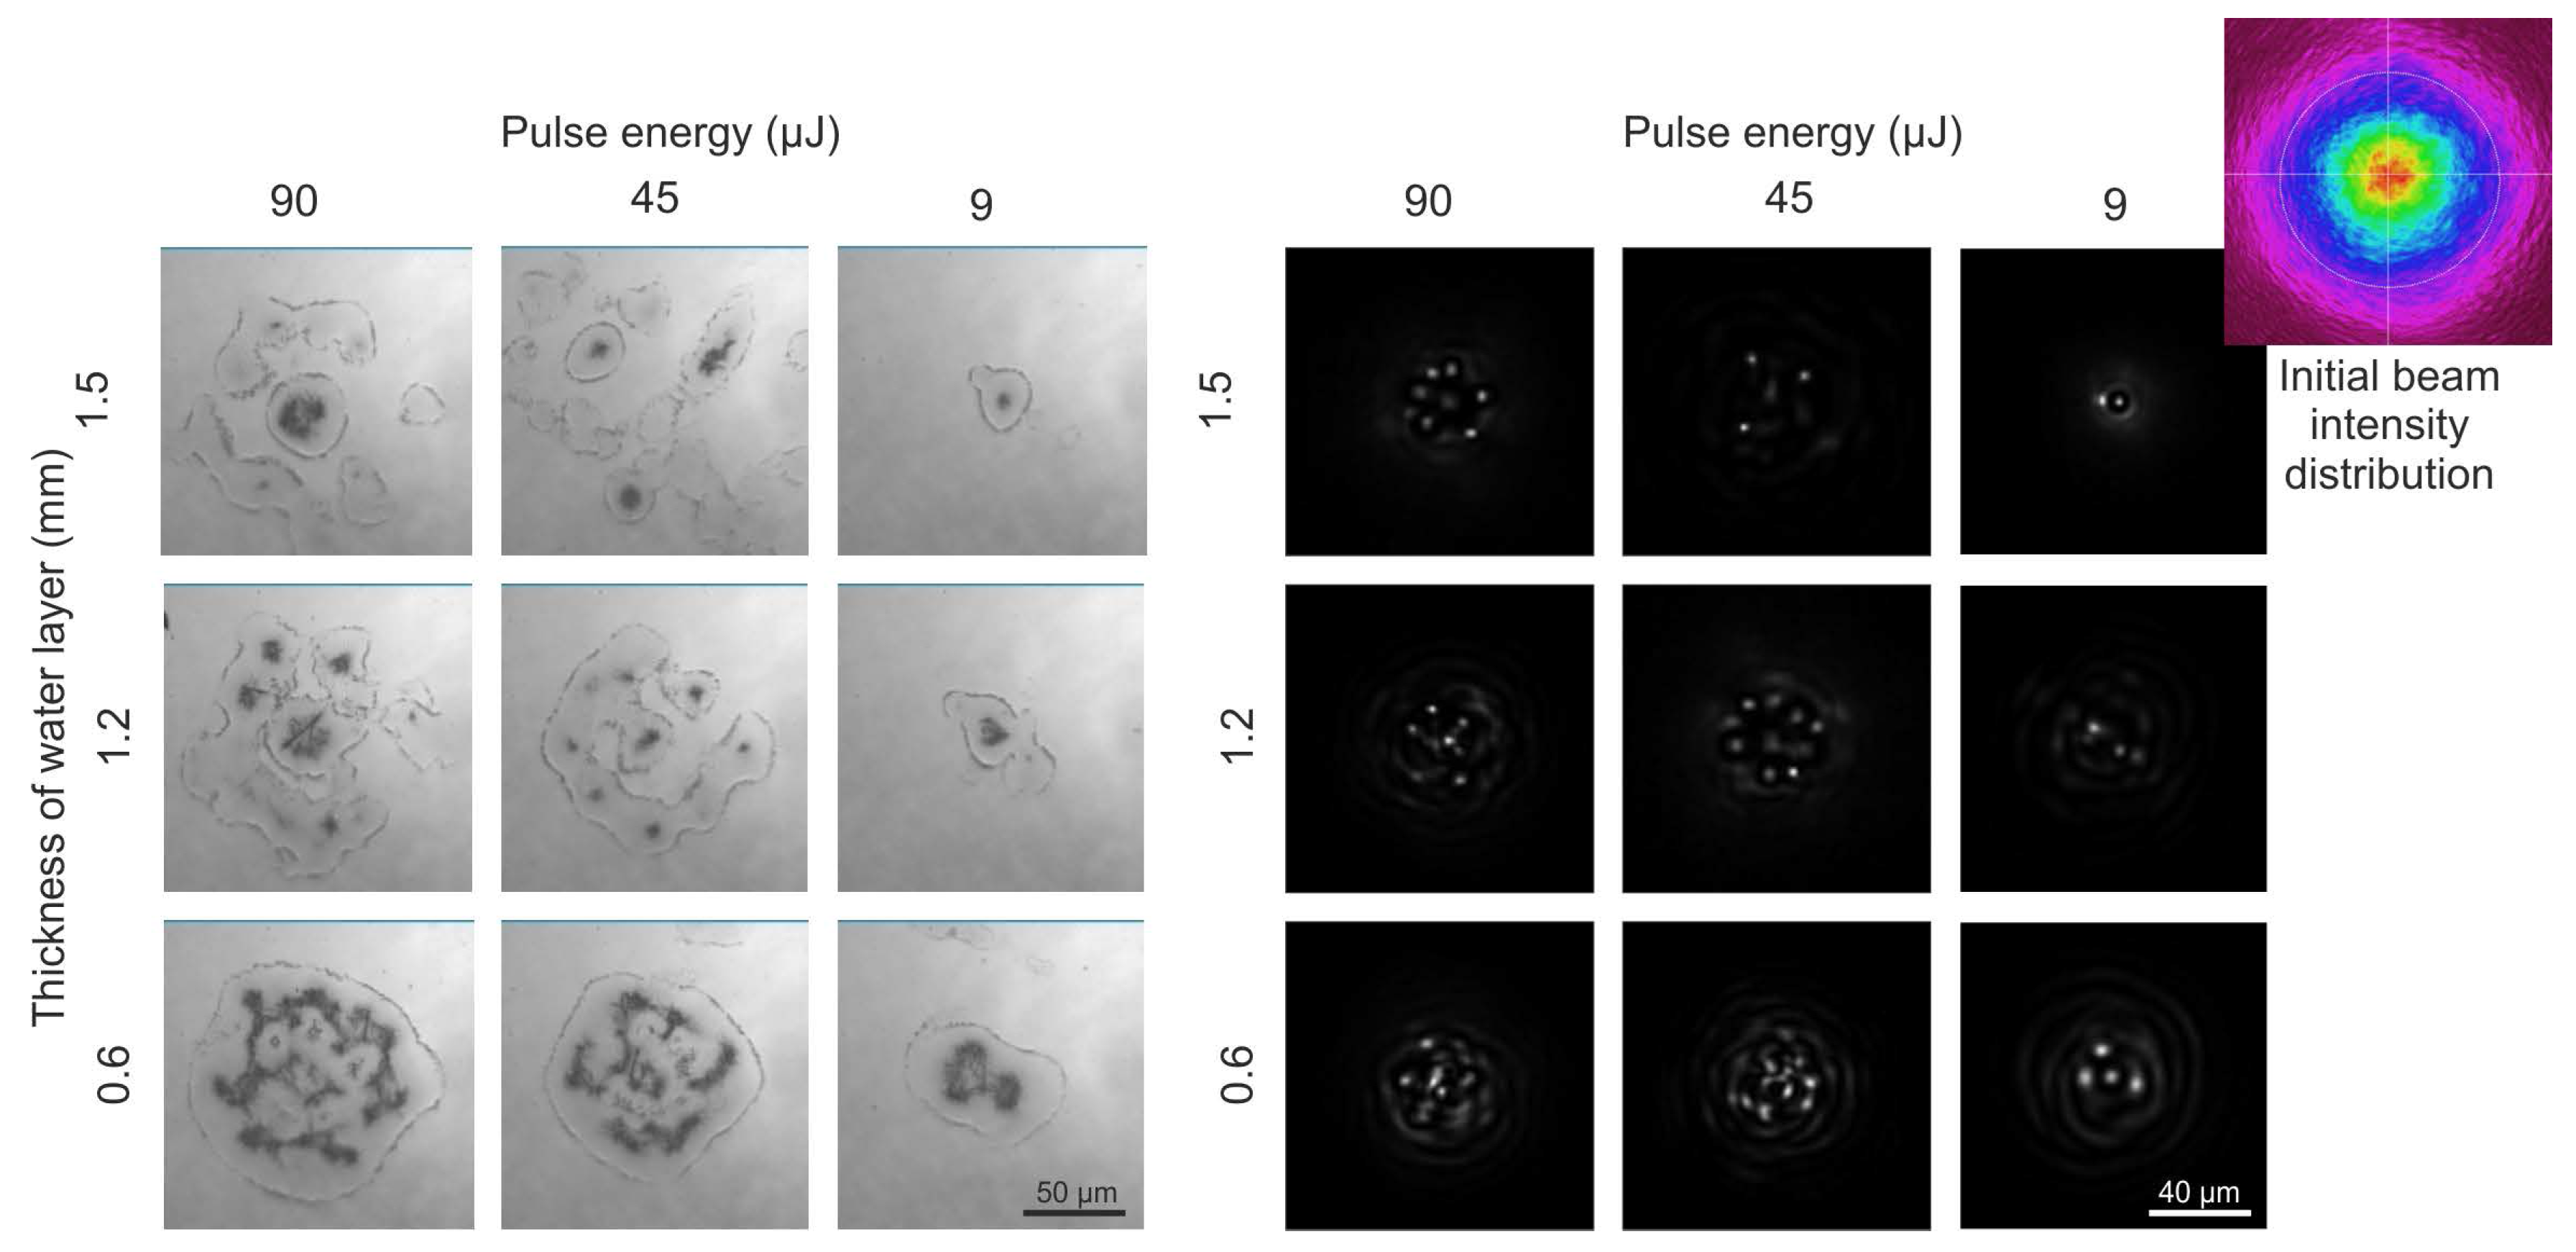
2.1. Ablation Patterns Acquired while Focusing Intense Laser Pulses in Water

A series of experiments were conducted on glass samples coated with chromium in order to observe damage patterns caused by transformed femtosecond pulses in the water layer. The thickness of the water layer was varied from 0.6 mm to 1.5 mm. The focal position was set approximately 1 mm beneath the water layer. In order to numerically reproduce the behavior of the pump beam in focusing Kerr media, we carried out simulations by using an extended paraxial model neglecting time dependent effects, as well as electron plasma generation and related defocusing effects. Despite its simplicity, the model, describes both key features of asymptotic (evolution of the beam filaments and its surrounding rings) and transient regimes [37].
We consider the evolution of a linearly polarized beam propagating with a central frequency ω 0 and wave-number k = ω 0 n / c . Here n = 1 . 3266 is the linear refraction index of the water at a propagation wavelength of λ = 1026 nm. Since multiple filamentation involves a complete break-up of the beam’s cylindrical symmetry, the complex scalar envelope A ( x , y , z ) of the beam in a non-linear medium with included diffraction, Kerr non-linearity and non-linear losses due to multiphoton absorption (MPA), evolves according to the modified non-linear Schrodinger equation in (2 + 1) dimensions. In the frame of the adopted paraxial approximation moving at the group velocity v g = [ k ( ω ) / ω ] - 1 , the resulting equation for the field amplitude, A ( x , y , z ) reads:
A z = i 2 k 2 A x 2 + 2 A y 2 + i ω 0 n 2 c | A | 2 A - β ( K ) 2 | A | 2 K - 2 A
where z is distance of propagation and n 2 = 4 . 1 × 10 - 16 W / cm 2 is the non-linear index of refraction. β ( K ) is the multiphoton absorption coefficient. β ( 5 ) = 10 - 47 cm 7 W - 4 . In the simplest (atomic) case, the coefficient (where K is the number of photons involved in the process) may be estimated from the Keldysh formulation [38]. However, this model does not include the above-threshold ionization effect (i.e., absorption of more photons than are required for ionization by valence electrons) and the accuracy of such estimations often fails for high-intensity ultra-short pulses. Alternatively, the MPA coefficient can be deduced from experiments [39]. The intensity distribution of the incident beam was taken according to an experimentally measured beam pattern with an initial amplitude at the maximum A 0 = 2 P c r / π w 0 2 , beam waist w 0 and infinite initial radius of curvature. The non-linear differential Equation (1) was solved numerically using the split-step procedure to separate non-linear and dispersive parts inside each step. The results of the modeling are displayed in the following sections and compared with the experimental results.

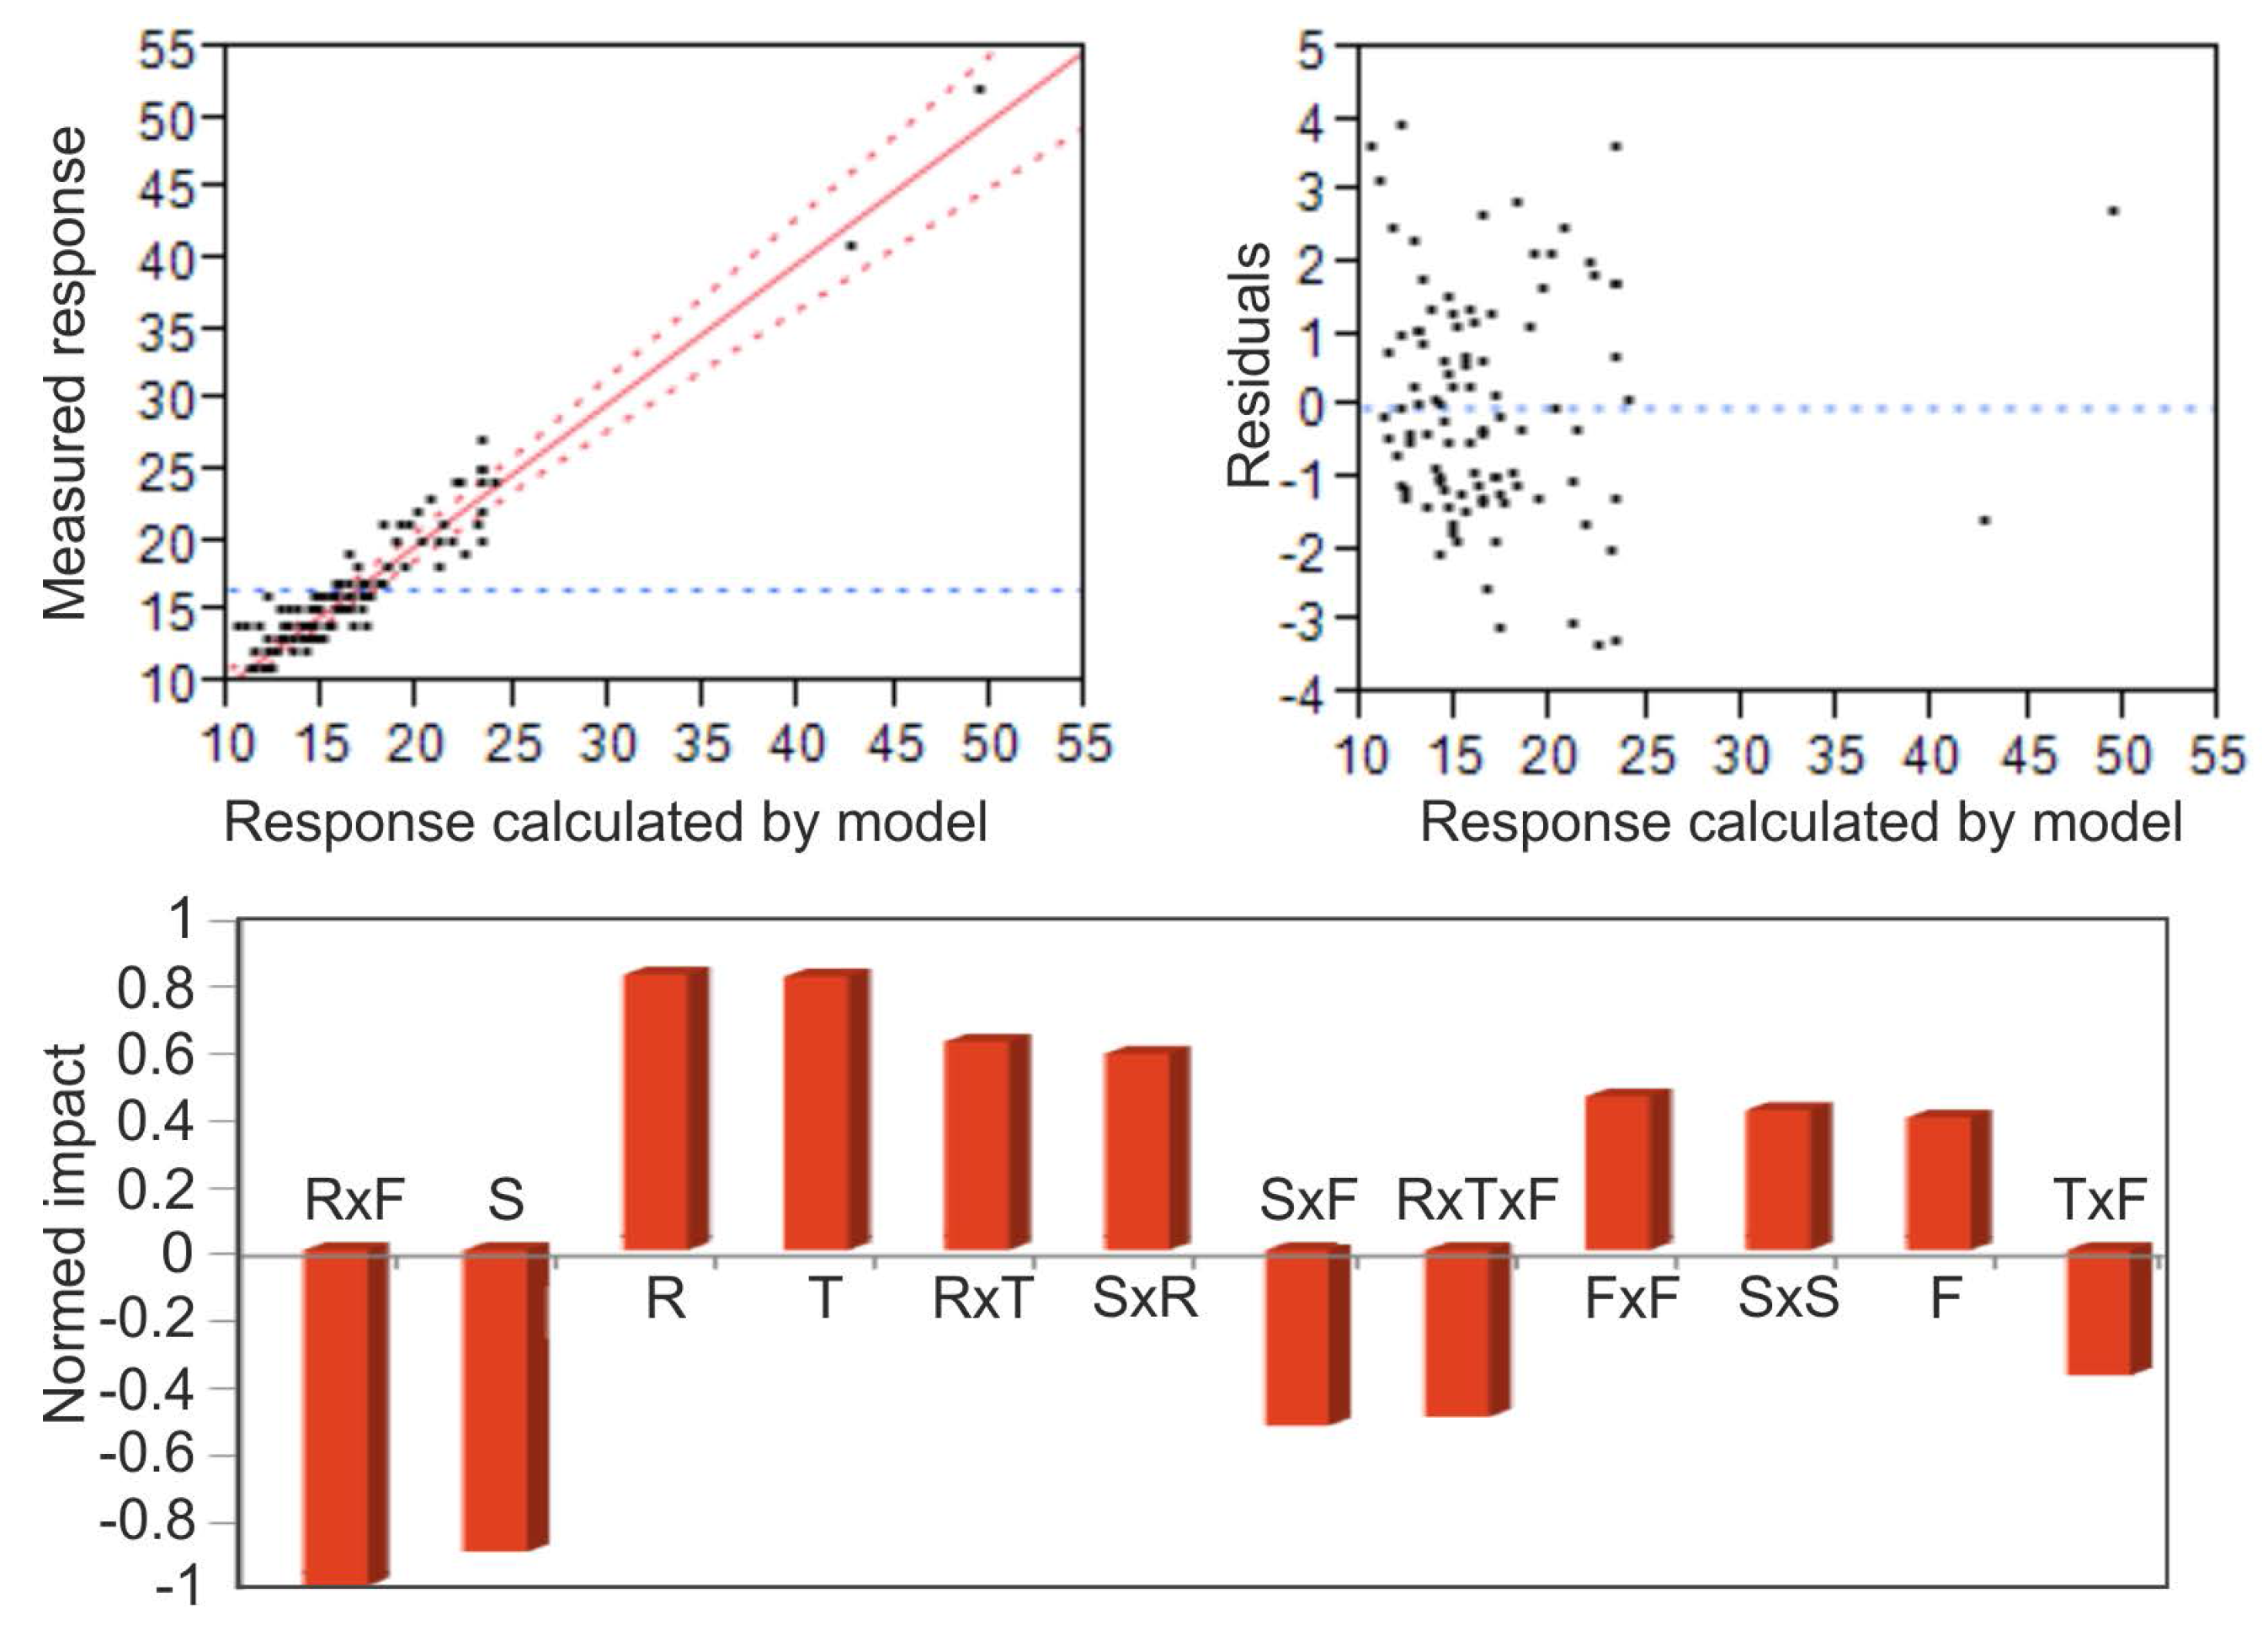
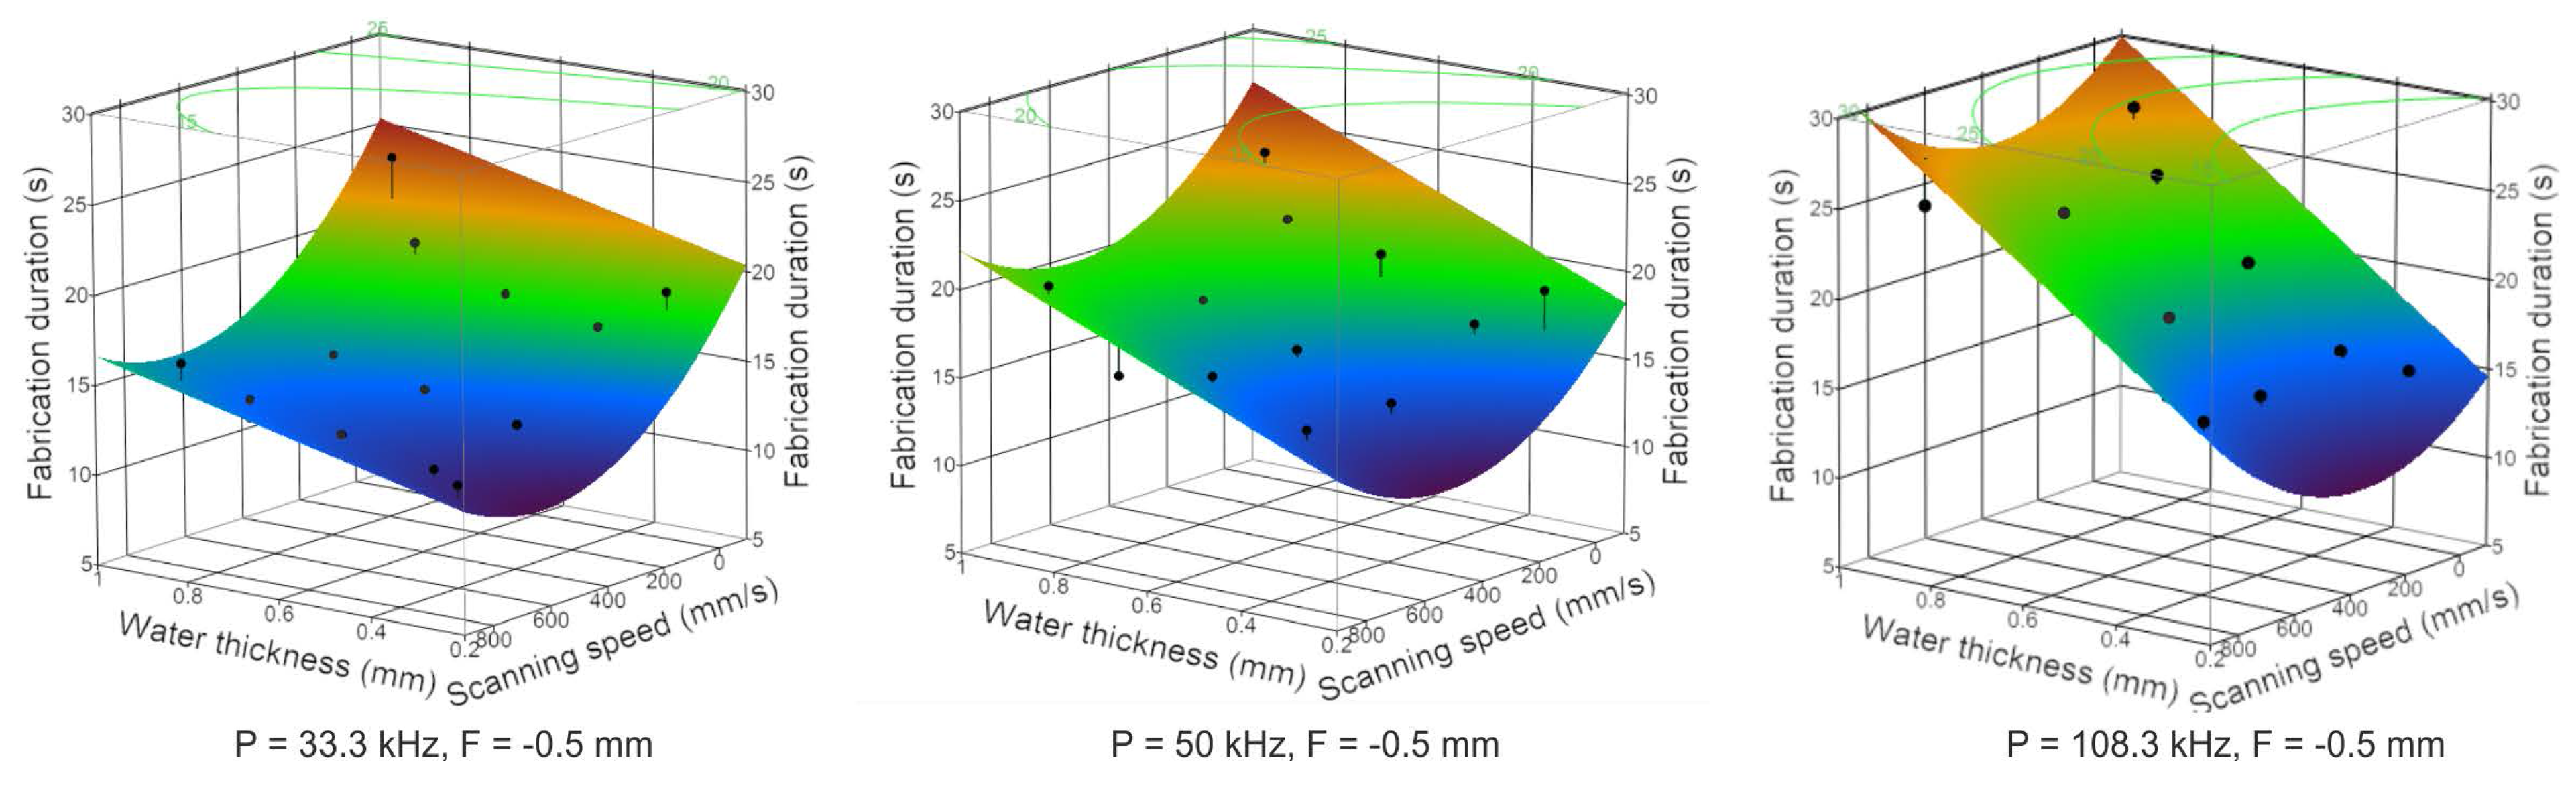
2.2. Optimization of Micromachining Process Using DOE Techniques

Optimization of the micromachining process for glass (1 mm thick) and steel (1 mm thick) samples was conducted by varying four parameters: scanning speed along the surface of the sample (within the bounds: 10–1500 mm/s), focal position relative to the surface of the sample (within the bounds: 1 mm above to 1 mm below the surface of the sample), repetition rate (33.3–200 kHz), and thickness of the added water layer (0.6 mm–1.5 mm). The parameters chosen for the study are independent of one another, i.e., one parameter is not a linear or non-linear combination of the other, and, therefore, the value of one parameter can be changed while keeping other parameter values constant. After the empirical model is obtained, the relations of the results to the imbedded parameters (fluence, intensity, pulse overlap, etc.) can be calculated. To avoid ambiguity, a comment should be added here on the repetition rate. The repetition rate is reciprocal to laser pulse energy, and when the average laser power is kept constant, a change in repetition rate results in a change in pulse energy. In addition, when the scanning speed is kept constant, a change in the repetition rate results in a different pulse overlap, which could potentially affect the experimental outcomes. Further discussion on this matter will be presented later in the text. The upper and lower bounds of the parameters were chosen as minimum and maximum values that can be set using this micromachining system. Therefore, the empirical model to be obtained will be specified as valid only within the bounds of these parameters. The water layer was formed by submerging the samples in a reservoir. The goal was to minimize fabrication duration, that is, to retrieve a collection of parameters that would cut the sample through in the least amount of time. It was decided to cut 3 mm long lines for both glass and steel samples and measure the duration required to make a through-cut. It was believed that the thickness of the water layer may change as the experiments progress due to water evaporation, therefore, an optical in situ monitoring system was built having the capability of measuring the thickness of the water, and which, in addition, could measure the depth of the crater that was ablated in real time. It was found that the thickness could be determined to an accuracy of about 50 μm. Other laser parameters were chosen as follows: average laser power—10 W (this is the maximum average power that can be used on the optical components), pulse duration—260 fs, wavelength—1026 nm, focal spot diameter 20 μm (FWHM) when focused in air. Using the setup presented in Figure 1, cutting of the previously stated materials was carried out. A process involving multiple parameters may require countless hours to study fully; therefore, DOE techniques were employed. An experimental design known as full factorial was employed, requiring only 81 experimental tests (three experimental points for each parameter which represent the minimal, mid and maximal values) to obtain the first empirical model. The experimental values of each parameter are displayed in Table 1. After all experiments were completed, a polynomial model (first and second order terms along with interaction terms) was fitted to the results.
Table 1. Parameters varied and their values.
ParametersNumeric Values
(S) Scanning speed (mm/s)207601500
(T) Water layer thickness (mm)0.611.5
(R) Repetition rate (kHz)33.3116.6200
(F) Focal position (mm)–101

2.3. Shadowgraphic Investigation

The results acquired when optimizing the micromachining process show a noticeable dependence on scanning speed (S), as will be discussed later. This dependence was investigated using laser shadowgraphy. The setup in Figure 1 was slightly modified by introducing a frequency-doubled (by generating the second harmonic) beam and aiming it at the impact region (Figure 2). The two beams were synchronized in such a way that the fundamental harmonic pulse would arrive at the target several hundred picoseconds earlier than the second harmonic beam, thus ensuring that the plasma from the pulse was extinguished and images of the bubbles generated from the pulse could be taken. It is believed that cavitation bubbles generated during fabricating play an important role in the fabrication outcome.
Figure 2. Shadowgraphy setup. Abbreviations: BS—beam splitter, HR—high reflectivity mirror, SHG—crystal for second harmonic generation, TL—tube lens.
Micromachines 06 01471 g002

3. Results and Discussion

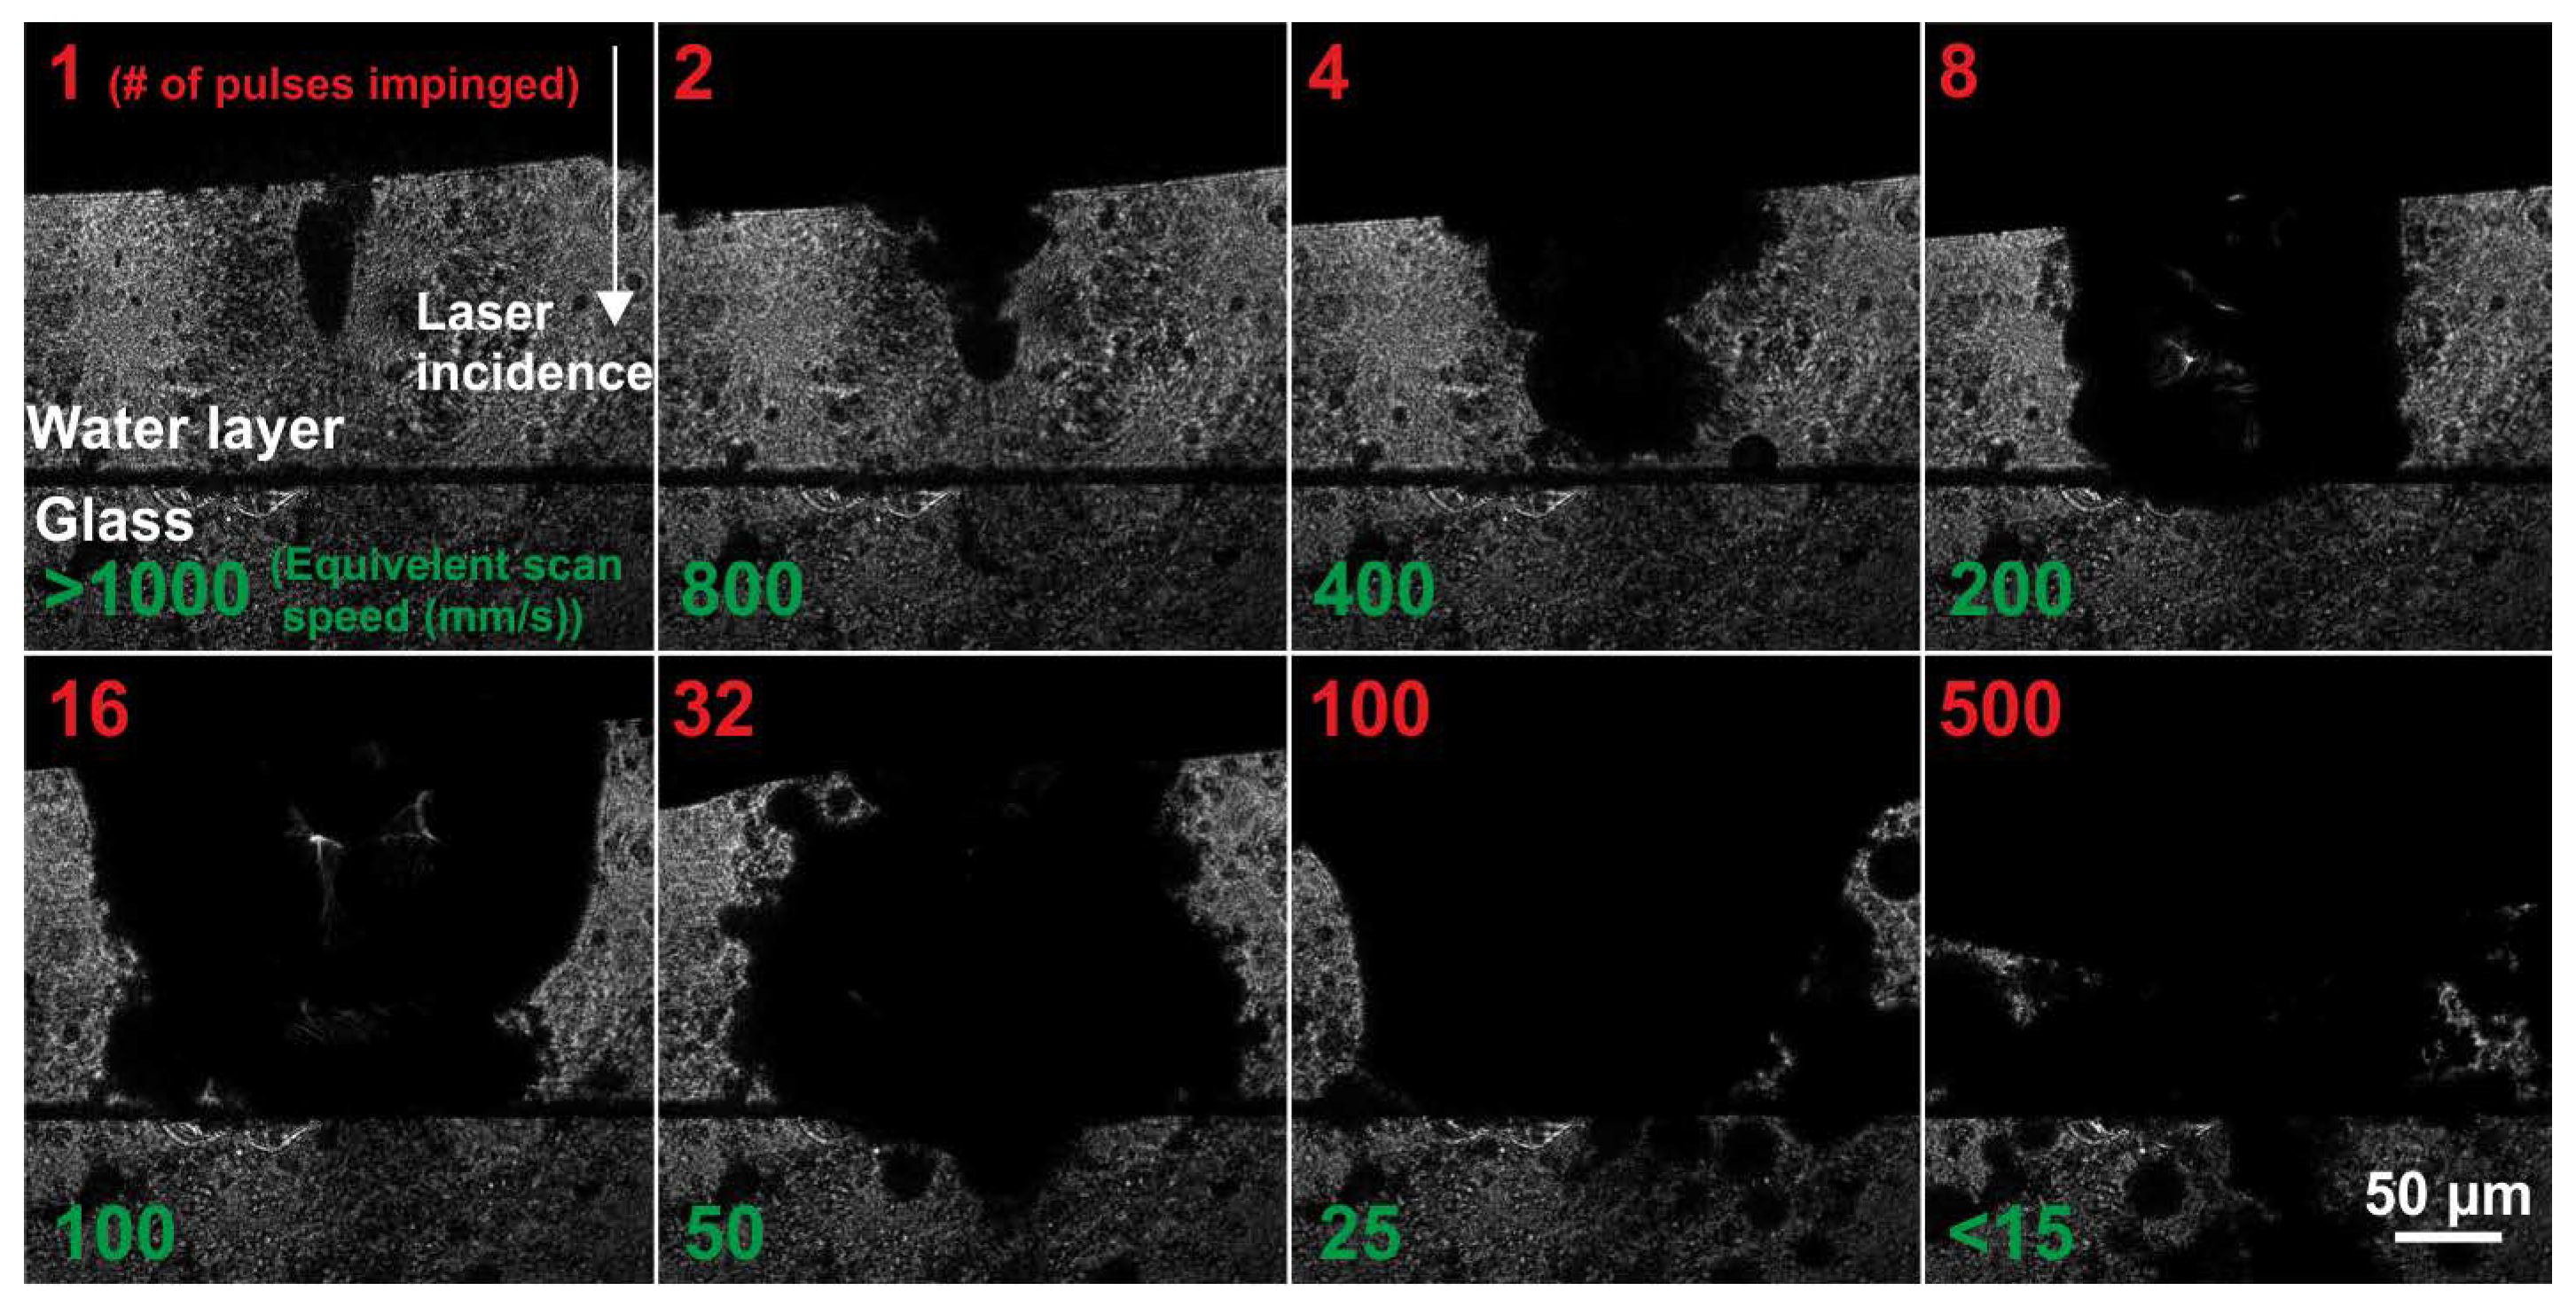
3.1. Ablation Patterns Acquired while Focusing Intense Laser Pulses in Water

The purpose of these experiments is to demonstrate, that even when high-energy pulses are focused within a thin water layer, self-actions are present and dramatically affect the intensity distribution impinging on the surface of the samples. When cutting thick materials (approximately 1 mm), these intensity distributions lead to ablation of the samples and are different at different depths of cut. As the samples are cut, the thickness of the water layer increases, since the depth of the groove increases, and, in this way, the experiment shows the kind of intensity distributions that can be expected at different depth and pulse energy values. The average laser power and water layer thickness were therefore varied and ablation patterns on a glass sample coated with chromium were obtained. The thickness of the water was controlled by pouring more or less water into the reservoir; in addition, the focal position was modified to keep the geometric focus approximately 1 mm below the surface of the water (in such an arrangement, the beam radius impinging on the surface of the water stays the same). Images of ablation patterns and their corresponding numerical modeling results are displayed in Figure 3. The experimental images were acquired after a single pulse impinged on the surface. It can be seen that the experimental ablation patterns remarkably match the numerically generated intensity distribution patterns. Minor inconsistencies present may be due to beam aberrations that were not accounted for (the beam was taken as Gaussian with a flat wavefront at the focus) even though the intensity distribution was recorded using a charge-coupled device (CCD) camera (top right image in Figure 3). The multiple spots that are visible both in the theoretical and experimental results are due to beam break-up into multiple filaments. The intensity profile of the Gaussian beam impinging on the water layer is never ideally Gaussian, but is modulated, and the modulations initiate beam break-up. This agreement among theoretical and experimental results demonstrates that self-actions are important when drilling materials more than 1 mm thick, since the energy distribution differs gradually in comparison to conventional focusing in air. In addition, if different initial intensity distributions were introduced prior to impinging on the water layer, break-up manipulation might be possible as described in [40,41]. Controlled break-up could have potential applications for multiple foci fabrication without spatial light modulators.
Figure 3. Ablation patterns acquired experimentally (left) and by modeling the modified Schrodinger equation (right) given different pulse energy settings and water thickness values.
Micromachines 06 01471 g003

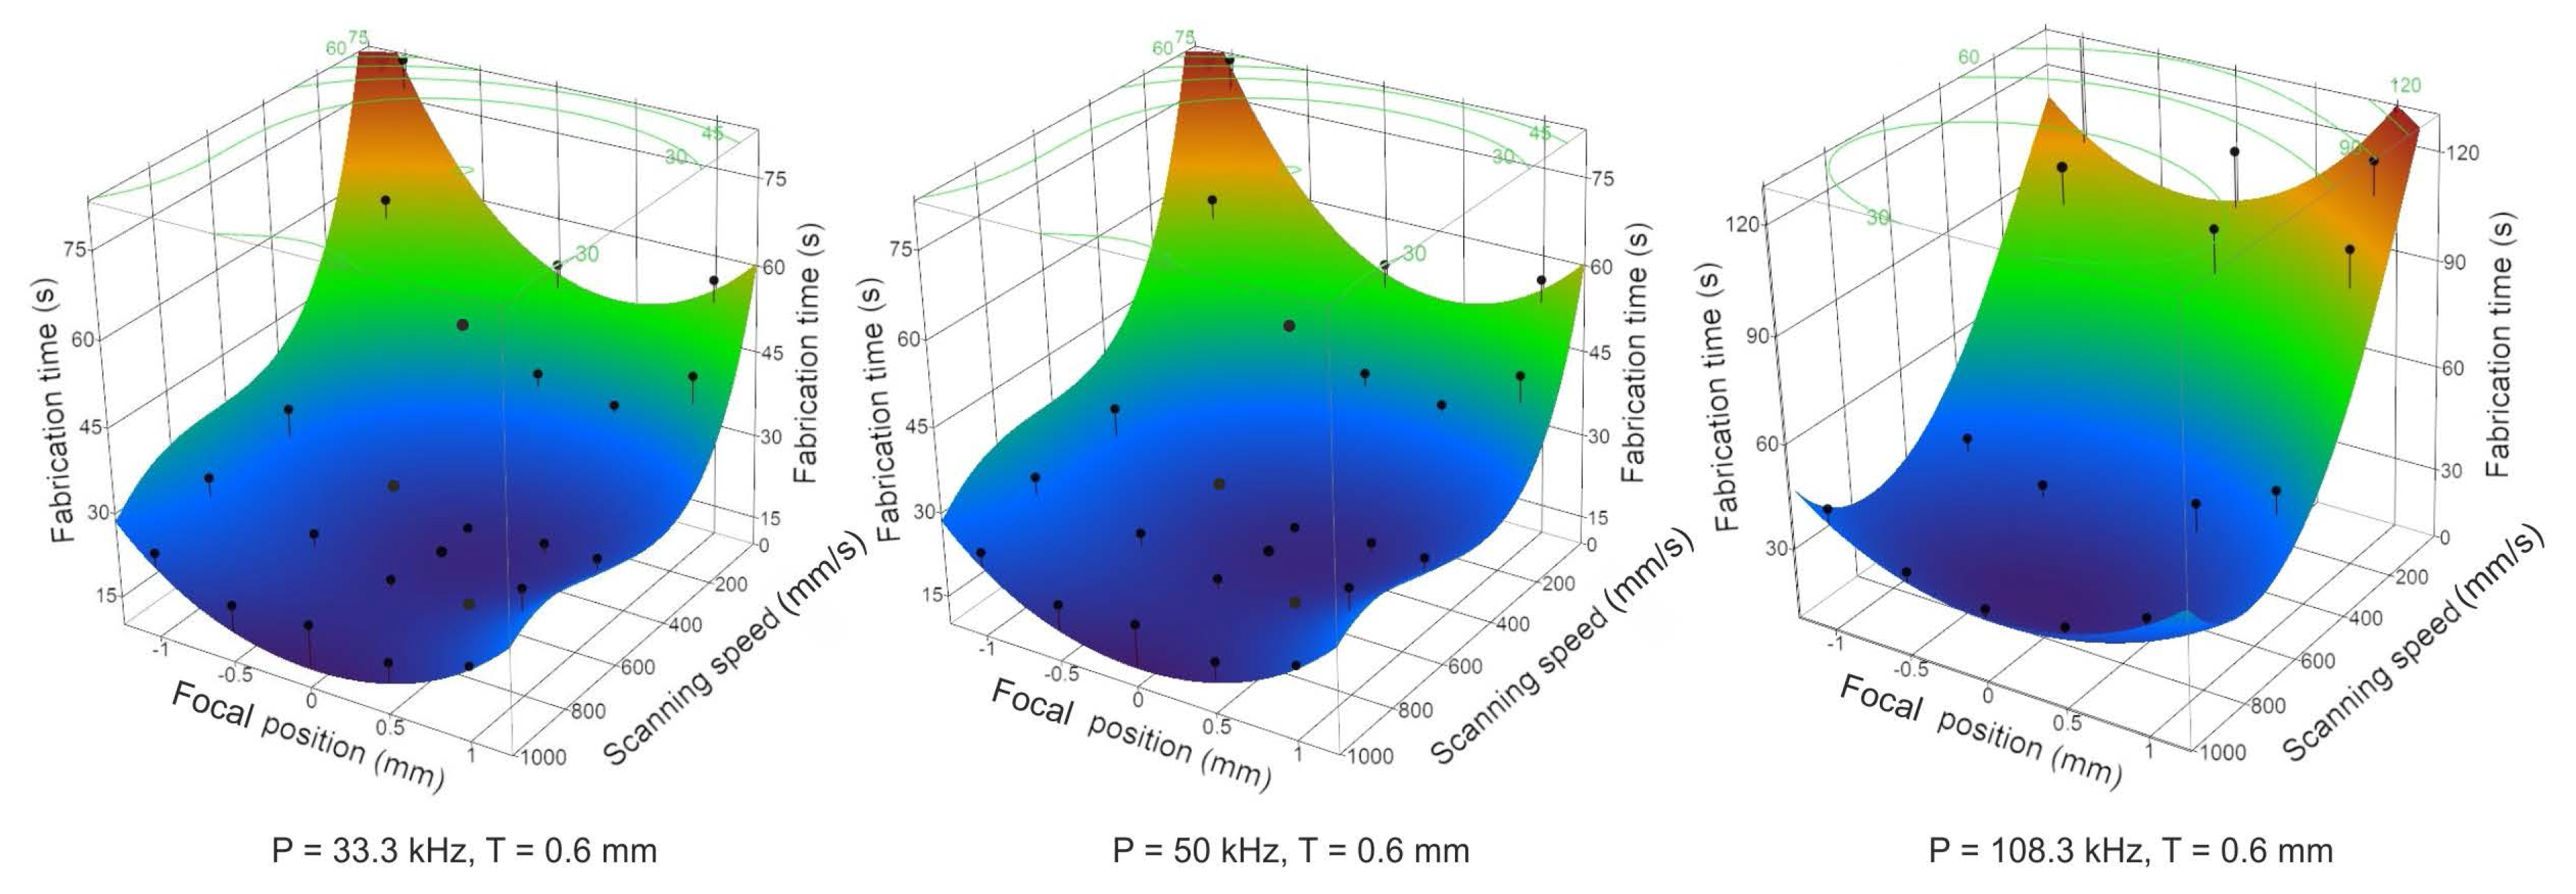
3.2. Optimization of the Micromachining Process

Optimization of a multiparametric process is a tedious task, since it involves working with multidimensional space, and the parameter relations to the response (outcome of the experiment that is measured) cannot be graphically displayed; hence, to obtain the true dependencies of the response based on the values of the parameters, one must perform statistical analysis. In total, 85 experimental tests (a few additional tests were added to asses result repeatability) were conducted to procure an empirical model that matches the results. The empirical model was obtained by fitting a polynomial model according to the results. Such a procedure is standard in DOE methods [42]. The model in particular was:
F a b r i c a t i o n d u r a t i o n ( S , T , R , F ) = α 0 + b 1 S + b 2 T + b 3 R + b 4 F + b 5 S × T + b 6 S × R + b 7 S × F + b 8 T × R + b 9 T × F + b 10 R × F + b 11 R × T × F + b 12 S × R × T + b 13 S × T × F + b 14 S × R × F + b 15 S × T × R × F + b 16 S 2 + b 17 T 2 + b 18 R 2 + b 19 F 2 + ϵ 0
Here, coefficients b 1 , . . . , 19 represent the impact of each term on the results, α 0 is the intercept and ϵ 0 represents the residuals (variation in the results that cannot be explained by the empirical model). The goal is always to minimize the residuals while keeping other coefficients with as little variation as possible. Naturally, all terms may not be present given the specific nature of the process (e.g., the interaction S × T may not exist). Therefore, terms which are deemed statistically insignificant are dropped from the model, thus obtaining an even simpler model with fewer terms and lower residual values.
After conducting the experimental tests, large variations in the results were noticed depending on different parameter settings, e.g., when fabricating with R = 33 kHz, F = 0 mm, T = 0.6 mm, S = 200 mm/s, the duration required to cut through the 3 mm line was 20 s, whereas when fabricating with R= 200 kHz, F = 1 mm, T = 1.5 mm, S = 1500 mm/s, fabrication took approximately 3 h. Therefore, the responses differ by several orders depending on the parameter values chosen.
When differences of several orders are present, fitting polynomial models to the results may become difficult in the sense that typically the true functional expression may end up with high-order terms (the model up to the second degree as described by Equation (2) may no longer suffice), hence the number of coefficients may become large, and overall understanding of the underlying physics may become difficult and misleading. Therefore, it was decided to narrow down the region where the polynomial model need not require high-order terms by choosing response values no higher than 50 s (all the parameter values that produce fabrication longer than 50 s were dropped). The final parameter range (with the dropped points) described by the polynomial model is listed in Table 2. The polynomial model was fit and fit statistics are displayed in Figure 4. By summing the terms with their corresponding coefficients and intercept, one can obtain the final empirical expression that relates fabrication duration and the four parameters. Having the prediction expression one can estimate not only the optimal conditions of fabrication, but also estimate the deviations in the results if the parameters themselves poses statistical uncertainty, e.g., one can estimate the decrease in the rate of fabrication if the sample positioning plane is tilted (change in focal position throughout the sample). The top left graph in Figure 4 displays how well the actually measured points coincide with points predicted by the model; if the model ideally explains the results, then the points should be situated along the diagonal. The graph in the top right corner shows by how much the predicted values deviate from the measured values; since experimental errors are present in real experiments, these points should be scattered following a normal distribution. In this case, the predicted points coincide with the measured points, and the residuals appear to be scattered normally, meaning that the prediction precision is homogeneous throughout the entire response range. The root mean square error (RMSE) value (RMS of residual variation) was calculated to equal 1.6 s, since the pure error (experimental error calculated by conducting experiment replicates) is equal to 1.87 s, we can conclude that the model well fits the measured results and further increase in accuracy is unnecessary. The terms that are present are listed in the bottom part of Figure 4. The impact of each term was normalized to unity and the bar chart describes the impact of each term on the results, e.g. the term R × F produces approximately twice the variation in the results relative to term F × F . The positive and negative impacts represent how the results change if the parameter values are increased or decreased, e.g., increase in repetition rate and thickness of the water layer will produce a longer fabrication duration. The acquired dependence is complex, since several parameter interactions are present ( R × F , R × T , S × R , S × F , R × T × F , T × F ); therefore, the true result-parameter space is curved and bent in five dimensions. This presents the complexity of representing the dependencies graphically, due to the restriction of only seeing a part of the dependence. In reality, the terms represent hidden physical mechanisms that influence such experimental outcomes. As was demonstrated in Section 3.1, the interaction of the beam with the water layer is governed by non-linear interaction mechanisms, therefore beam break-up, the resulting fluence, and energy propagation directions are influenced mostly by the beam front curvature (which relates to focal position) that impinges on the water layer, the energy of the pulse (reciprocal to pulse repetition rate) and the distance the beam propagated through non-linear media (thickness of water layer); consequently, the appearance of interaction terms is not surprising. We demonstrated that, as a parameter, repetition rate is one of the most important parameters that influence fabrication duration. However, to the best of the authors’ belief, the increase in pulse energy when the repetition rate decreases most likely contributes to shorter fabrication duration, since self-actions are more pronounced and effects such as varying pulse overlap from the changing repetition rate may be neglected. Several fabrication duration graphs vs. two other arbitrarily chosen parameters are displayed in Figure 5. The surface is the polynomial fit, the dots with needles show the experimentally measured points. It can be seen that, as the remaining two parameters are varied, the surface bends though the experimentally measured points do not drift away.
Table 2. Final optimization parameter range and values.
ParametersNumeric Value Range
(S) Scanning speed (mm/s)20-760
(T) Water layer thickness (mm)0.3-0.9
(R) Repetition rate (kHz)33.3-108.3
(F) Focal position (mm)-1-0.1
Figure 4. Fit statistics. Measured points relative to model-calculated points are displayed in the top left corner. Deviations (residuals) of the actual points from the calculated points are displayed in the top right corner. Coefficient data and their impact on the results are displayed in the bottom part. Fit R 2 = 0.92, RMSE = 1.6 s., α 0 = 11.2, pure error = 1.87 s.
Micromachines 06 01471 g004
Figure 5. Water thickness and scanning speed values vs. results (fabrication duration for cutting glass) graphs at different repetition rates and fixed focal position settings. The black dots are the actually measured points; the surface is produced via the prediction expression.
Micromachines 06 01471 g005
Completely analogous experiments were conducted on 1 mm thick stainless steel samples, but the optimization steps will not be presented here due to the exact analogy. Several dependencies of results vs. two parameters are displayed in Figure 6. As evident from the graphs, the fabrication duration overall is approximately the same as for soda-lime glass cutting. Several images of cut samples using optimal fabrication parameters are displayed in Figure 7. As is evident, cutting macro and micro components is possible using this setup. We achieve cutting speeds for both glass and metal samples approximately equal to 0.3 mm/s. Furthermore, thicker materials (approximately 2–3 mm) can be cut as in the case of the displayed one-euro coin. It is worth mentioning that similar images can be acquired using non-optimal parameters; however, the cutting rate may differ by a few orders of magnitude depending on the settings in the presented experimental domain. It is worth pointing out that we were unable to cut glass without the water layer. Due to temperature-induced tensile stress formation, the samples crack and shatter before they can be drilled through. In the case of metals, cutting is possible in air due to the different properties of the material. However, samples cut in air possess melted regions, HAZ and redeposition of debris on the samples (as evident in Figure 7). Furthermore, the rate of fabrication decreases by a factor of 10 compared to cutting in water.
Figure 6. Focal position and scanning speed values vs. results (fabrication duration for cutting metals) graphs at different repetition rate settings. The black dots are the actually measured points and the surface is produced via the prediction expression.
Micromachines 06 01471 g006
Figure 7. Examples of micromachined glass and stainless steel samples and the cutting of complex shapes. The State Emblem was cut out of a one-euro coin. Optimal fabrication parameters that were used for cutting: average power- 10 W, T = 0.6 mm, R = 33.3 kHz, F = -0.5 mm, S = 300 mm/s. The bottom right image displays the cut stainless steel sample in air.
Micromachines 06 01471 g007

3.3. Shadowgraphic Investigation

As was demonstrated in Section 3.2, the results vs. parameters dependencies are complex since multiple parameter interaction terms are involved. The authors of this paper believe that these multiple interaction terms ( R × F , R × T , S × R , S × F , R × T × F , T × F ) are due to the complicated dynamics of the laser beam, water layer and target when fabricating. Section 3.1 already demonstrated that the energy of the pulses and the thickness of the water layer dramatically influence how the energy distributes over the surface of the sample and how the propagation path of the beam changes. Therefore, the purpose of these experiments is to demonstrate that the water layer changes significantly when fabrication with different parameter settings is carried out. Using the setup presented in Figure 2, several images of the ongoing process were acquired. When actual fabrication (cutting) takes place, the beam is scanned along the surface of the sample; depending on the scanning speed of the beam and laser repetition rate, a different number of laser pulses impinge on the same spot due to the varying pulse overlap. This scenario is therefore analogous to simply a number of consecutive pulses hitting the surface. Figure 8 shows how the water layer changes when a different number of pulses impinge on the surface of the sample. After only one pulse, cavitation bubbles start forming in the water layer, and the zone increases with the increase in the number of pulses impinged. From approximately four to eight impinged pulses, the water layer is completely (from the surface of the water to the sample) transformed into a state of water and vapor. Naturally, different focal position and pulse energy values influence how fast the transformation takes place and how many pulses are required, therefore the presence of scanning speed and repetition rate ( S × R ), scanning speed and focal position ( S × F ) interactions becomes evident. These images illustrate the actual complexity of such a micromachining process, since most of the time (when micromachined with optimal parameter settings), femtosecond pulses propagate through this modified layer. The phase front distortions that are introduced by this modified layer and its non-linear properties are unknown and therefore the exact non-linear interaction of the beam with this modified layer can only be the subject of speculation. However, it is believed that, within a certain modified layer (which has a certain density of water, vapor and cavitation bubbles of characteristic dimensions), the cutting process reaches the optimal point due to the strongest pressure gradient formation, minimal diffractive losses and the best non-linear propagation conditions. The pressure gradients that arise due to cavitation bubble collapse help remove ablated particles from the groove, thus limiting subsequent pulse interaction (energy losses) with the ablated particles. Diffractive losses occur if the density (number of cavitation bubbles per unit of volume) of cavitation bubbles is such that the subsequent pulse wavefront distortions are too great to be overcome by non-linear self-focusing. The best non-linear propagation conditions may be considered as the transformed layer exhibiting modified linear and non-linear properties. Depending on the non-linear absorption coefficient and high-intensity induced linear refractive index modulation, reshaping of the beam’s intensity profile occurs at different depths of the water layer. Under certain conditions, the reshaped beam may produce a maximum intensity distribution at the surface of the sample and not in the water layer, and therefore energy losses will be highest at the surface of the sample. When a large number of pulses impinge on the same spot (low scanning speed), it can be seen that the water layer is removed due to evaporation and shock wave generation. Therefore, in such a scenario, the fabrication throughput drops as the conditions become similar to ablation in ambient air. Given the complicated nature of such a process, the interaction terms found during optimization are not surprising; however, further research is required for a better understanding of the process.
Figure 8. Shadowgraphic images acquired after a different number of impinging pulses on the surface. The top left number (red) shows the number of pulses required to obtain the image, the bottom left number (in each image green) represents the corresponding scanning speed. Laser repetition rate = 33.3 kHz.
Micromachines 06 01471 g008

4. Conclusions

In this study, we have presented results from a high-energy femtosecond pulse focusing within a water layer that is covering the samples. We demonstrated experimentally, and through numerical modeling, that when high-energy femtosecond pulses (exceeding the critical power for self-focusing by a few orders) are focused using a low NA objective (f = 100 mm f-theta lens), self-focusing and non-linear absorption phenomena transform the beam to a filament-like propagation regime. If proper parameters are chosen, an intense beam can be created near the surface of the samples, which can be used for micromachining purposes. In addition, damage patterns induced by ablation resemble energy distribution patterns acquired by modeling the modified non-linear Schrodinger equation, and are due to beam break-up into closely spaced multiple filaments. Furthermore, we have optimized the micromachining process for soda-lime glass and stainless steel sample cutting that is influenced by four parameters (laser repetition rate, focal position, water layer thickness and scanning speed). Using DOE methods, optimization was achieved with less than 200 experimental tests and the acquired functional dependence predicts the results with accuracy approximately equal to the experimental error. The empirical dependence possesses quadratic and multiple interaction terms, which are attributed to the transient transformation of the water layer while fabricating. The transformation is verified though shadowgraphic investigation.

Acknowledgments

The research leading to these results has received funding from LASERLAB-EUROPE III (grant agreement no. 284464, EC’s Seventh Framework Programme).

Author Contributions

Simas Butkus planned, organized and carried out glass cutting and laser shadowgraphy experiments, performed statistical analysis. Aleksandr Alesenkov acquired the ablation patterns and performed metallic substrate cutting experiments. Domas Paipulas aided in experiment planning, data interpretation and organizing. Eugenijus Gaižauskas performed numerical modelling of the propagating beam through the water layer. Andrius Melninkaitis consulted on DOE techniques and statistical interpretation. Dalia Kaškelytė and Martynas Barkauskas consulted about the technical aspects of the equipment. Valdas Sirutkaitis oversaw the entire study and consulted on various physical and technical aspects. All of the authors wrote the manuscript.

Conflicts of Interest

The authors do not declare any conflict of interest.

References

  1. Osellame, R.; Cerullo, G.; Ramponi, R. Femtosecond Laser Micromachining; Springer-Verlag: Berlin, Germany, 2012. [Google Scholar]
  2. Misawa, H.; Juodkazis, S. 3D Laser Microfabrication Principles and Applications; Wiley-VCH Verlag: Weinheim, Germany, 2006. [Google Scholar]
  3. Schaffer, C.B.; Brodeur, A.; Mazur, E. Laser-induced breakdown and damage in bulk transparent materials induced by tightly focused femtosecond laser pulses. Meas. Sci. Technol. 2001, 12, 1784. [Google Scholar] [CrossRef]
  4. Couairon, A.; Mysyrowicz, A. Femtosecond Filamentation in Transparent Media. Phys. Rep. 2007, 44, 47–189. [Google Scholar] [CrossRef]
  5. Shah, L.; Tawneym, J.; Richardson, M.; Richardson, K. Self-Focusing During Femtosecond Micromachining of Silicate Glasses. IEEE J. Quantum Electron. 2004, 40, 57–68. [Google Scholar] [CrossRef]
  6. Ran, A.; Yan, L.; Yan-Ping, D.; Ying, F.; Hong, Y.; Qi-Huang, G. Laser Micro-Hole Drilling of Soda-Lime Glass with Femtosecond Pulses. Chin. Phys. Lett. 2004, 21, 2465. [Google Scholar] [CrossRef]
  7. Wu, Z.; Jiang, H.; Sun, Q.; Guo, H.; Yang, H.; Gong, Q. Micro-ablation at the front and rear surfaces of a fused silica window by using a femtosecond laser pulse in air. J. Appl. Opt. 2004, 6, 671. [Google Scholar] [CrossRef]
  8. Byer, R.L.; Harkin, A.; Ashmore, J.; Stone, H.W.; Shen, M.; Mazur, E. Morphology of femtosecond-laser-ablated borosilicate glass surfaces. Appl. Phys. Lett. 2003, 83, 3030–3032. [Google Scholar]
  9. Schaffer, Ch.B.; Brodeur, A.; Garcia, J.F.; Mazur, E. Micromachining bulk glass by use of femtosecond laser pulses with nanojoule energy. Opt. Lett. 2001, 26, 93–95. [Google Scholar] [CrossRef] [PubMed]
  10. Ye, D.; Guang-Jun, Y.; Guo-Rui, W.; Hong-Liang, M.; Xiao-Na, Y.; Hong, M. The effect of spherical aberration on temperature distribution inside glass by irradiation of a high repetition rate femtosecond pulse laser. Chin. Phys. B 2012, 21, 025201. [Google Scholar]
  11. Vitek, D.N.; Adams, D.E.; Johnson, A.; Tsai, P.S.; Backus, S.; Durfee, C.G.; Kleinfeld, D.; Squier, J.A. Temporally focused femtosecond laser pulses for low numerical aperture micromachining through optically transparent materials. Opt. Exp. 2010, 18, 18086–18094. [Google Scholar] [CrossRef] [PubMed]
  12. Vitek, D.N.; Block, E.; Bellouard, Y.; Adams, D.E.; Backus, S.; Kleinfeld, D.; Durfee, C.G.; Squier, J.A. Spatio-temporally focused femtosecond laser pulses for nonreciprocal writing in optically transparent materials. Opt. Exp. 2010, 18, 24673–24678. [Google Scholar] [CrossRef] [PubMed]
  13. Block, E.; Greco, M.; Vitek, D.; Masihzadeh, O.; Ammar, D.A.; Kahook, M.Y.; Mandava, N.; Durfee, C.; Squier, J. Simultaneous spatial and temporal focusing for tissue ablation. Opt. Exp. 2013, 4, 831–841. [Google Scholar] [CrossRef] [PubMed]
  14. Bellouard, Y.; Said, A.; Dugan, M.; Bado, P. Fabrication of high-aspect ratio microfluidic channels and tunnels using femtosecond laser pulses and chemical etching. Opt. Exp. 2004, 12, 2120–2129. [Google Scholar] [CrossRef]
  15. Gottmann, J.; Hermans, M.; Ortmann, J. Digital Photonic Production of Micro Structures in Glass by In-Volume Selective Laser-Induced Etching using a High Speed Micro Scanner. J. Laser Micro/Nanoeng. 2013, 8, 531–541. [Google Scholar] [CrossRef]
  16. Wortmann, D.; Gottmann, J.; Brandt, N.; Horn-Solle, H. Micro- and nanostructures inside sapphire by fs-laser irradiation and selective etching. Opt. Exp. 2008, 16, 1517–1522. [Google Scholar] [CrossRef]
  17. Bellouard, Y.; Champion, A.; Lenssen, B.; Matteucci, M.; Schaap, A.; Beresna, M.; Corbari, C.; Gecevičius, M.; Kazansky, P.; Chappuis, O.; et al. The femtoprint project. J. Laser Micro/Nanoeng. 2012, 7, 1–10. [Google Scholar] [CrossRef]
  18. Kiyama, S.; Matsuo, S.; Hashimoto, S.; Morihira, Y. Examination of etching agent and etching mechanism on femtosecond laser microfabrication of channels inside vitreous silica substrates. J. Phys. Chem. C 2009, 113, 11560. [Google Scholar] [CrossRef]
  19. Marcinkevičius, A.; Juodkazis, S.; Watanabe, M.; Miwa, M.; Matsuo, S.; Misawa, H.; Nishii, J. Femtosecond laser-assisted three-dimensional microfabrication in silica. Opt. Lett. 2001, 26, 277–279. [Google Scholar] [CrossRef]
  20. Izawa, Y.; Tanaka, S.; Kikuchi, H.; Tsurumi, Y. Debris-free in-air laser dicing for multi-layer MEMS by perforated internal transformation and thermally-induced crack propagation. In Proceedings of the IEEE International Micro Electro Mechanical Systems Symposium, Tucson, AZ, USA, 13–17 January 2006; pp. 822–827.
  21. Ohmura, E.; Fukuyo, F.; Fukumitsu, K.; Morita, H. Internal modified-layer formation mechanism into silicon with nanosecond laser. J. Achiev. Mater. Manuf. Eng. 2006, 17, 381–384. [Google Scholar]
  22. Banks, D.P.; Kaur, K.S.; Grivas, Ch.; Sones, C.; Gan-gopadhyay, P.; Ying, C.; Mills, J.; Mailis, S.; Zergioti, I.; Fardel, R.; et al. Femtosecond laser-induced forward transfer for the deposition of nanoscale transparent and solid-phase materials. In Proceedings of the LAMP International Laser Advanced Materials Processing Symposium, Kobe, Japan, 29 June–2 July 2009; pp. 206–214.
  23. Zakharova, O.V.; Godymchuk, A.Y.; Gusev, A.A.; Gulchenko, S.I.; Vasyukova, I.A.; Kuznetsov, D.V. Considerable Variation of Antibacterial Activity of Cu Nanoparticles Suspensions Depending on the Storage Time, Dispersive Medium, and Particle Sizes. Biomed. Res. Int. 2015, 2015, 1–11. [Google Scholar] [CrossRef] [PubMed]
  24. Karlsson, H.L.; Gustafsson, J.; Cronholm, P.; Moller, L. Copper oxide nanoparticles are highly toxic: A comparison between metal oxide nanoparticles and carbon nanotubes. Chem. Res. Toxicol. 2008, 21, 1726–1732. [Google Scholar] [CrossRef] [PubMed]
  25. Martinez-Castanon, G.A.; Nino-Martinez, N.; Martinez-Gutierrez, F.; Martinez-Mendoza, J.R.; Ruiz, F. Synthesis and antibacterial activity of silver nanoparticles with different sizes. J. Nanopart. Res. 2008, 10, 1343–1348. [Google Scholar] [CrossRef]
  26. Hwang, D.J.; Choi, T.Y.; Grigoropoulos, C.P. Liquid-assisted femtosecond laser drilling of straight and three-dimensional microchannels in glass. Appl. Phys. A 2004, 79, 605–612. [Google Scholar] [CrossRef]
  27. Butkus, S.; Paipulas, D.; Kaškelytė, D.; Gaižauskas, E.; Sirutkaitis, V. Improvement of Cut Quality in Rapid-Cutting of Glass Method via Femtosecond Laser Filamentation. J. Laser Micro/Nanoeng. 2015, 10, 59–63. [Google Scholar] [CrossRef]
  28. Wang, S.Y.; Ren, Y.; Cheng, C.W.; Chen, J.K.; Tzou, D.Y. Micromachining of Copper by femtosecond laser pulses. Appl. Surf. Sci. 2013, 265, 302–308. [Google Scholar] [CrossRef]
  29. Nikumb, S.; Chen, Q.; Li, C.; Reshef, H.; Zheng, H.Y.; Qiu, H.; Low, D. Precision glass machining, drilling and profile cutting by short pulse lasers. Thin Solid Films 2005, 477, 216–221. [Google Scholar] [CrossRef]
  30. Laakso, P.; Penttila, R.; Heimala, P. Effect of Shot Number on Femtosecond Laser Drilling of Silicon. J. Laser Micro/Nanoeng. 2010, 5, 273–276. [Google Scholar] [CrossRef]
  31. Ahmmed, K.M.; Grambow, C.; Kietzig, A. Fabrication of Micro/Nano Structures on Metals by Femtosecond Laser Micromachining. Micromachines 2014, 5, 1219–1253. [Google Scholar] [CrossRef]
  32. Butkus, S.; Gaižauskas, E.; Paipulas, D.; Viburys, Ž.; Kaškelytė, D.; Barkauskas, M.; Alesenkov, A.; Sirutkaitis, V. Rapid microfabrication of transparent materials using filamented femtosecond laser pulses. Appl. Phys. A 2014, 114, 81–90. [Google Scholar] [CrossRef]
  33. Butkus, S.; Paipulas, D.; Sirutkaitis, R.; Gaižauskas, E.; Sirutkaitis, V. Rapid Cutting and Drilling of Transparent Materials via Femtosecond Laser Filamentation. J. Laser Micro/Nanoeng. 2014, 9, 212–220. [Google Scholar] [CrossRef]
  34. Zhu, S.; Lu, Y.F.; Hong, M.H. Laser ablation of solid substrate in a water-confined environment. Appl. Phys. Lett. 2001, 79, 1396–1398. [Google Scholar] [CrossRef]
  35. Ohl, C.; Arora, M.; Dijkink, R.; Janve, V.; Lohse, D. Surface cleaning from laser-induced cavitation bubbles. Appl. Phys. Lett. 2006, 89, 074102. [Google Scholar] [CrossRef]
  36. Montgomery, D.C. Design and Analysis of Experiments, 1st ed.; Wiley, John & Sons: Hoboken, NJ, USA, 2002. [Google Scholar]
  37. Gaižauskas, E.; Dubietis, A.; Kudriašov, V.; Sirutkaitis, V.; Couairon, A.; Faccio, D.; di Trapani, P. On the role of conical waves in self-focusing and filamentation of femtosecond pulses. Top. Appl. Phys. 2009, 114, 457–479. [Google Scholar]
  38. Keldysh, L.V. Ionization in the field of a strong electromagnetic wave. Sov. Phys. JETP 1965, 20, 1307–1314. [Google Scholar]
  39. Couairon, A.; Gaižauskas, E.; Faccio, D.; Dubietis, A.; Di Trapani, P. Nonlinear X-wave formation by femtosecond filamentation in Kerr media. Phys. Rev. E 2006, 73, 016608. [Google Scholar] [CrossRef] [PubMed]
  40. Majus, D.; Jukna, V.; Valiulis, G.; Dubietis, A. Generation of periodic filament arrays by self-focusing of highly elliptical ultrashort pulsed laser beams. Phys. Rev. A 2009, 79, 033843. [Google Scholar] [CrossRef]
  41. Kudriašov, V.; Gaižauskas, E.; Sirutkaitis, V. Beam transformation and permanent modification in fused silica induced by femtosecond filaments. J. Opt. Soc. Am. B 2005, 22, 2619–2627. [Google Scholar] [CrossRef]
  42. Jeffwu, C.F.; Hamada, M.S. Planning, Analysis, and Optimization, 1st ed.; Wiley, John & Sons: Hoboken, NJ, USA, 2009. [Google Scholar]

