
Optimized Simulation and Validation of Particle Advection in Asymmetric Staggered Herringbone Type Micromixers


Abstract
:1. Introduction
1.1. Mixing at the Microscale
1.2. Chaotic Advection
2. Experimental Section
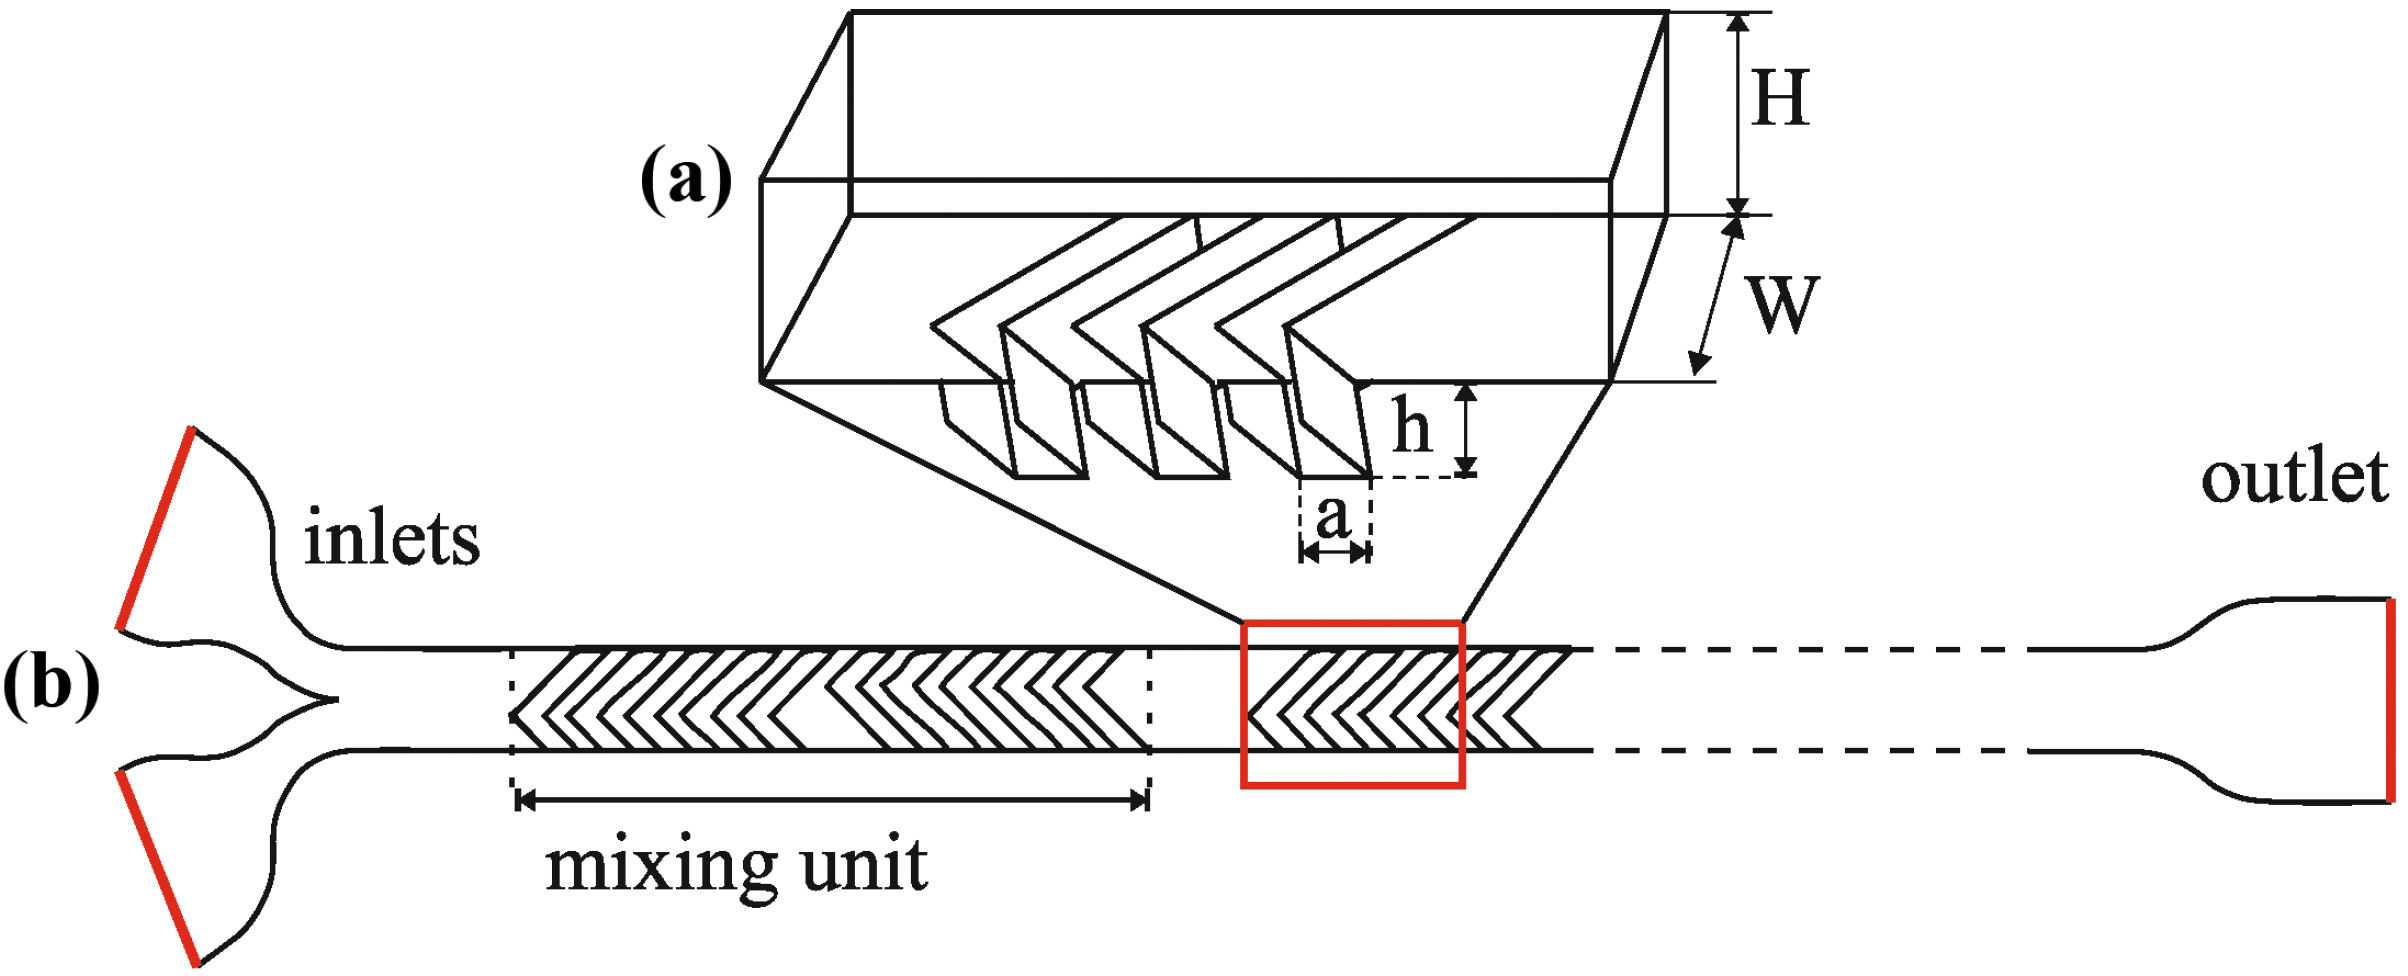
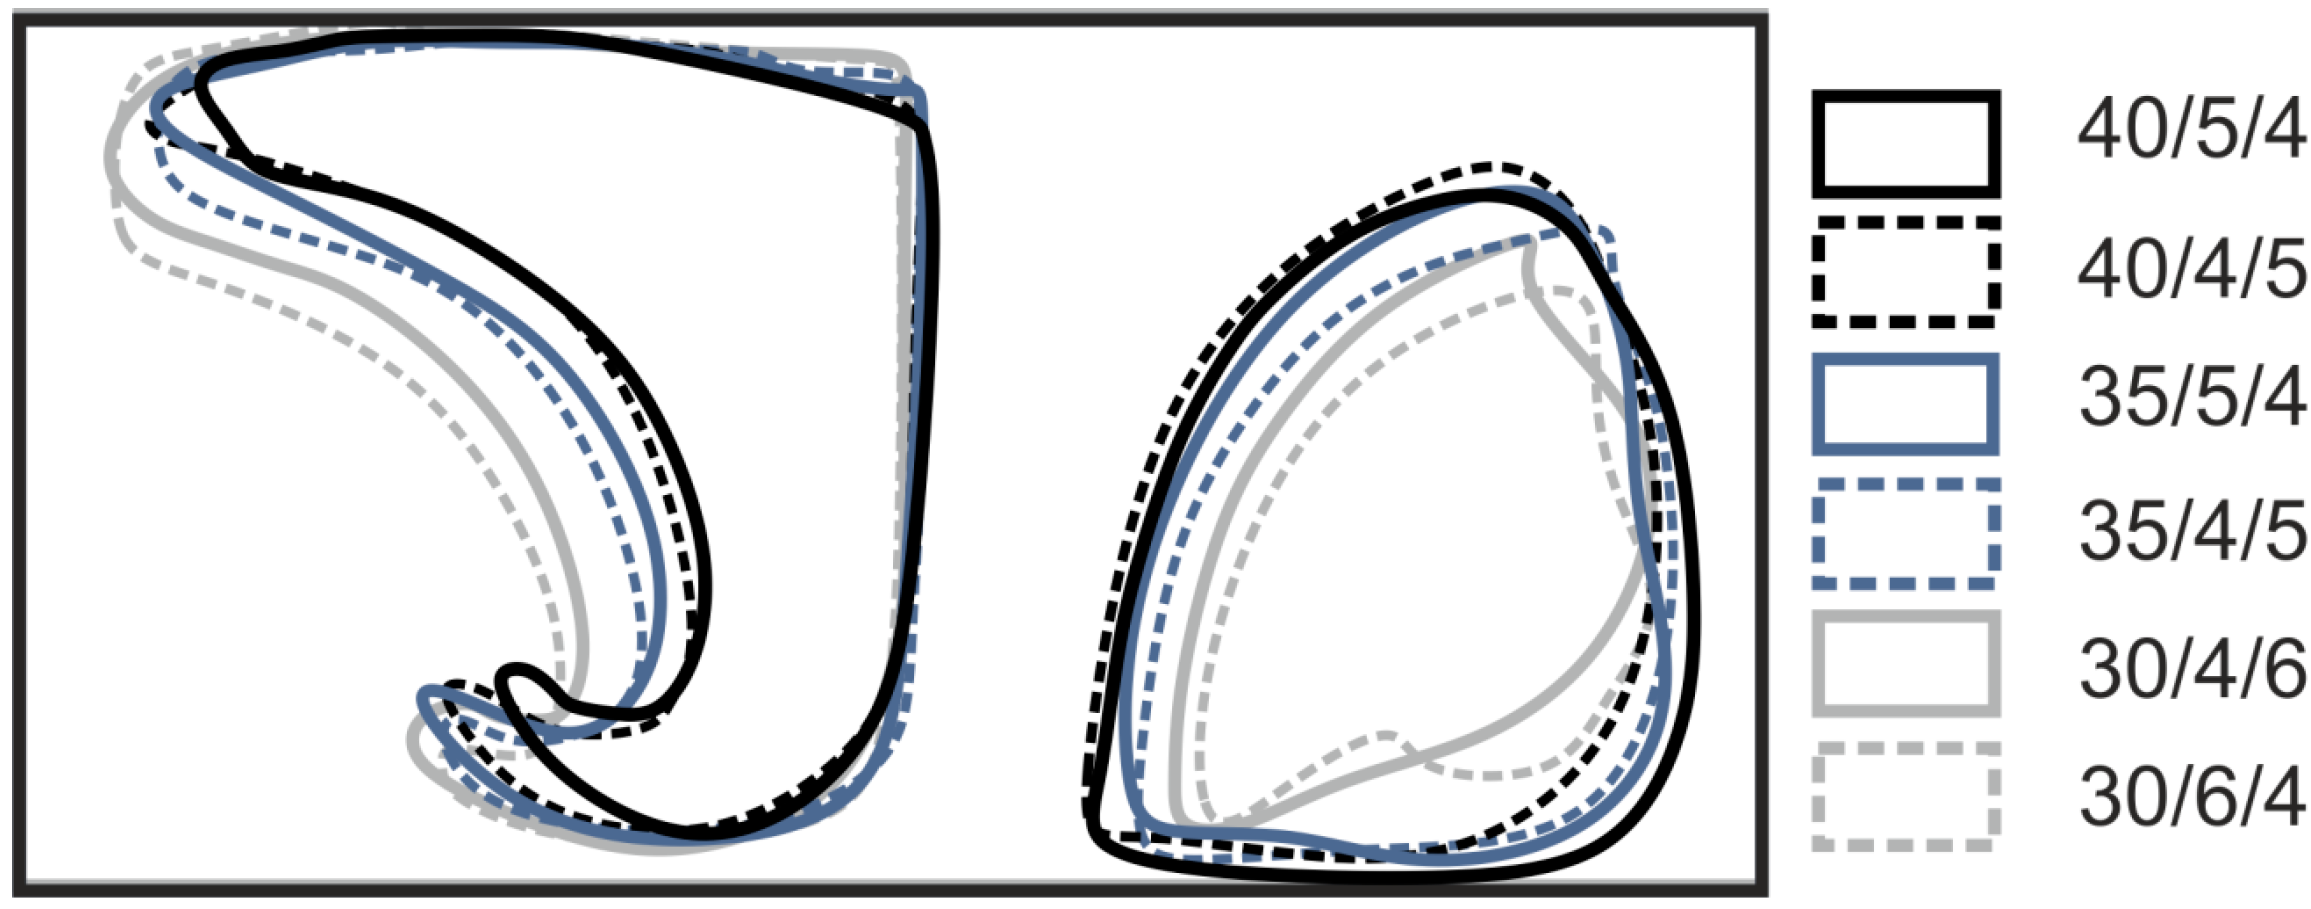
2.1. Applied Geometries

| Herringbone groove width | Number of herringbones per half unit | Number of mixing units | Name |
|---|---|---|---|
| 30 μm | 4 | 6 | 30/4/6 |
| 30 μm | 6 | 4 | 30/6/4 |
| 35 μm | 4 | 5 | 35/4/5 |
| 35 μm | 5 | 4 | 35/5/4 |
| 40 μm | 4 | 5 | 40/4/5 |
| 40 μm | 5 | 4 | 40/5/4 |
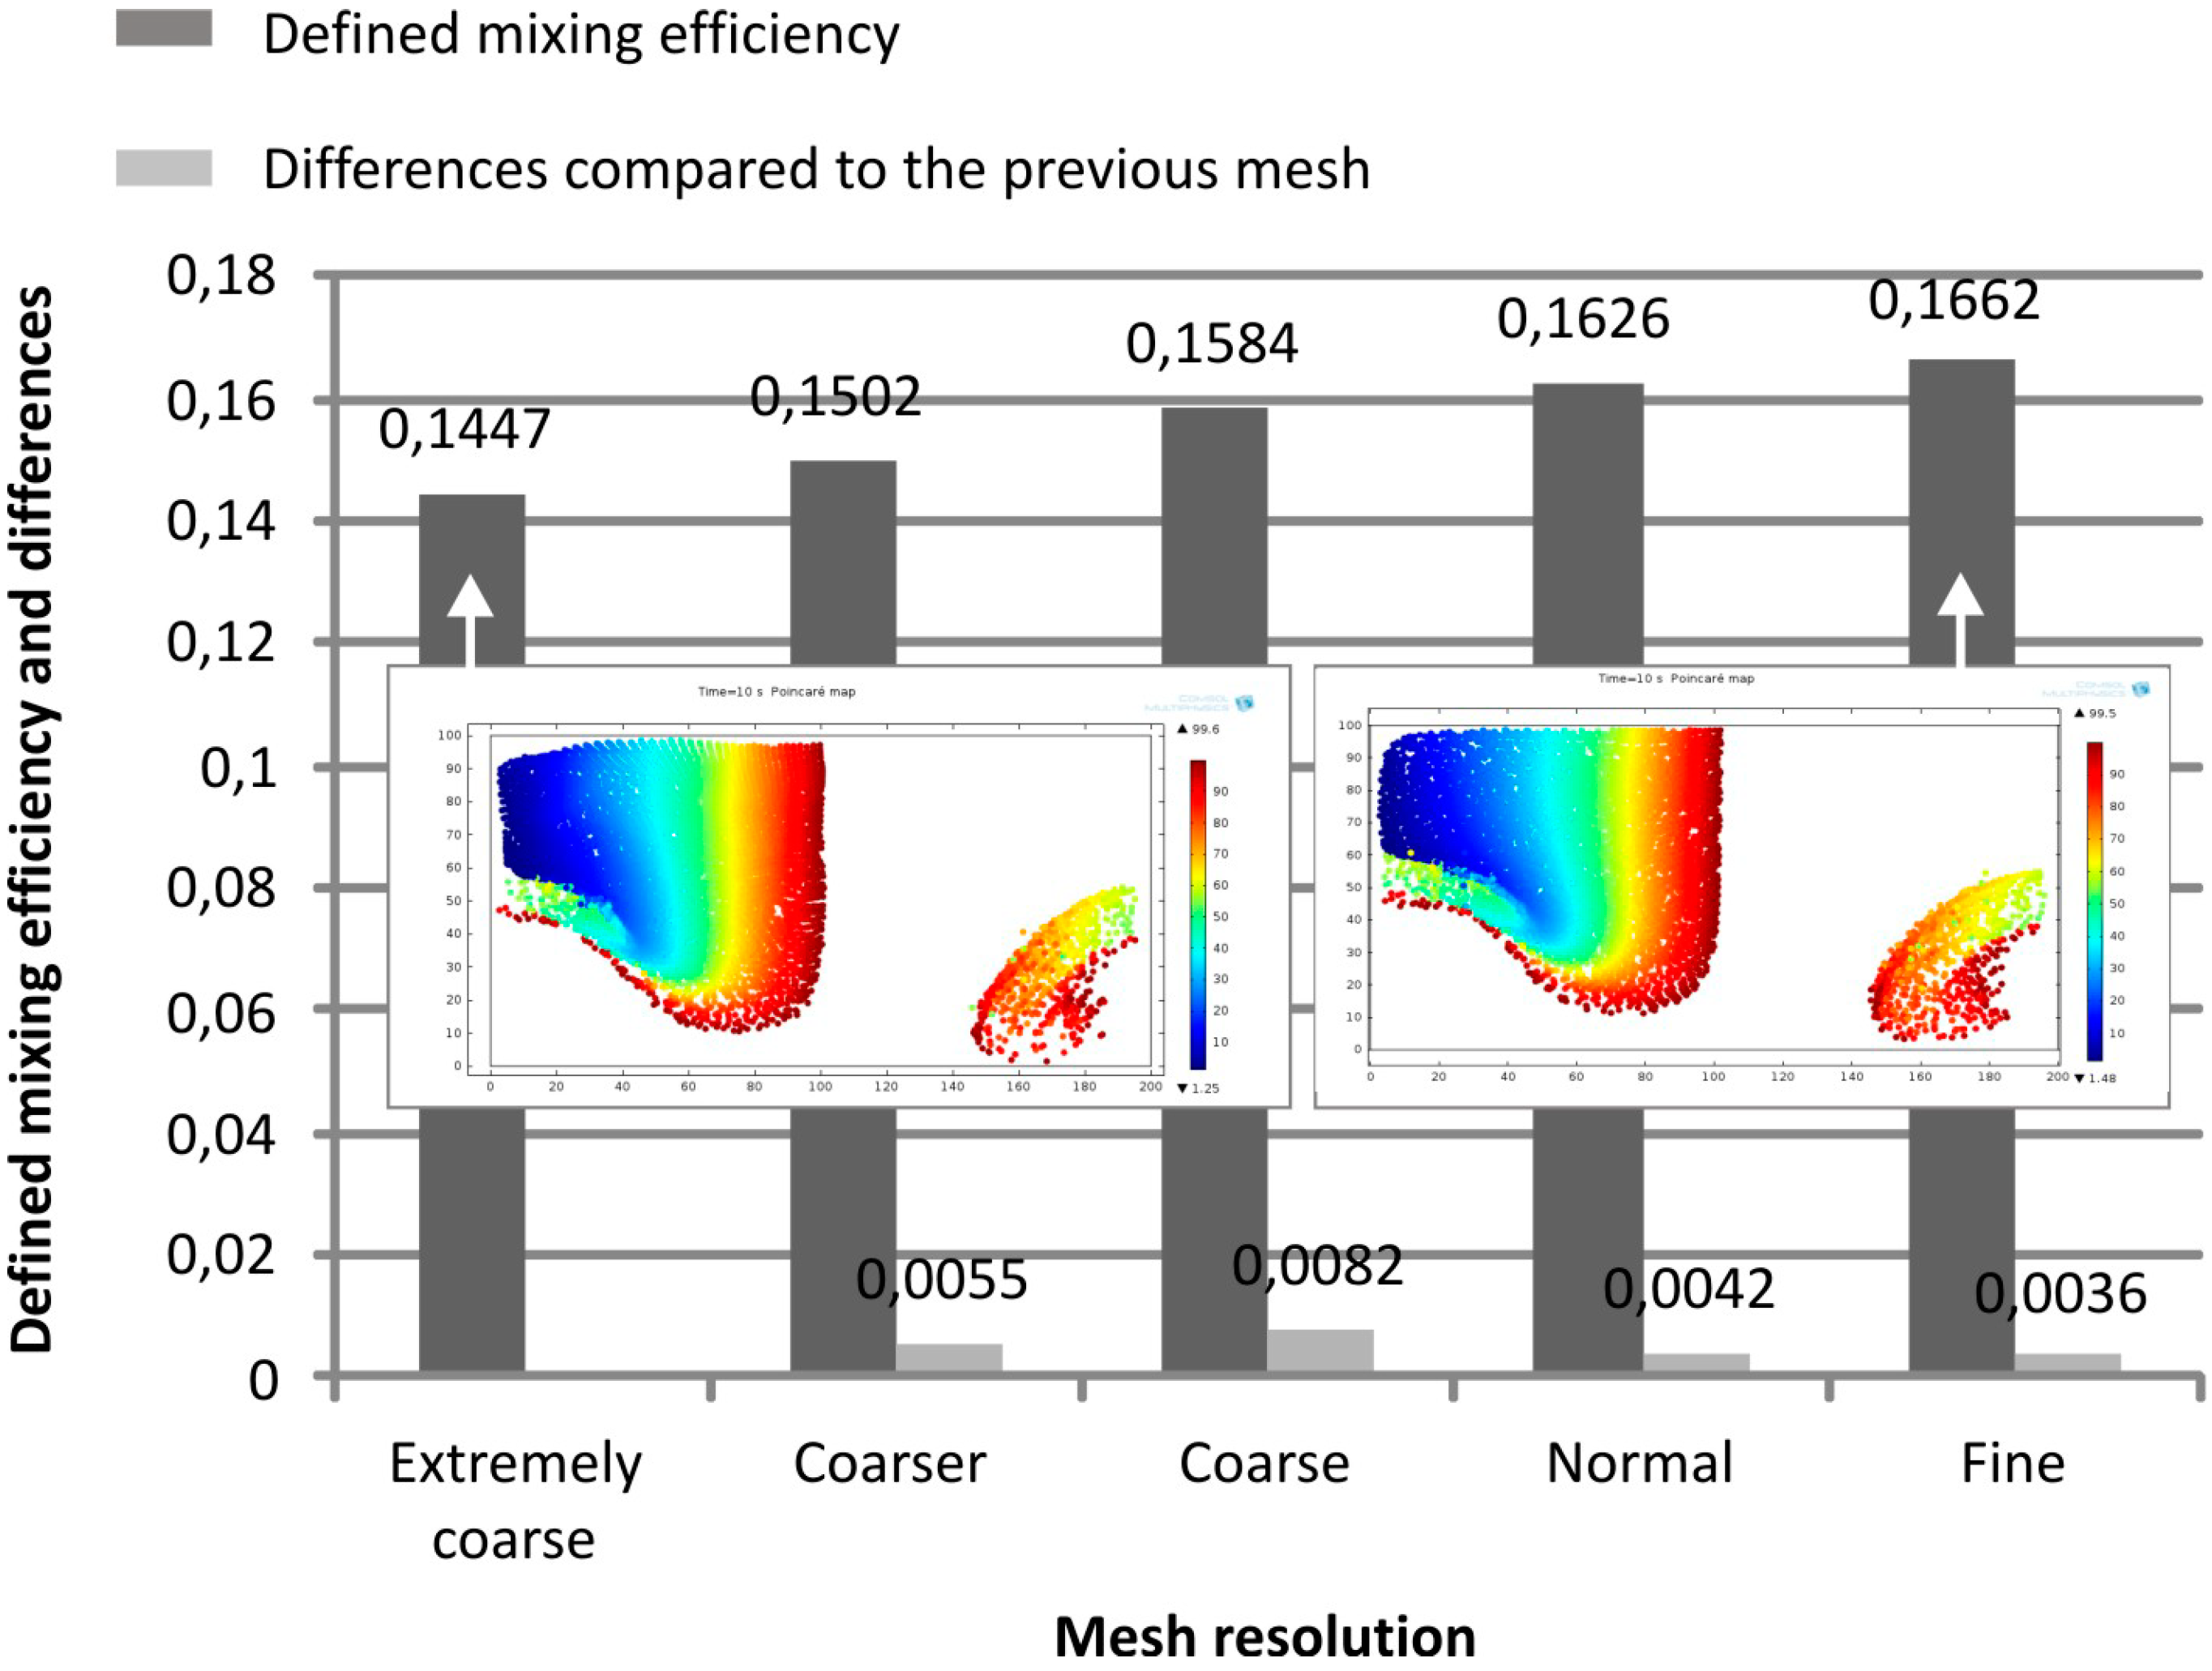
2.2. Modeling
| Boundary | Model | Boundary condition | Value |
|---|---|---|---|
| Inlet | CFD | Laminar inflow with average flow velocity | 0.002 m/s |
| Inlet | Trajectory | Particle inlet | 6000 particles with uniform density |
| Inflow1 | Concentration | Concentration | 100 mol/m3 |
| Inflow2 | Concentration | Concentration | 0 mol/m3 |
| Channel wall | CFD | No slip | - |
| Channel wall | Trajectory | Bounce (for the trajectory model) | - |
| Channel wall | Concentration | No flux | - |
| Mesh name | Number of elements | Average element size (μm) | Standard deviation of element size (μm) |
|---|---|---|---|
| Fine | 11,828,167 | 2.3752 | 1.8527 |
| Medium | 4,922,845 | 3.7606 | 2.4241 |
| Low | 1,788,920 | 5.4645 | 3.2021 |
| Coarse | 121,404 | 13.8776 | 8.5472 |
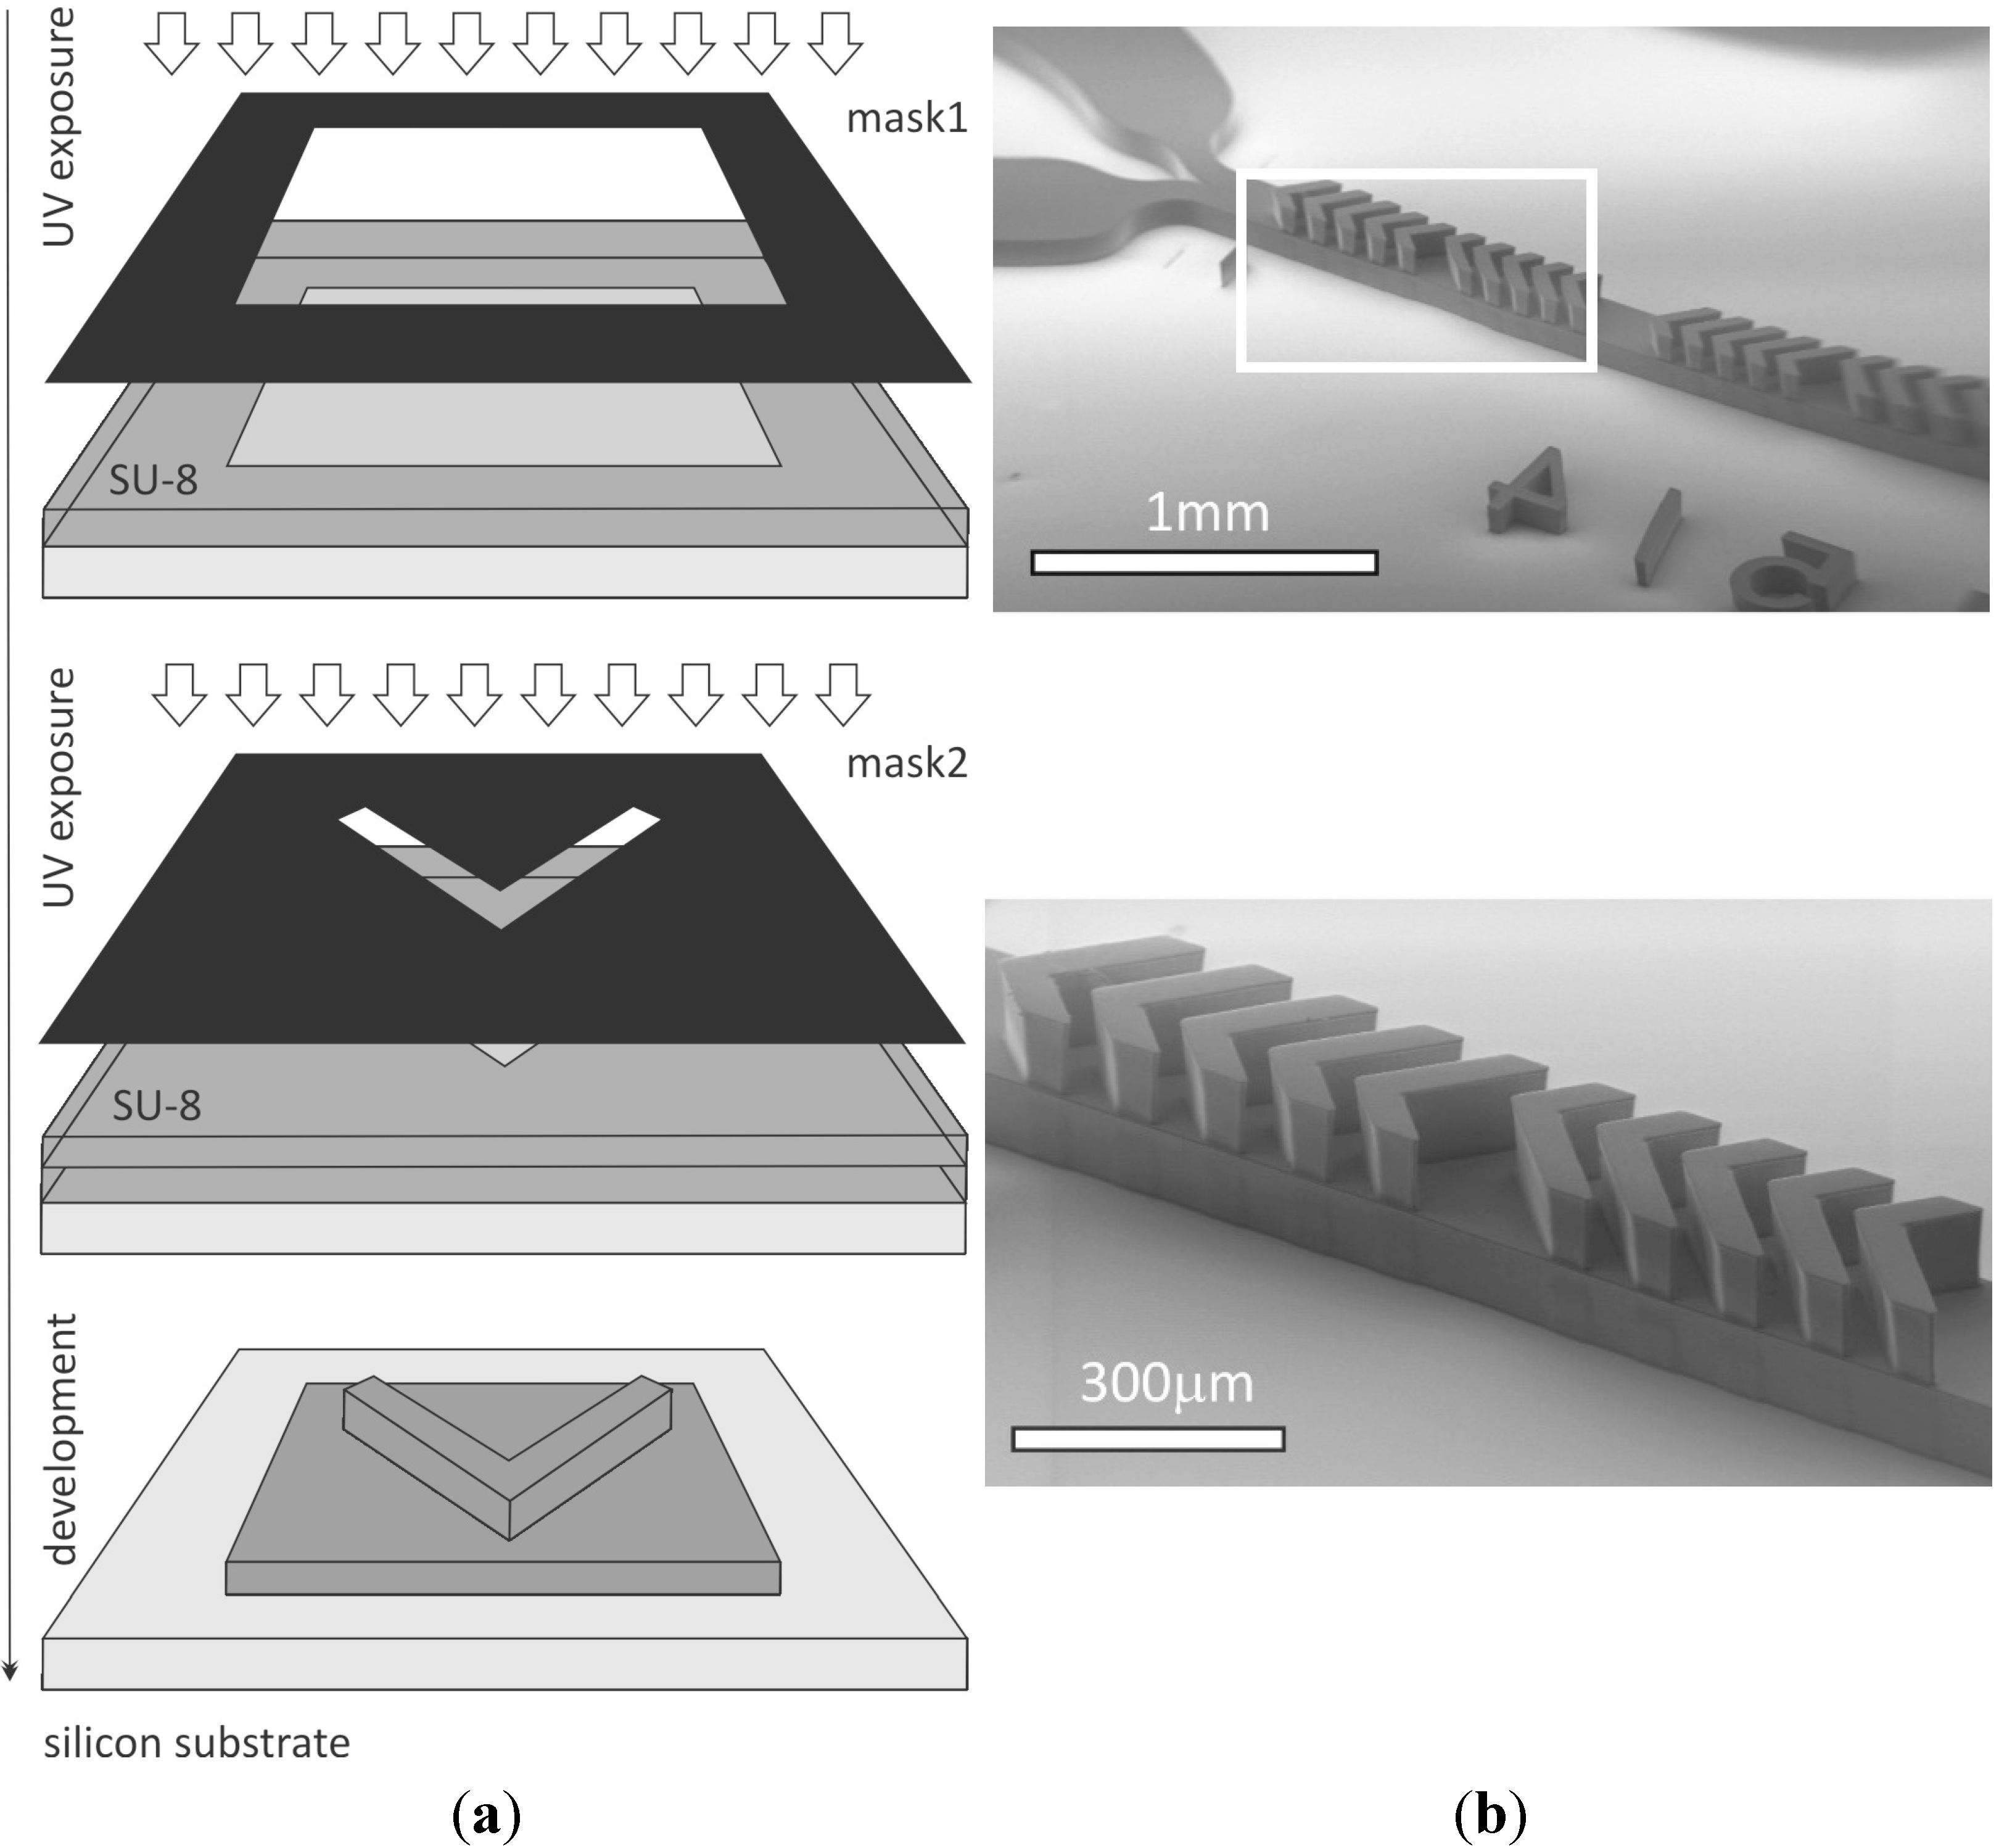
2.3. Fabrication
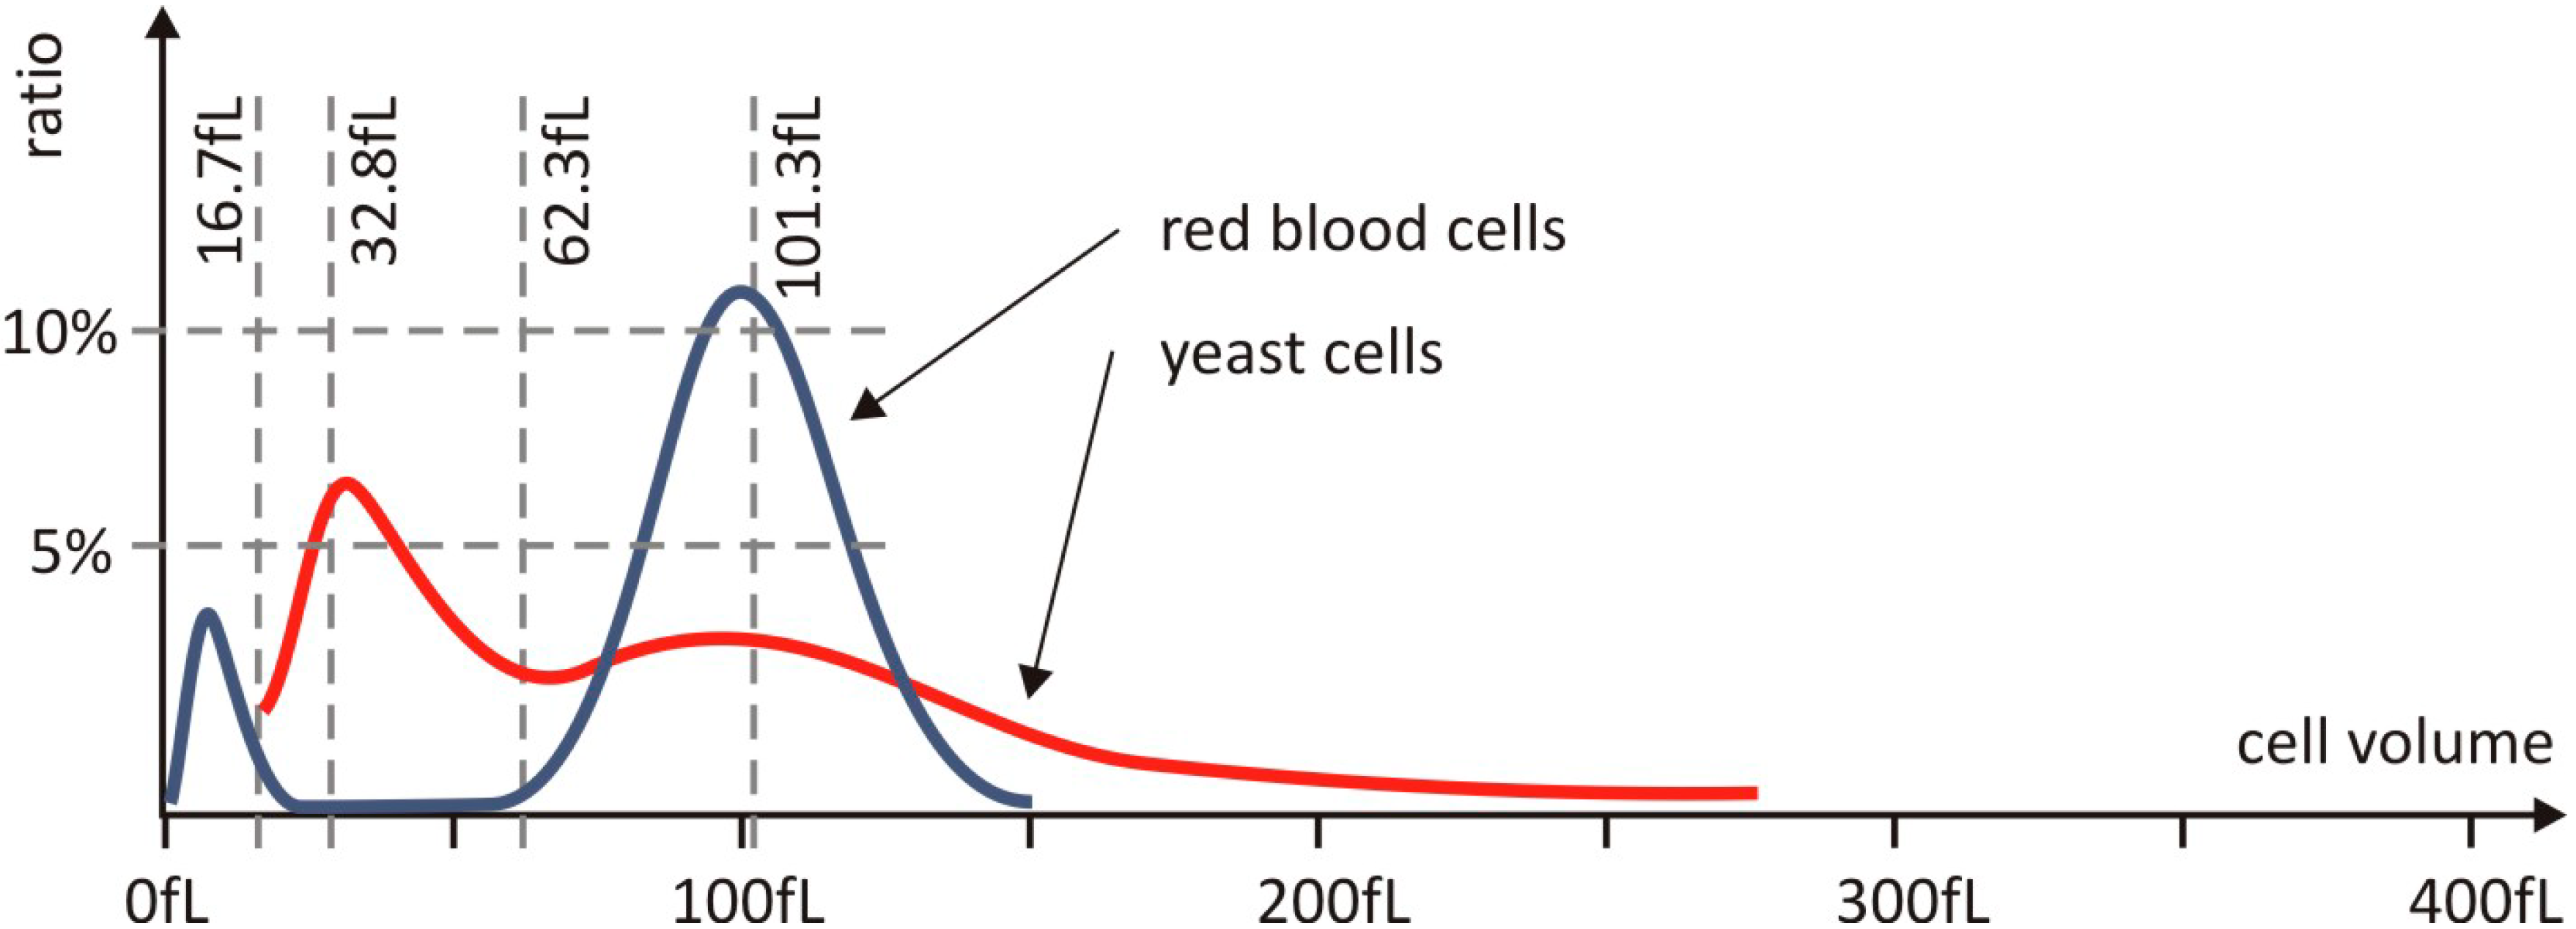
2.4. Measurement

3. Results and Discussion
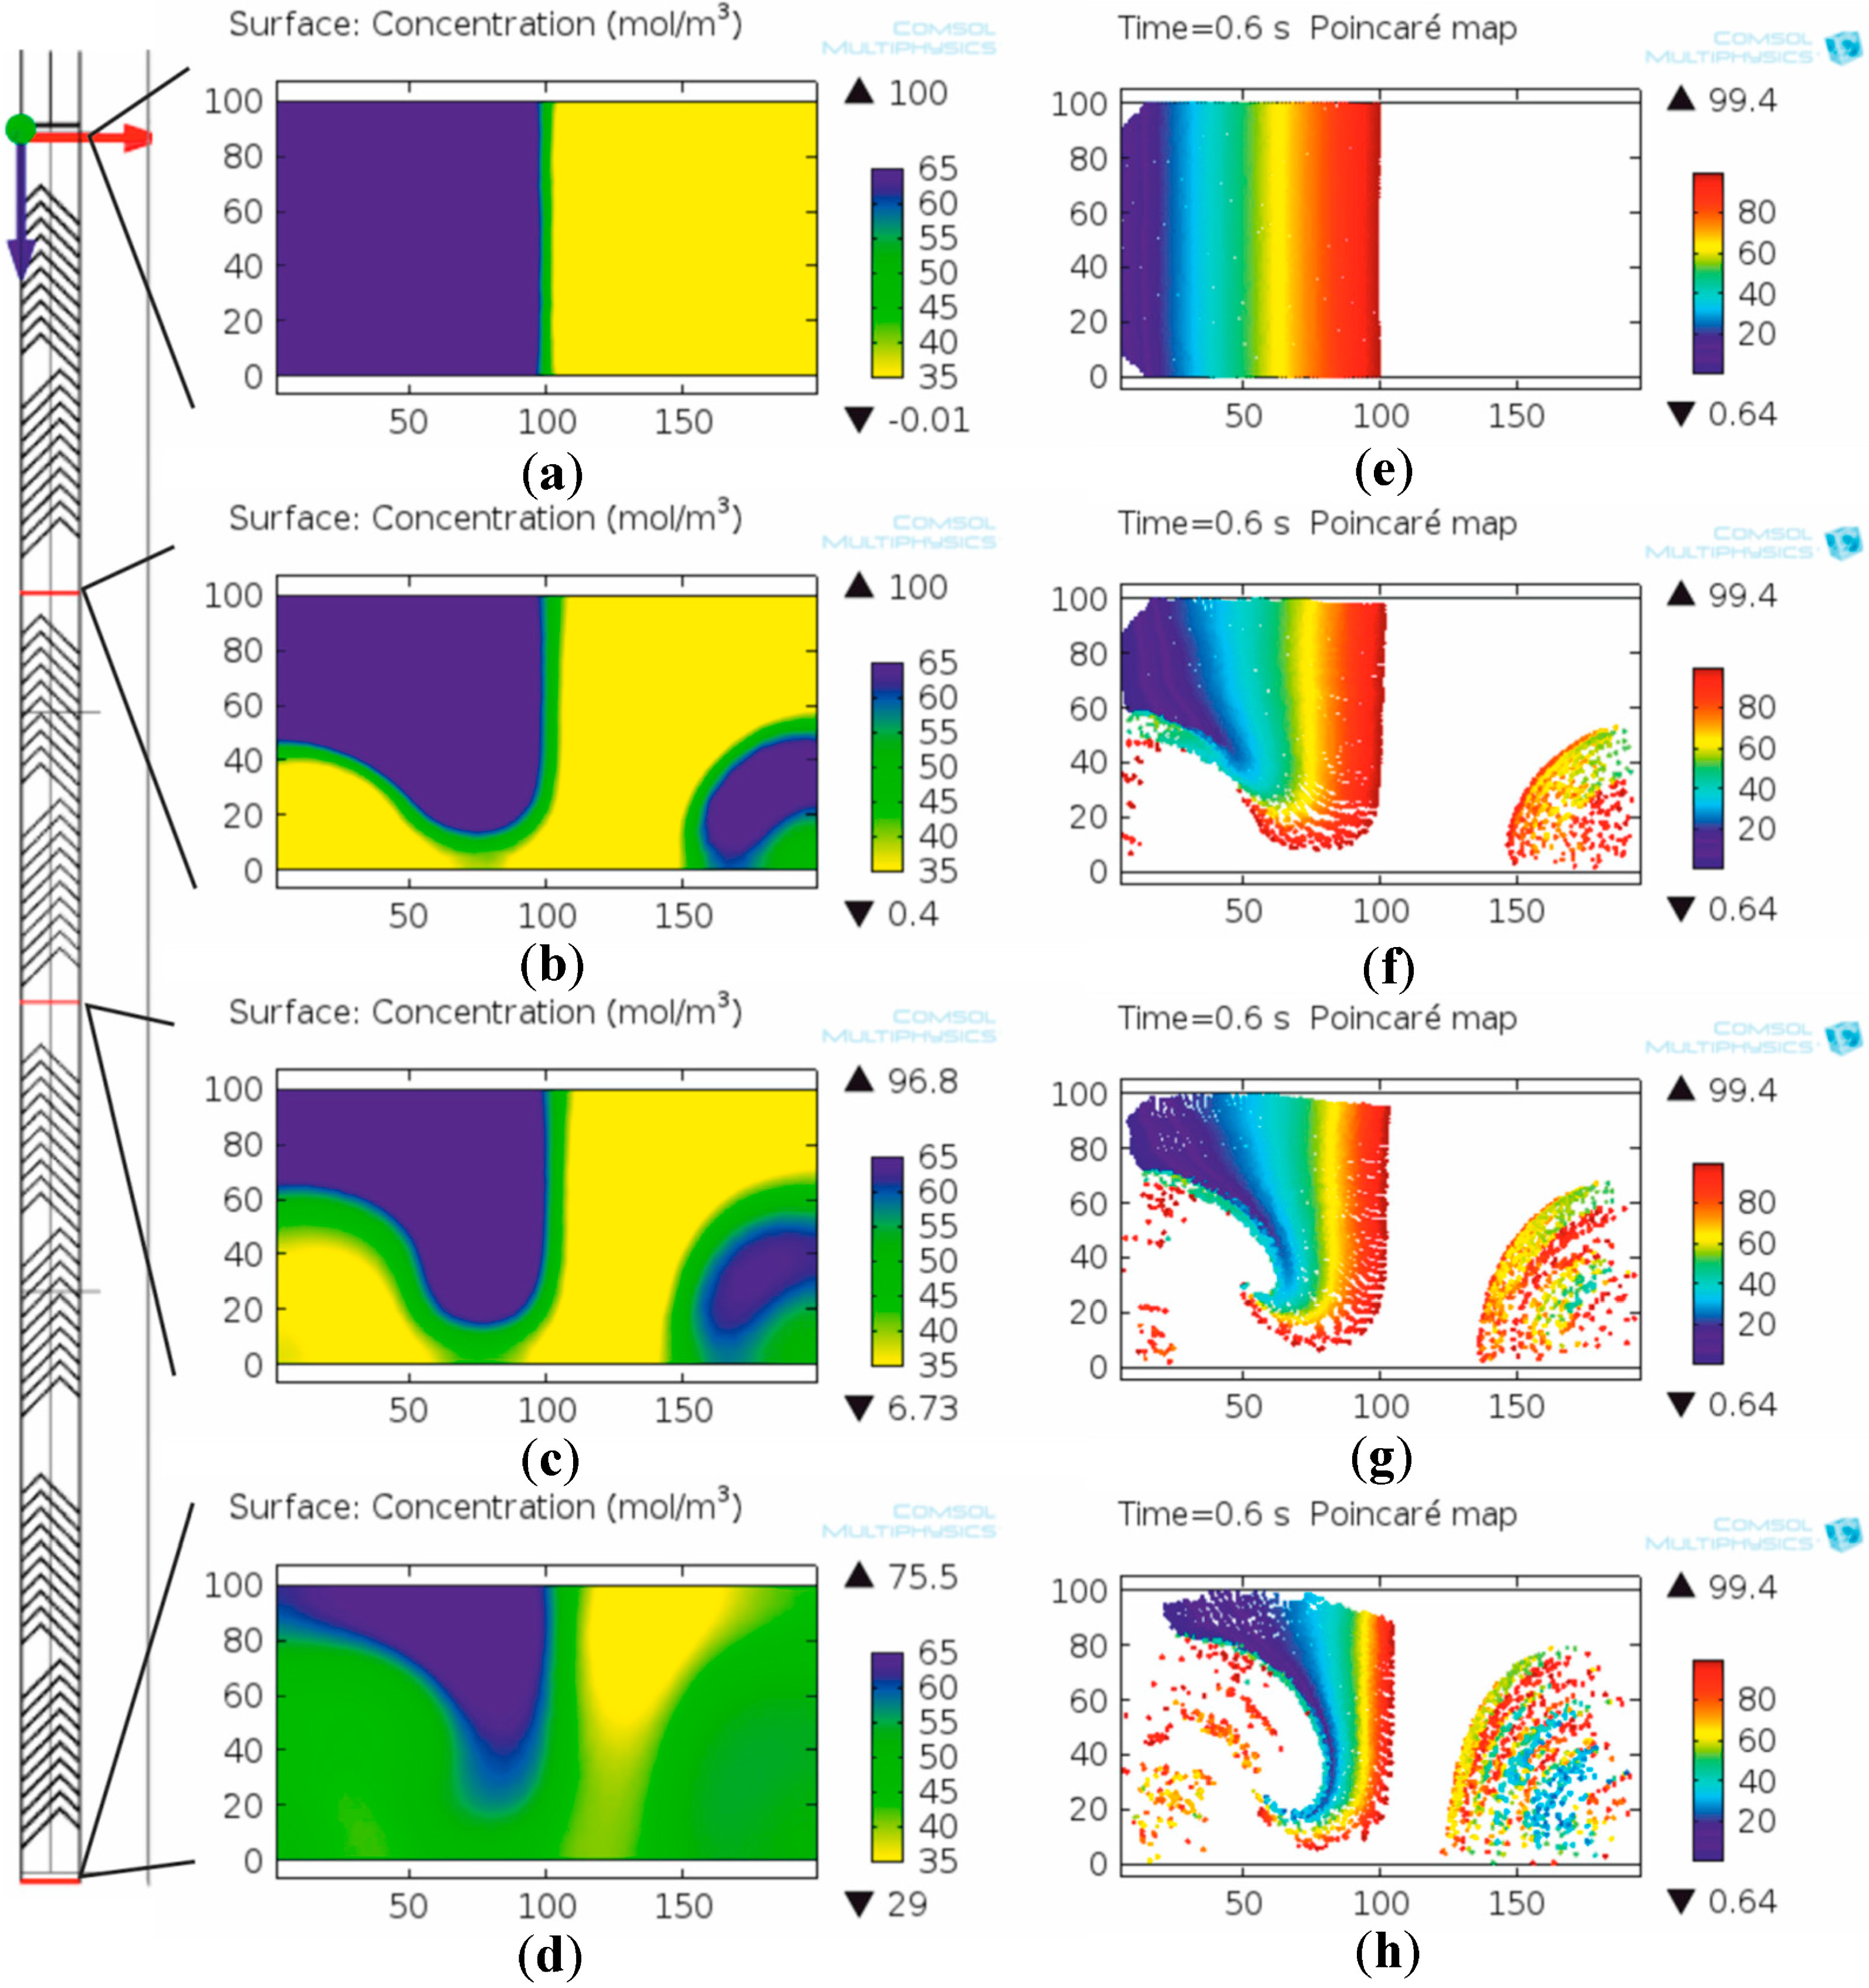
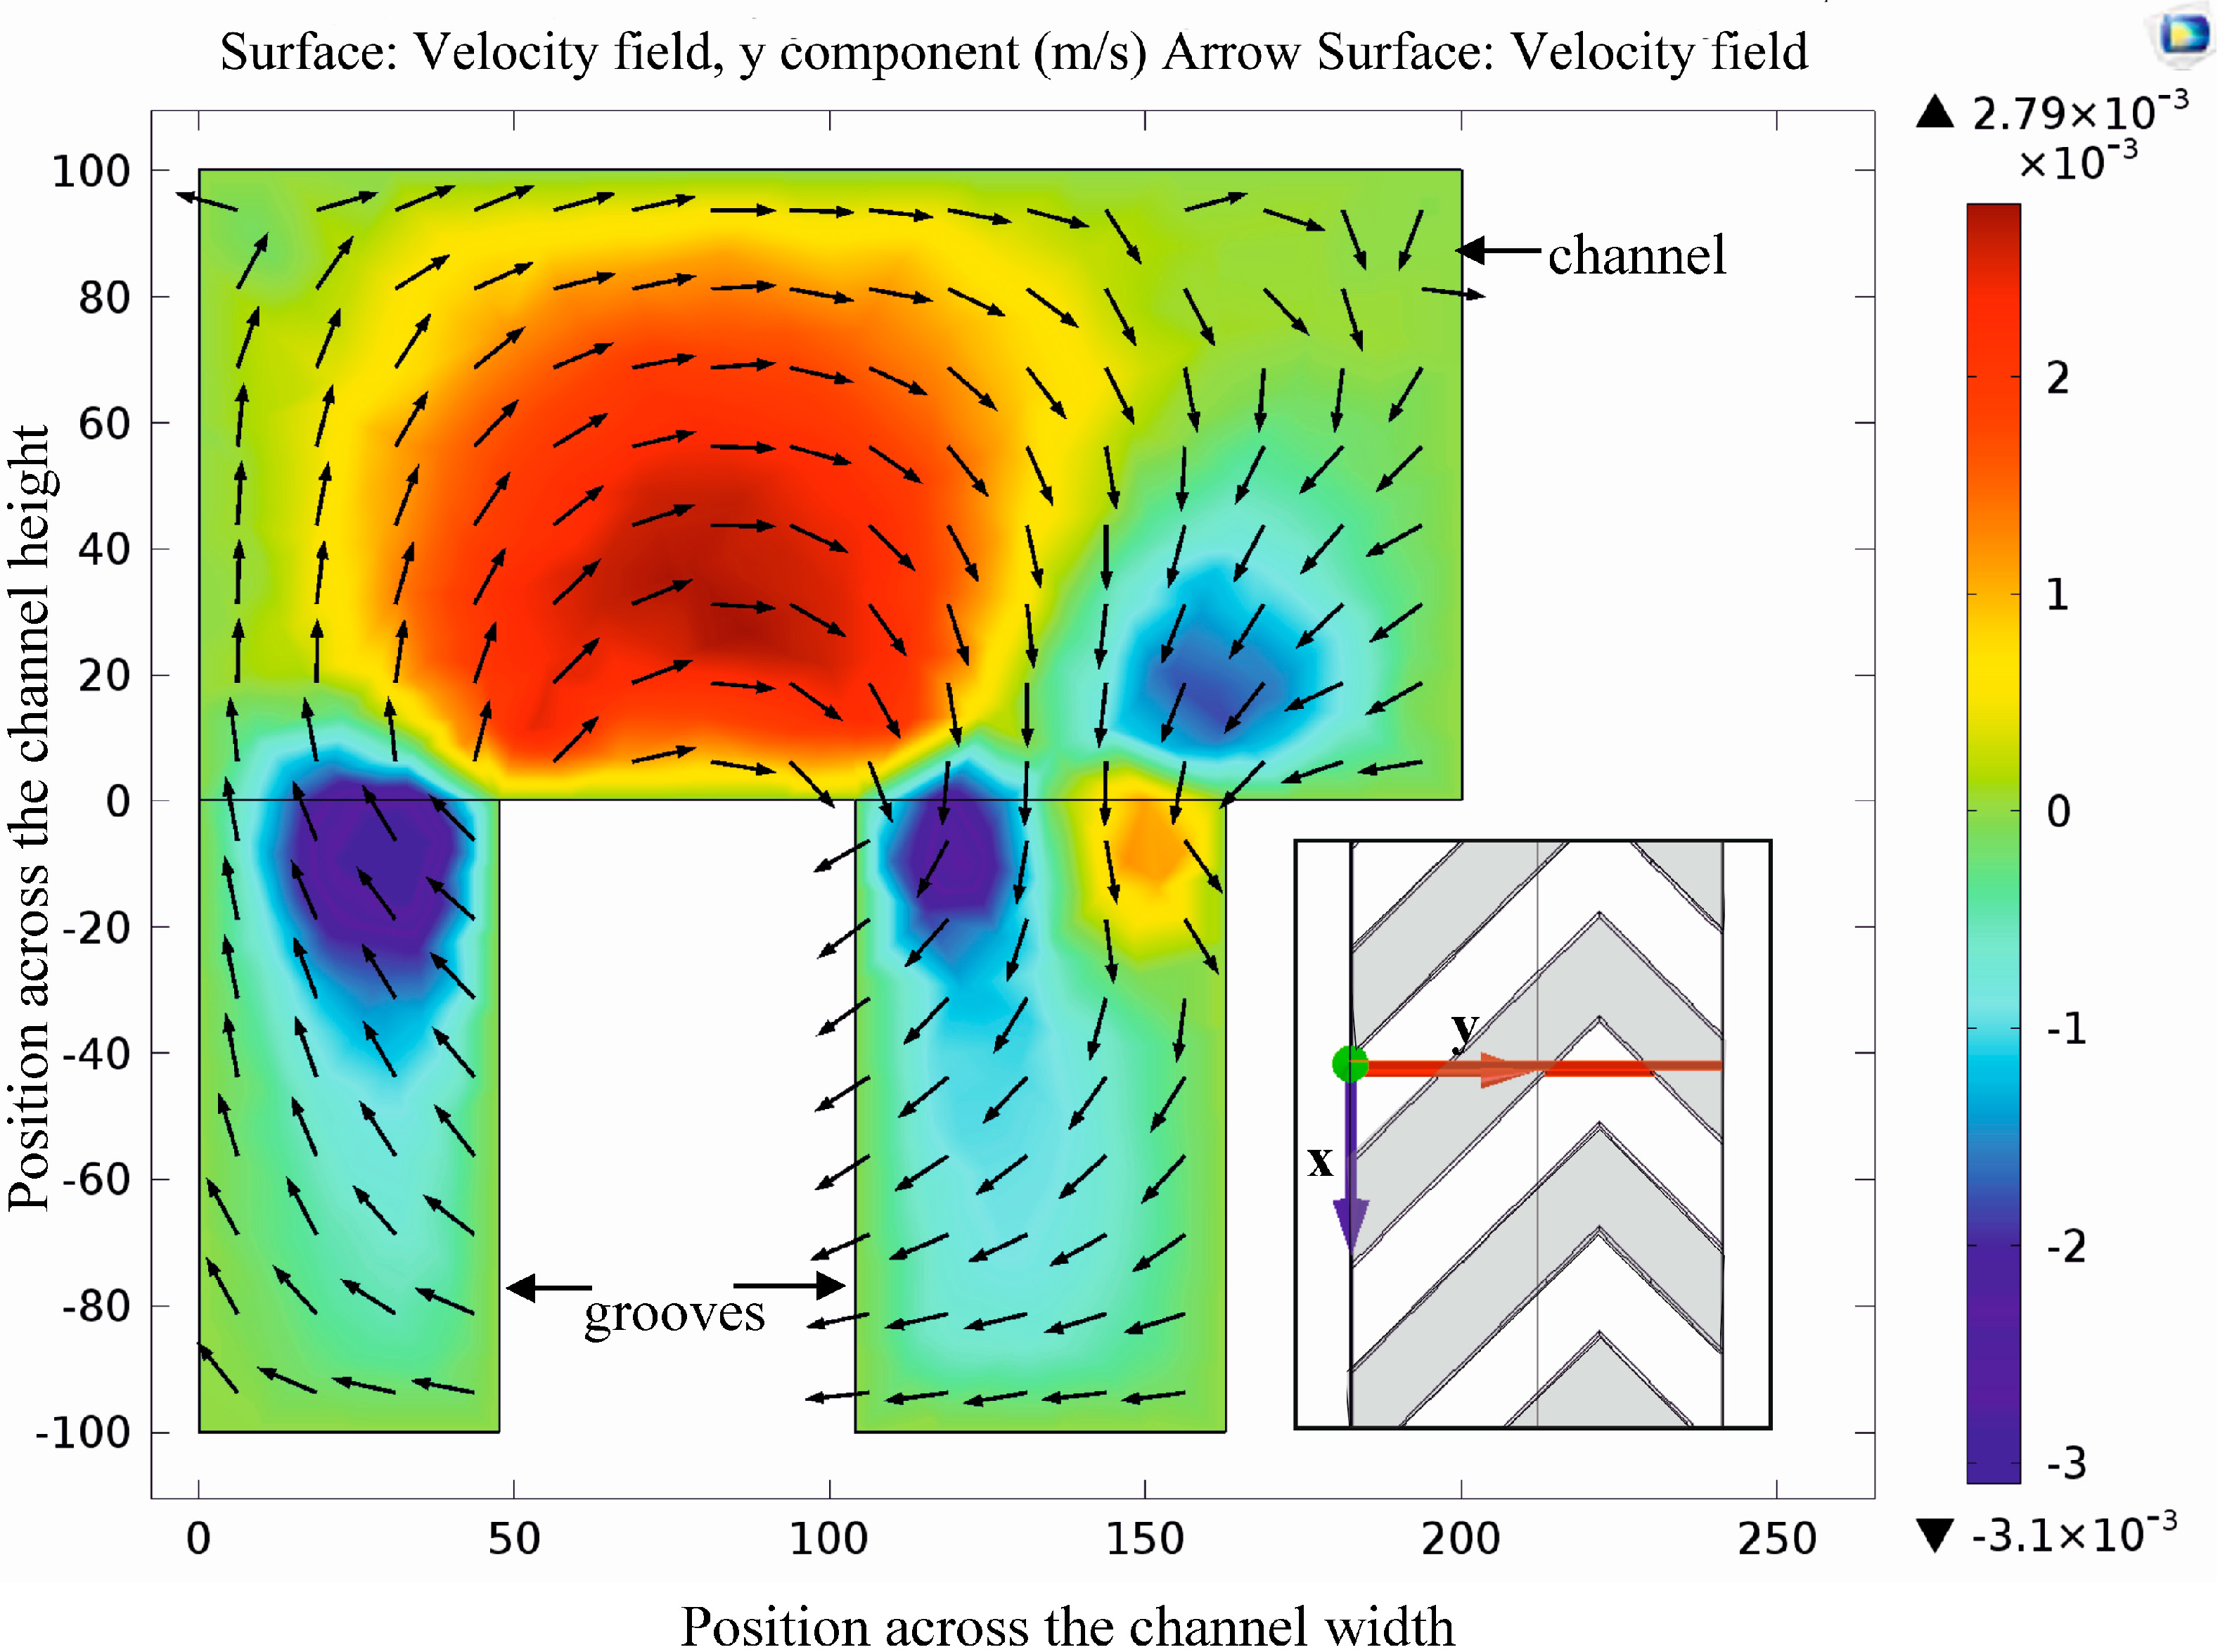
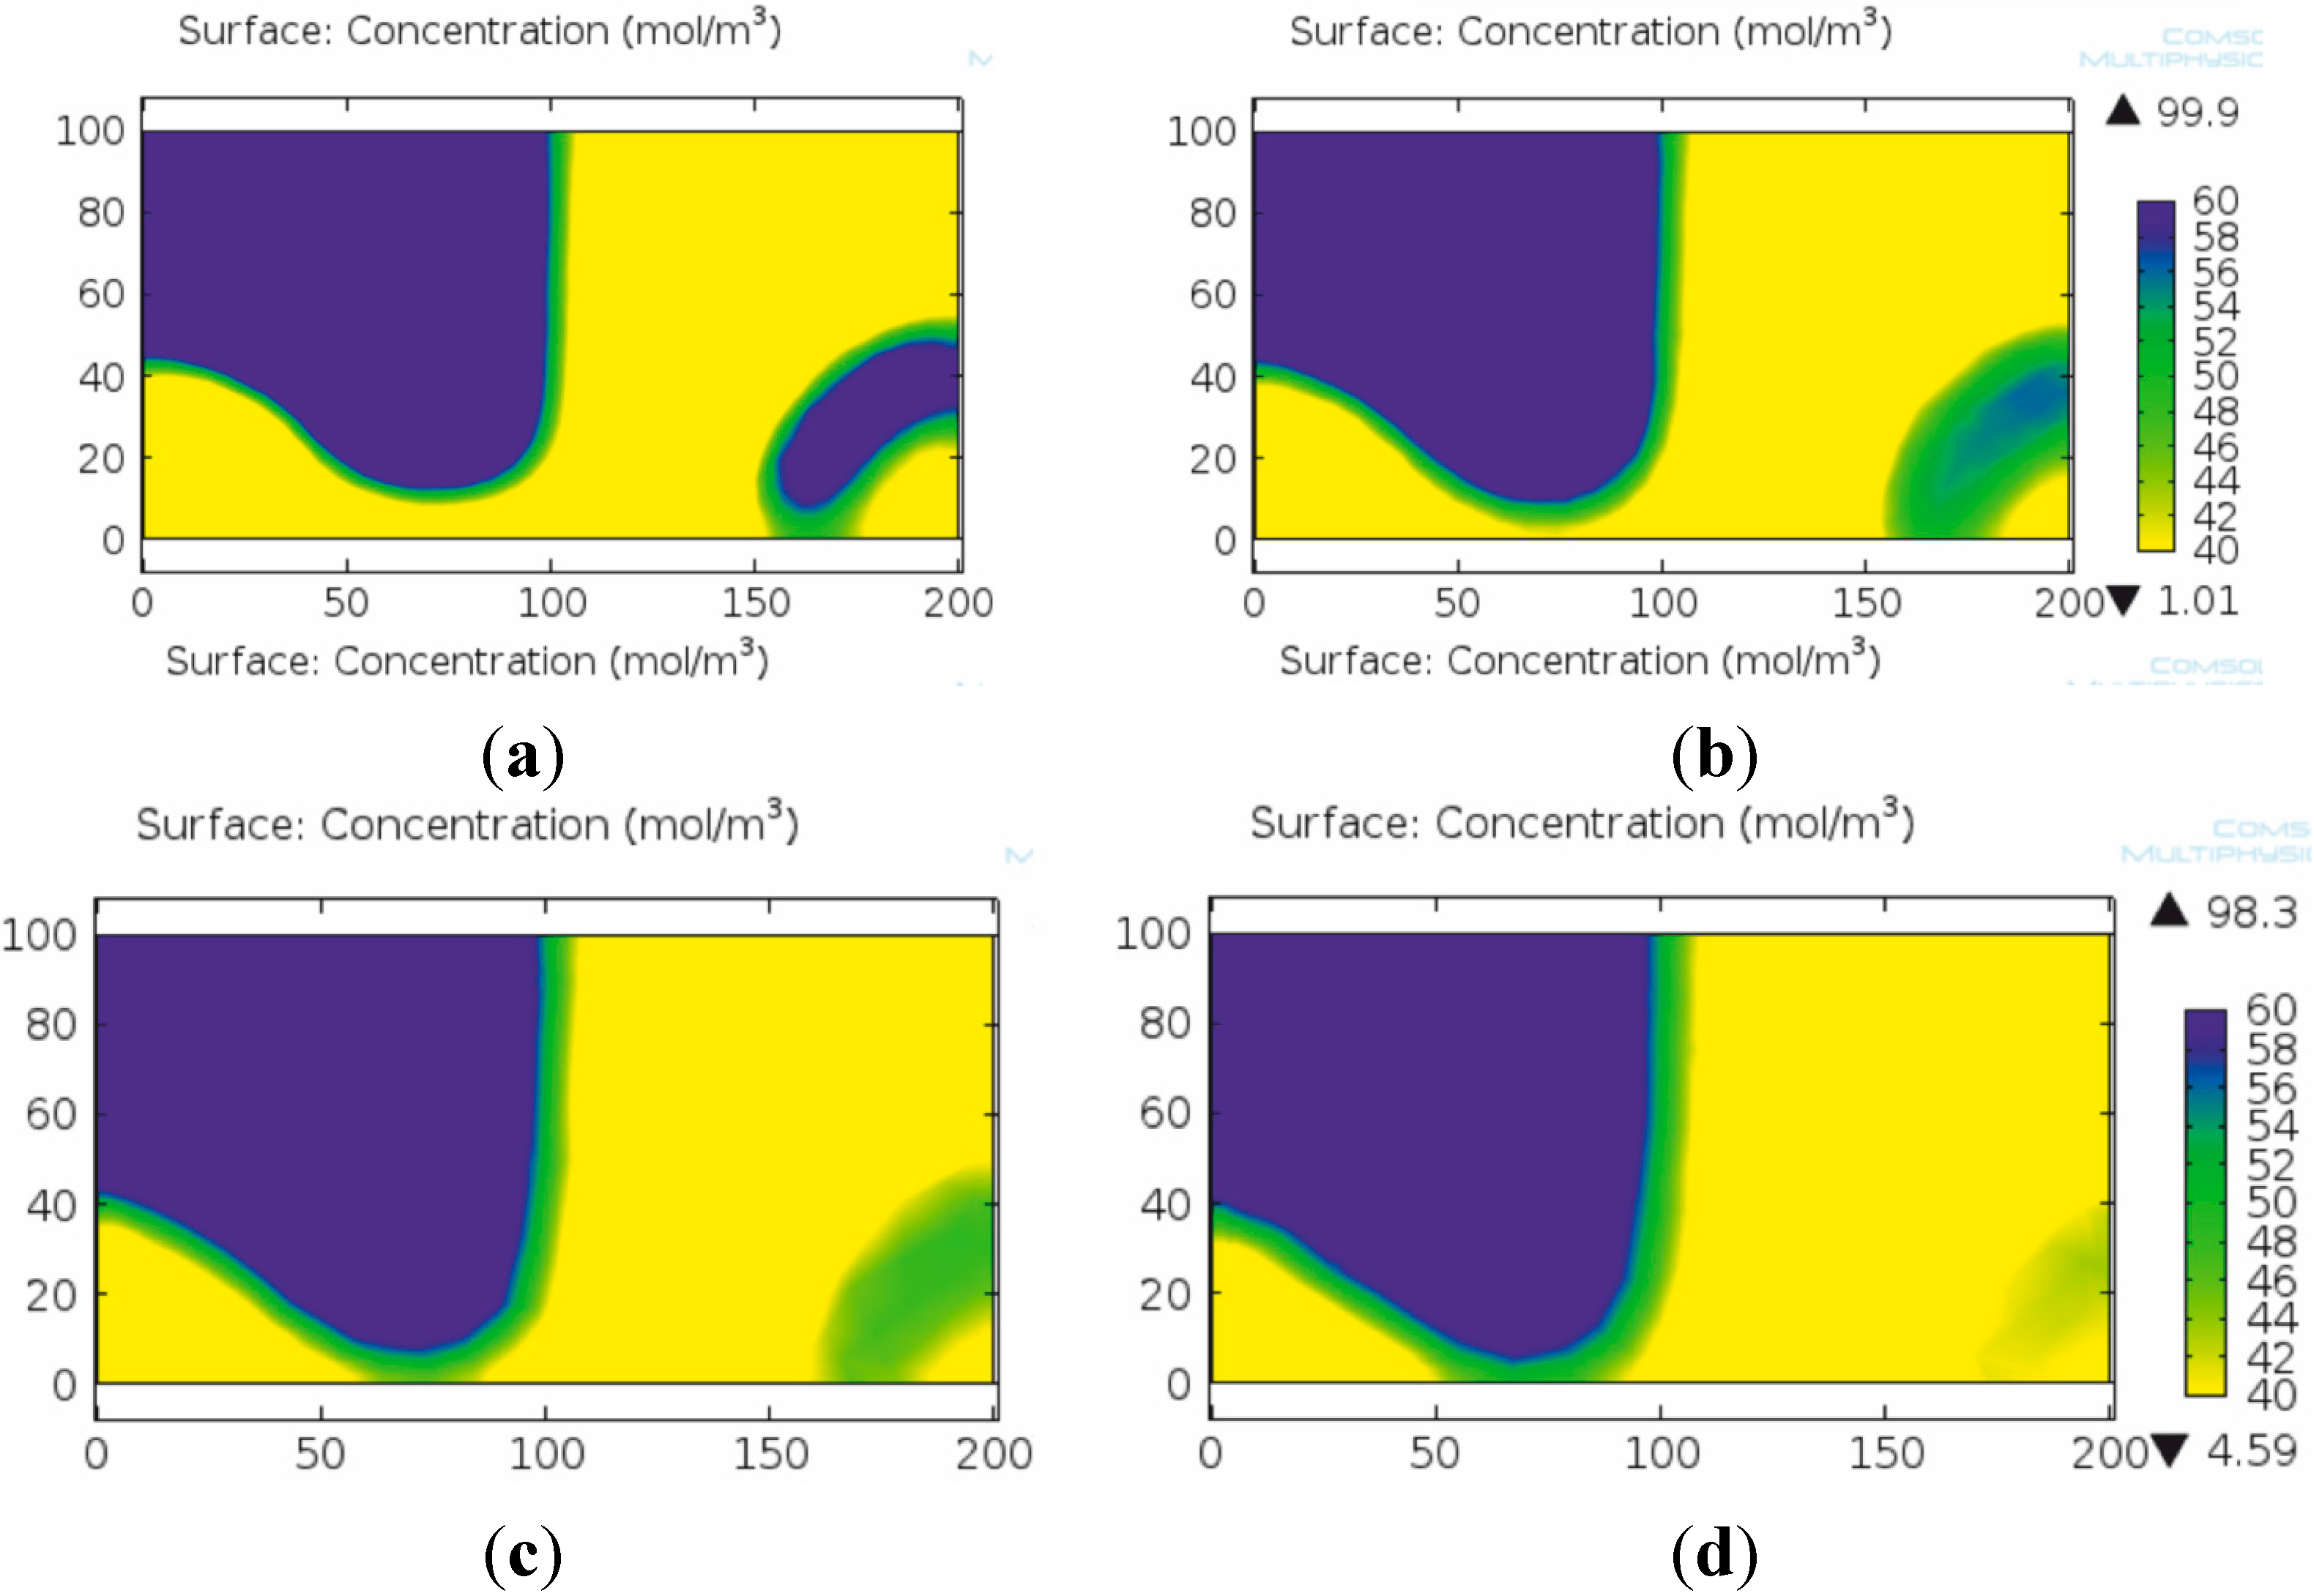
3.1. Modeling Results


| Geometry | 40/5/4 | 40/4/5 | 35/5/4 | 35/4/5 | 30/4/6 | 30/6/4 |
|---|---|---|---|---|---|---|
| Efficiency | 0.4526 | 0.4513 | 0.3655 | 0.2998 | 0.2105 | 0.1984 |
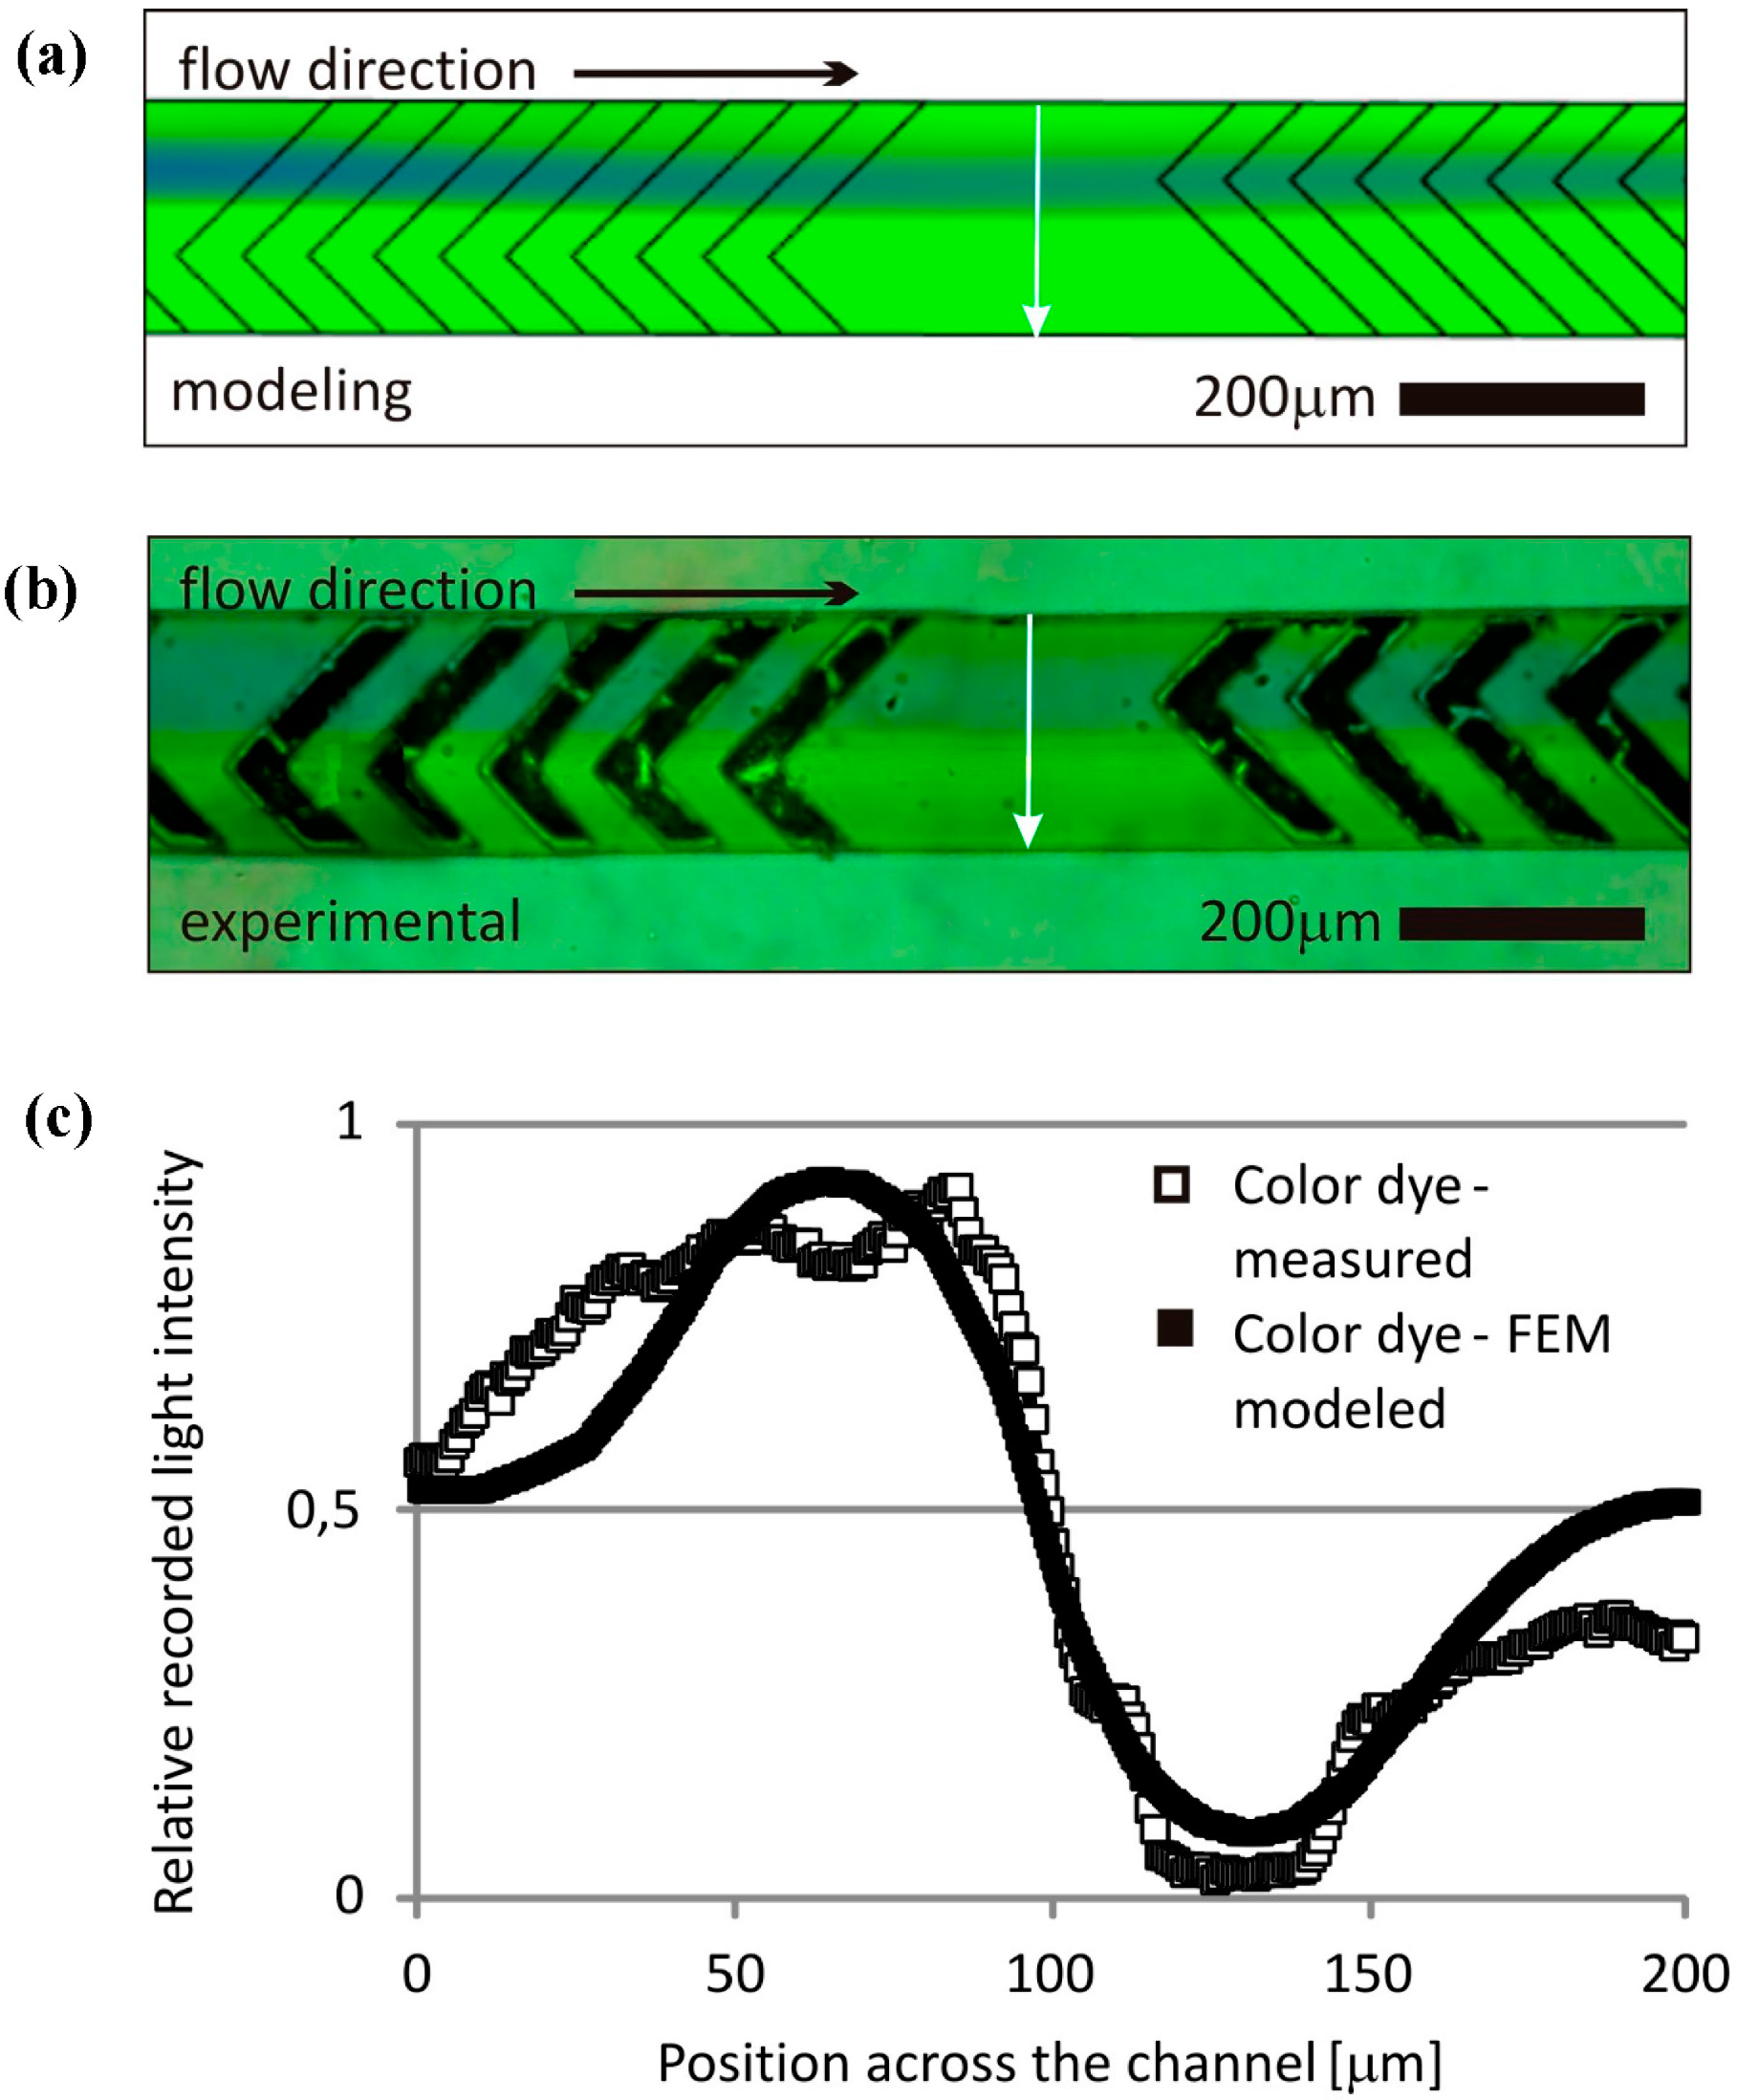
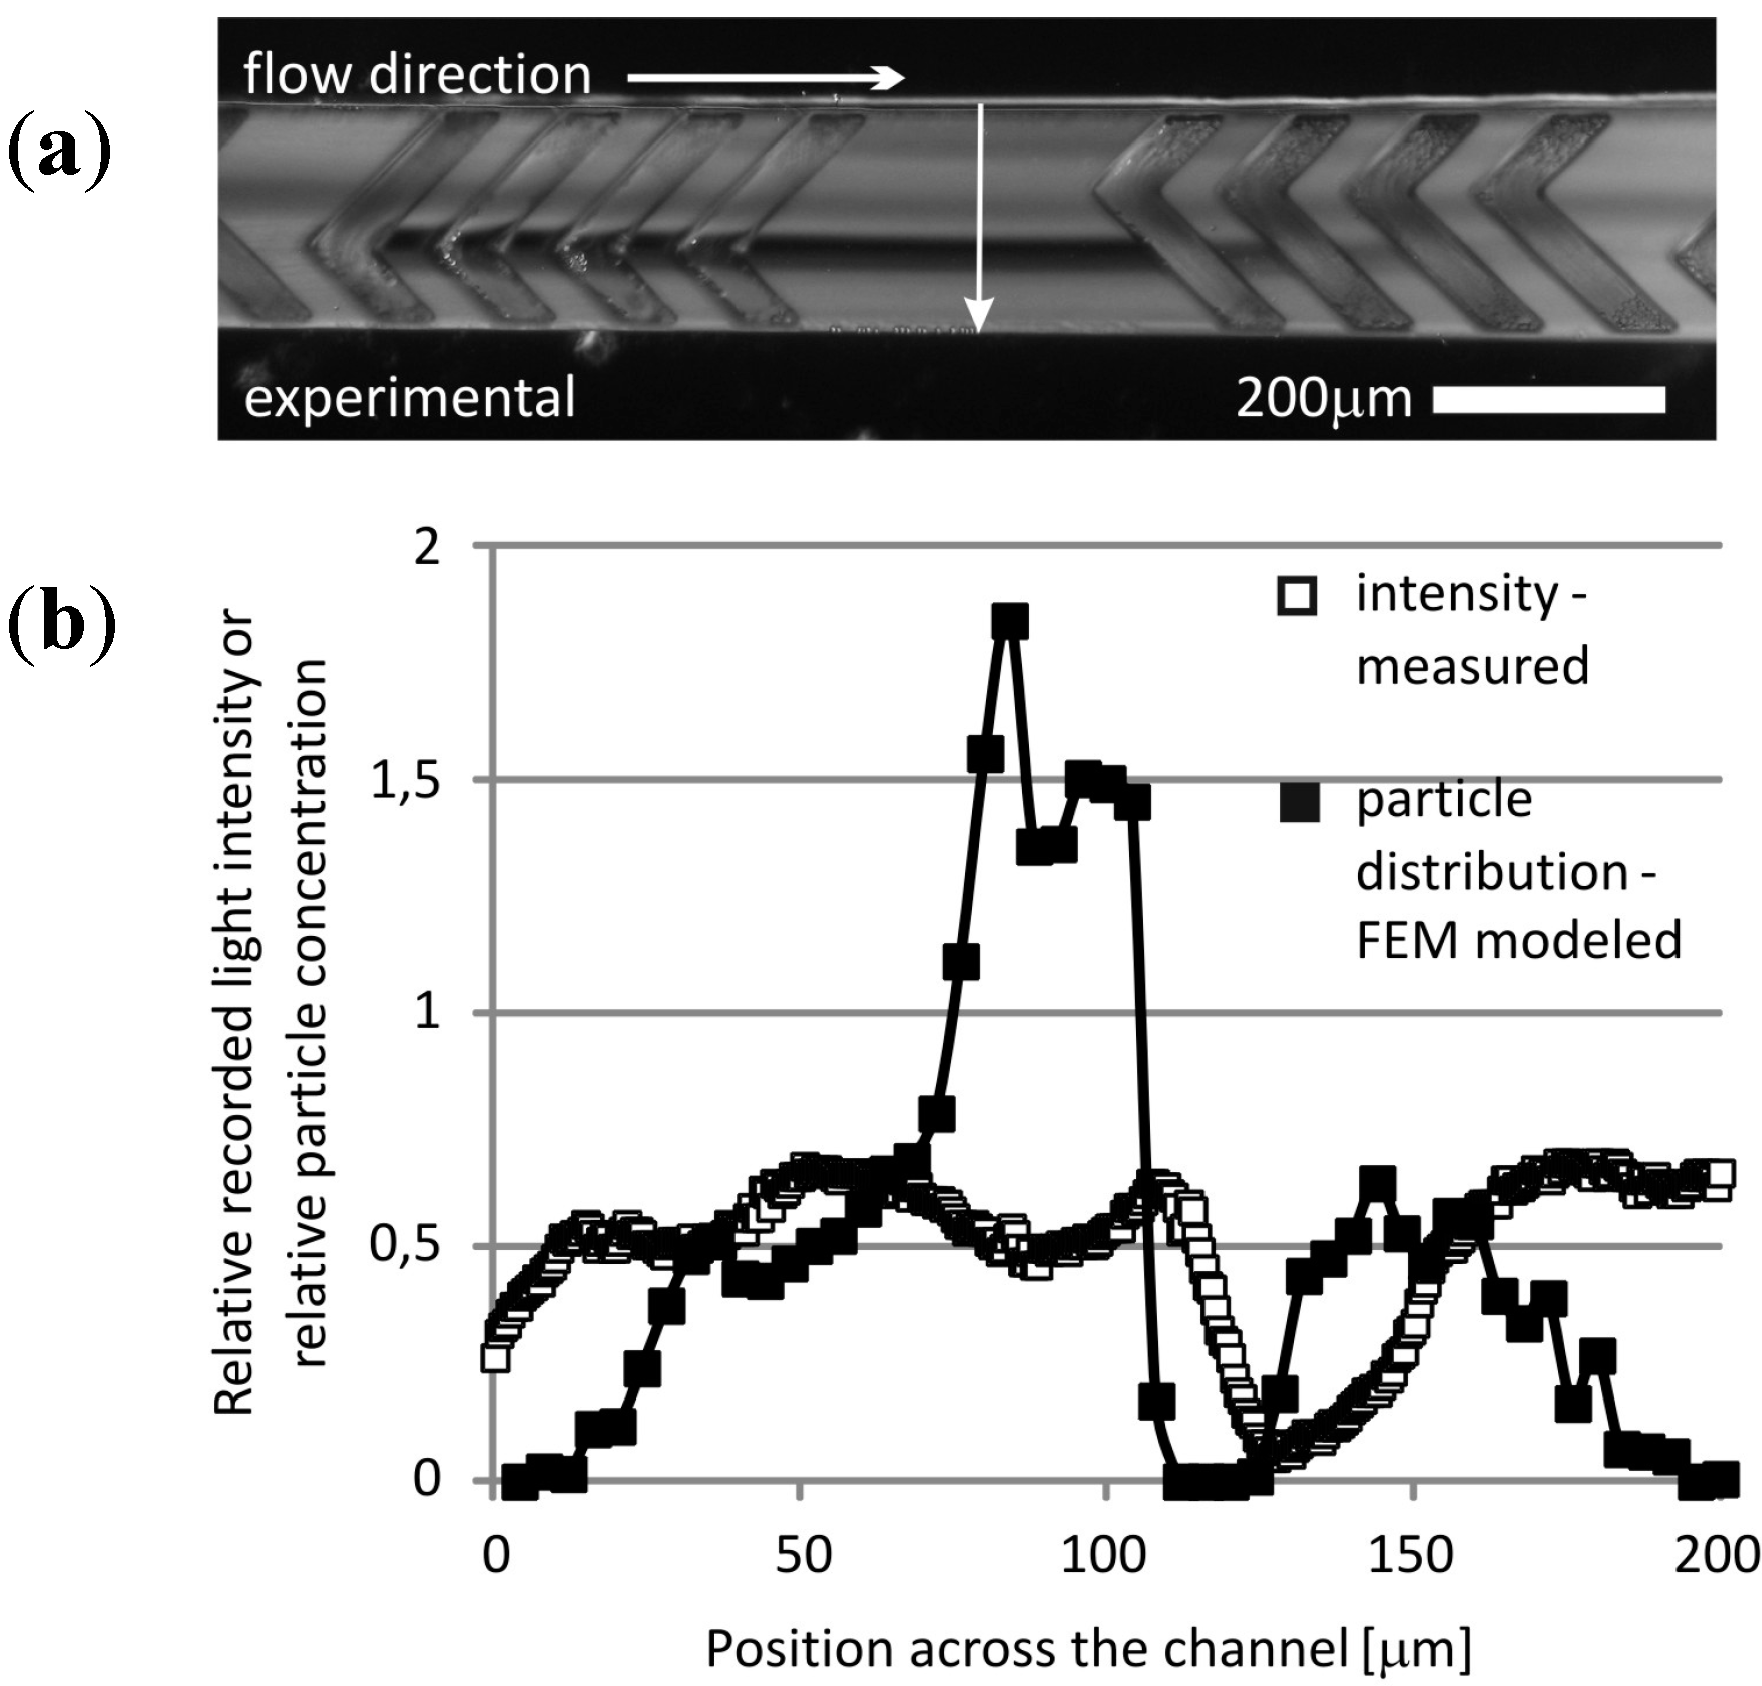
3.2. Experimental Validation
4. Conclusions
Acknowledgments
Author Contributions
Conflicts of Interest
References
- Erickson, D. Towards numerical prototyping of labs-on-chip: Modeling for integrated microfluidic devices. Microfluid. Nanofluid. 2005, 1, 301–318. [Google Scholar] [CrossRef]
- Fürjes, P.; Holczer, E.G.; Tóth, E.; Iván, K.; Fekete, Z.; Bernier, D.; Dortu, F.; Giannone, D. PDMS microfluidics developed for polymer based photonic biosensors. Microsyst. Technol. 2014, 2014, 1–10. [Google Scholar]
- Morenoa, N.; Vignalb, P.; Li, J.; Calo, V.M. Multiscale modeling of blood flow: Coupling finite elements with smoothed dissipative particle dynamics. Proced. Comput. Sci. 2013, 18, 2565–2574. [Google Scholar] [CrossRef]
- Shah, S.; Liu, Y.; Hu, W.; Gao, J. Modeling Particle Shape-Dependent Dynamics in Nanomedicine. J. Nanosci. Nanotechnol. 2011, 11, 919–928. [Google Scholar] [CrossRef] [PubMed]
- Capretto, L.; Carugo, D.; Mazzitelli, S.; Nastruzzi, C.; Zhang, X. Microfluidic and lab-on-a-chip preparation routes for organic nanoparticles and vesicular systems for nanomedicine applications. Adv. Drug Deliv. Rev. 2013, 65, 1496–1532. [Google Scholar] [CrossRef] [PubMed]
- Khan, I.U.; Serra, C.A.; Anton, N.; Vandamme, T.F. Production of nanoparticle drug delivery systems with microfluidics tools. Expert Opin. Drug Deliv. 2014, 2014, 1–16. [Google Scholar]
- Stroock, A.D.; Dertinger, S.K.W.; Ajdari, A.; Mezić, I.; Stone, H.A.; Whitesides, G.M. Chaotic Mixer for Microchannels. Science 2002, 295, 647–651. [Google Scholar] [CrossRef] [PubMed]
- De Mello, A.J. Control and detection of chemical reactions in microfluidic systems. Nature 2006, 442, 394–402. [Google Scholar] [CrossRef] [PubMed]
- Nguyen, N.-T. Micromixers: Fundamentals, Design and Fabrication; William Andrew Publishing: Norwich, NY, USA, 2011. [Google Scholar]
- Aref, H. Stirring by chaotic advection. J. Fluid Mech. 1984, 143, 1–21. [Google Scholar] [CrossRef]
- Aref, H. The development of chaotic advection. Phys. Fluids 2002, 14, 1315–1325. [Google Scholar] [CrossRef]
- COMSOL Multiphysics. Available online: http://www.comsol.com (accessed on 30 September 2014).
- Lantz, R.B. Quantitative Evaluation of Numerical Diffusion (truncation Error). Soc. Pet. Eng. J. 1970, 11, 315–320. [Google Scholar] [CrossRef]
- Density of Blood. Available online: http://hypertextbook.com/facts/2004/MichaelShmukler.shtml (accessed on 15 November 2014).
- Kutz, M. Standard Handbook of Biomedical Engineering and Design; McGraw-Hill: New York, NY, USA, 2003. [Google Scholar]
- Dow Corning Corp. Available online: http://www.dowcorning.com (accessed on 30 September 2014).
- MicroChem Corp. Available online: http://www.microchem.com (accessed on 30 September 2014).
- Del Campo, A.; Greiner, C. SU-8: A photoresist for high-aspect-ratio and 3D submicron lithography. J. Micromech. Microeng. 2007, 17, 81–95. [Google Scholar] [CrossRef]
- Mata, A.; Fleischman, A.J.; Roy, S. Fabrication of multi-layer SU-8 microstructures. J. Micromech. Microeng. 2006, 16, 276. [Google Scholar] [CrossRef]
- Lin, D.; He, F.; Liao, Y.; Lin, J.; Liu, C.; Song, J.; Cheng, Y. Three-dimensional staggered herringbone mixer fabricated by femtosecond laser direct writing. J. Opt. 2013, 15, 025601. [Google Scholar] [CrossRef]
- Brewer Science Inc. Available online: http://www.brewerscience.com (accessed on 30 September 2014).
- SÜSS MicroTec AG. Available online: http://www.suss.com (accessed on 30 September 2014).
- Terra Universal Inc. Available online: http://www.terrauniversal.com (accessed on 30 September 2014).
- Gervais, L.; Delamarche, E. Toward one-step point-of-care immunodiagnostics using capillary-driven microfluidics and PDMS substrates. Lab Chip 2009, 9, 3330–3337. [Google Scholar] [CrossRef] [PubMed]
- Material Safety Data Sheet Tartrazine MSDS. Available online: http://www.vinayakcorporation.com/tarmsdc.htm (accessed on 30 September 2014).
- ZEISS International. Available online: http://www.zeiss.com (accessed on 30 September 2014).
- Diatron MI PLC. Available online: http://www.diatron.com (accessed on 30 September 2014).
- ImageJ. Available online: http://imagej.nih.gov/ij/index.html (accessed on 30 September 2014).
- Dong, Y.; Skelley, A.M.; Merdek, K.D.; Sprott, K.M.; Jiang, C.; Pierceall, W.E.; Lin, J.; Stocum, M.; Carney, W.P.; Smirnov, D.A. Microfluidics and Circulating Tumor Cells. J. Mol. Diagn. 2013, 15, 149–157. [Google Scholar] [CrossRef] [PubMed]
- P3SENS Project. Available online: http://www.p3sens-project.eu/ (accessed on 22 November 2014).
© 2014 by the authors; licensee MDPI, Basel, Switzerland. This article is an open access article distributed under the terms and conditions of the Creative Commons Attribution license (http://creativecommons.org/licenses/by/4.0/).
Share and Cite
Tóth, E.L.; Holczer, E.G.; Iván, K.; Fürjes, P. Optimized Simulation and Validation of Particle Advection in Asymmetric Staggered Herringbone Type Micromixers. Micromachines 2015, 6, 136-150. https://doi.org/10.3390/mi6010136
Tóth EL, Holczer EG, Iván K, Fürjes P. Optimized Simulation and Validation of Particle Advection in Asymmetric Staggered Herringbone Type Micromixers. Micromachines. 2015; 6(1):136-150. https://doi.org/10.3390/mi6010136
Chicago/Turabian StyleTóth, Eszter L., Eszter G. Holczer, Kristóf Iván, and Péter Fürjes. 2015. "Optimized Simulation and Validation of Particle Advection in Asymmetric Staggered Herringbone Type Micromixers" Micromachines 6, no. 1: 136-150. https://doi.org/10.3390/mi6010136