1. Introduction
Traditional syringe pumps deliver insulin through tubing. These devices are reported to be safe and reliable, despite several drawbacks related to tubing kinking and to the so-called stick-slip effect of the plunger, an inherent limitation affecting short-term accuracy. Alternative systems for pumping small fluid volumes have been produced over the last three decades [
1,
2]. Among these various kinds of devices, the reciprocating displacement micropump based on MEMS technology and having two check valves together with a fixed stroke volume has shown the capability to combine both low cost and good performance [
3,
4].
An improved MEMS-based micropump comprising two integrated pressure sensors has been engineered in order to accurately deliver insulin to patients diagnosed with type 1 and 2 diabetes mellitus. The micropump delivers short-acting insulin 24 h a day through a cannula placed under the skin. Switching from multiple daily infusion (MDI) to continuous subcutaneous insulin infusion (CSII) induces well-known advantages, including the reduction of swings in blood glucose levels and the limitation of severe hypoglycemia [
5,
6,
7]. In addition, this MEMS-based micropump provides outstanding delivery accuracy and failure detection capabilities, as reported in recent
in vitro and
in vivo studies comparing the pumping capability of several pump systems [
8]. In this paper, the emphasis is placed on the description of the integrated pressure sensors and their typical experimental responses in various conditions. The implementation of a pressure sensor in the fluidic line is a well-known method to detect the occlusion of syringe pumps. Geipel
et al. have reported a microfluidic system, including a commercial pressure sensor placed downstream of the pump to monitor the pulsed infused flow [
9]. The two main challenges of these dynamic pressure measurements in a catheter are the control of the dead volume and the elasticity of the fluidic line. The use of pressure profiles to detect catheter occlusions and disconnects of a drug delivery system comprising notably a pressurized reservoir and microvalves with embedded pressure sensors has been also reported by Li
et al. [
10]. We show here that the integration of a pressure sensor within the pumping chamber is a powerful tool to understand the fluid dynamics inside the device. Thanks to its high compression ratio and small elasticity, this micropump is able to detect any malfunction (bubble, leakage) that leads to an accuracy loss larger than 5%. In contrast to syringe pumps, which control the residual volume of the insulin reservoir via the monitoring of the plunger position, microfluidic devices are usually not able to guarantee correct infusion, in particular in the case of failure. This integrated pressure sensor is therefore an essential element of the insulin micropump to prevent any severe hyperglycemic episodes.
The device shown in
Figure 1 is a reciprocating displacement MEMS-based micropump having two check valves and a fixed stroke volume [
11,
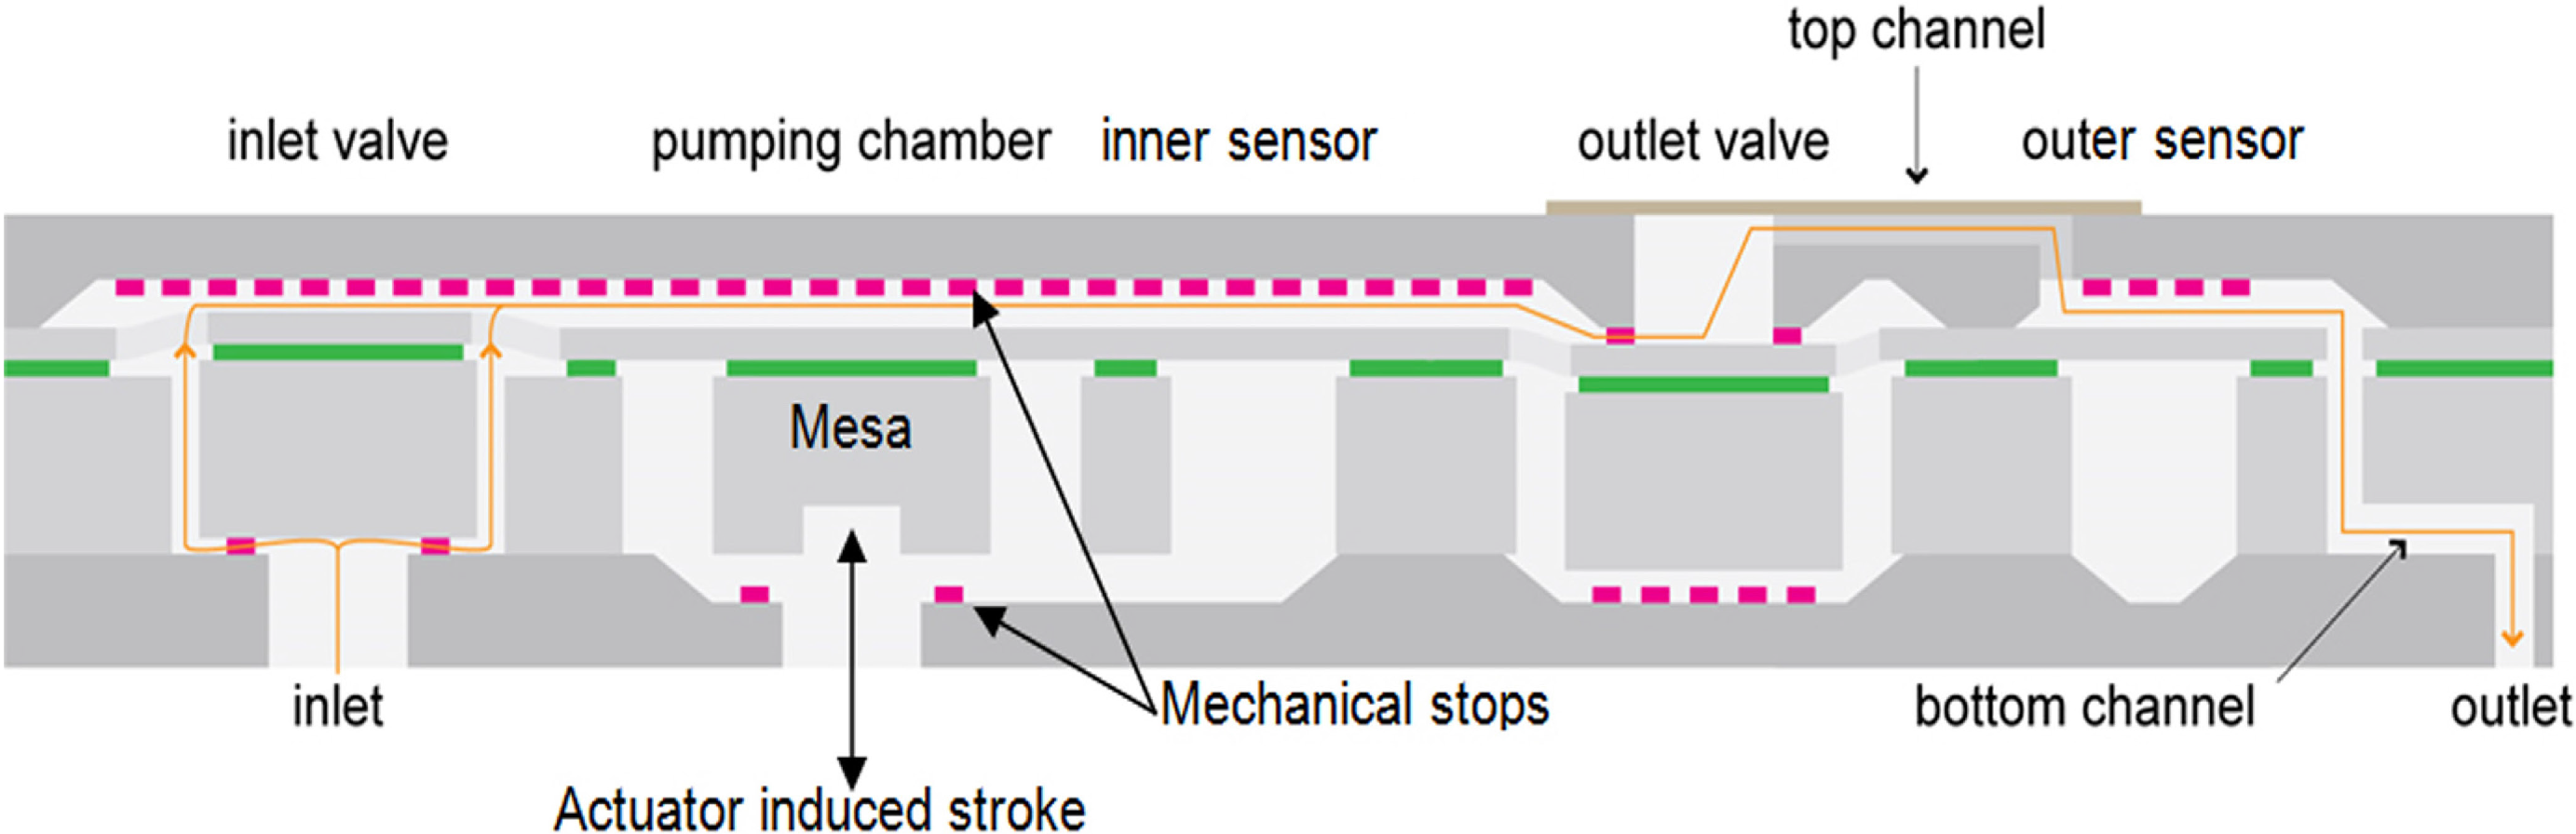
12]. The pump chip is made of a stack of three plates: a top Si cap, an SOI (Silicon-On-Insulator) wafer and a bottom Si cap. The main elements of the micropump presented in
Figure 1 are: the inlet valve, the pumping chamber, the pumping membrane having a mesa mechanically coupled to a piezo actuator (not represented here), the inner sensor, the outlet valve and the outer sensor.
Because the pumping membrane is located in-between the two mechanical stops when at rest, the micropump is called a “push-pull” device. Due to its high compression ratio, about 1.9:1 for a nominal stroke volume of 200 nL, the device exhibits self-priming capabilities. The piezo actuator is driven at ±200 V to push/pull the pumping membrane alternately against the two stop limiters. The actuation frequency in the bolus mode is fixed at 3.125 Hz. In the basal mode, the actuation profile is optimized to conciliate low power consumption and high delivery accuracy [
12].
The filling of the pump is associated with a negative relative pressure in the pumping chamber, which opens the inlet valve and closes the outlet valve (the pull of the pumping membrane). Inversely, the infusion corresponds to positive relative pressure in the pumping chamber, which opens the outlet valve and closes the inlet valve (the push of the pumping membrane).
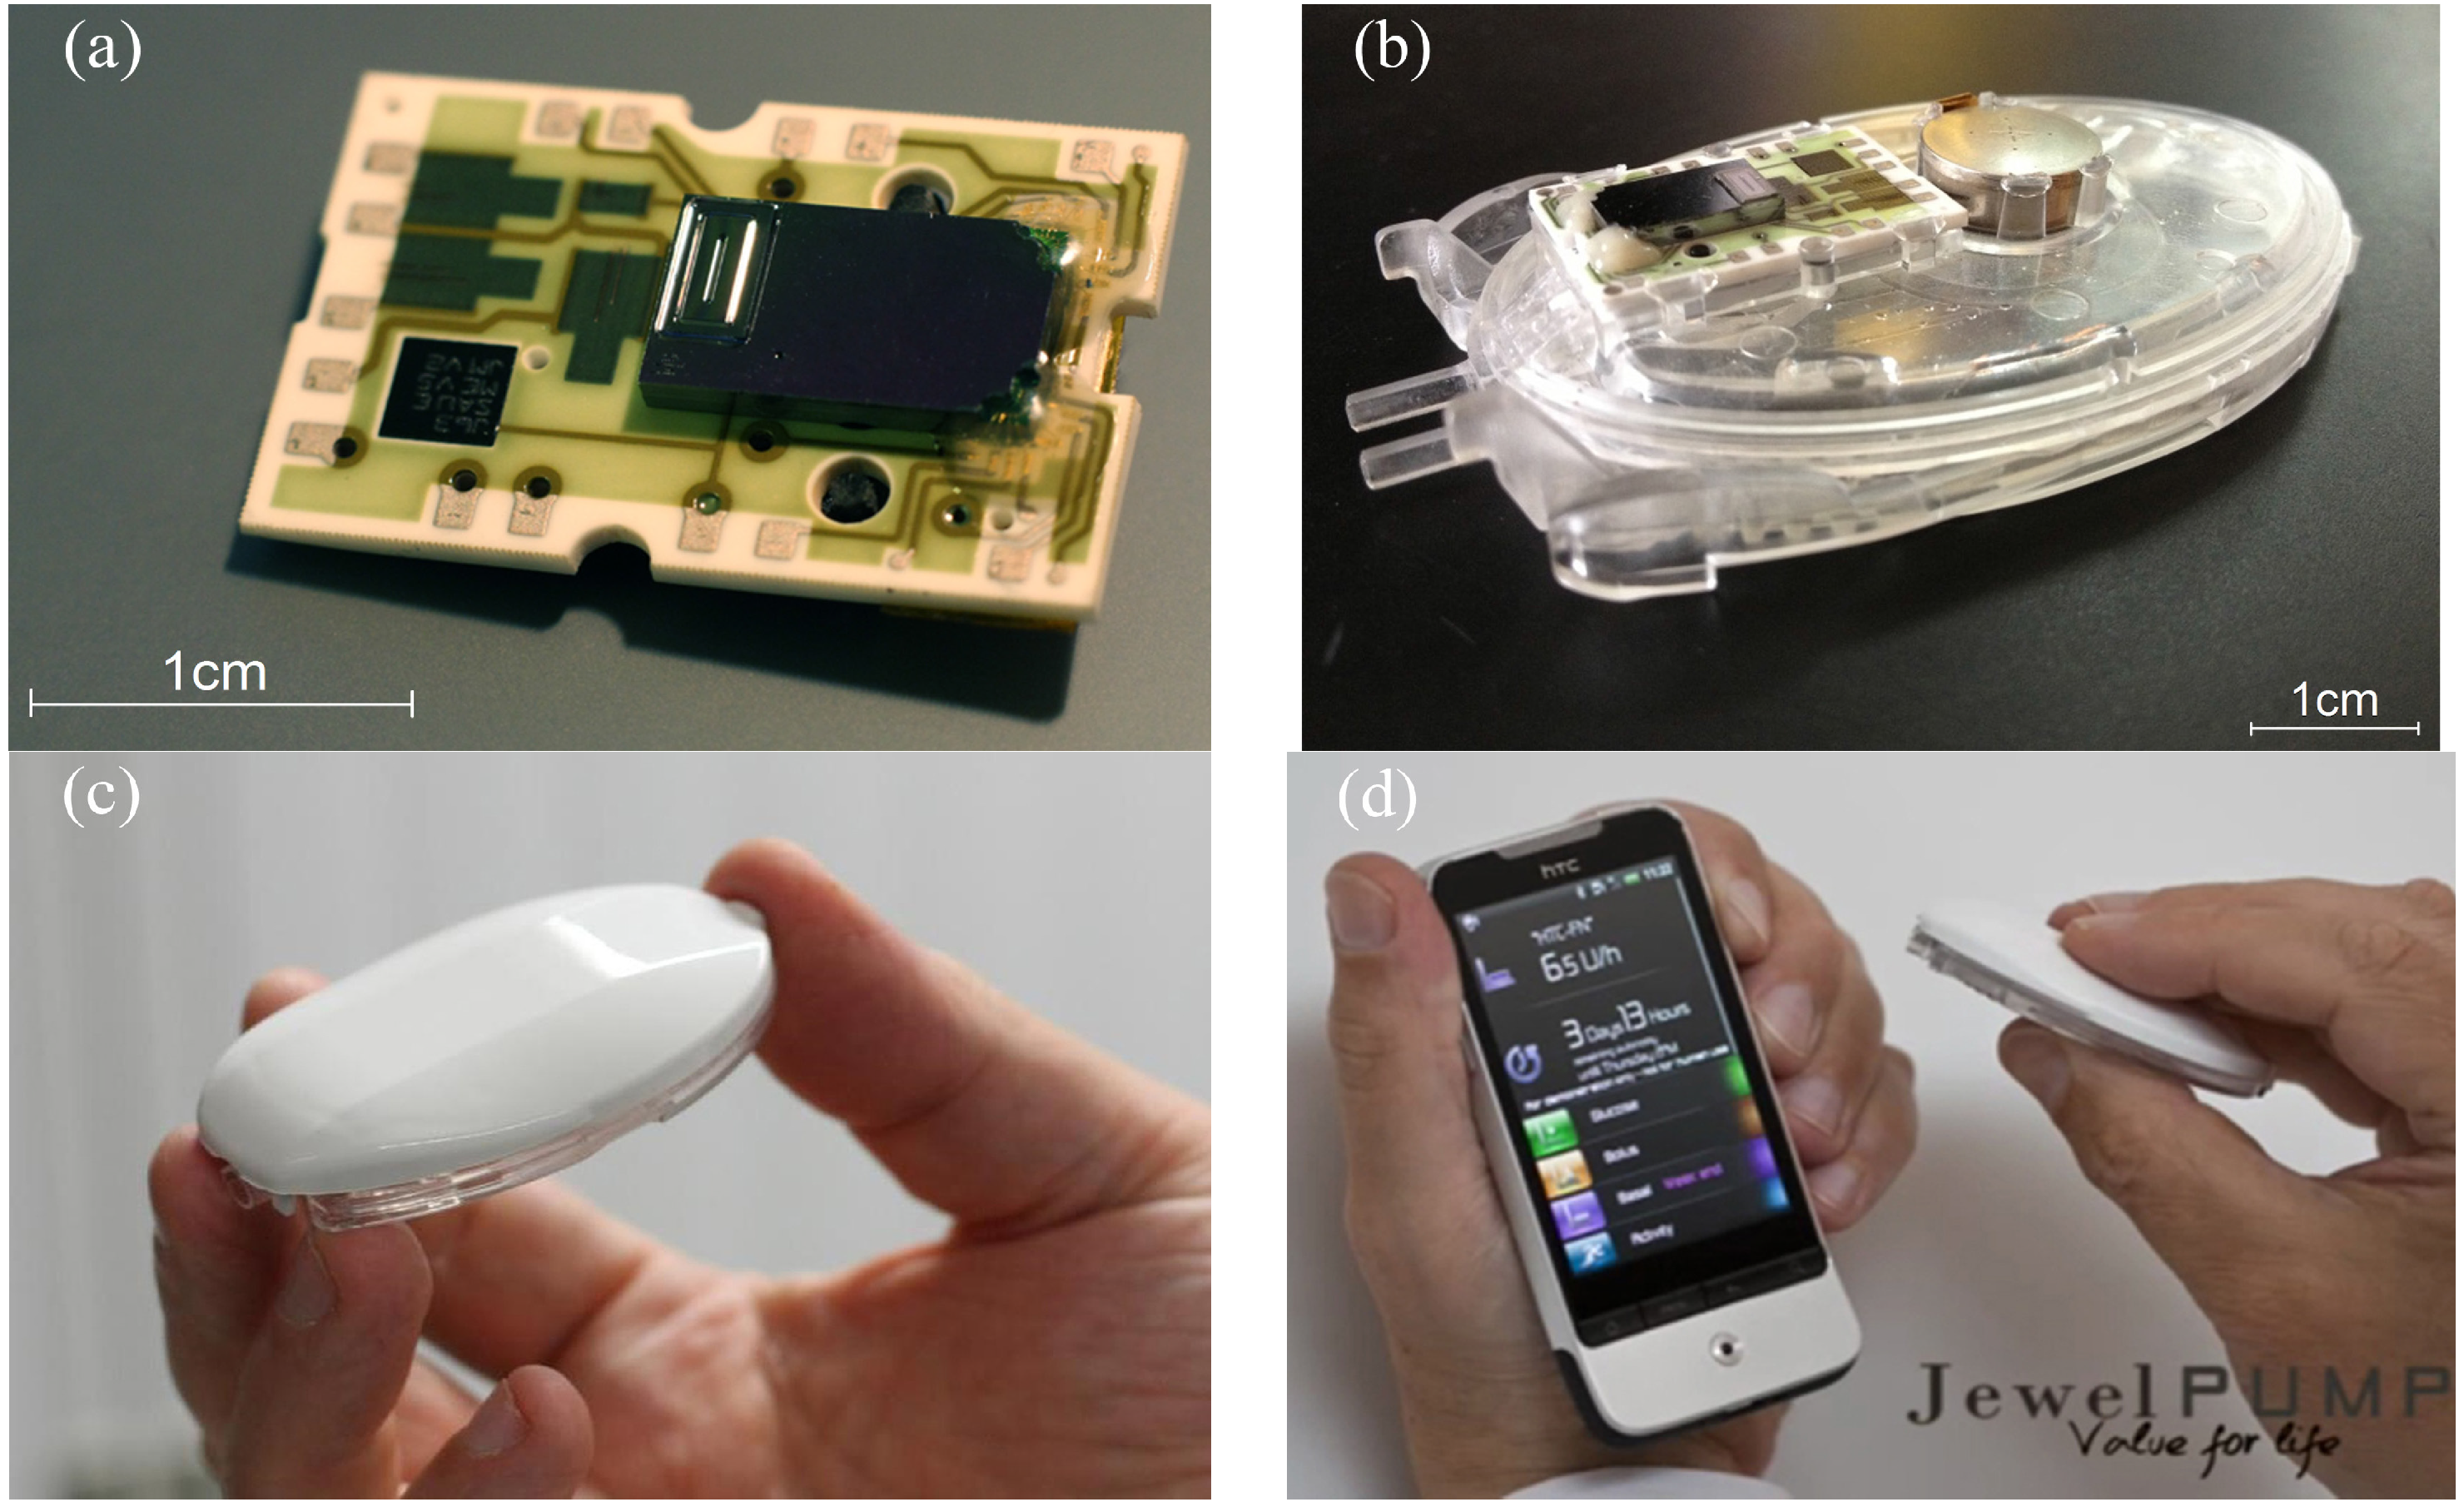
The silicon pump chip is attached to a ceramic substrate and linked to a piezo actuator, thus forming a Pumpcell. In order to complete the disposable unit, this element is set onto a fluidic block that comprises, in particular, the insulin reservoir, a hydrophilic particle filter, a battery and an outlet needle that is inserted into the cannula port during the placement of the pump onto the patch. A reusable electronics (pump controller) is finally assembled by the patient onto this disposable unit before the filling. Pictures of the device are provided in
Figure 2.
Figure 1.
Schematic cross-section of the micropump (not to scale). The arrow indicates the flow direction. The small rectangles are schematic representations of the anti-bonding structures. The green layer is the buried oxide.
Figure 1.
Schematic cross-section of the micropump (not to scale). The arrow indicates the flow direction. The small rectangles are schematic representations of the anti-bonding structures. The green layer is the buried oxide.
Figure 2.
Photos of the device (courtesy of Debiotech SA, Switzerland). (a) Pumpcell comprising the micropump mounted onto a ceramic substrate having interconnection pads. (b) Disposable unit with the Pumpcell and the battery (top) mounted onto the insulin reservoir (bottom). (c) Pumping unit ready to be attached onto the patch. The pump controller (top) is assembled with the disposable unit (bottom). (d) Pumping unit and its remote controller.
MEMS technology is particularly adapted to the integration of piezoresistive pressure sensors in a silicon chip. The first membrane having strain gages laid out in a Wheatstone bridge configuration is placed in the pumping chamber to monitor the pump dynamics, while the second one is placed downstream of the outlet valve for improved occlusion detection.
Resistors aligned along [110] crystallographic directions are obtained by boron implantation of an n-doped Si membrane built from an SOI wafer (100). The sheet resistance of this p-doped layer is about 1500 ohms per square. Each resistor is made of four squares. The sensor membrane is a square of about 1 mm2, with a thickness of 15 μm. The physical characteristics of these gauge pressure sensors have been optimized to get a maximum offset of ±2 mV·V−1·bar−1 and a sensitivity of 18 mV·V−1·bar−1 in the range −1 to +1.5 bar. The minimum resolution is 1 mbar.
2. Experimental Section
The micropumps are characterized in a clean room using the precision scale Sartorius MC5 (microgram resolution). A glass capillary glued to the pump cannula is immersed into a glass beaker prefilled with insulin Novorapid (from Novo Nordisk) and placed onto the scale. A thin layer of paraffin oil is used to prevent evaporation during the test. The temperature is regulated at 20 ± 1 °C for scale stabilization purposes. The pressure sensor signals were recorded with data acquisition cards NI 6143 (National Instruments, Austin, TX, USA). A pressure controller, Druck DPI520 (GE Sensing, Billerica, MA, USA), is used to simulate occlusion at the outlet, reservoir overpressure or an empty reservoir. The micropump is placed in an oven for tests at 38 °C in order to simulate the highest in-use temperature conditions for a patch pump. The relative position between the micropump and the meniscus of the glass beaker is adjusted before each experiment. The stabilization of the scale is the key parameter to obtain reproducible results. The scale is placed on an anti-vibration table. Specific care has been taken during the handling of the beaker, the introduction of the capillary through the paraffin oil layer and the removal of air bubbles inside the beaker, as well as the fluidic line. If not specified, the reservoir is filled with fast acting insulin Novorapid.
3. Results and Discussion
3.1. Priming
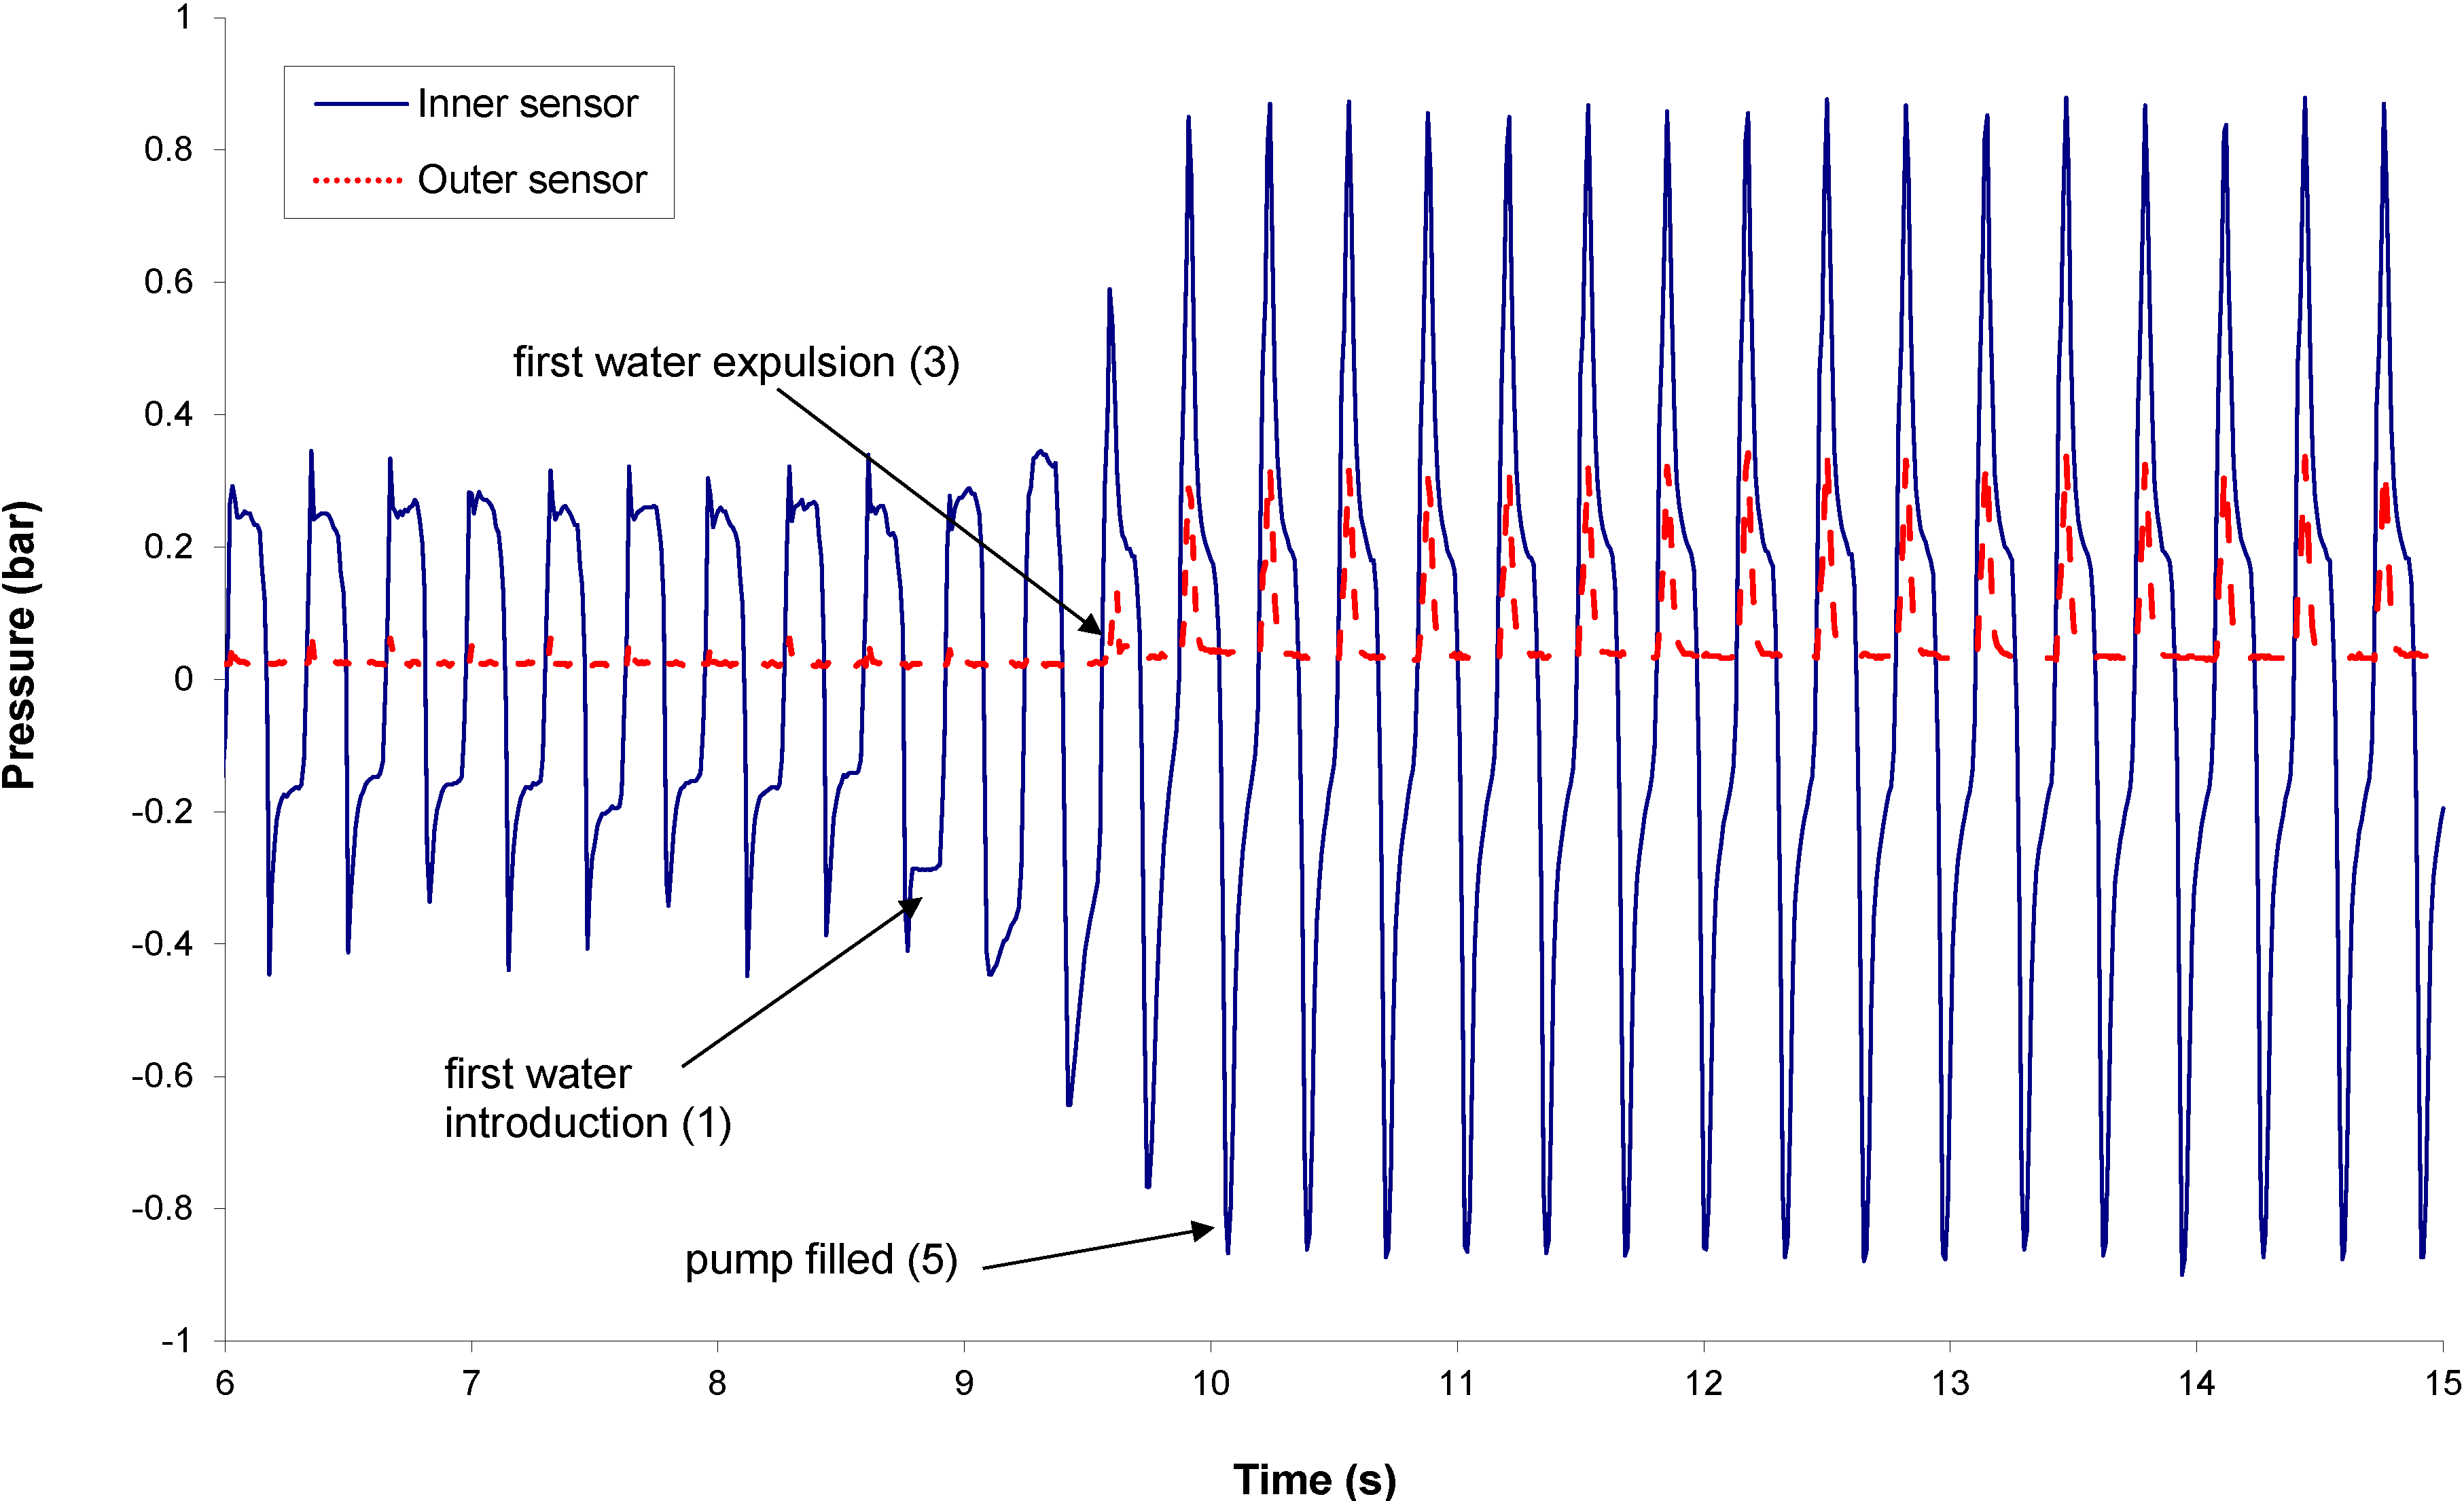
The priming frequency is fixed at 3.125 Hz. Typical sensor signals are provided in
Figure 3. Before the first water introduction, the pressure in the pumping chamber is driven by the valve pretensions, while the pressure peaks at the pump outlet remain very small. Both signals could be used to monitor the pump priming, since the change of the signal shape after the introduction of liquid in the pumping chamber is significant. The height increase of the pressure peak in the pumping chamber during priming is mainly related to a change of compressibility, while the height of the pressure peak at the outer sensor location is more related to the viscosity change (between gas and liquid). Numerical models of the fluid dynamics in the pump have been built to evaluate the best tradeoff between pumping efficiency and failure detectability.
Figure 3.
Inner and outer sensor signals during priming.
Figure 3.
Inner and outer sensor signals during priming.
3.2. Occlusion
Occlusion is a common failure of insulin pumps. This is due to either a real obstruction caused by insulin fibrils at the outlet, a kinking of the cannula or a compression of the skin around the infusion site. An occlusion leads to two kinds of risk:
Hyperglycemia: during the occlusion itself, since there is no infusion of insulin;
Hypoglycemia: during the release of the occlusion (e.g., if the compression of the skin around the infusion site or the kinking of the cannula is suddenly released), there is a major risk of over-infusion, because the accumulated amount of insulin that has not been injected during the occlusion is injected very quickly.
The occlusion detection is therefore a key factor for patient safety.
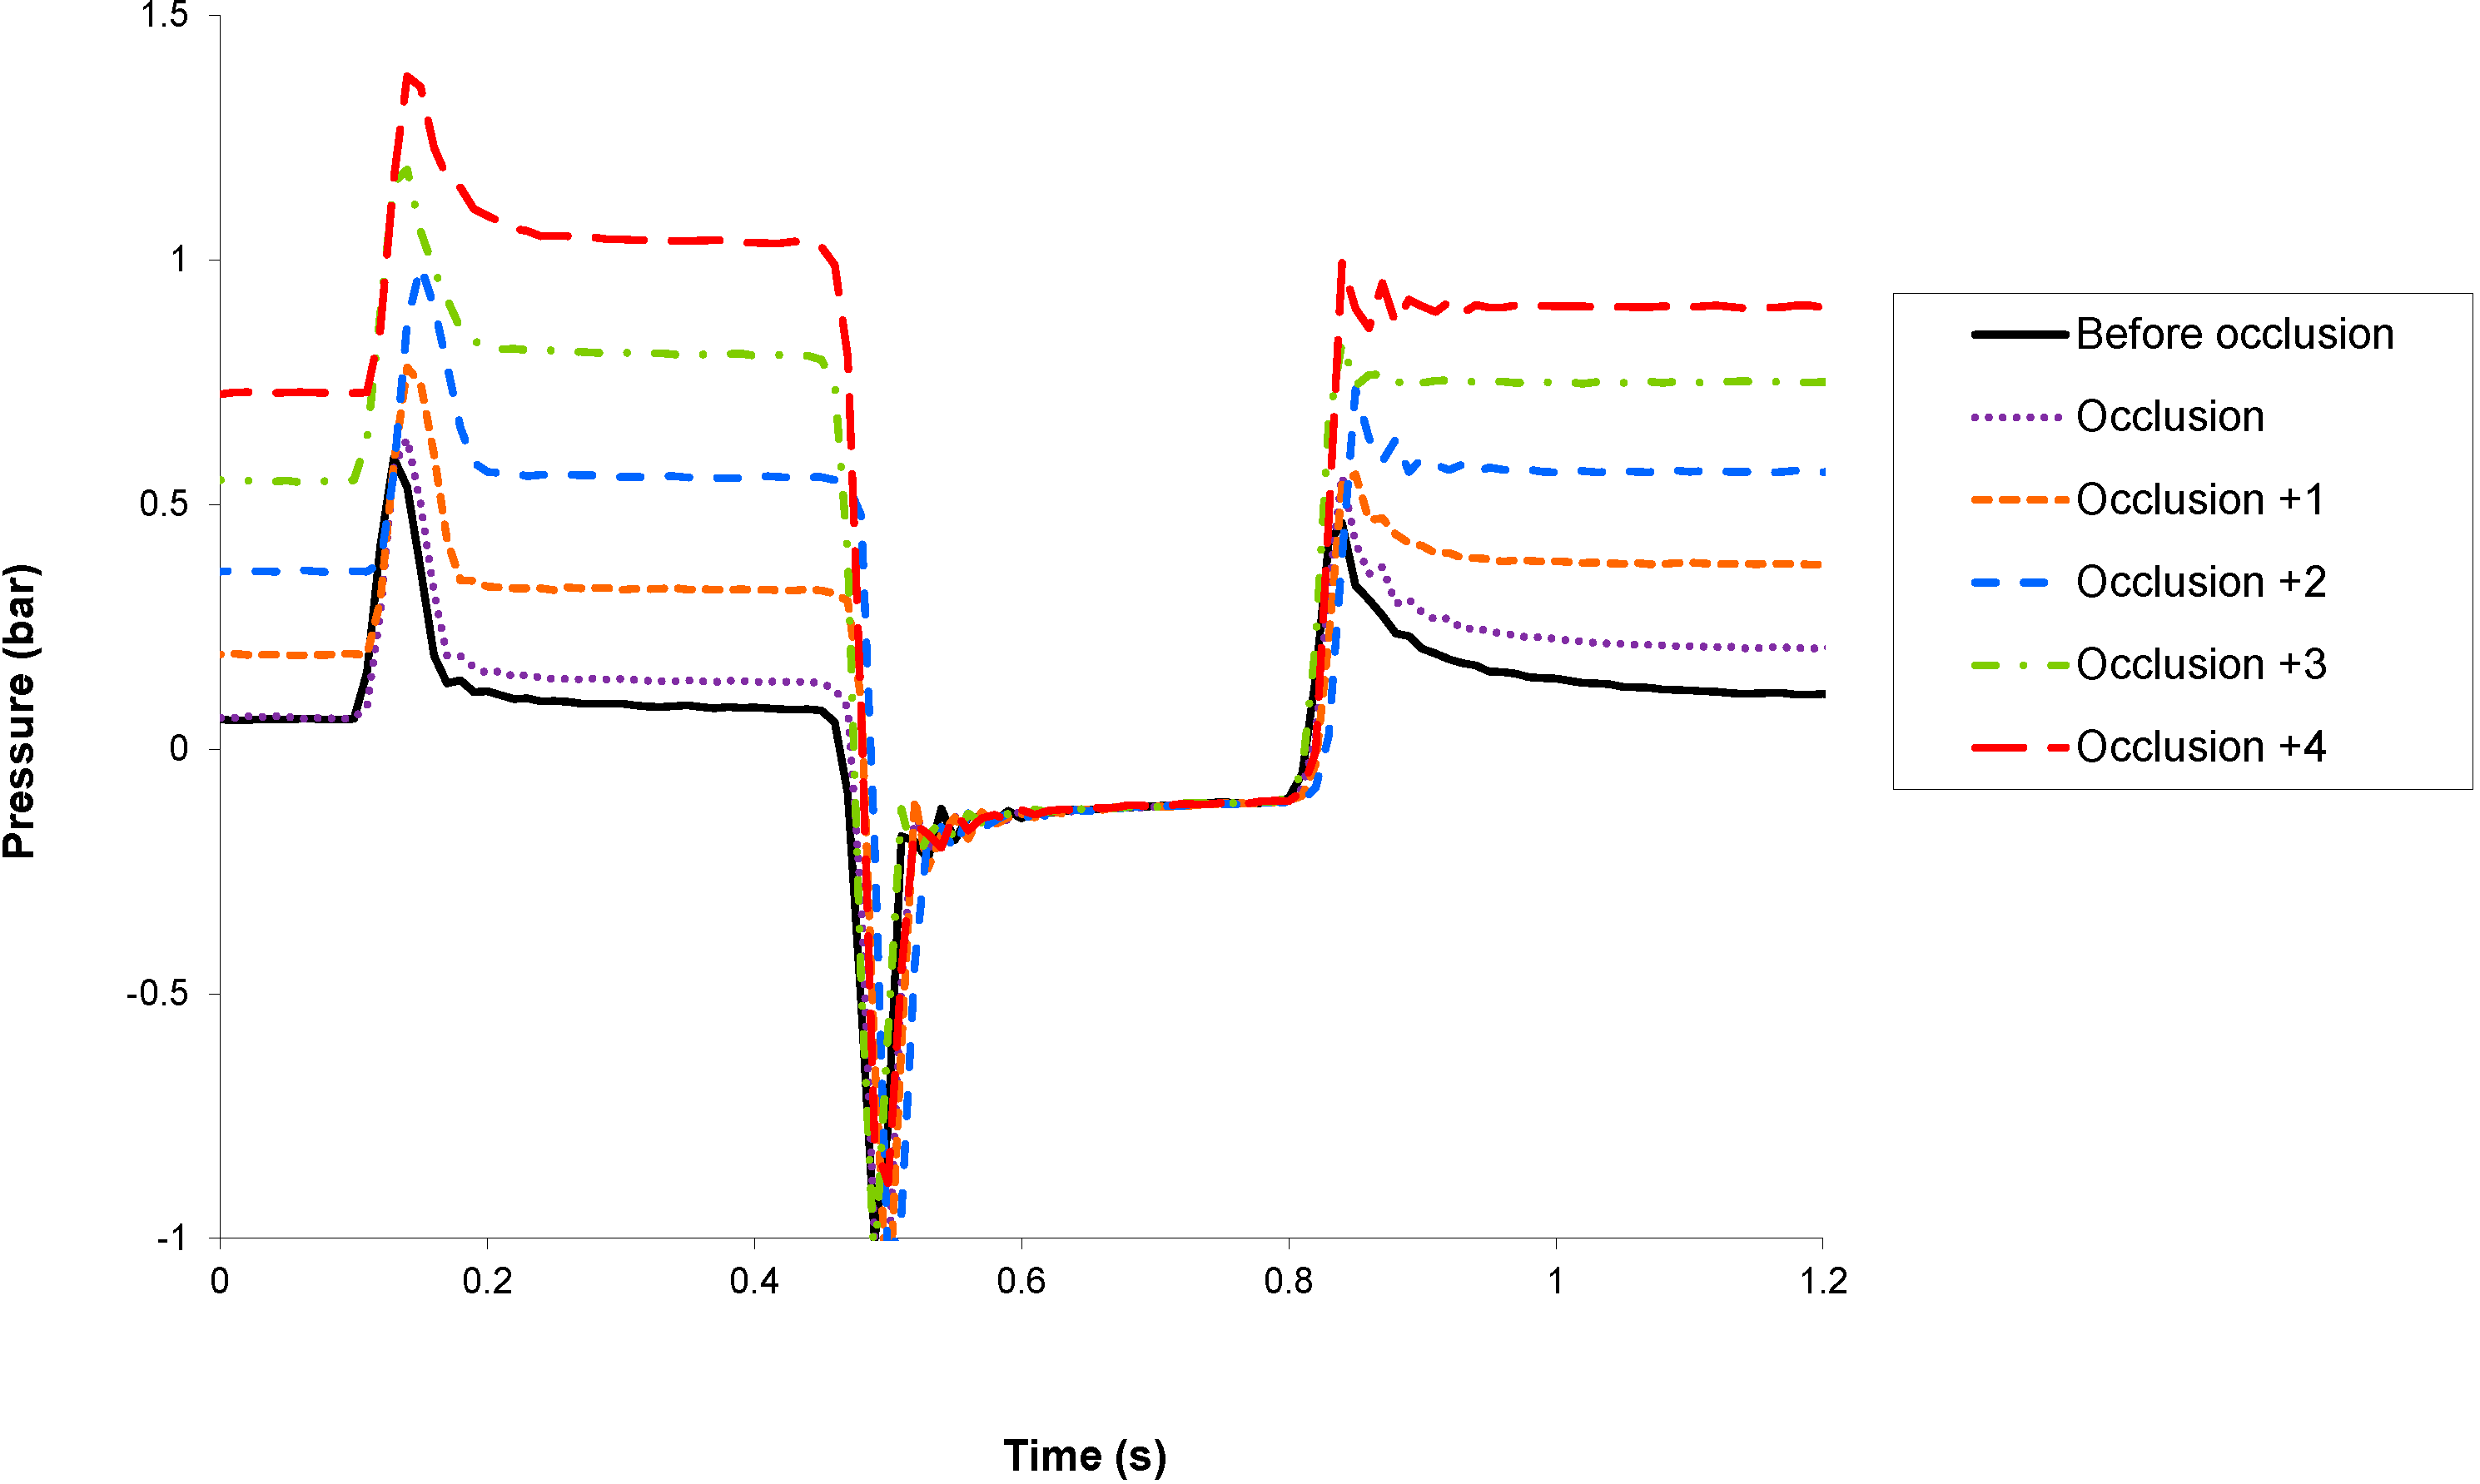
Occlusion detection has been tested experimentally by monitoring the sensor signals before and after the occlusion of the pump cannula with clamp tweezers. The micropump is actuated in basal mode at 7.2 U/h (equivalent to 72 μL of insulin U 100 per hour or one stroke every 10 s). In
Figure 4 and
Figure 5 are shown, respectively, the inner and outer sensor signals before the occlusion and during the five strokes following the occlusion. For the sake of clarity, the sensor signals are only shown during the actuation phase.
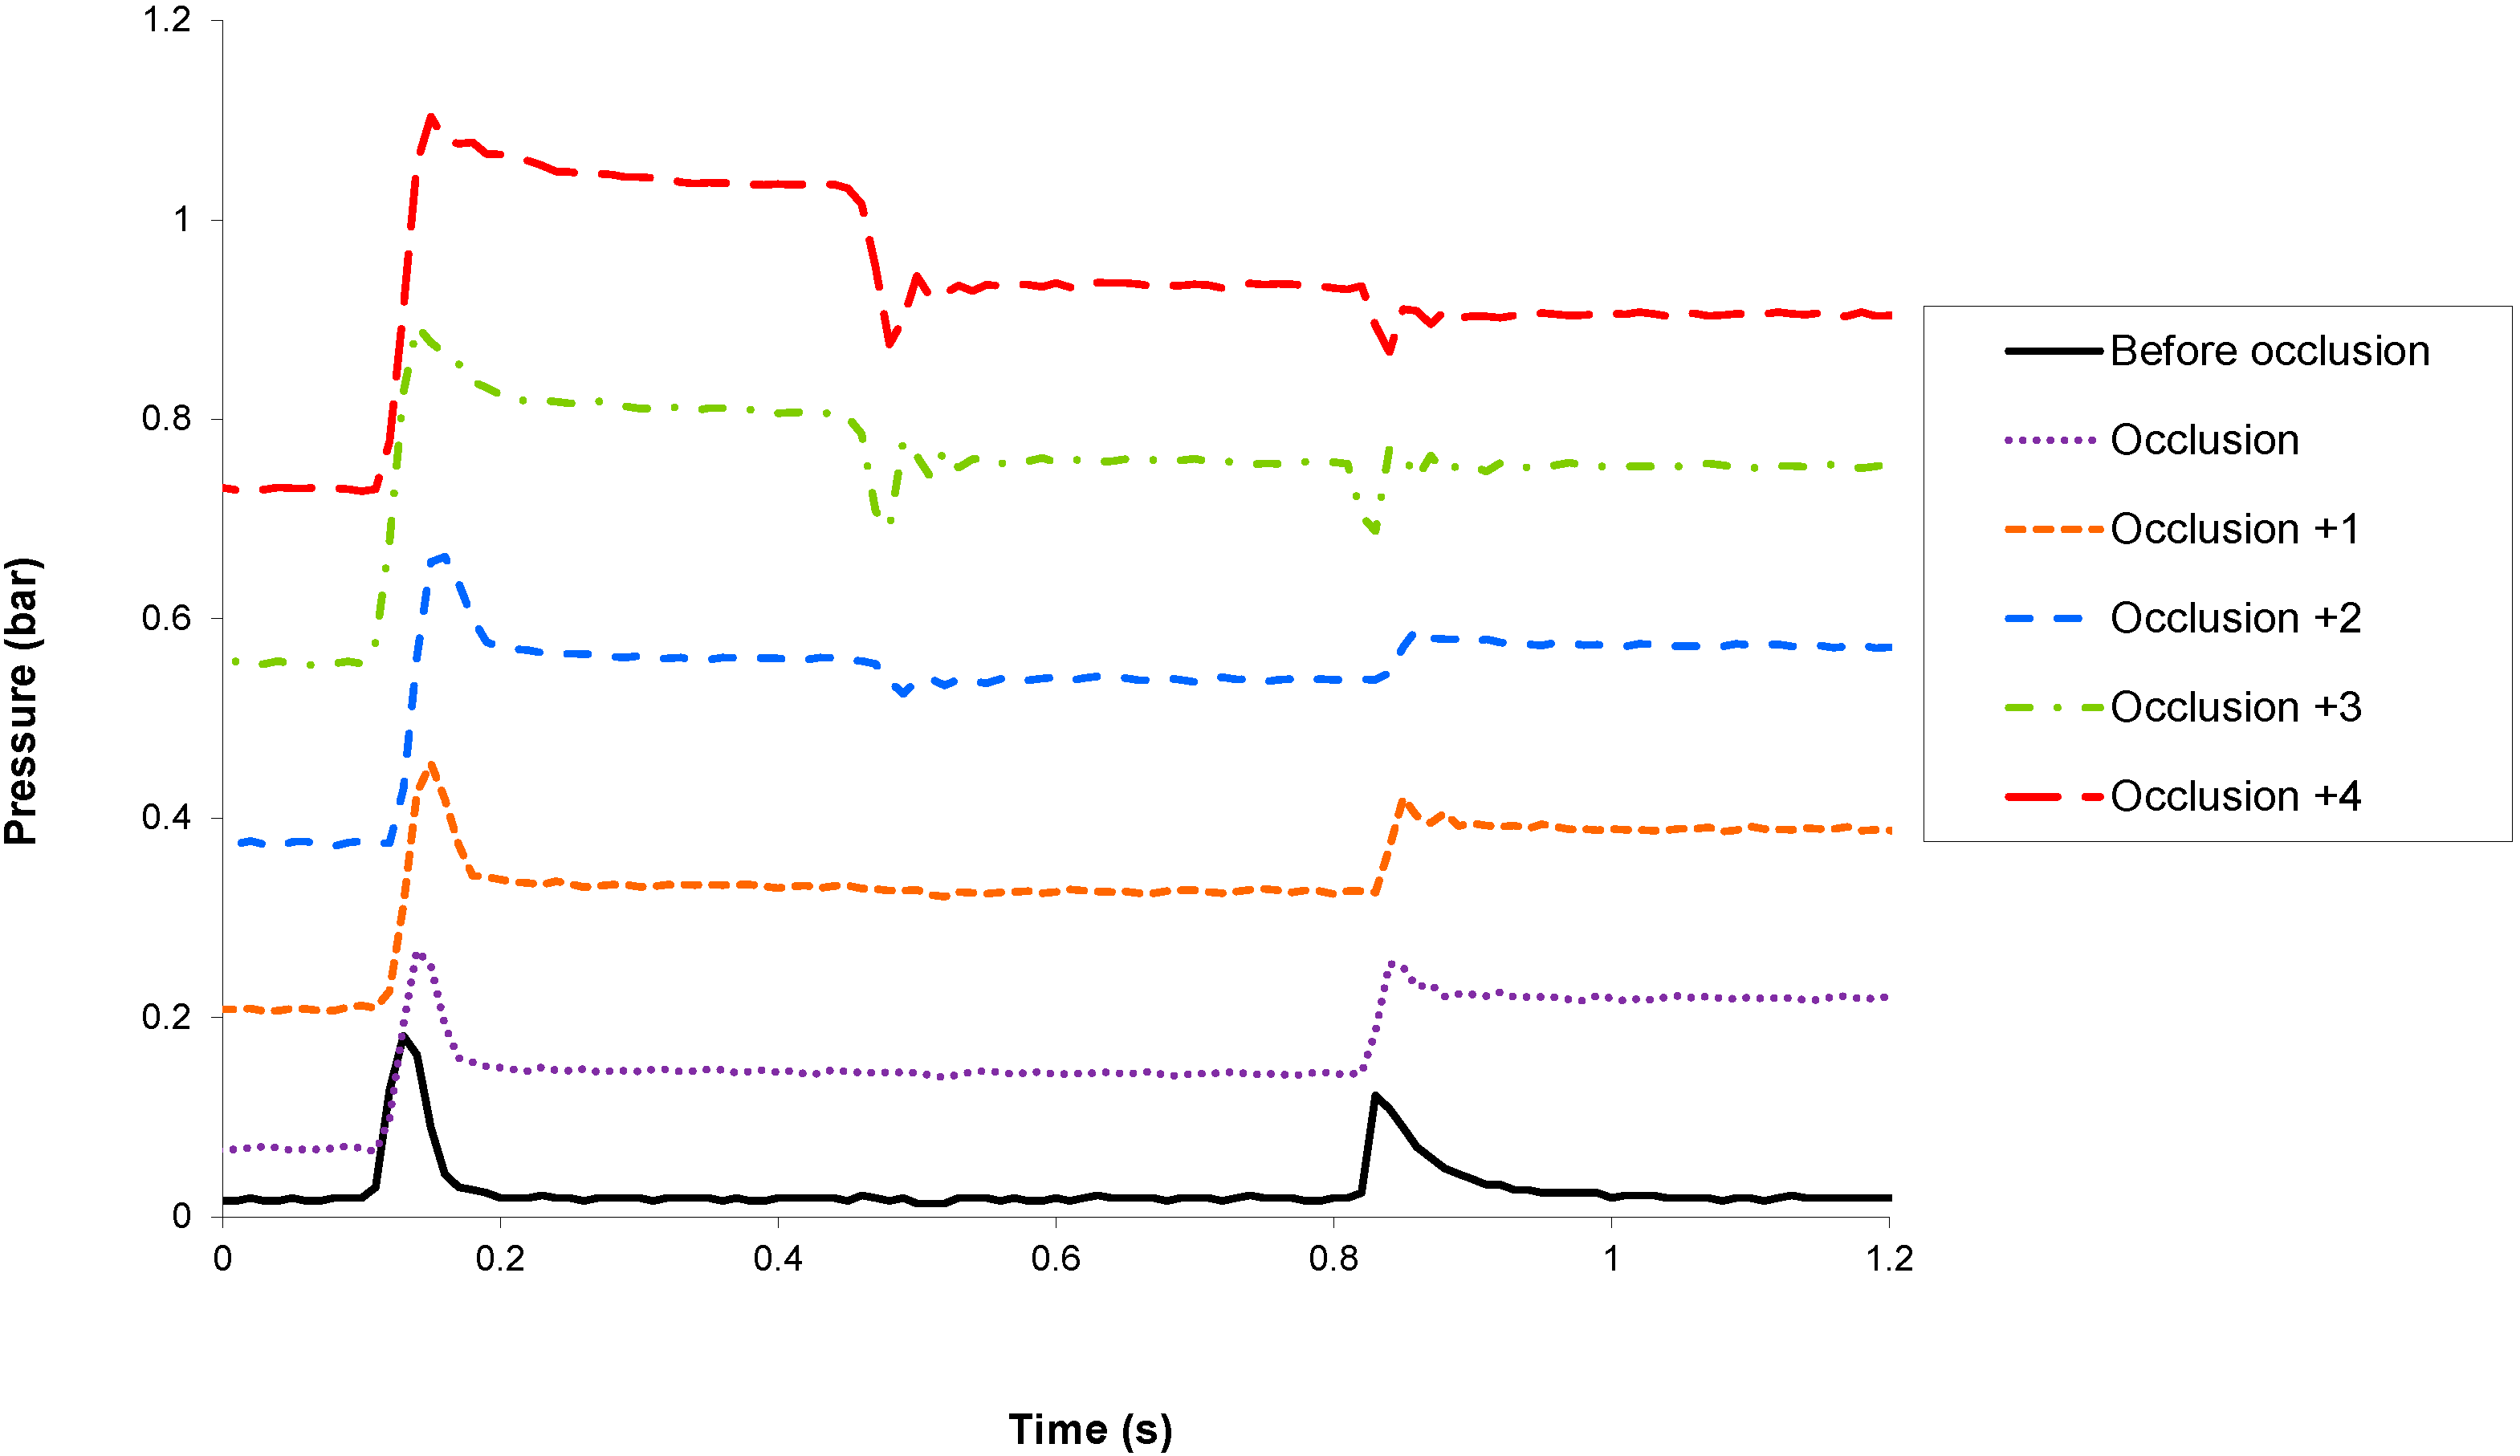
Because the fluidic pathway downstream the micropump exhibits a very low compressibility, any occlusion will induce a large increase of the outlet pressure, which could be detected by both sensors. The outer sensor, which is in direct communication with the infusion site (i.e., without any valve in-between), is preferably used to monitor occlusion. Total occlusion could be detected during the first actuation that follows the event, thus triggering an alarm and stopping the pump to prevent the generation of large pressure, which may damage the fluidic line.
Figure 4.
Evolution of the inner sensor signal before and during the five strokes following an occlusion.
Figure 4.
Evolution of the inner sensor signal before and during the five strokes following an occlusion.
Figure 5.
Evolution of the outer sensor signal before and during the five strokes following an occlusion.
Figure 5.
Evolution of the outer sensor signal before and during the five strokes following an occlusion.
3.3. Reservoir Overpressure and Underpressure
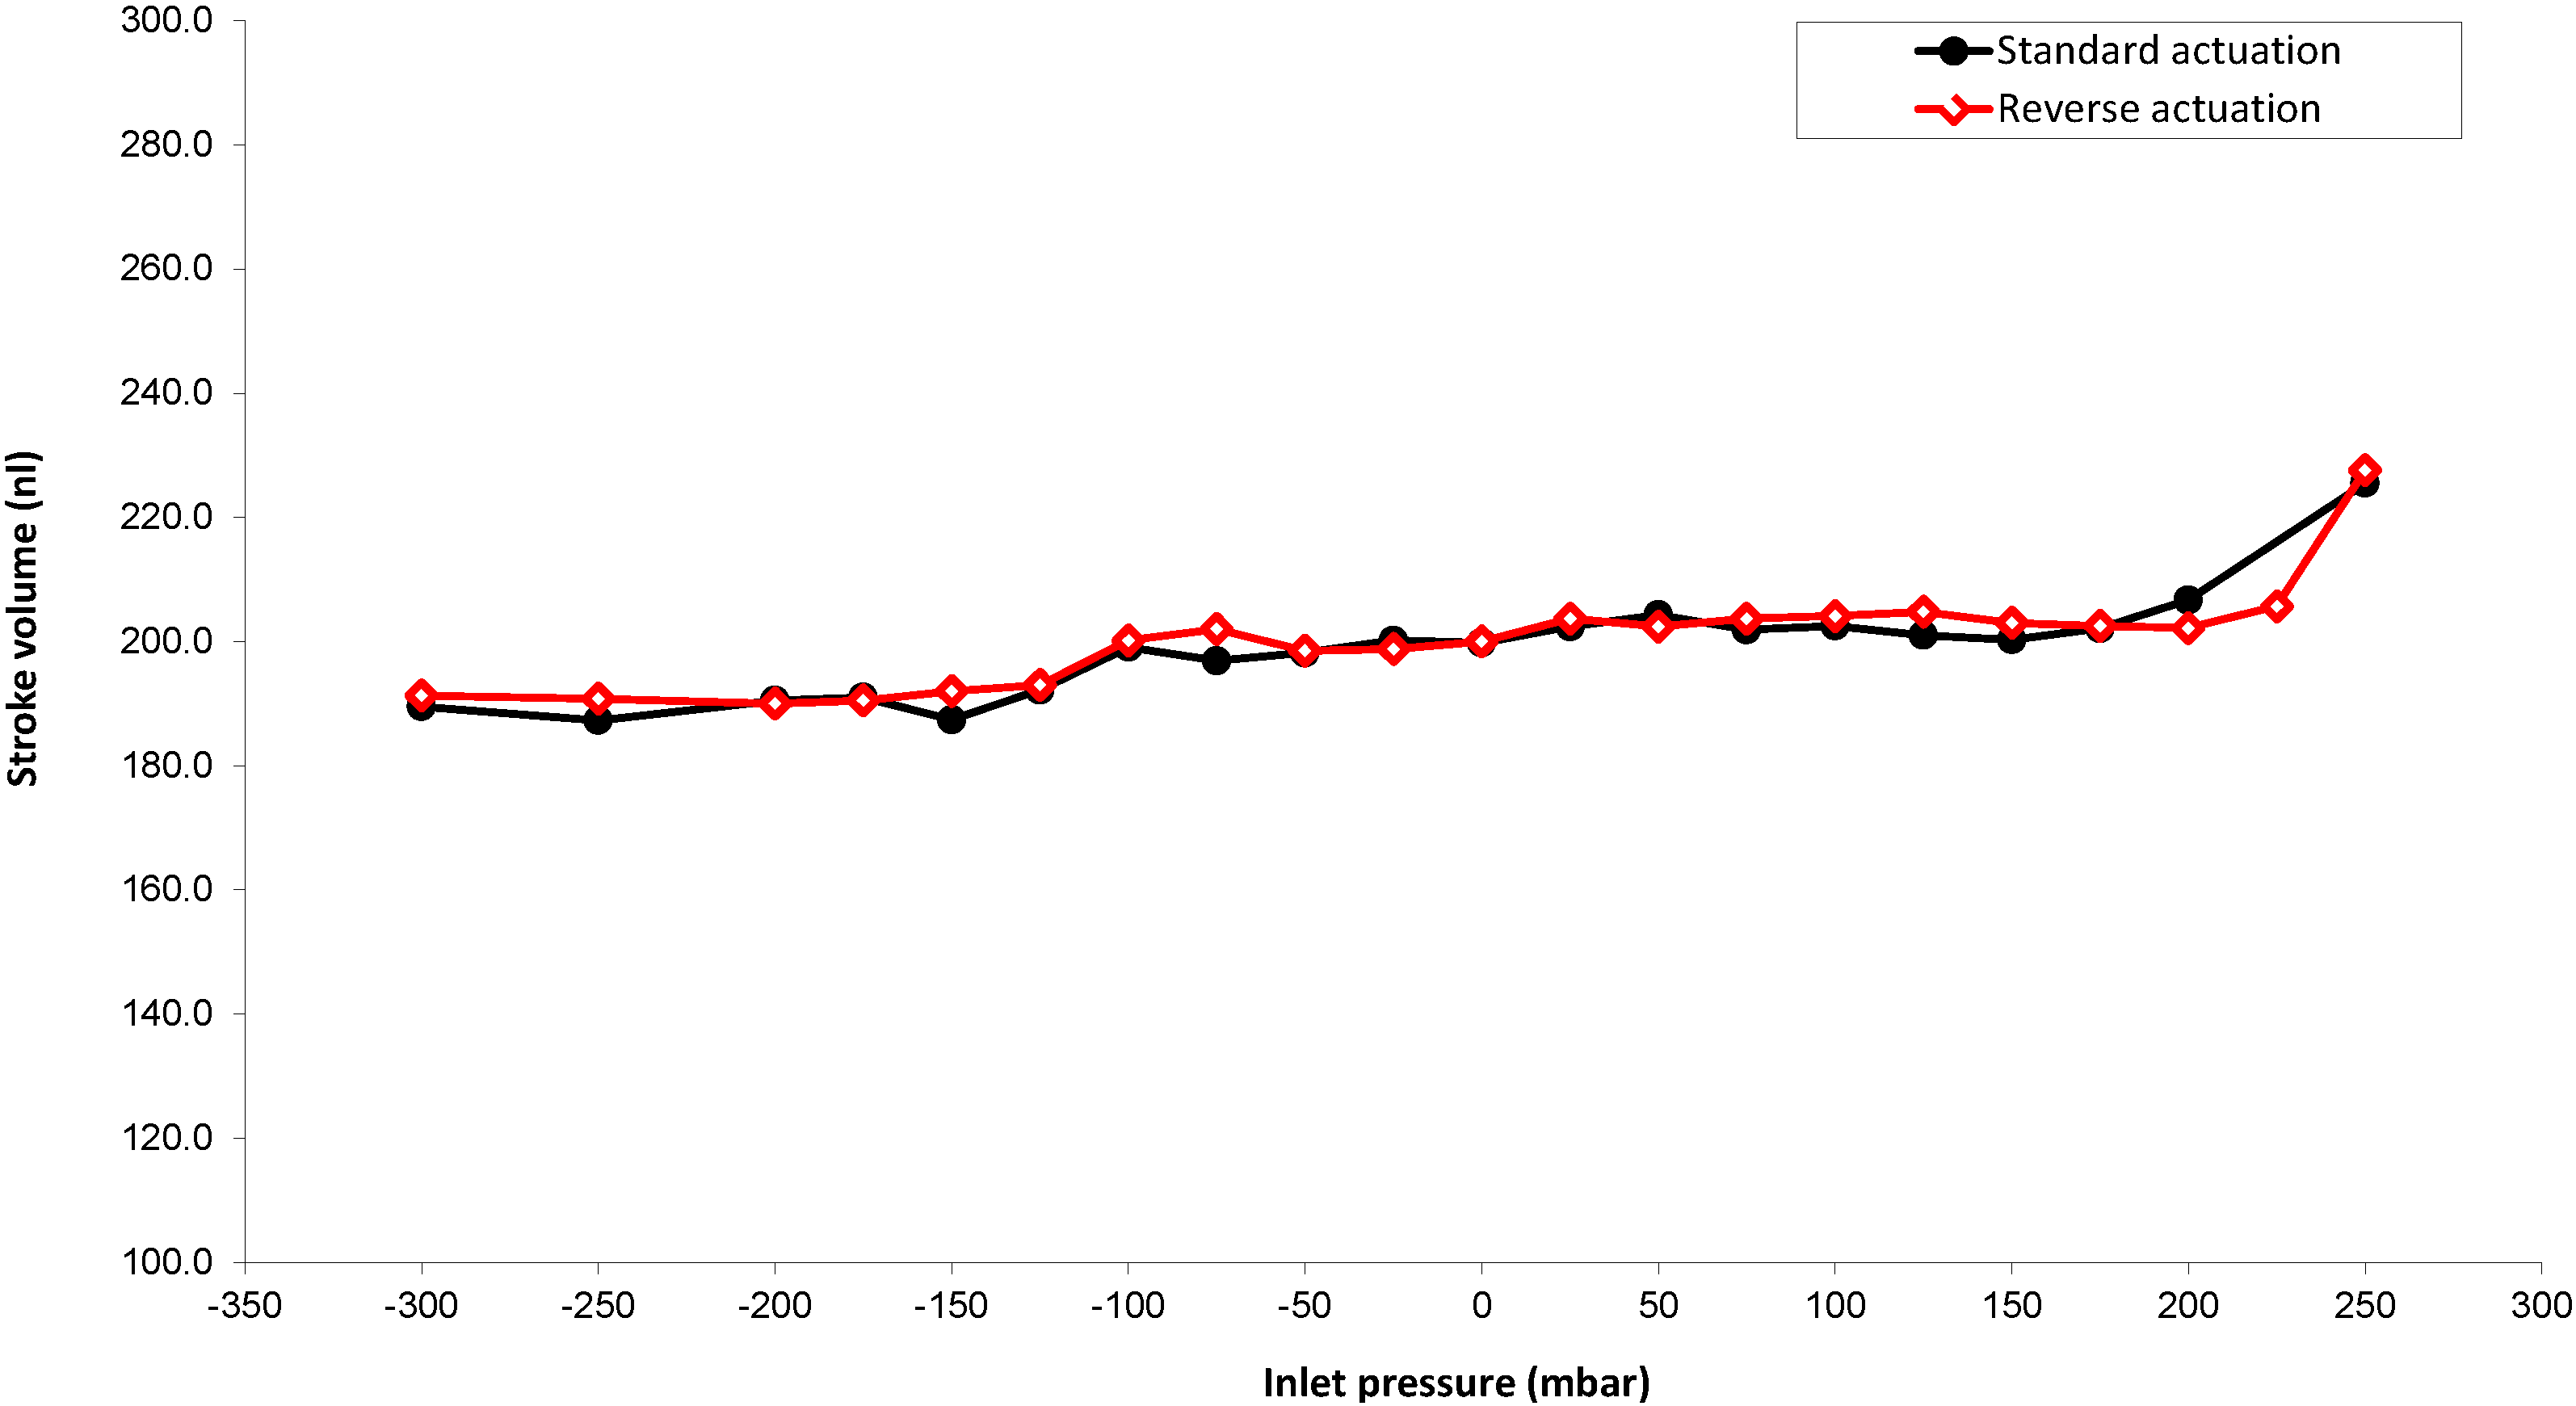
The evolution of the stroke volume as a function of the inlet pressure has been studied from large negative pressure, corresponding to reservoir emptying, to large positive pressure. The latter condition can only occur in the case of reservoir overfilling, since the pump housing and reservoir structures prevent any transfer of pressure to the insulin of the reservoir.
Figure 6 shows that in both standard and reverse mode, the stroke volume remains constant in the range −0.3 bar to +0.2 bar. This is in good agreement with the check valve pretension values in the range of 0.1 bar. Standard (respectively reverse) mode refers to an actuation cycle that starts with a push (respectively pull).
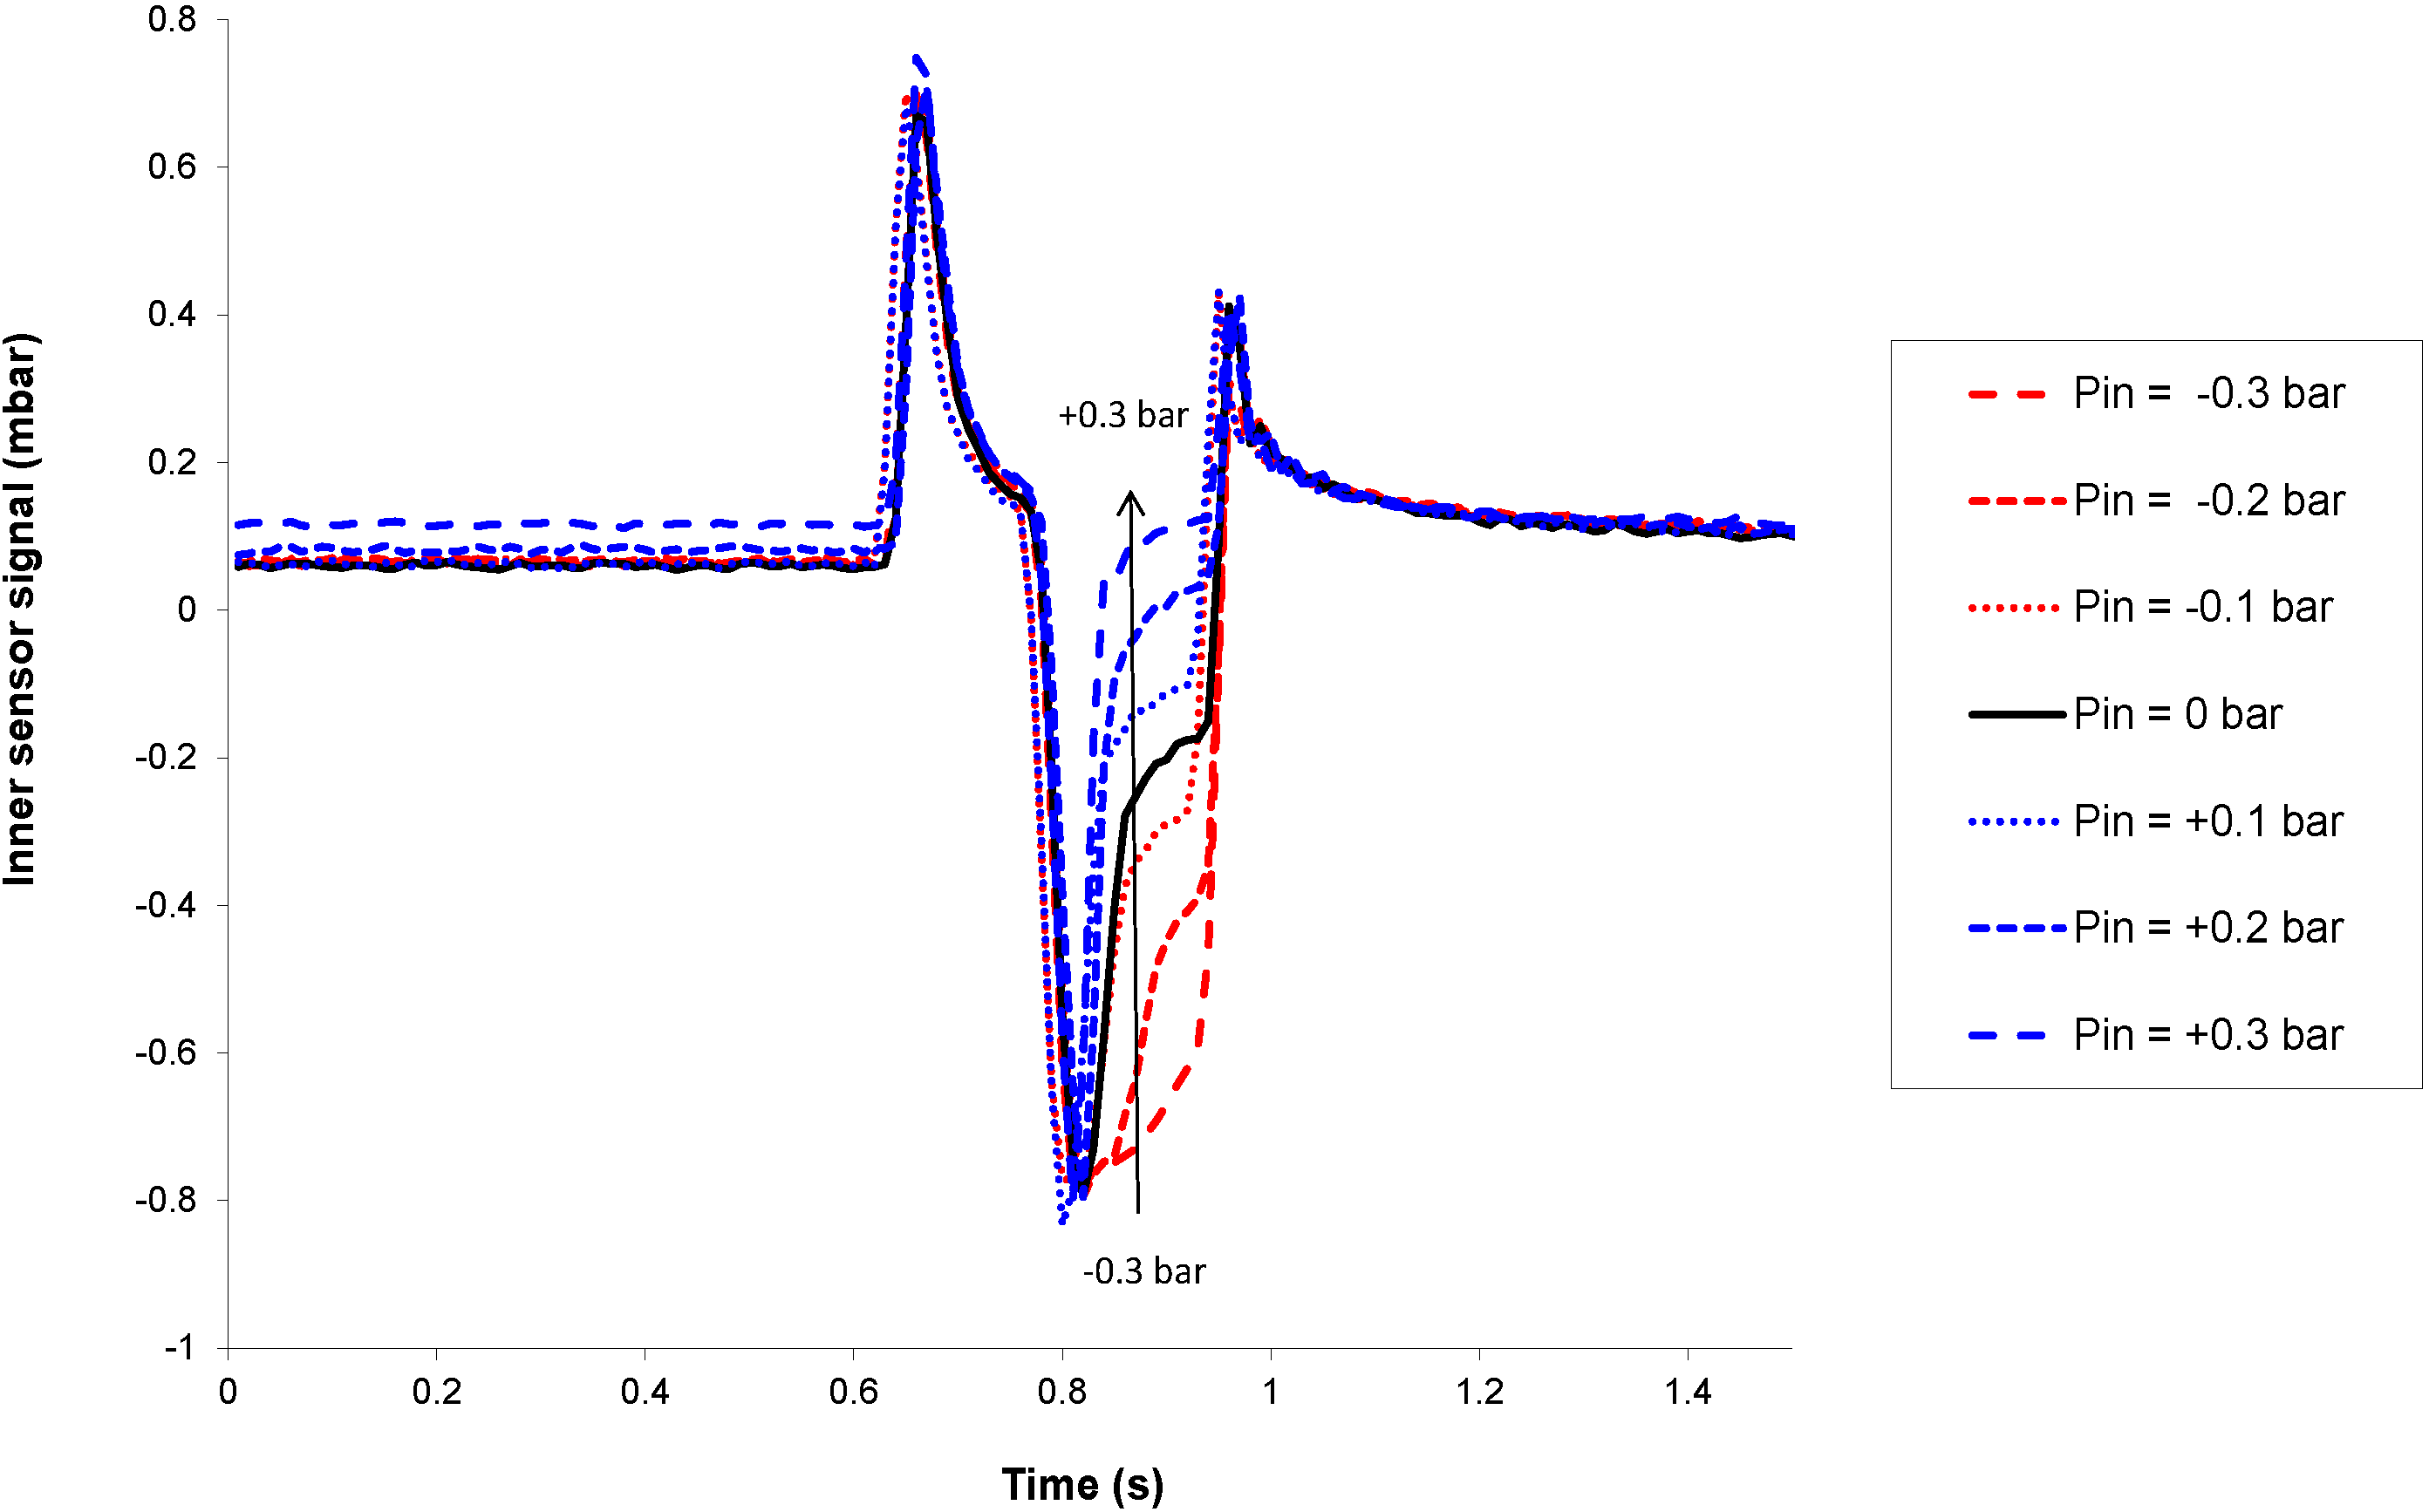
Reservoir over- and under-pressures are monitored in the filling phase of the pumping cycle (
i.e., when the inlet valve opens during a pull), using the inner sensor. Typical pressure profiles in standard mode are provided in
Figure 7, for inlet pressures varying from −0.3 to +0.3 bar.
Figure 6.
Stroke volume as a function of the inlet pressure, in standard and reverse actuation modes.
Figure 6.
Stroke volume as a function of the inlet pressure, in standard and reverse actuation modes.
Figure 7.
Inner sensor signal versus inlet pressure during an actuation cycle.
Figure 7.
Inner sensor signal versus inlet pressure during an actuation cycle.
3.4. Stroke Volume and Actuation Cycle Characteristics
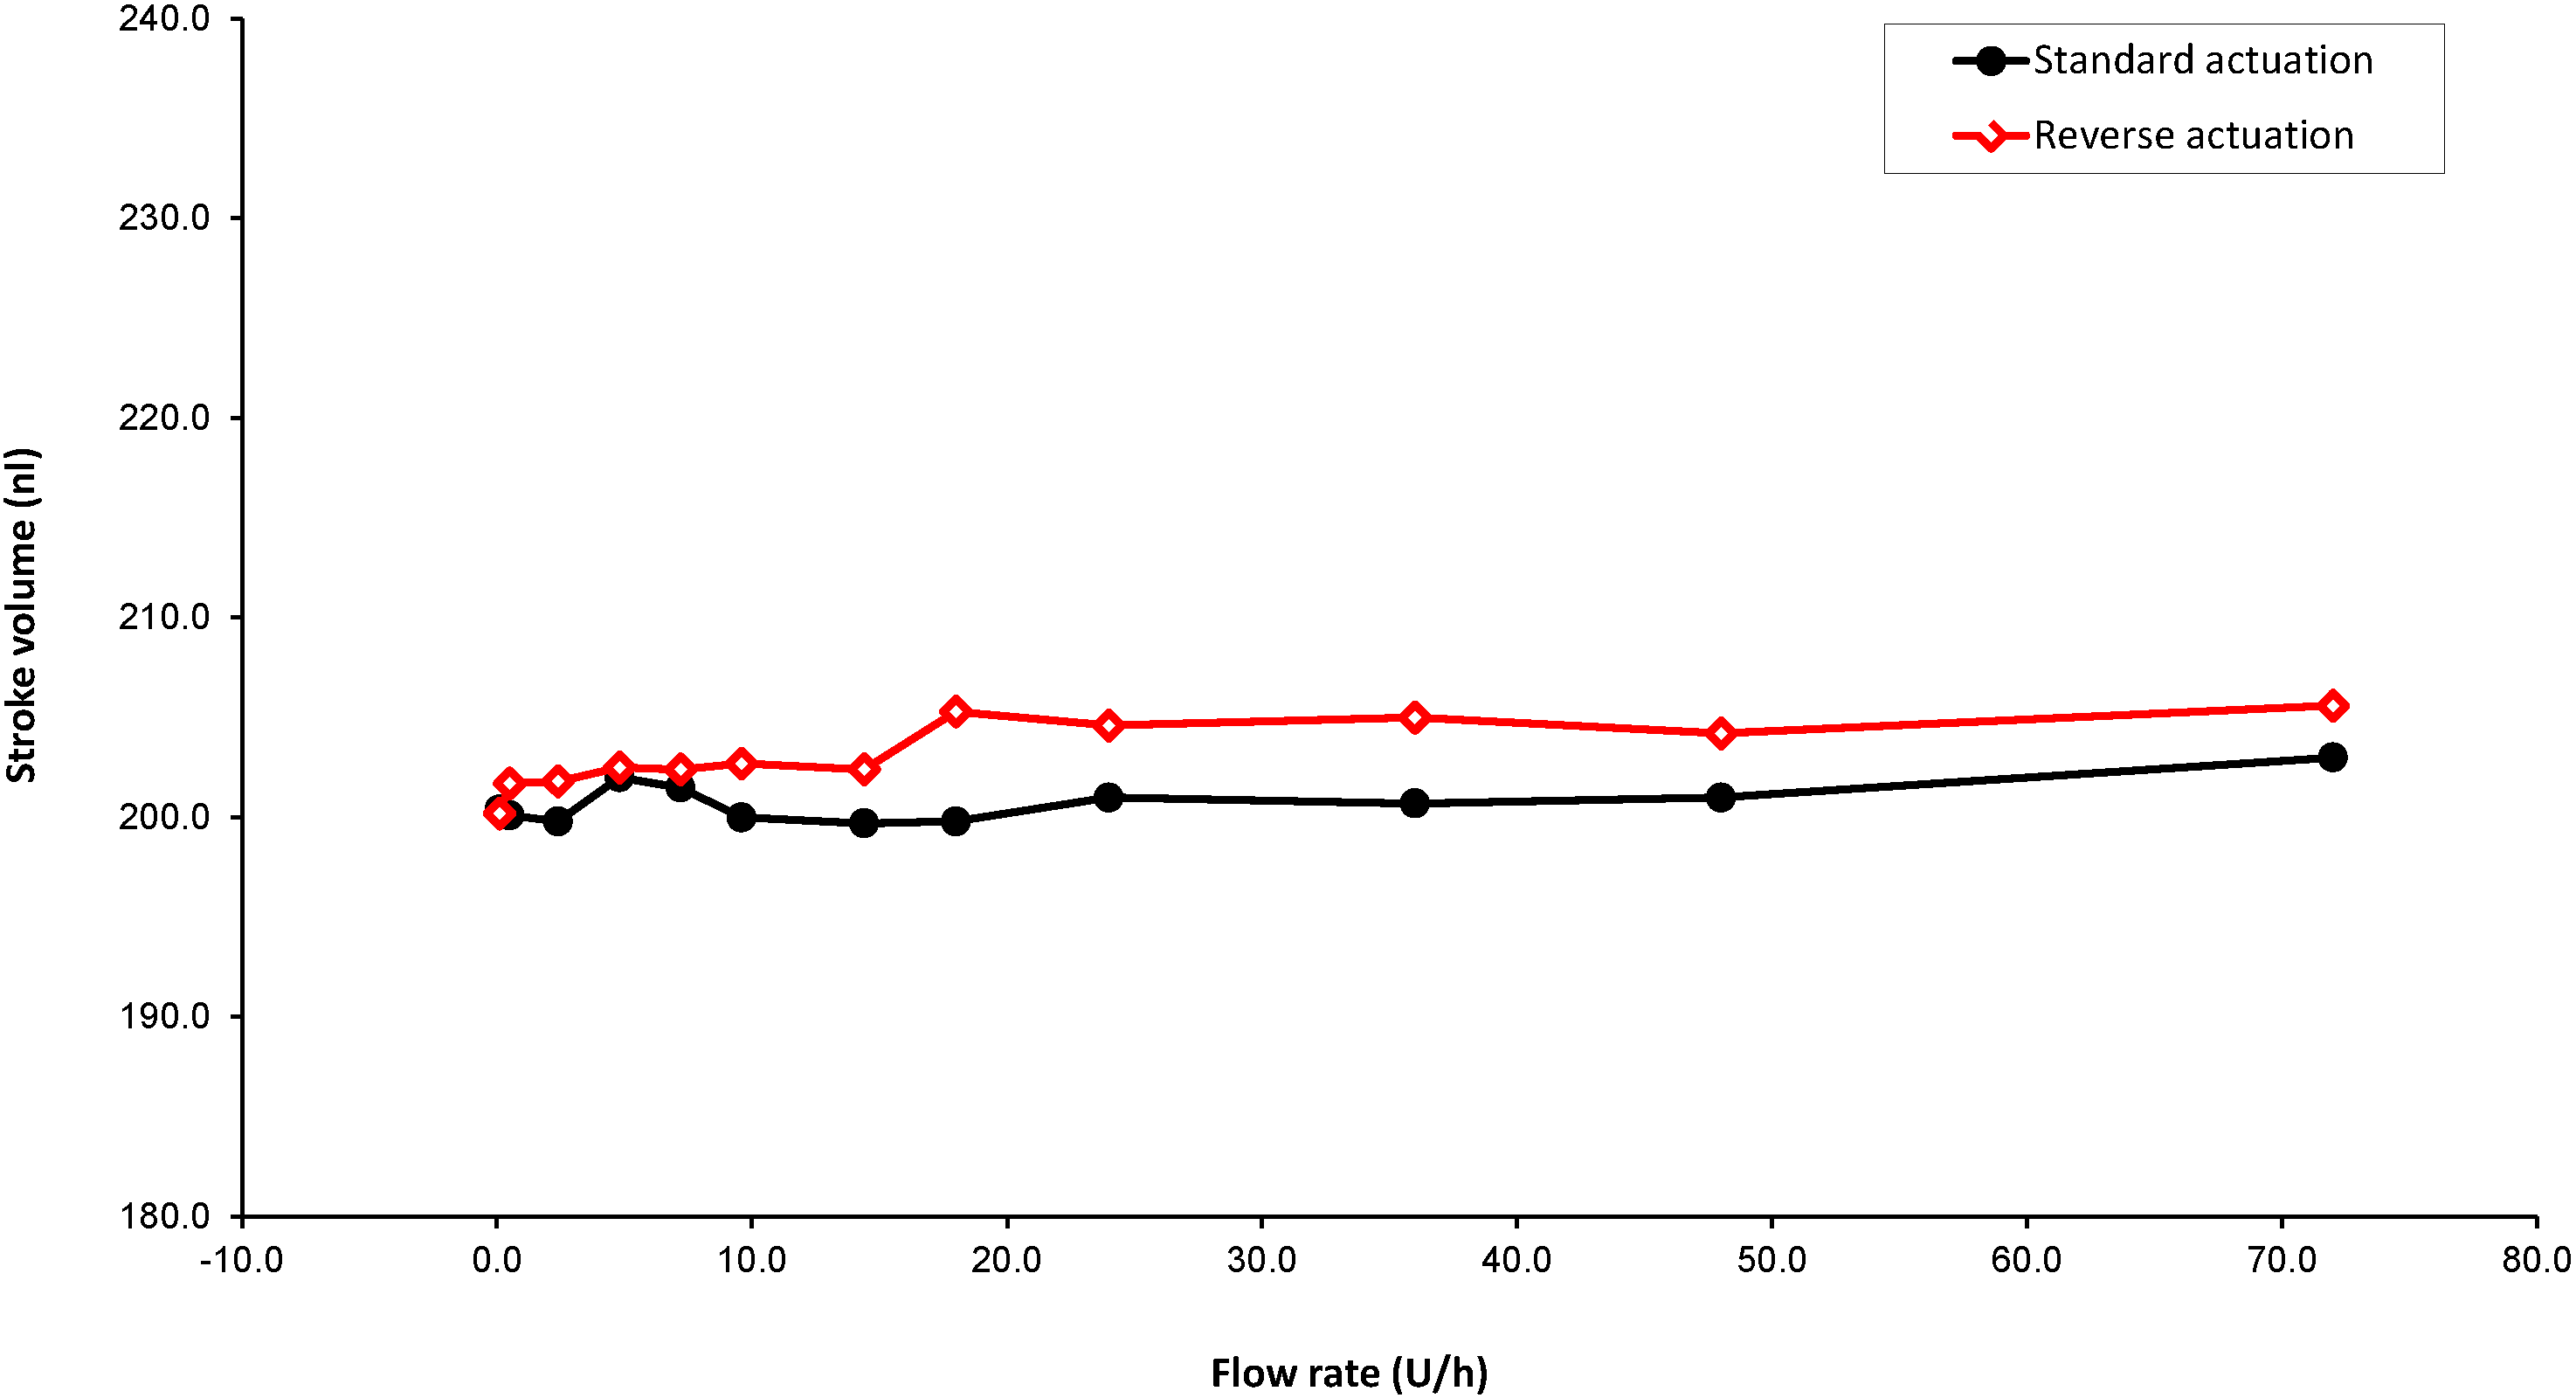
Figure 8 shows that the stroke volume does not vary with the insulin basal rate, from a slow basal rate of 0.1 U/h to a very high basal rate of 70 U/h.
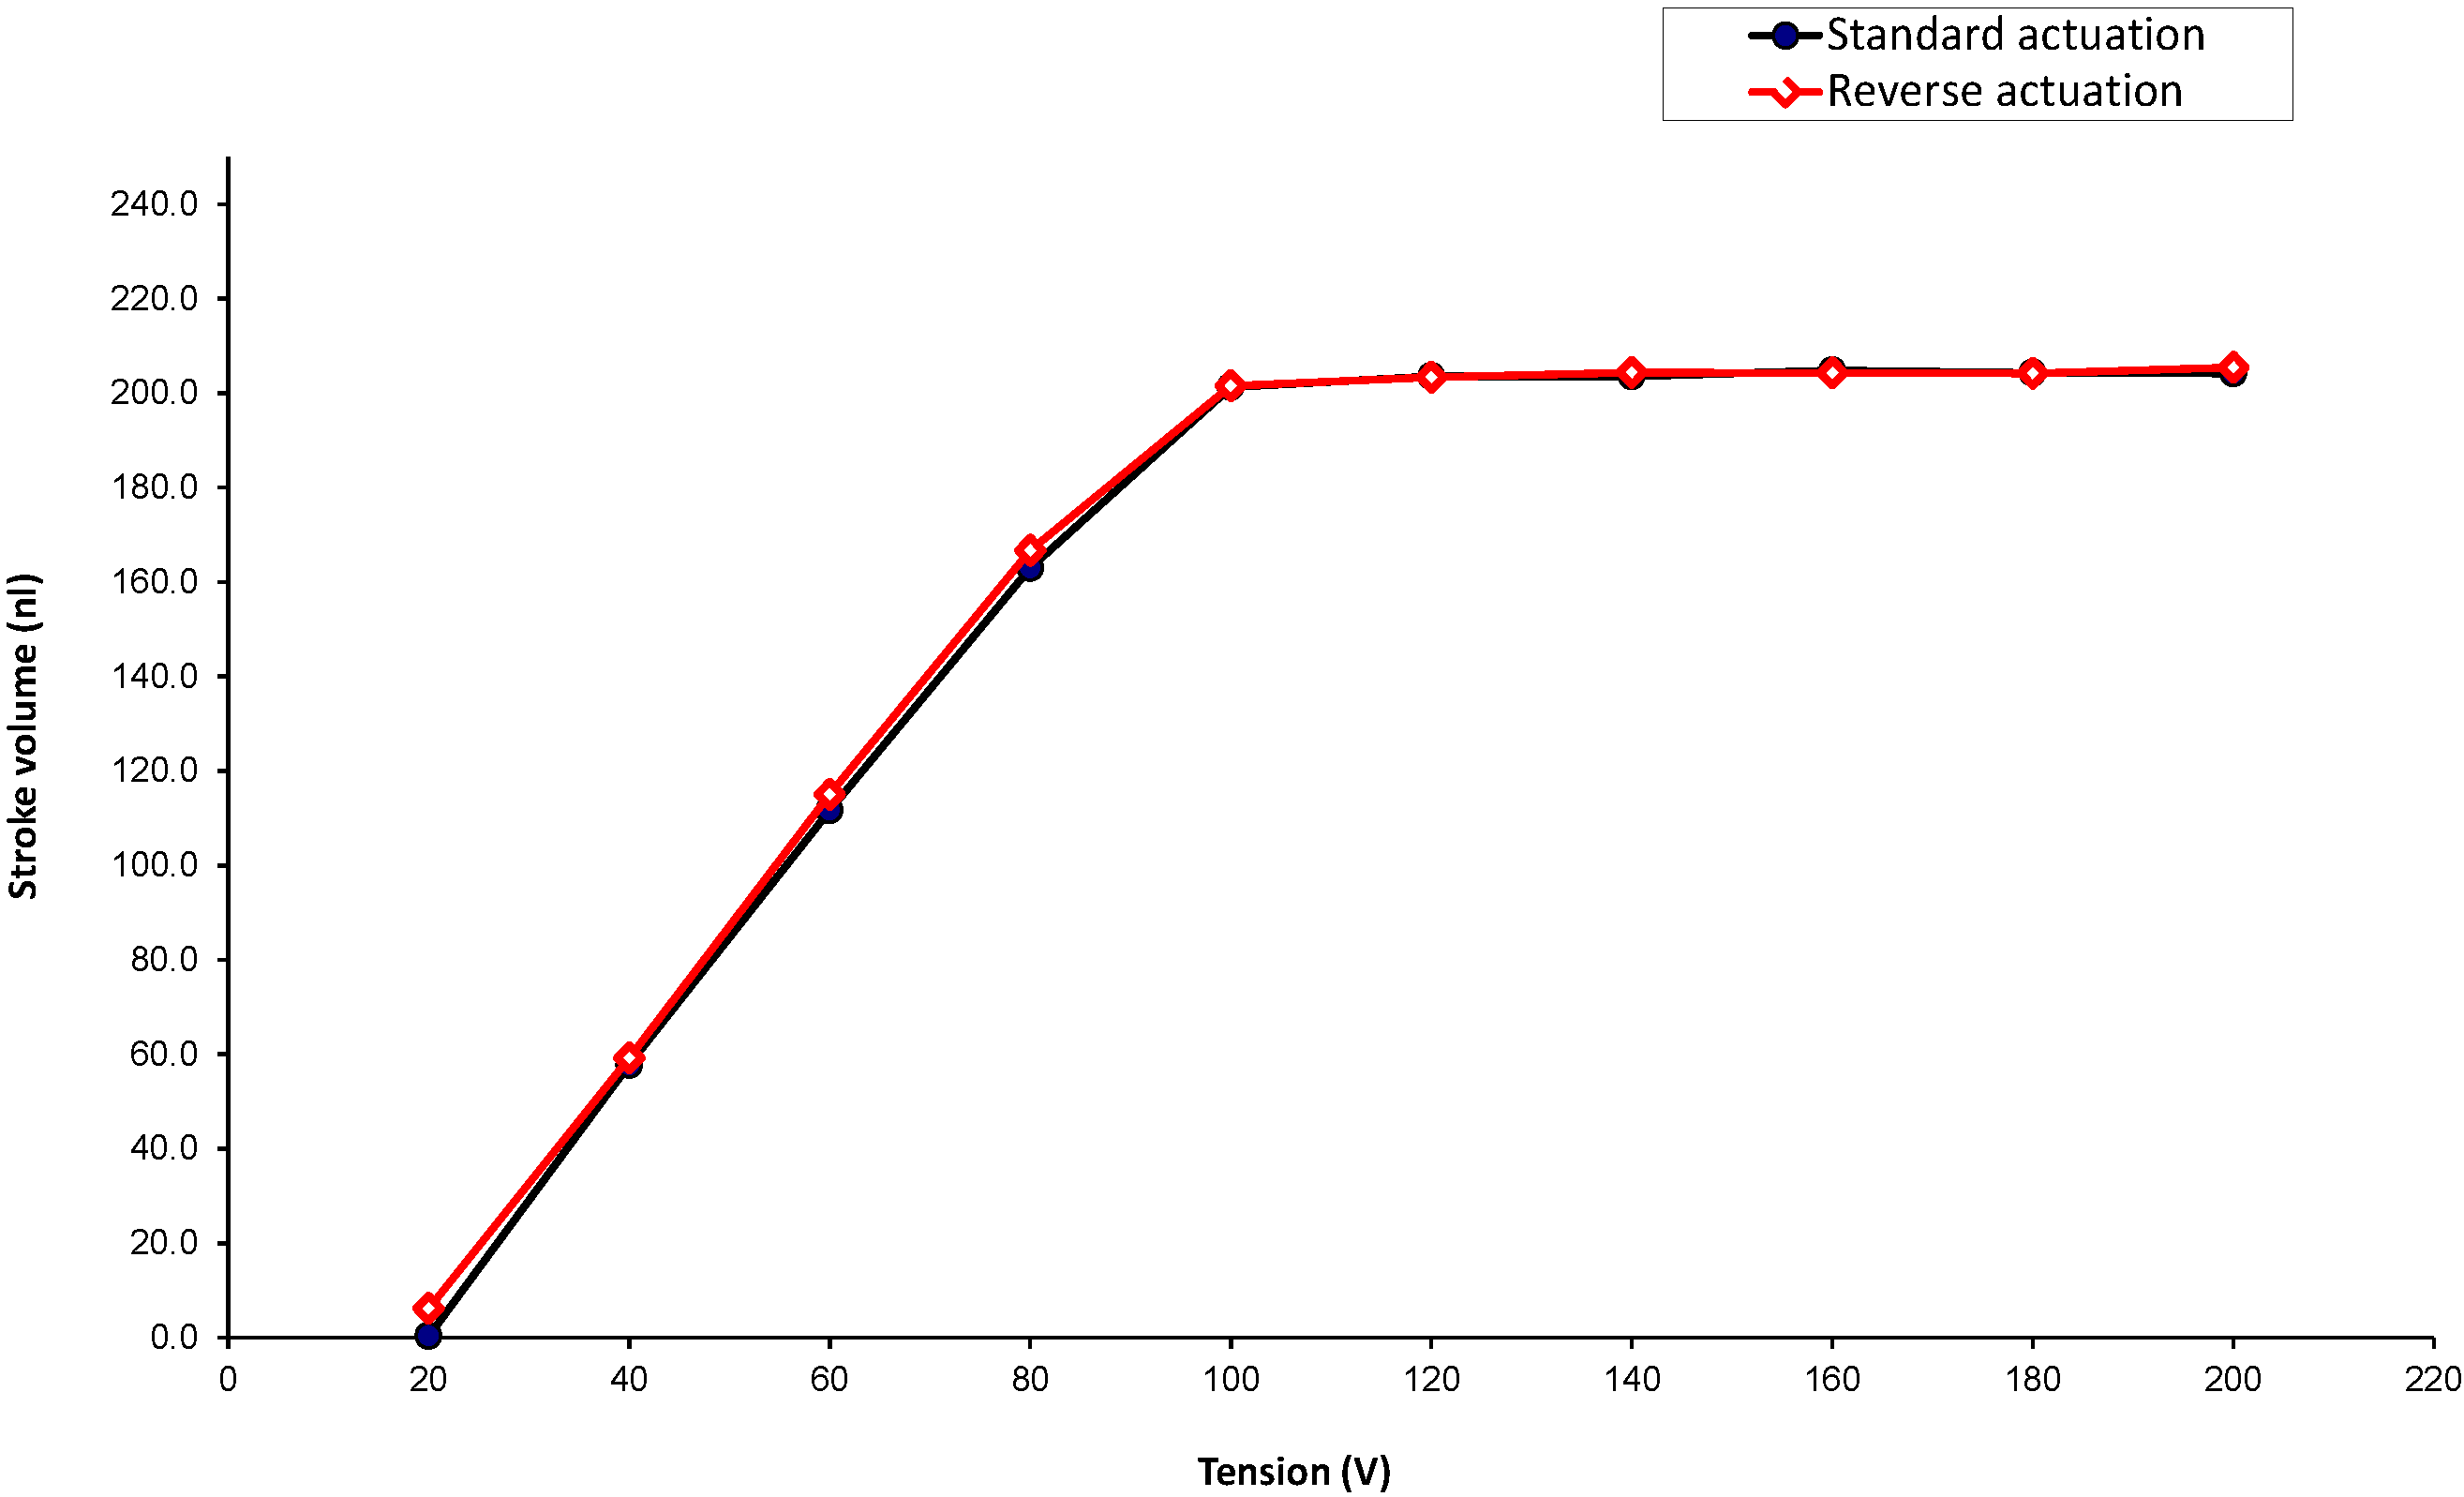
The stroke volume as a function of the voltage driving the piezo actuator is provided in
Figure 9. Under normal pressure conditions, the mechanical stops are reached at 100 V. The piezo is overdriven to 200 V in order to compensate for the assembly and machining tolerances, as well as different outer pressure conditions.
Figure 8.
Stroke volume as a function of the flow rate in standard and reverse modes (for insulin U 100; 1 U/h is equivalent to 0.01 mL/h).
Figure 8.
Stroke volume as a function of the flow rate in standard and reverse modes (for insulin U 100; 1 U/h is equivalent to 0.01 mL/h).
Figure 9.
Stroke volume as a function of the actuation voltage in standard and reverse modes.
Figure 9.
Stroke volume as a function of the actuation voltage in standard and reverse modes.
3.5. Stroke Volume and Viscosity
The stroke volume is independent of viscosity for incompressible media, since the device is a volumetric pump, but the maximum flow rate is reduced for viscous liquid.
The tests have been performed at 20 °C using water and a mix of water and glycerol. The actuation frequency has been increased up to the maximum flow rate. For water, the flow rate varies linearly with the actuation frequency up to 2.5 mL/h (actuation frequency of 3.5 Hz), and a maximum flow rate of 4.3 mL/h is measured at 18 Hz. The results are summarized in
Table 1.
Table 1.
Max flow rate as a function of viscosity.
Table 1.
Max flow rate as a function of viscosity.
| Fraction of glycerol by mass | Viscosity (cP) | Max flow rate (mL/h) | Frequency (Hz) |
|---|
| 0 | 1 | 4.3 | 18 |
| 0.59 | 10 | 0.85 | 6 |
| 0.71 | 25 | 0.46 | 6 |
3.6. Leakage Detection
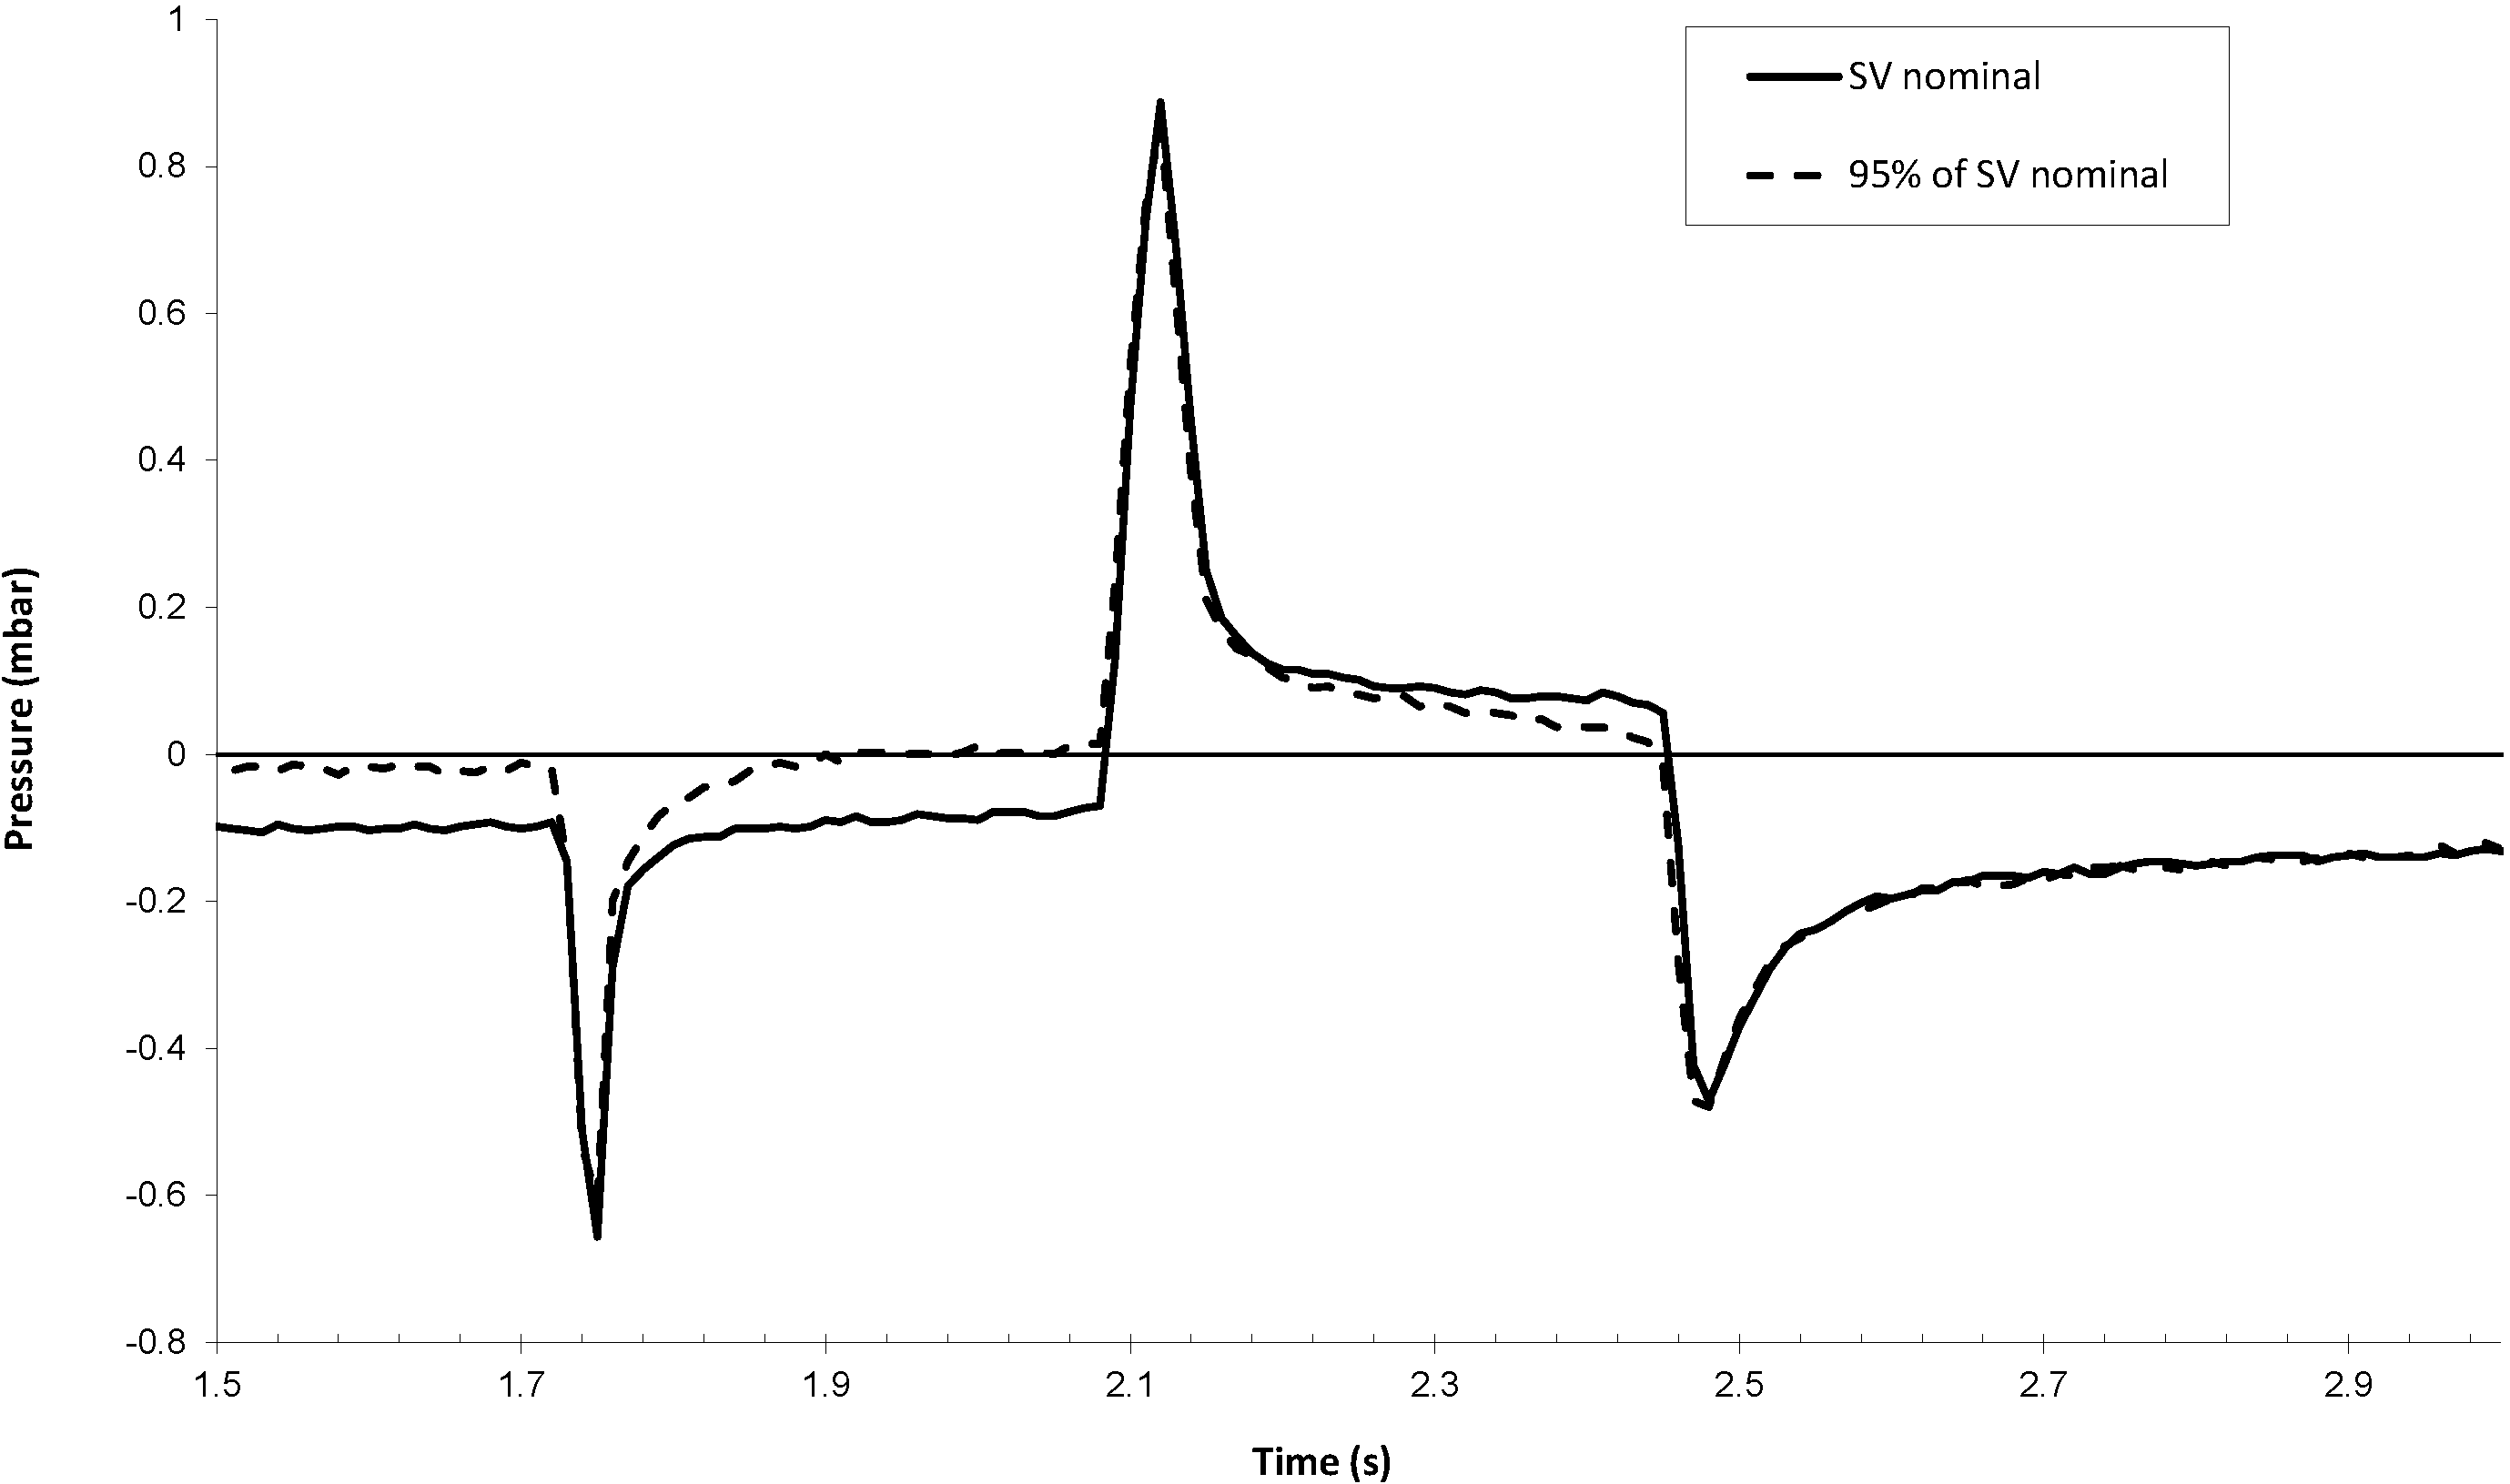
The effect of a leakage of the pumping chamber, typically due to particles on the valve seat, is shown in
Figure 10. The test has been performed by pumping a water solution containing 6 × 10
5 particles/mL (0.5 micron silica particles from Duke Scientific). The particle filter of the micropump has been removed for the test. Since the fluidic resistance of this filter is more than 100-times smaller than the fluidic resistance of the pump chip itself, this removal does not change the pump dynamics. The test has been carried out up to the measurement of a significant leakage. Infrared (IR) inspection has revealed an important amount of silica particles forming clusters on both valve seats.
It is worth noting that the pressure decay following the outlet valve closure, during the push phase, is significantly changed in the case of a back-flow equivalent to a decrease of 5% of the nominal stroke volume. The leakage detection algorithm is based on the analysis of the pressure decay just after the pressure peaks, which is compared to a threshold value being a fraction of the outlet valve pretension. Any accuracy loss larger than 5% would therefore be detected. In addition, the absence of positive pressure in the reservoir prevents any insulin flow in the case of valve leakage.
Figure 10.
Inner sensor signal in reverse mode before and after a leakage, which reduces the effective stroke volume (SV) by about 5%.
Figure 10.
Inner sensor signal in reverse mode before and after a leakage, which reduces the effective stroke volume (SV) by about 5%.
3.7. Air Bubble Detection
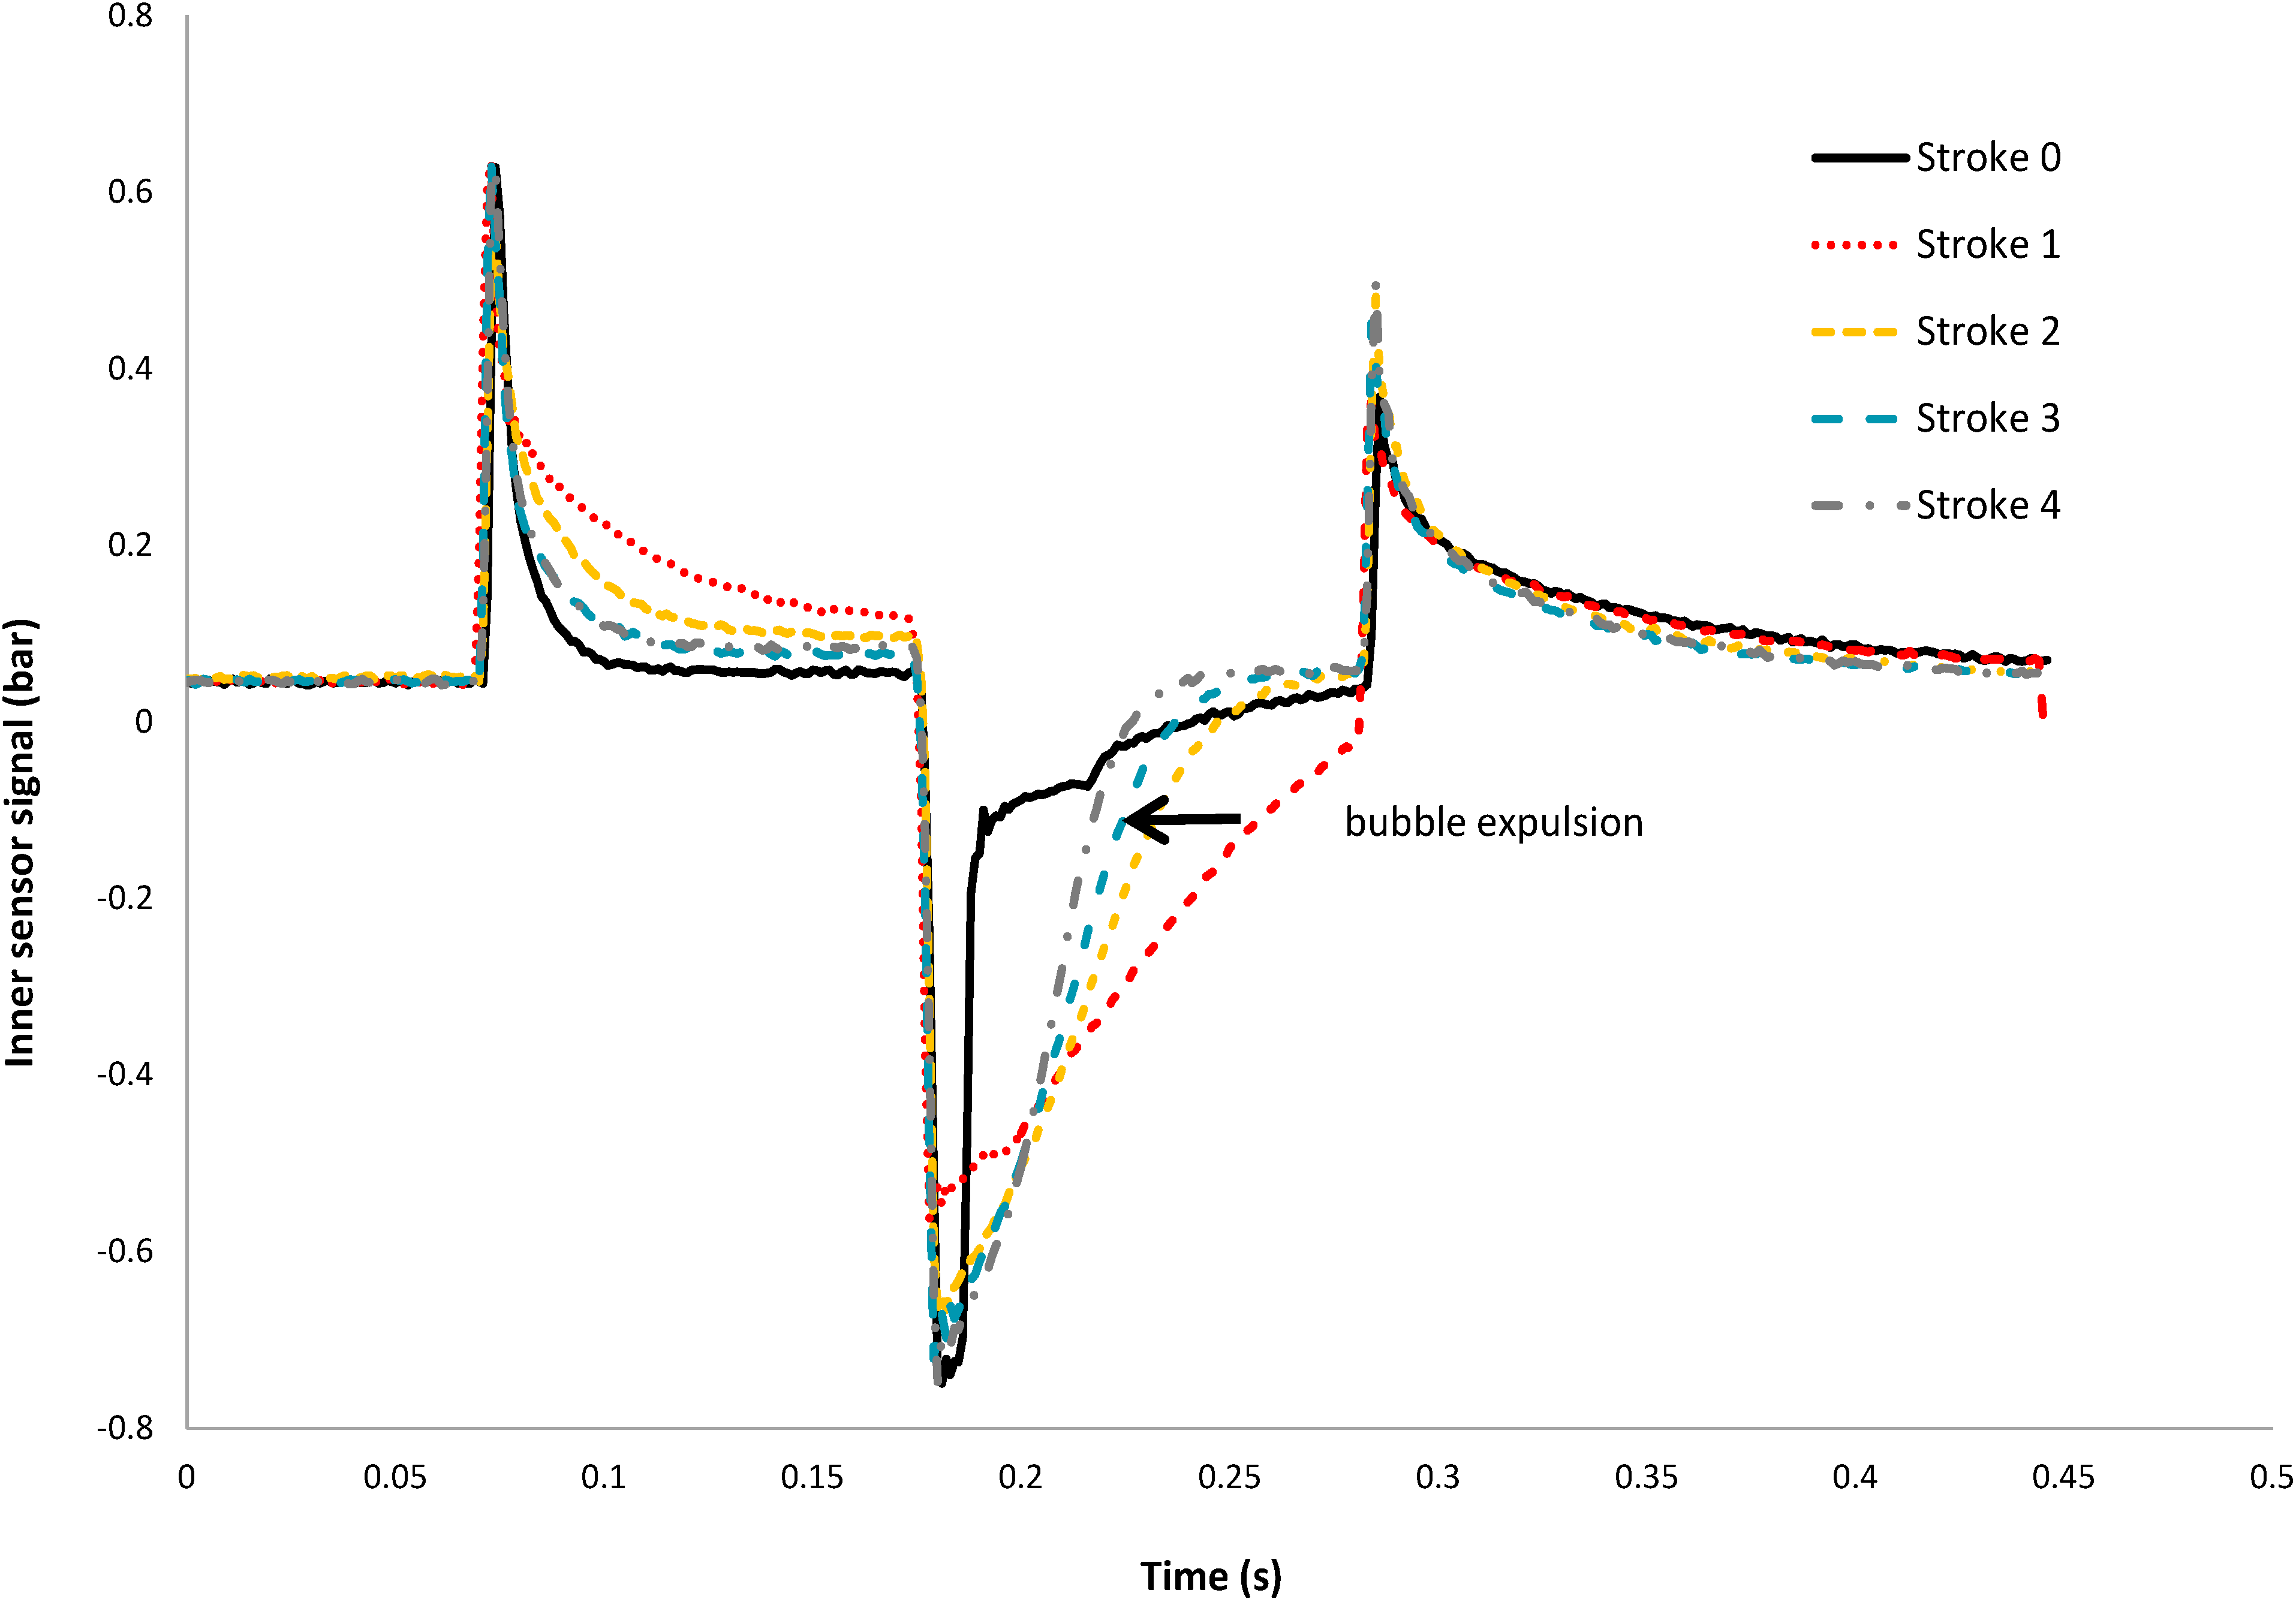
To investigate the effect of air bubbles on the inner sensor signal, the inlet port of the micropump has been connected to a reservoir with tubing. This tubing has been disconnected during one actuation cycle to introduce an air bubble of 200 nL in the fluidic line. The pump is then actuated in bolus mode (at a frequency of 3.125 Hz).
Figure 11 shows typical pressure curves recorded by the inner sensor during the introduction of this bubble in the pumping chamber. The air is introduced during Stroke 1 in the pumping chamber, inducing an enlargement and a height reduction of the pressure peaks. The air bubble detection algorithm is therefore based on the analysis of the shape of the inner sensor pressure peaks. The air bubble in the pumping chamber is then expelled progressively during the following strokes. These results are only qualitative, because of the fractioning of the air bubble, making the estimation of the quantity of air in the pumping chamber during the test difficult.
Figure 11.
Five consecutive pressure profiles of the inner sensor during the introduction of an air bubble of 200 nL in the pumping chamber. The air bubble is introduced during Stroke 1 and is progressively expelled during the three following strokes.
Figure 11.
Five consecutive pressure profiles of the inner sensor during the introduction of an air bubble of 200 nL in the pumping chamber. The air bubble is introduced during Stroke 1 and is progressively expelled during the three following strokes.
3.8. Delivery Accuracy
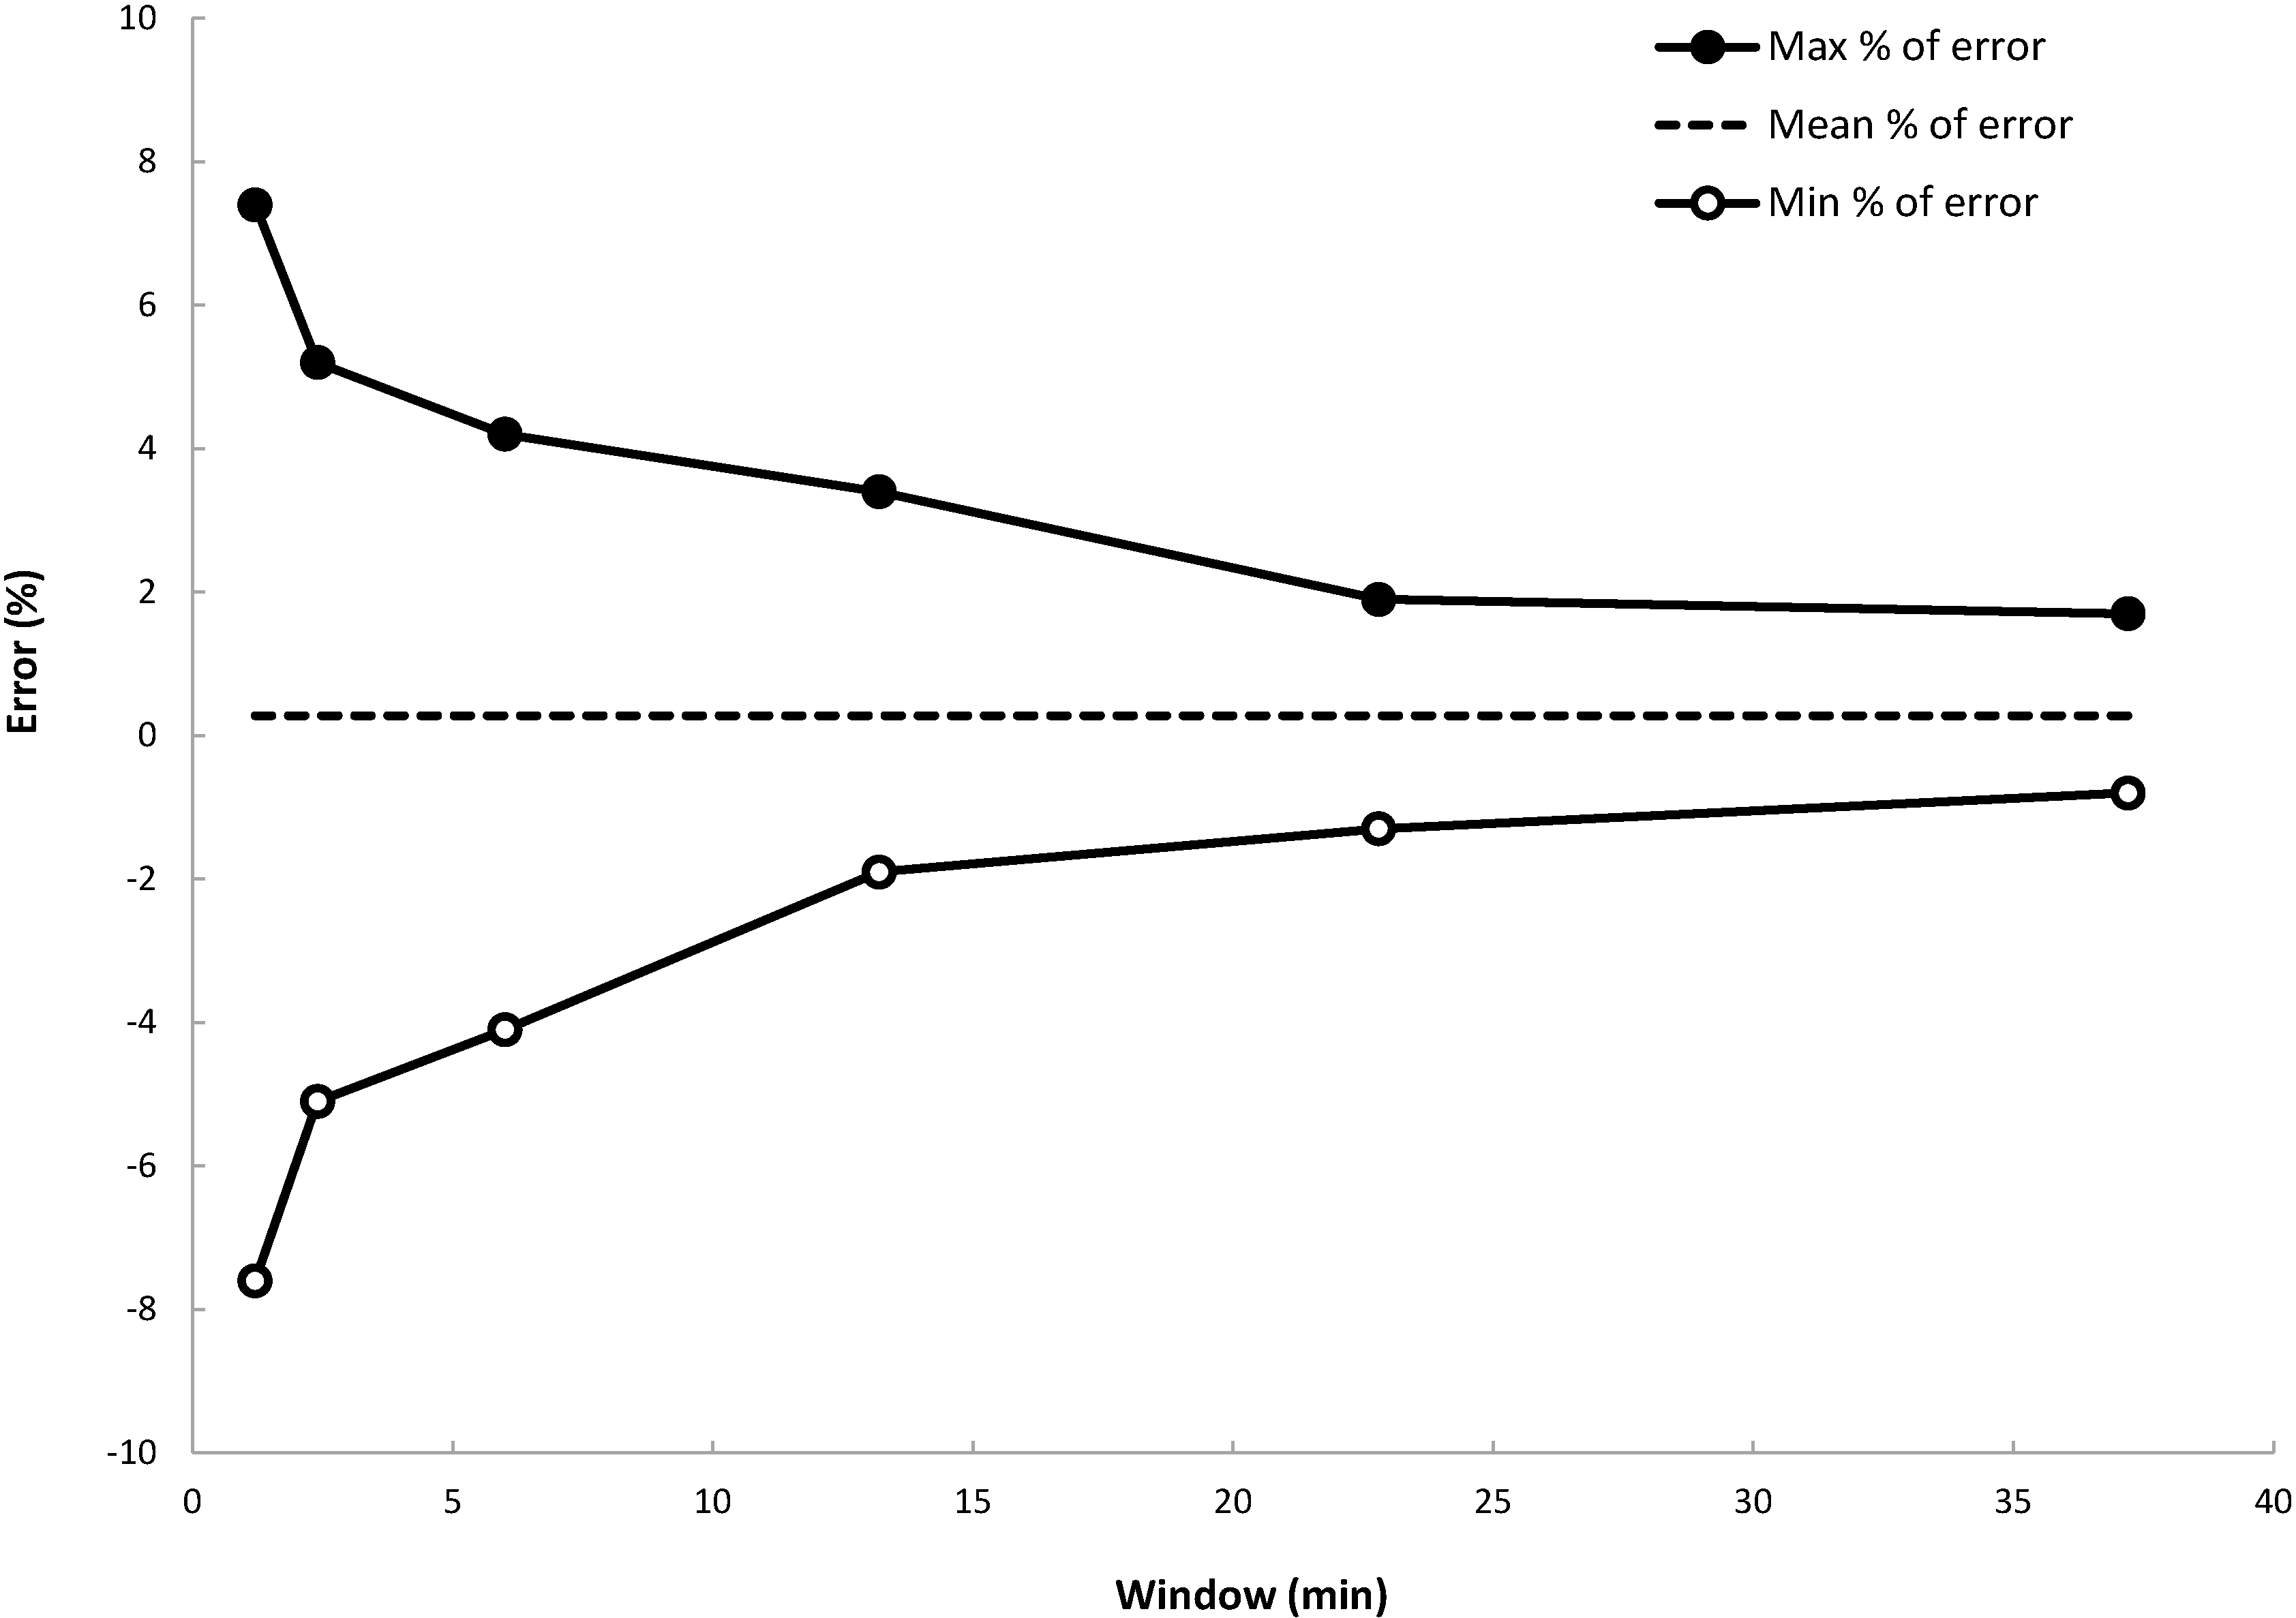
Pump accuracy is commonly illustrated by the so-called trumpet curves. The flow is measured by weighing the infused insulin in predefined observation windows. The pump is programmed to deliver insulin at a fixed rate. The flow data are processed to estimate the evolution of the maximum and the minimum percentages of deviation as a function of the observation windows defined according to the norm IEC60601-2-24 [
13]. Data are recorded and processed with Infuscale 7.0 (Infuscale, Munich, Germany).
The document [
12] shows trumpet curves obtained at room temperature, for a programmed flow rate of 2 U/h. In
Figure 12 are provided trumpet curves obtained using a micropump programmed at 1 U/h, which corresponds to an actuation period of 72 s. Only the pumping unit has been placed into an oven at 38 °C. The curves have been extracted from data collected 1 h after the start of the infusion (the stabilization period fixed by the norm has been intentionally reduced from 24 h to 1 h). Despite the limitations induced by the test setup itself (in particular, the instabilities due to the temperature gradient in the flexible tube between the scale and the pumping unit), delivery accuracy better than ±5% is obtained for observation windows larger than four minutes. The mean flow error with respect to the set rate is equal to +0.28% here.
Figure 12.
Maximum and minimum flow rate errors as a function of the observation window (i.e., “trumpet curve” according to IEC60601-2-24). The dashed line is the mean % of error equal to +0.28%.
Figure 12.
Maximum and minimum flow rate errors as a function of the observation window (i.e., “trumpet curve” according to IEC60601-2-24). The dashed line is the mean % of error equal to +0.28%.


