Effect of the Detector Width and Gas Pressure on the Frequency Response of a Micromachined Thermal Accelerometer

Abstract
: In the present work, the design and the environmental conditions of a micromachined thermal accelerometer, based on convection effect, are discussed and studied in order to understand the behavior of the frequency response evolution of the sensor. It has been theoretically and experimentally studied with different detector widths, pressure and gas nature. Although this type of sensor has already been intensively examined, little information concerning the frequency response modeling is currently available and very few experimental results about the frequency response are reported in the literature. In some particular conditions, our measurements show a cut-off frequency at -3 dB greater than 200 Hz. By using simple cylindrical and planar models of the thermal accelerometer and an equivalent electrical circuit, a good agreement with the experimental results has been demonstrated.1. Introduction
Thermal micromachined accelerometers have recently attracted attention and been intensively studied because of their high shock reliability due to the absence of seismic mass and their small size inducing a low fabrication cost. These last years, many kinds of accelerometers have been developed for measuring vibration, shock, inertial motion and studied because they are widely used in the field of aviation, automation in machine condition monitoring and more especially in automotive industry, such as air bag crash detection. The most widely used principles of operation are based on piezoelectric or piezoresistive effects or capacitive changes [1]. Nevertheless, the existence of the solid proof mass in the accelerometers brings some disadvantages, such as low shock survival rating and a complex fabrication process. Thermal accelerometer is a good alternative to solve the former problem since it works on thermal convection with no moving parts, except the gas used and contained in the micromachined cavity [2-5].
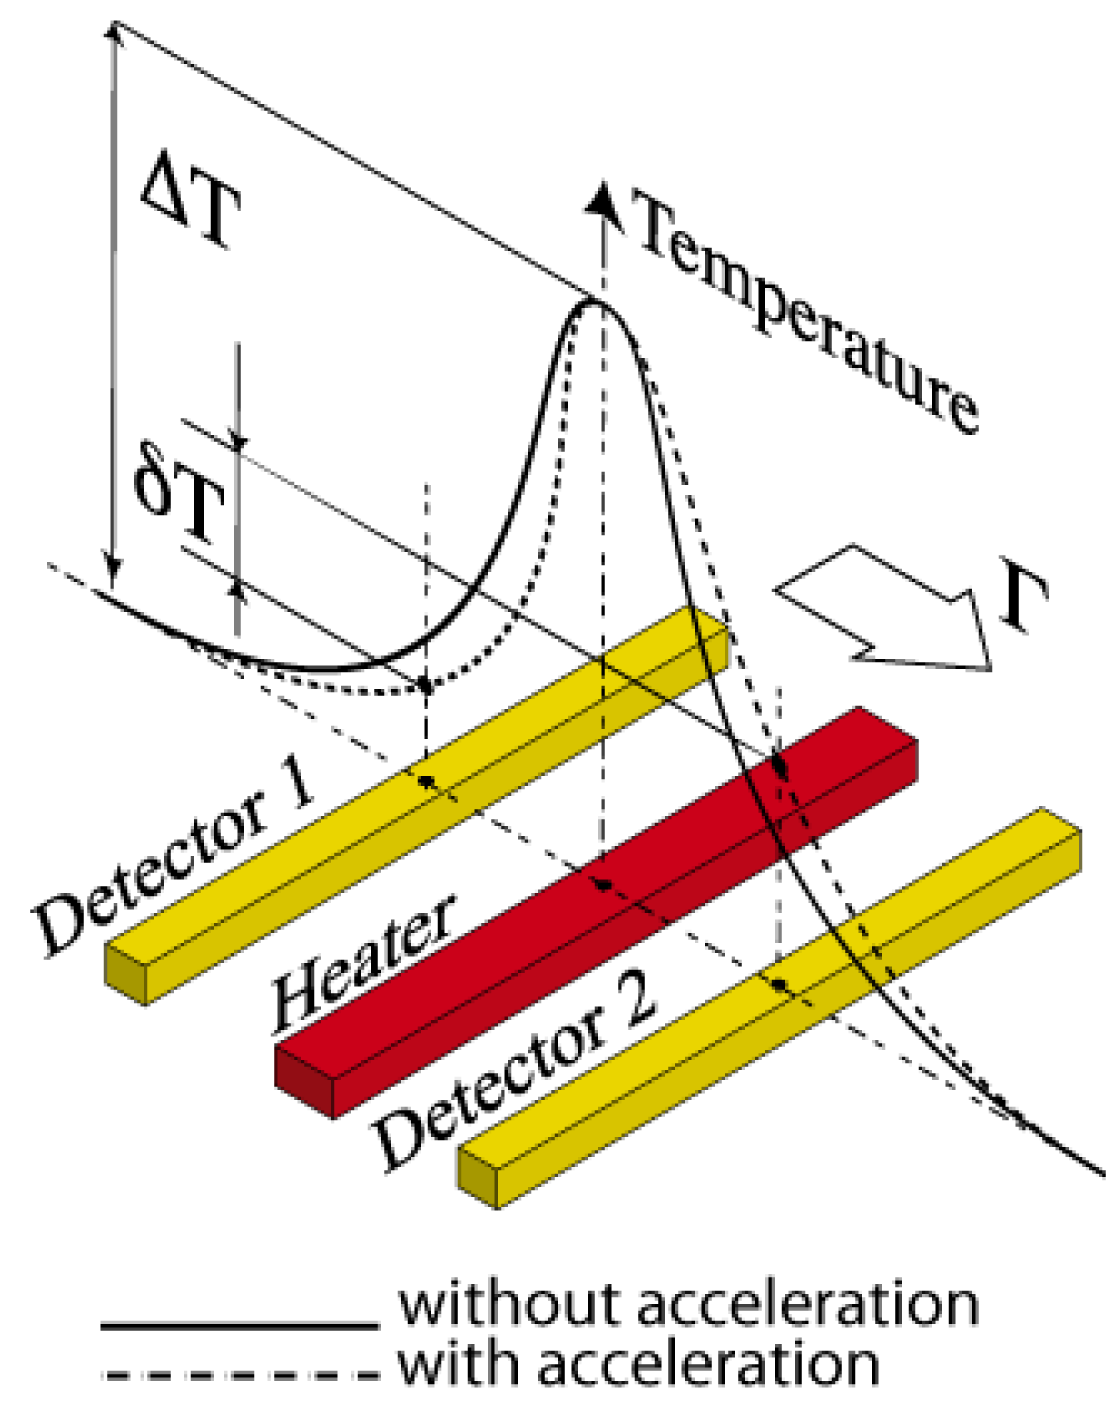
Figure 1 shows the principles of the sensor principle and a brief description of this is described here. Based on free convection in a closed chamber containing a gas, the sensor is composed of one electrical heating resistor placed symmetrically between two temperature detectors. When the heating resistor is powered, it creates a symmetrical temperature profile inducing a thermal balance inside the cavity. Under the influence of an acceleration Γ, the temperature profile shifts and the balance is modified creating a temperature difference on the detectors equal to δT, proportional to the applied acceleration, giving an equivalent sensitivity G = δT/Γ (°C/g). All studies previously done [5,6] on this kind of sensor have allowed understanding the evolution of sensitivity in relation to some parameters, such as the cavity volume, the detectors geometrical design or the gas nature, but very few of them have been done on the dynamic behavior. Leung and coworkers have measured a -3 dB bandwidth of 20 Hz with a classical configuration of a cavity filled with gas [3]. Up to now, the different -3 dB bandwidths measured on a thermal accelerometer were given by D. Goustouridis with a value of 70 Hz with a cavity filled with oil [7], by X.-B. Luo with a value of 75 Hz with a cavity filled with air [8] and finally 120 Hz also with a cavity filled with air [9]. This present paper will only focus on a cavity filled with gas.
In this document, the thermal accelerometer response is theoretically evaluated and experimentally measured. Specific parameters are taken into account to design the sensor, like the size of the detectors and simple models are used for a better understanding of the thermal behavior and the frequency response evolution. Indeed, we give the influence of several parameters such as detector width, gas nature and pressure on the sensor response, as well as its evolution depending on temperature variation. For the different prototypes we experimentally used, the overall system is enclosed in a gas chamber and the detectors are usually placed at 300 μm from the heater. Different measurements are described depending on the experimental conditions.
2. Microstructure Design
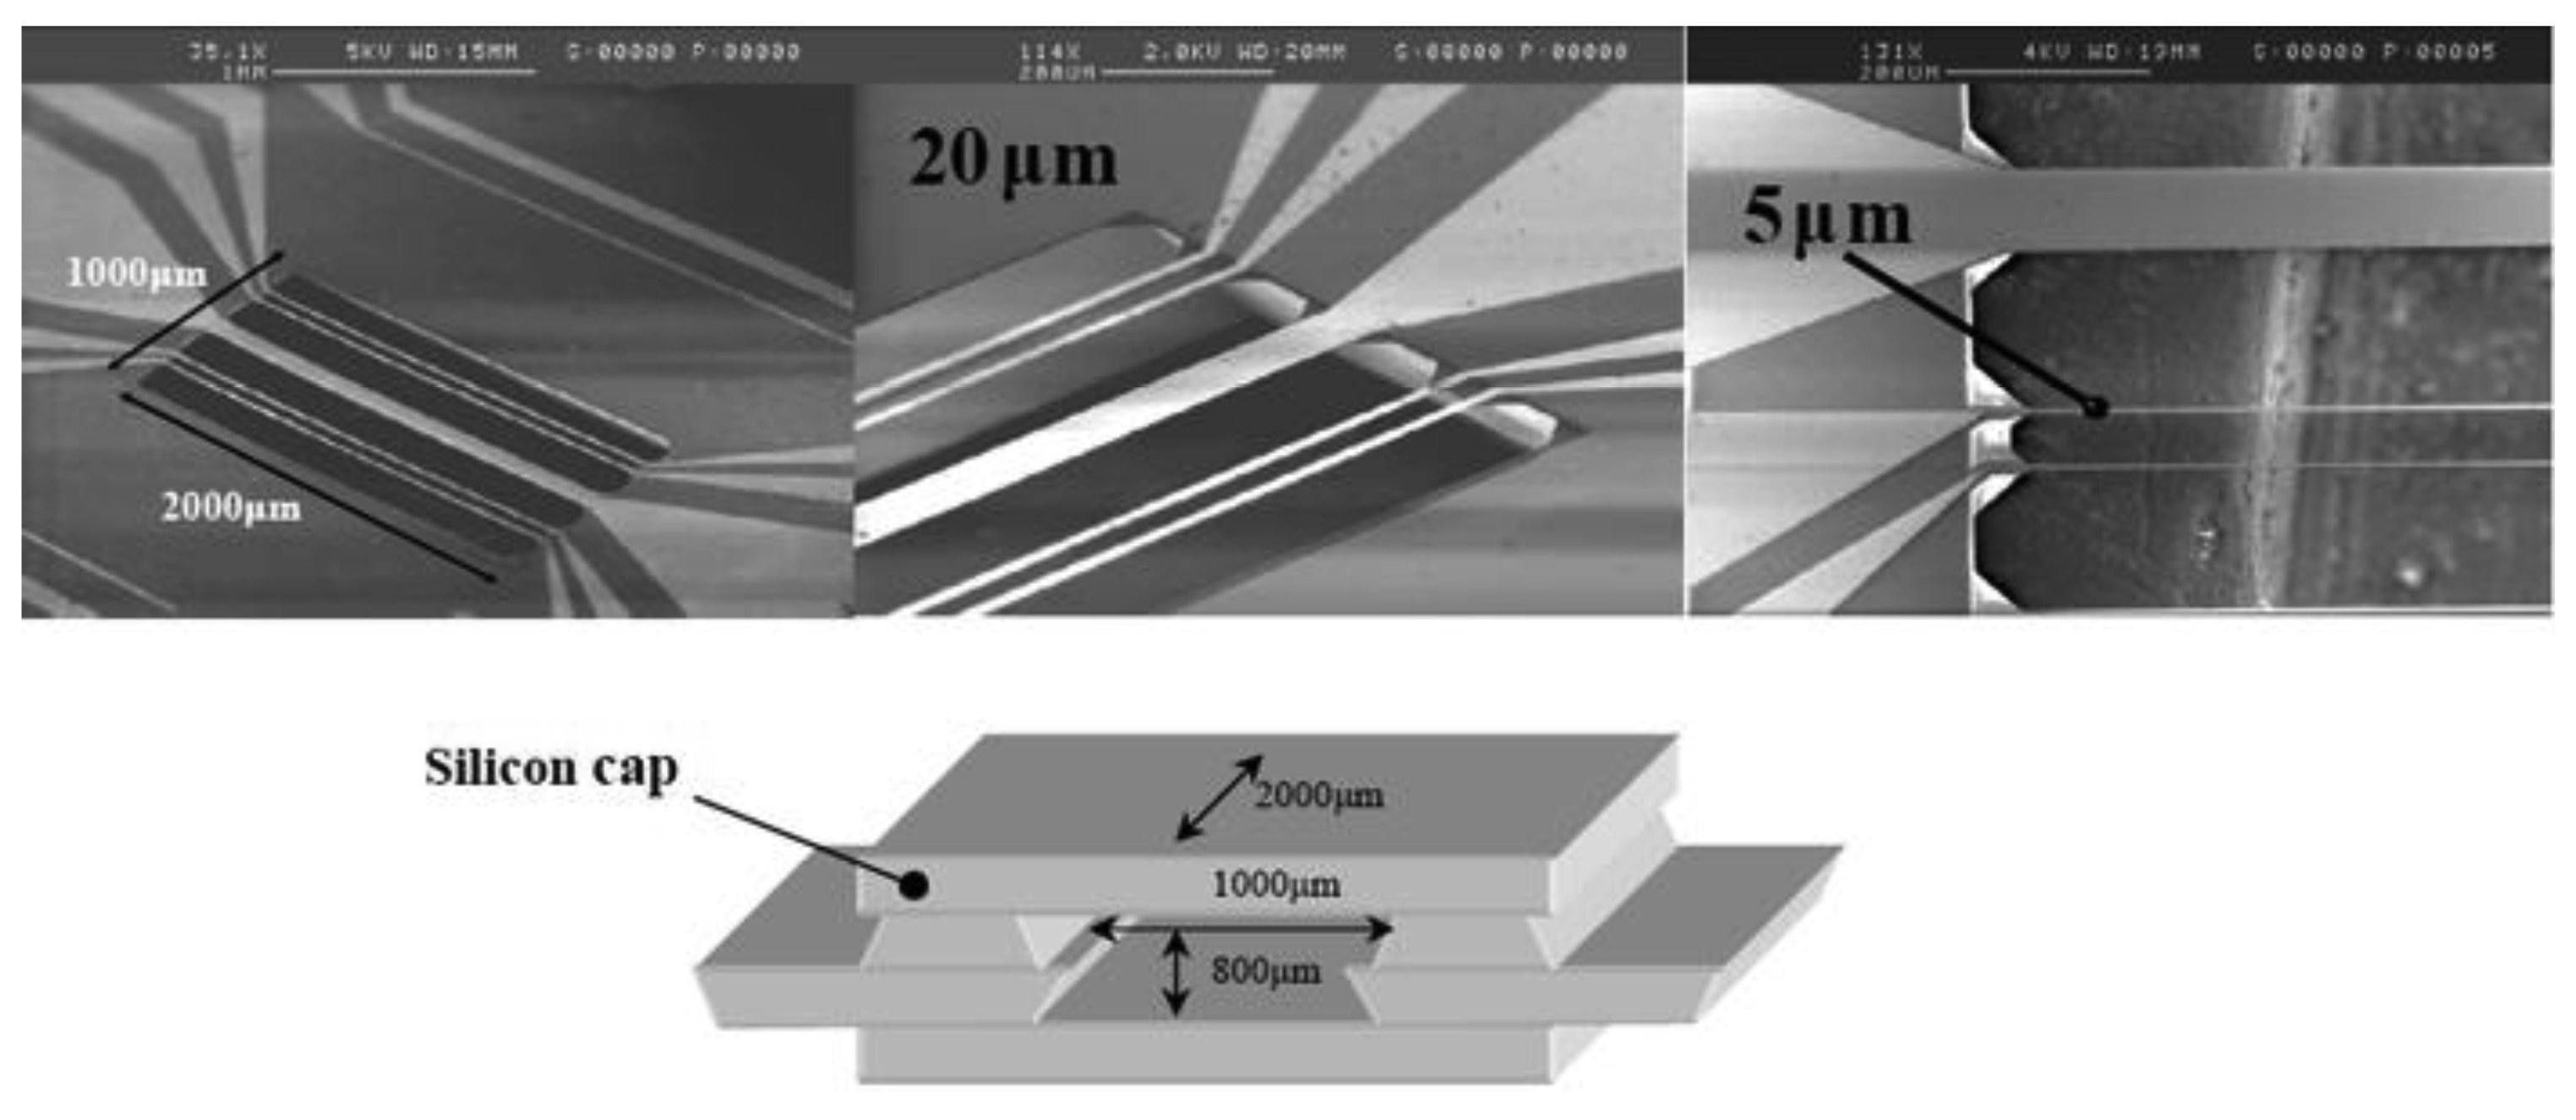
Figure 2 shows SEM (Scanning Electron Microscope) images of the thermal accelerometer after the sensor micromachining with the equivalent geometry reference of the cavity with typical dimensions of 1,000 μm × 2,000 μm × 800 μm. Detector width is chosen from 2 μm to 50 μm. Details of the fabrication steps have already been described in [5] and are succinctly described here. The thin-film platinum heater is 100 μm wide. Low stress Si-rich silicon nitride membrane SiNx [10] is used to improve the thermal isolation between the detector and the surrounding substrate and to limit the energy consumption. The thicknesses of SiNx and platinum layers are 5,000 and 3,000 Å respectively, and a Cr adhesion-promoting layer is used. Platinum is electron-beam evaporated at 400 °C and vacuum-annealed at 500 °C. Its electrical resistivity is about 15 μΩ.cm with a temperature coefficient of resistance (TCR) of 3.1 × 10⁻³ °C−1. The platinum resistors and the SiNx are successively patterned by a Corial 200 IL Reactive Ion Etching (RIE) device. To obtain suspended resistors on SiNx bridges, the silicon is anisotropically etched out using a KOH solution at 85 °C. For all experimental studies carried out here, the silicon cell size is the same whereas the detector width and the gas nature inside the cavity will be different: N2, CO2 and He.
The electronic control of the LDS (Ling Dynamic Systems) vibrating pot is equipped with an automatic control mechanism in amplitude and acceleration frequency, LDS DSC 4 (Digital Sine Controller). Indeed, the acceleration is compared with a reference accelerometer linked to the conditioning Nexus system. The whole system is limited to a maximum acceleration of 40 g. All samples are typically submitted to a sinusoidal acceleration of ±2 g covering a frequency domain from 10 Hz up to 1,000 Hz.
3. Equivalent Electrical Circuit
In this section, thermal behavior of thermal resistor is modeled by using equivalent electrical components: Equivalent thermal capacitance initially and then equivalent thermal resistance. Geometric models used to establish these components are developed. The two values will allow us to estimate the detector bandwidth in the next section and to compare it to the sensor cut-off frequency.
3.1. Equivalent Thermal Capacitance
A thermal capacitance Cth of an element can be theoretically calculated by:
A detector is composed of the superposition of three thin layers: A layer of SiNx covered by a Pt one, with a Cr-adhesion layer. Each of them creates a thermal capacitance, connected in parallel considering their superposition. As we cannot measure thermo-physical parameters of the three different thin layers, bulk parameters will be considered for each one.
3.2. Equivalent Thermal Resistance
Two models are proposed to evaluate the thermal resistance: A cylindrical model on one side and a planar model on the other.
The following assumption is made: The evaluated thermal resistance is the one between the detector surface and its surrounding gas. Indeed, the heat exchange we focus on is an interface phenomenon and it can be located in the thermal boundary layer, where thermal convection is assimilated to thermal conduction. Thus thermal parameters linked to convection heat transfer are calculated through conduction phenomenon.
3.2.1. Cylindrical Model
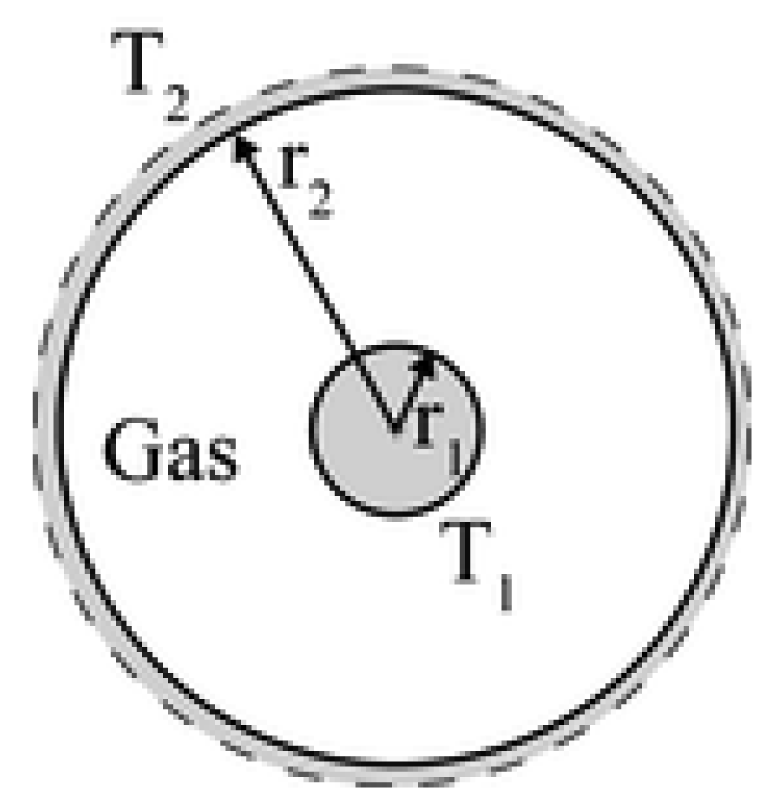
Firstly, we consider a two-heated-concentric-circular-cylinder model, with a length L, as shown in Figure 3: The inner being the detector at a temperature T1 with a radius r1 and the outer being the substrate with a temperature T2 < T1 and a radius r2.
With this geometry, the thermal heat flux exchange can be calculated by:
By definition, the thermal resistance between the gas and the detector is given by:
3.2.2. Planar Model
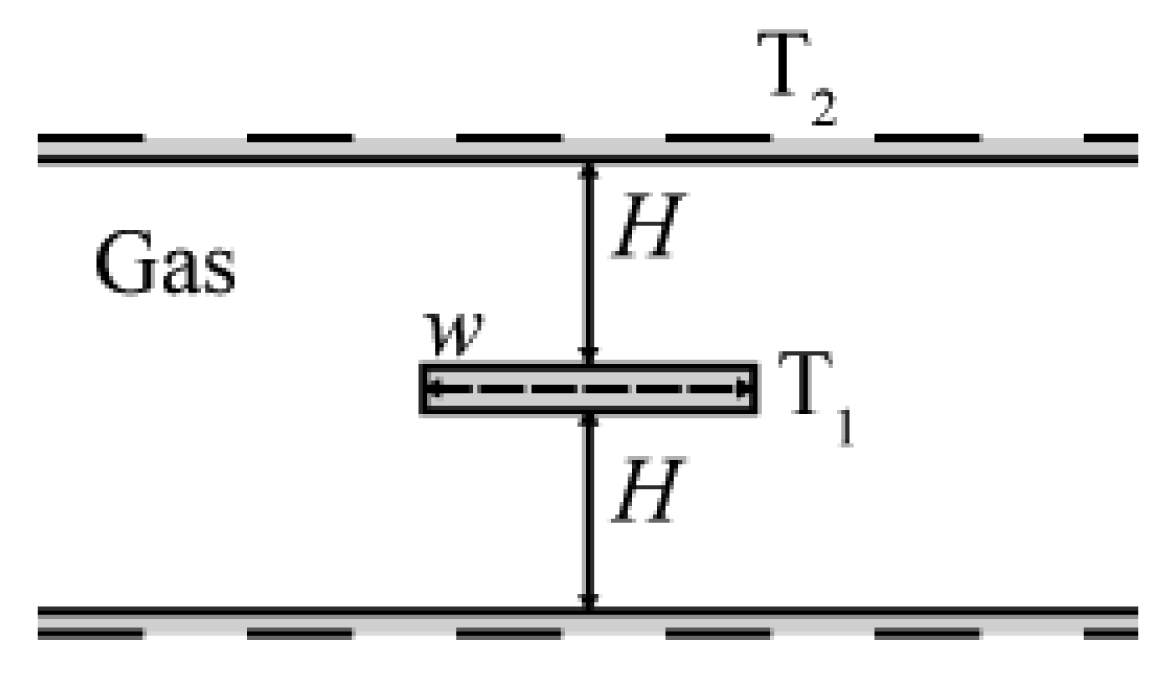
The thermal resistance between the surrounding gas and the surface of the detector can also be calculated using a second model: A planar one as described in Figure 4. The detector is considered to be a plate with a width w, a length L, from a distance H to the substrate in the vertical direction. So here H represents the silicon cap at 400 μm placed above the thin film layer and T1 and T2, the silicon cap temperature and the element under consideration respectively.
With this 2D complex geometry, a simple expression of a thermal flux, as in a cylindrical case, cannot be extracted. The problem is simplified by using a shape factor κ to describe this complex geometry. We finally obtain [11]:
Therefore, the thermal resistance between gas and detector surface is given by:
4. Evolution of the Frequency Response with Gas Nature
For this study, the cavity dimension is constant and respectively equal to 1,000 μm × 2,000 μm × 800 μm and the cavity is filled with a different gas, N2, CO2 and He, for which the Prandtl numbers are close to 0.7 [12].
A first assumption for the sensor response time is to consider the time response of the detectors negligible compared to the bubble gas one. In this way the system is equivalent to a first order RC circuit and its response time is set by the product of the thermal resistance with the heat capacitance of the bubble:
The corresponding cut-off frequency at −3 dB is consequently proportional to:
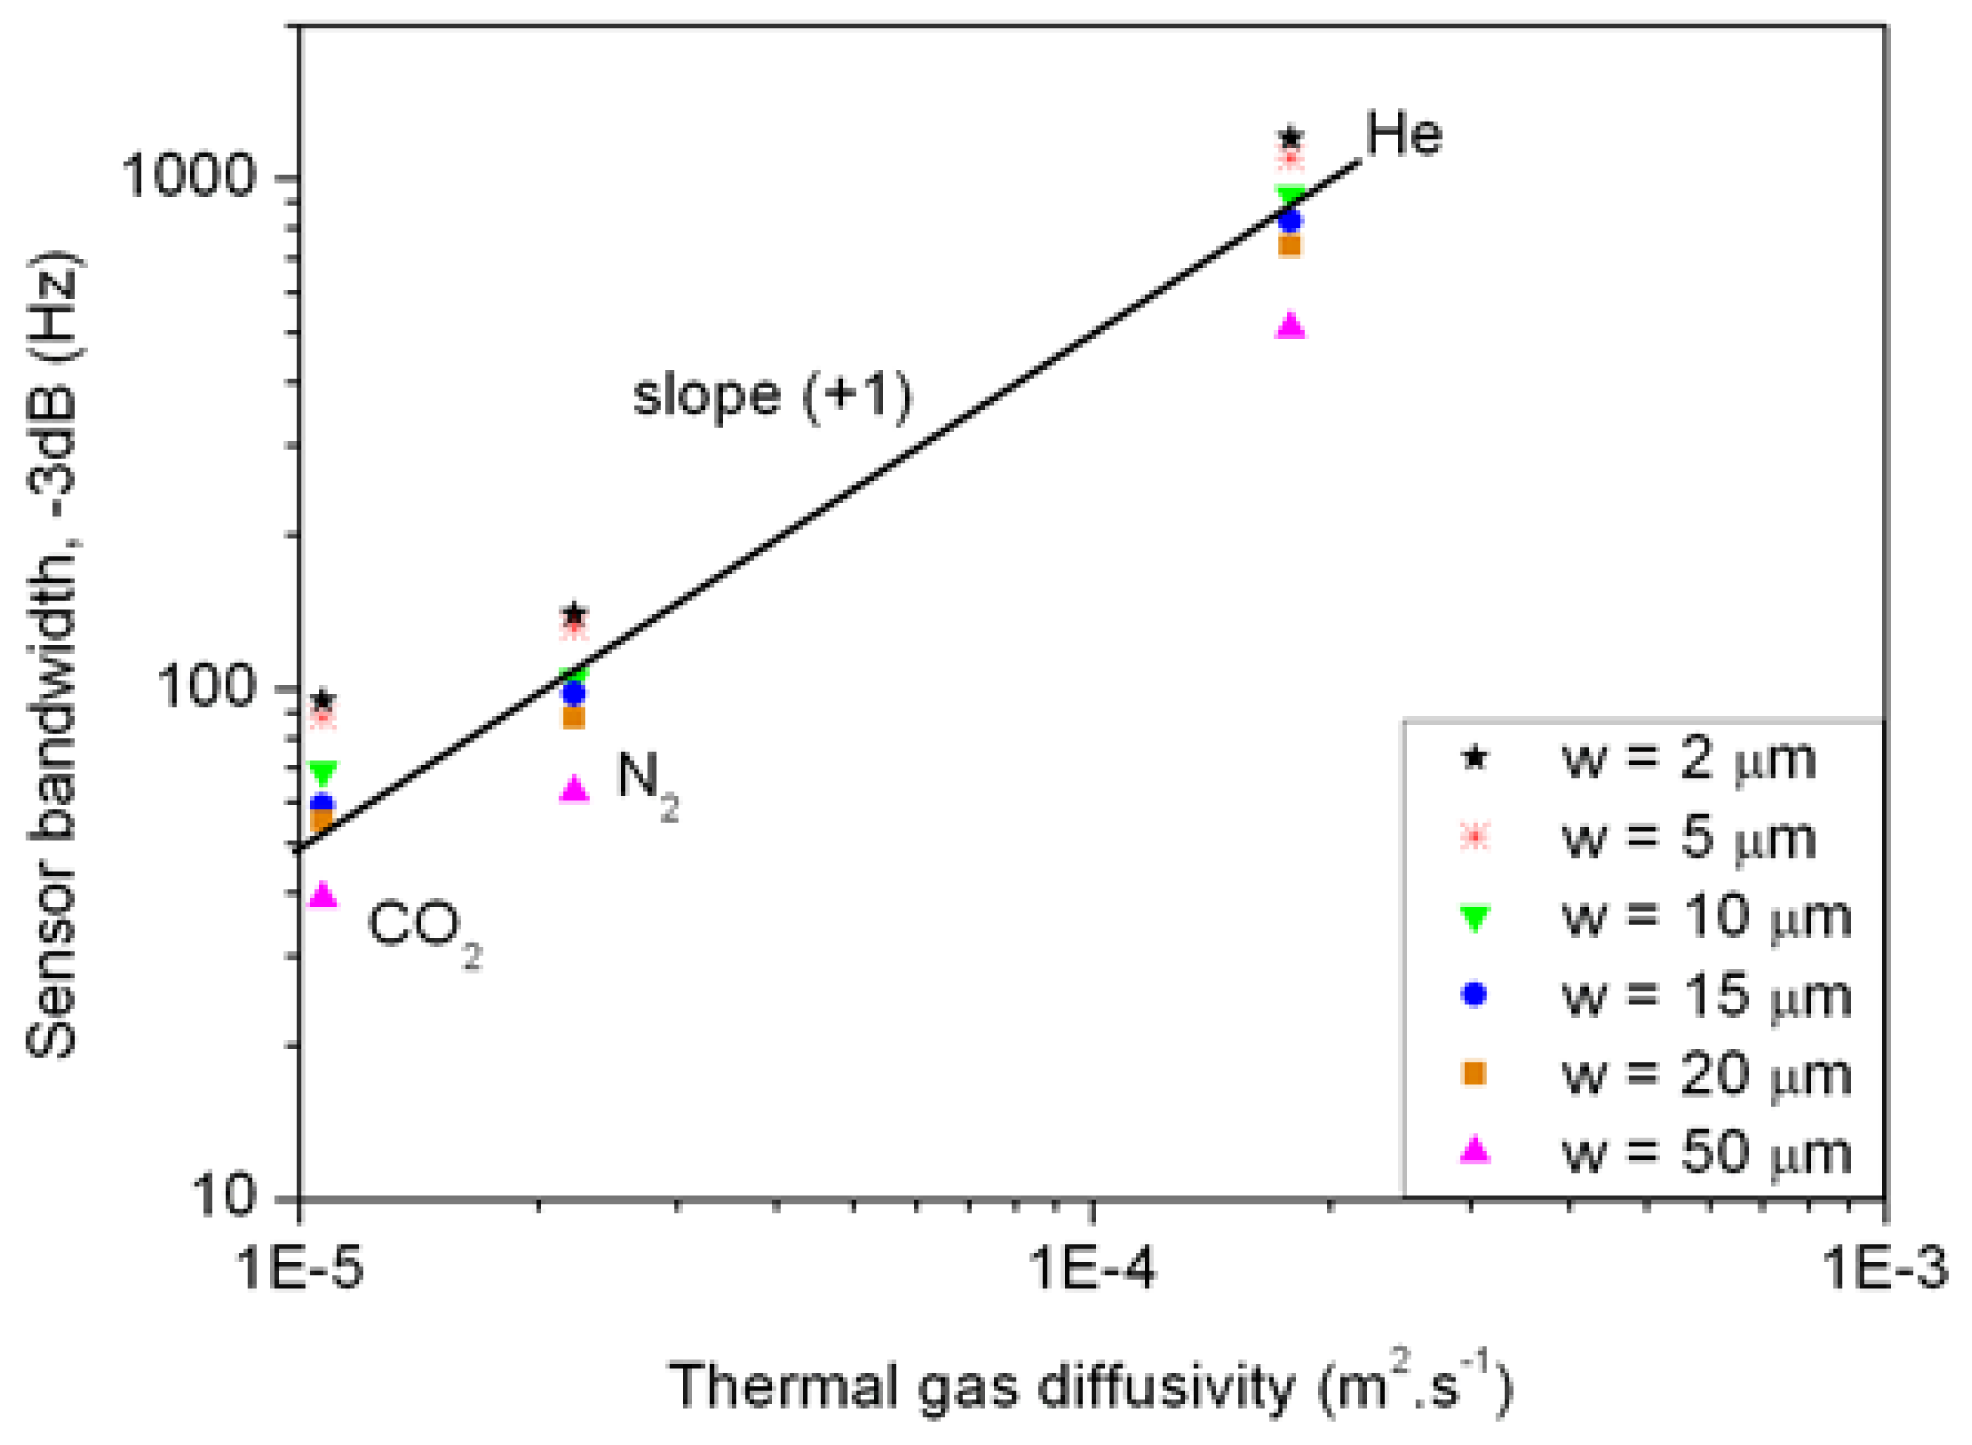
Figure 5 summarizes the different thermal gas diffusivities at temperature equal to 573 K and the corresponding bandwidth measurements at −3 dB for different detector widths. These results show that the model given in (8) is verified where the bandwidth is proportional to the thermal diffusivity as the curve slope n is close to one with a log-log scale. This study leads us to an important result, i.e., to increase the frequency bandwidth at −3 dB, a high gas thermal diffusivity for a given cavity dimension has to be used.
5. Frequency Response Analysis with Detector Width
Frequency response analysis includes both the evolution of thermal sensitivity in the bandwidth and the evolution of cut-off frequency at −3 dB with detector width.
5.1. Sensitivity versus Detector Width
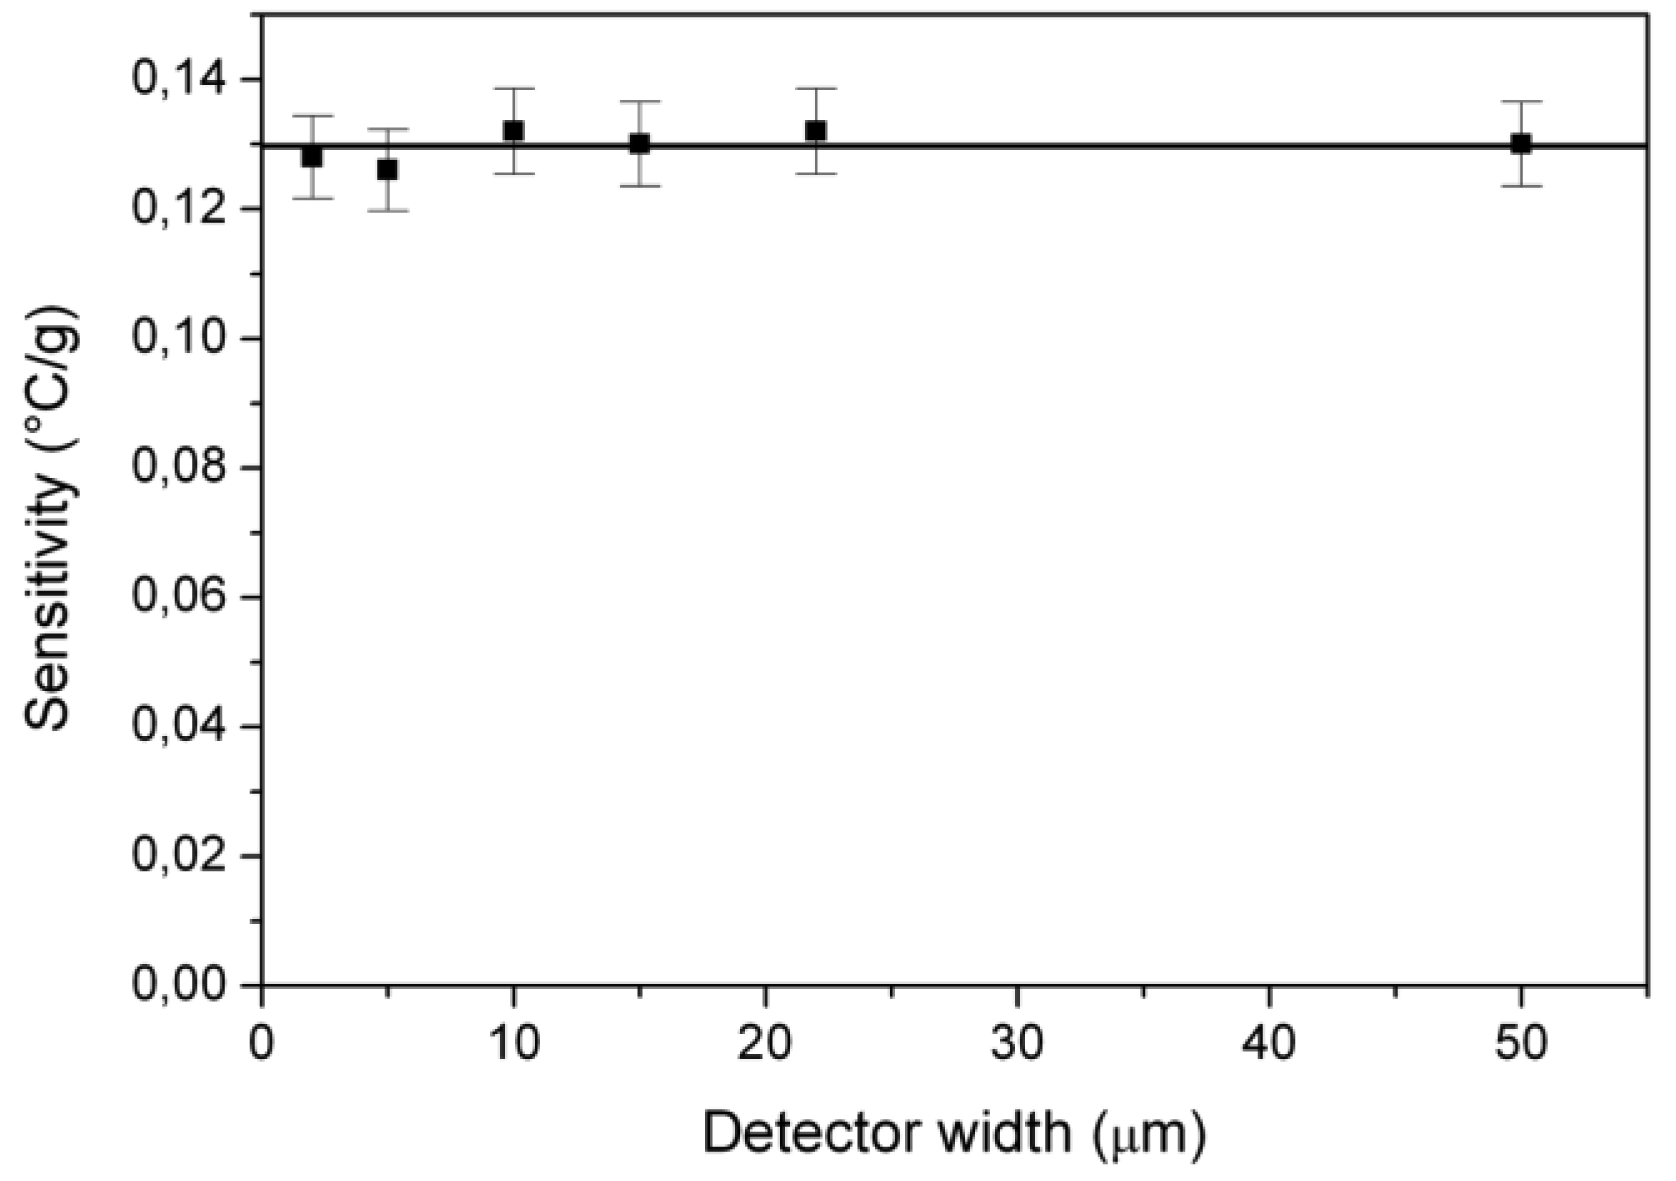
Even if the main objective is not to demonstrate the evolution of thermal sensitivity with detector width, we point out in Figure 6 that detector width does not influence the value of the accelerometer sensitivity G (°C/g).
5.2. Evolution of the Bandwidth with Detector Width
We can expect that the presence of the detector within the gas will influence the value of the frequency bandwidth of the sensor. Thus, in order to take this effect into account, we consider two first order systems, one after the other, to model the frequency response of the bubble and the detectors respectively. They have been implemented as two electrical RC circuits and simulated in order to obtain a value of frequency bandwidth.
The transfer function in dB is reiterated here:
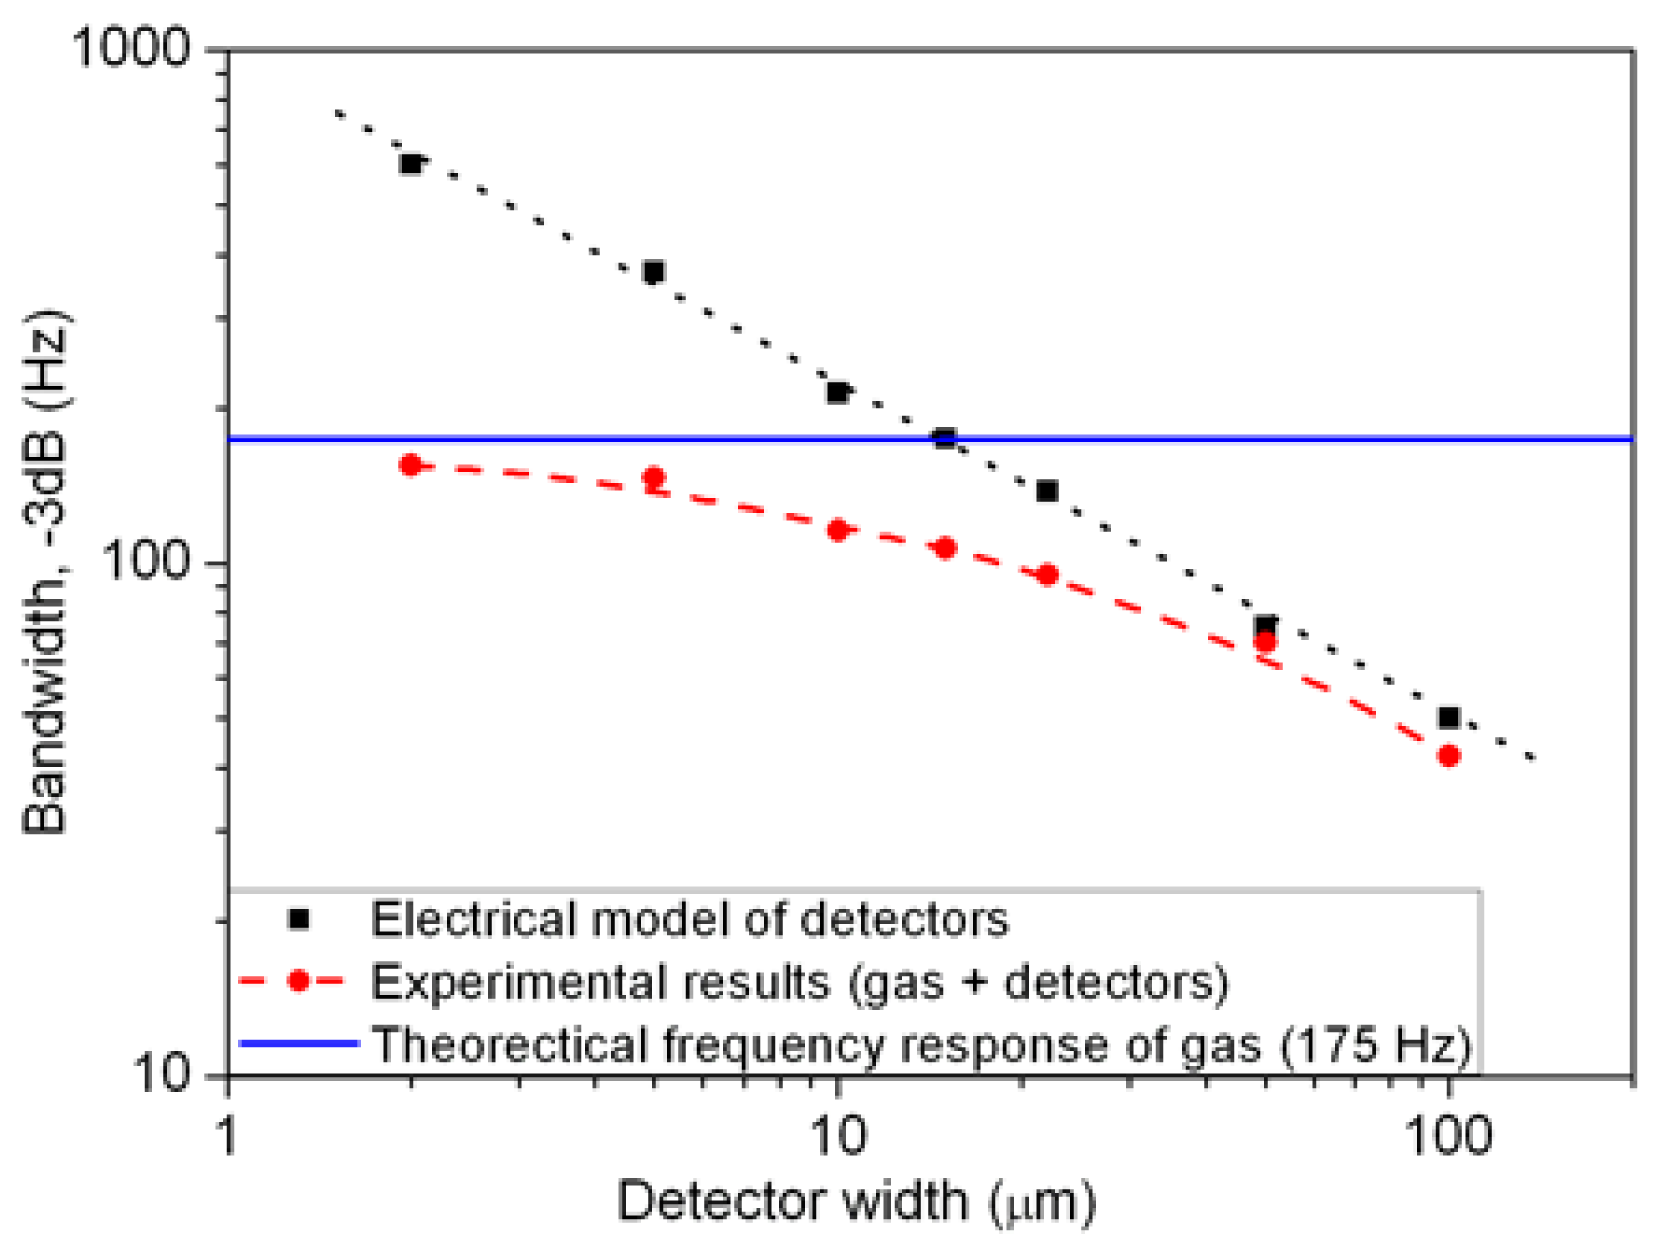
The bubble frequency response taken into account for fc,b has already been simulated and is equal to 175 Hz [9]. For each detector width, a cut-off frequency is extracted from electrical simulation in order to corroborate the experimental results. At the same time, electrical response time for each detector width is measured applying a step voltage. Response times found using this last method confirm the simulation values. In Figure 7, we represent both experimental measurements of the total frequency bandwidth at −3 dB (bubble + detector) also experimental values of bandwidth at −3 dB for different detector widths. This shows that the experimental evolution of the total frequency response is a function of the detector width, as predicted. It is important to note here that the global accelerometer response is both limited by the gas and detector cut-off frequencies' limit depending on detector width. This allows us to conclude that the response tends toward a first system order if the detector is lower than 2 μm and the global frequency bandwidth is then fixed by the gas. However, for larger detectors, global frequency bandwidth is limited by the detector itself.
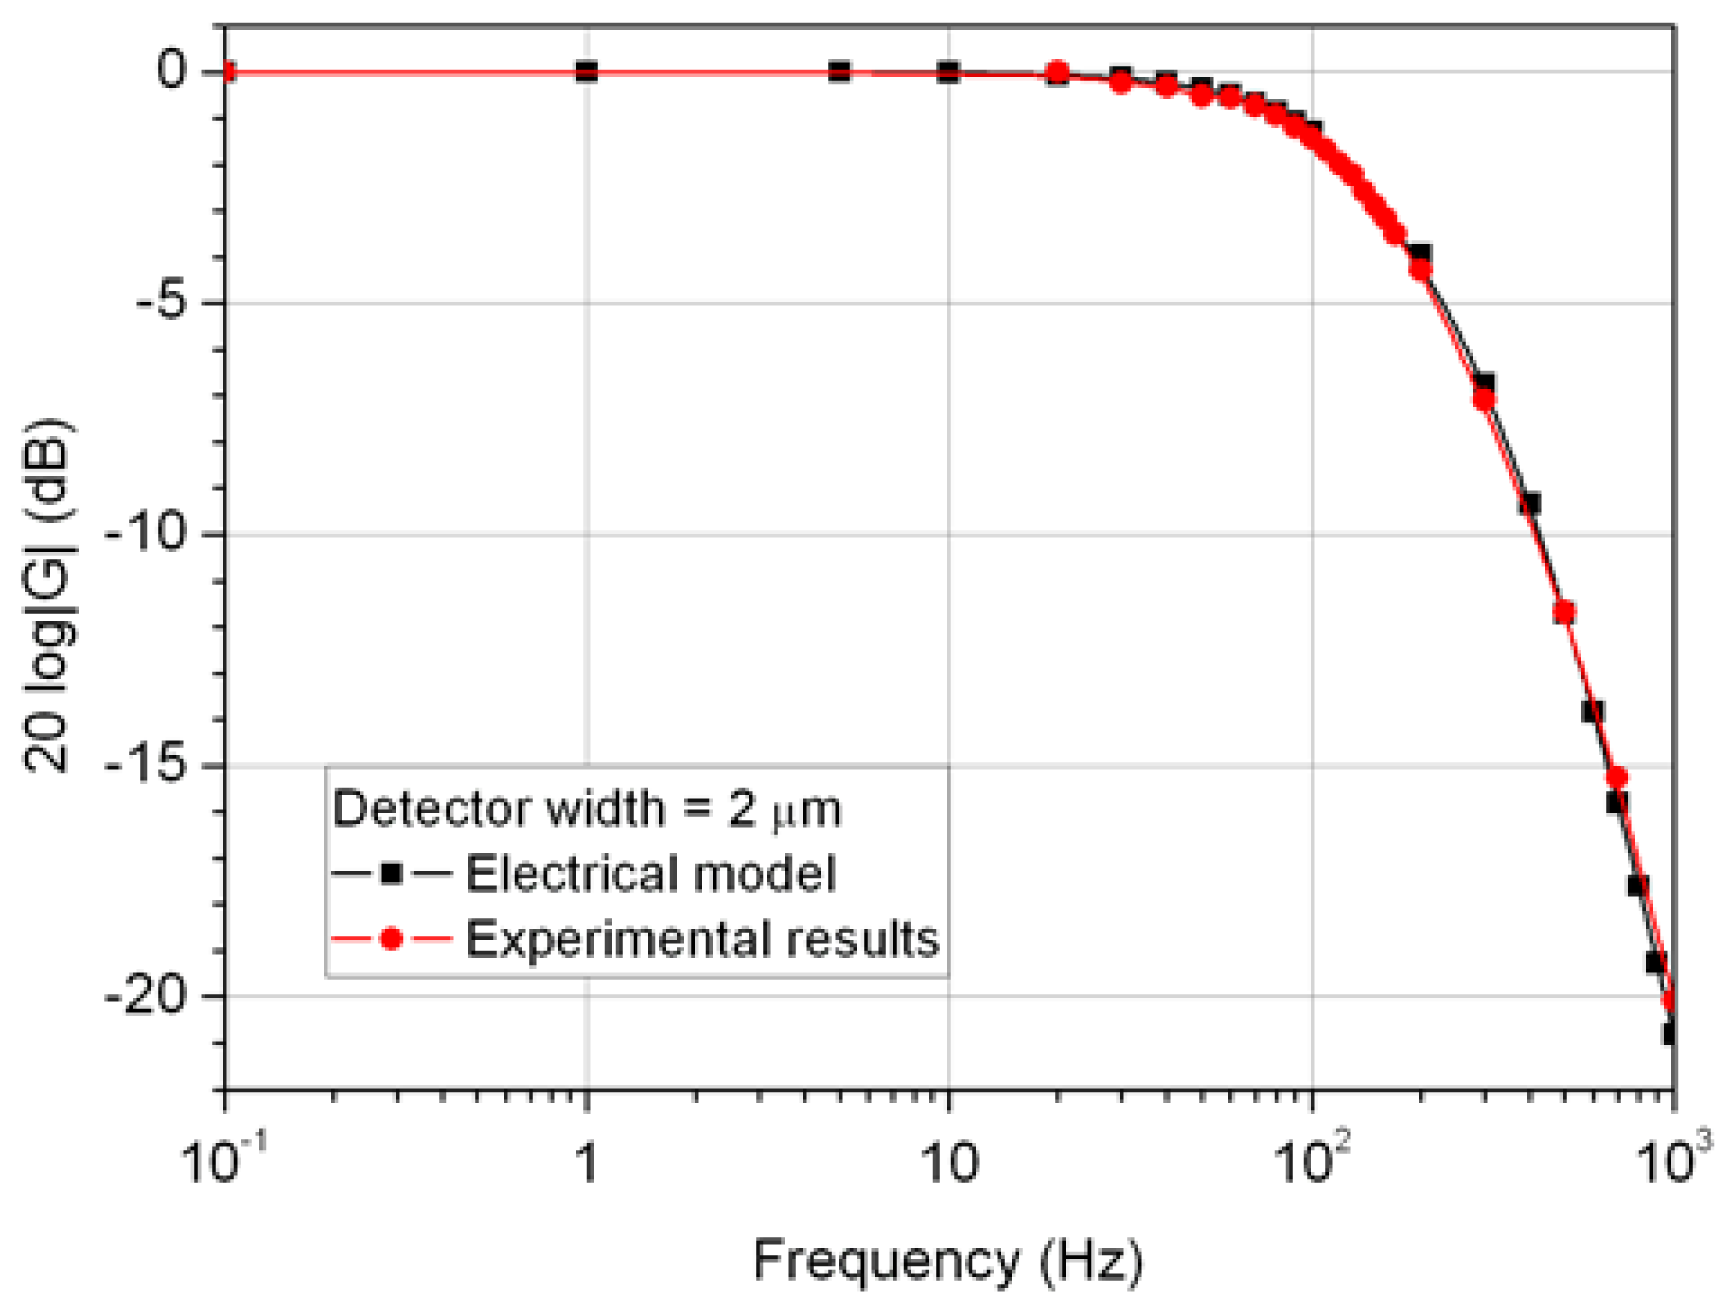
In Figure 8, the experimental response is compared to the one we obtained with the electrical model (9) assuming fc,b = 175 Hz, for a detector width equal to 2 μm. We can conclude that the experimental answer is in concordance with the simulated sensor frequency bandwidth at -3 dB.
As a conclusion, the frequency response of the sensor is an important characteristic and is a function of at least two phenomena. The first corresponds to the frequency response of gas under the acceleration inducing a temperature difference on the sensitive axis. The second corresponds to the frequency response of detector to a temperature variation in the gas. Therefore, the frequency response of the detector mainly depends on the detectors thermal resistance and its thermal capacitance.
5.3. Accuracy of the Different Models to Estimate Detector Bandwidth
We can extract a theoretical value of the detector cut-off frequency from the two models studied in Section 3, assuming that this value is inversely proportional to the product of the thermal resistance between the gas and the detector Rth with its thermal capacitance Cth, as done in (7) for cut-off frequency of gas.
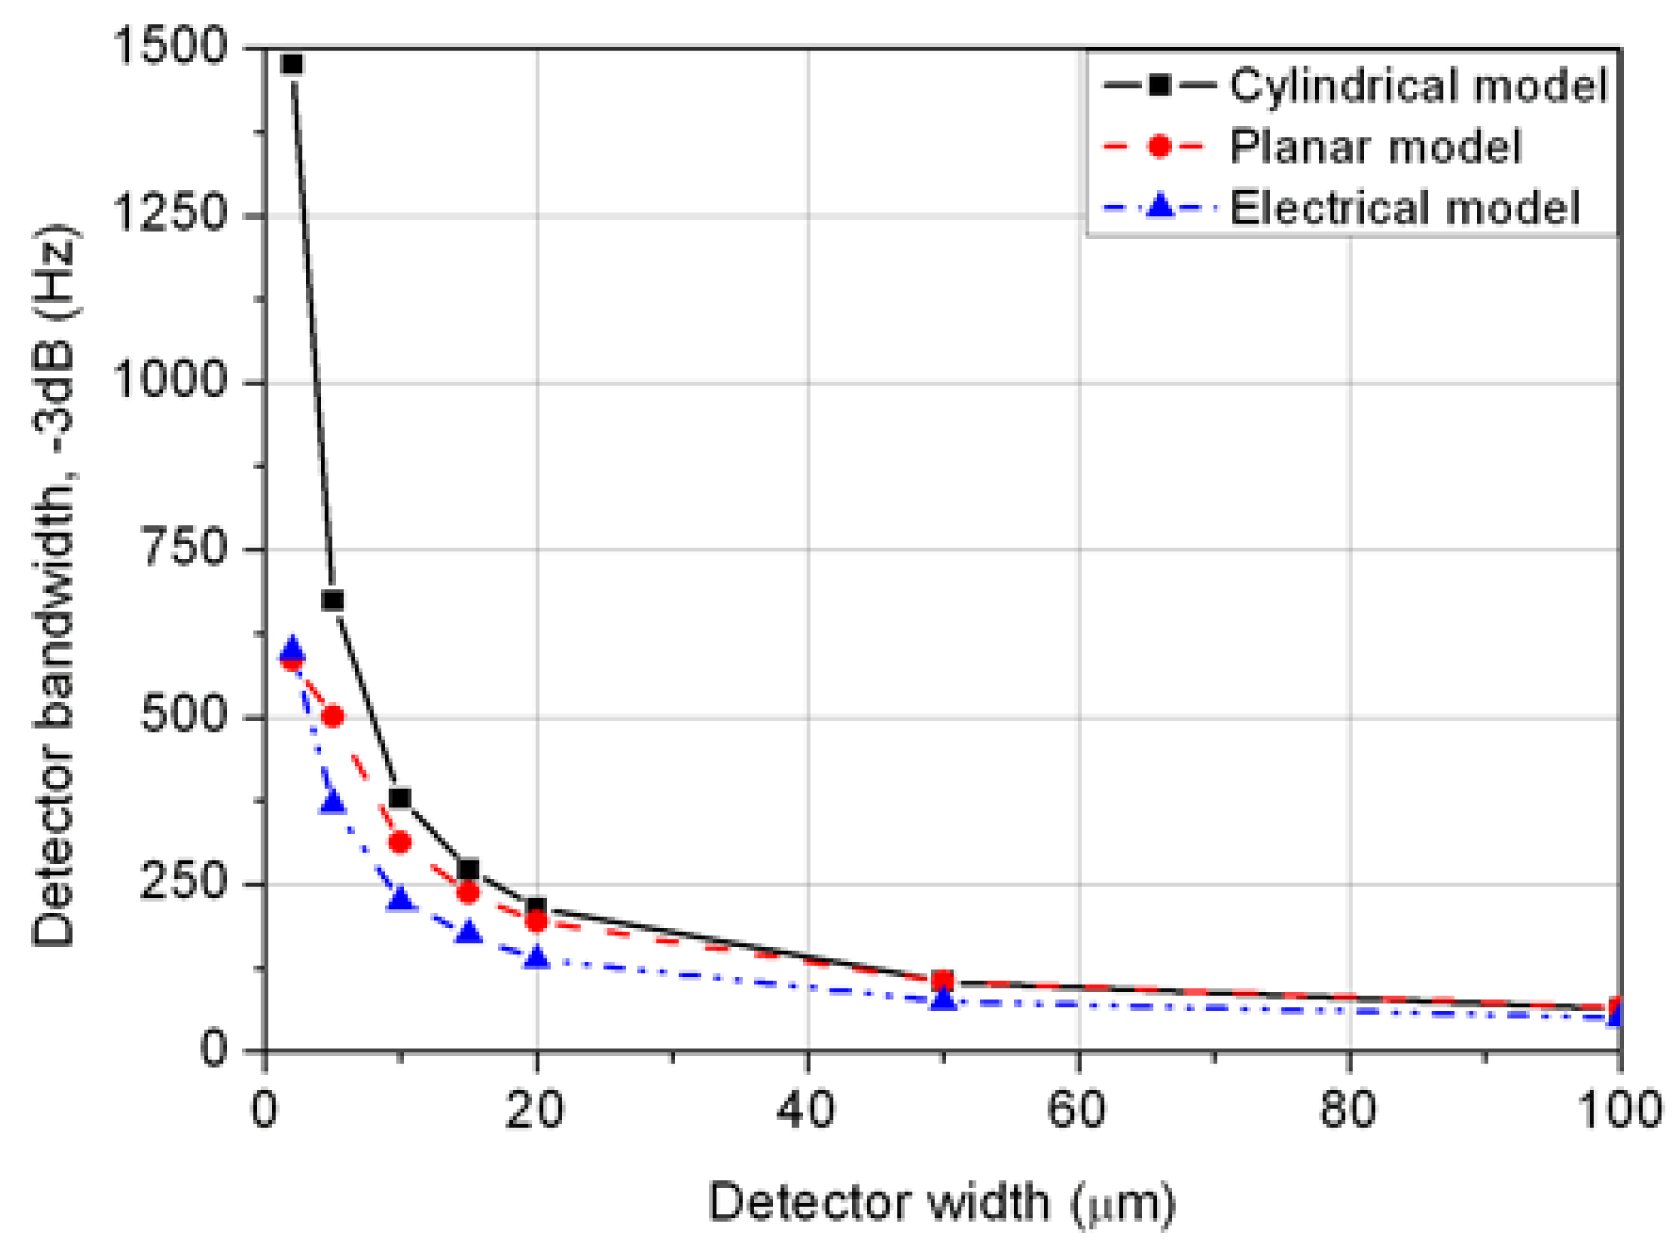
Using the three models, we finally obtain the frequency bandwidth behaviors given in Figure 9 for different detector widths. They allow us to opt for the two shape models, the one that best estimates cut-off frequency of detector given by electrical stimulation. Values obtained from the cylindrical model are less accurate than the ones obtained from the planar model. The values of the latter are close to those of the electrical model obtained from the experimental results. This is explained by a better agreement of the planar model with the detector shape.
We have seen that if the detector width becomes less than 10 μm for this cavity size, the system heads toward a first order circuit response. In such a case, it will only be the gas nature (see Section 4) and the gas pressure which will condition the bandwidth of the thermal accelerometer. In the next section, the influence of this last parameter on the global sensor response will be demonstrated.
6. Evolution of the Bandwidth with Gas Pressure
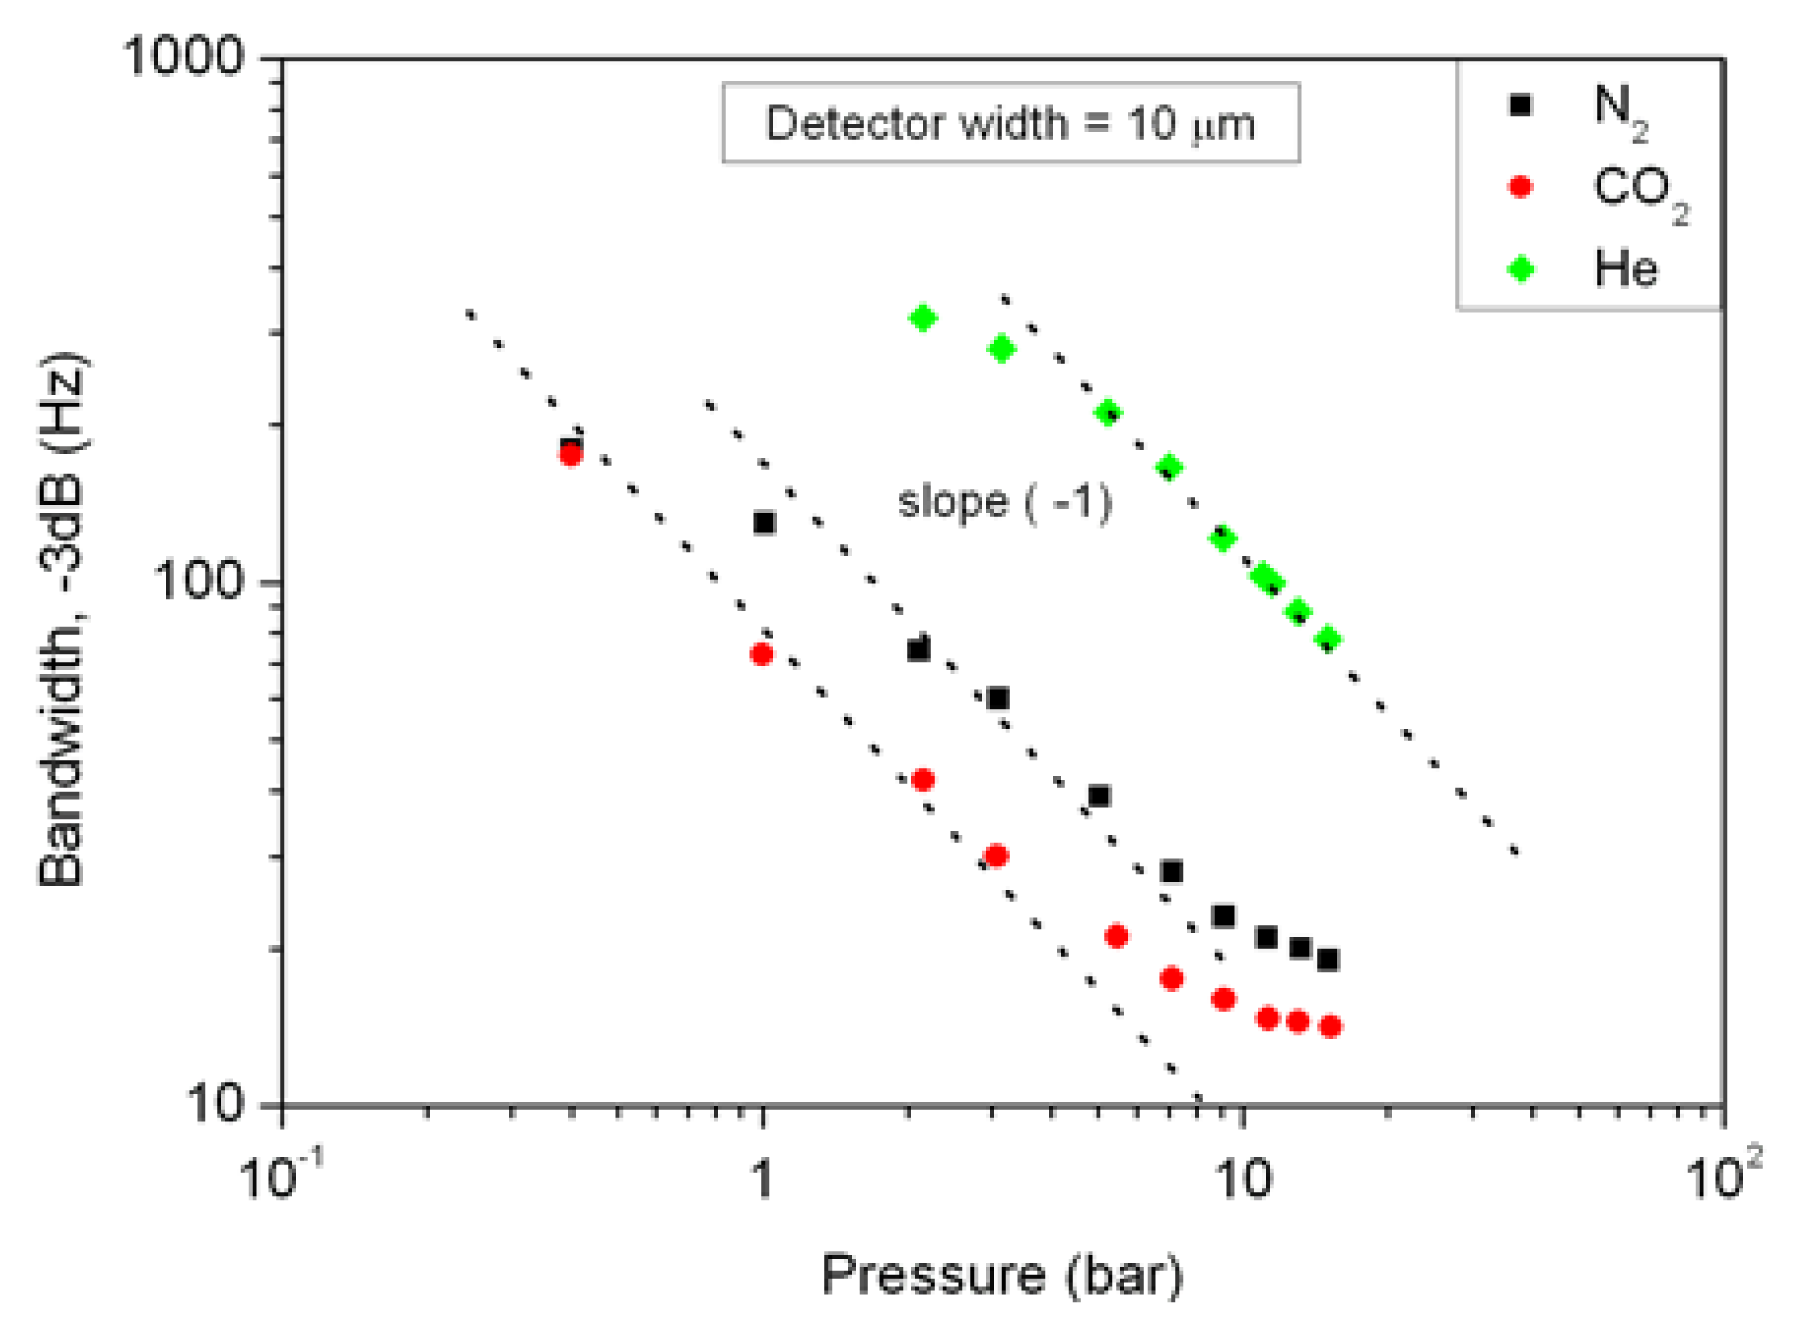
Concerning the bandwidth measurements as a function of the gas pressure, these have been done with an accelerometer which has the same size as given in Section 4 and a detector width equal to 10 μm.
With model (8) and thermal diffusivity expression equal to a = λ(ρ·CP,gas), the density of an ideal gas is quasi linearly proportional to the pressure, whereas thermal conductivity and specific heat present a very small variation with pressure increasing. Therefore this explains the fact that the bandwidth at −3 dB decreases as the pressure increases, and the curve slope n is close to minus one with a log-log scale as is verified in Figure 10.
We noticed that all experimental results present a similar behavior law with a curve slope n equal to minus one in a log-log scale when the pressure of nitrogen, carbon dioxide or helium gas increases, for a detector width of 10 μm. Saturation at lower and higher pressure can be explained by the response time of the detector not becoming negligible compared to the gas bubble. Moreover we assume that the heater temperature rise and the propagation of the gradient shape are both modified at a higher pressure.
7. Evolution of the Bandwidth with Temperature Variation
The following measurements have been made with a typical-dimension sensor as defined in Section 6 in an air gas environment.
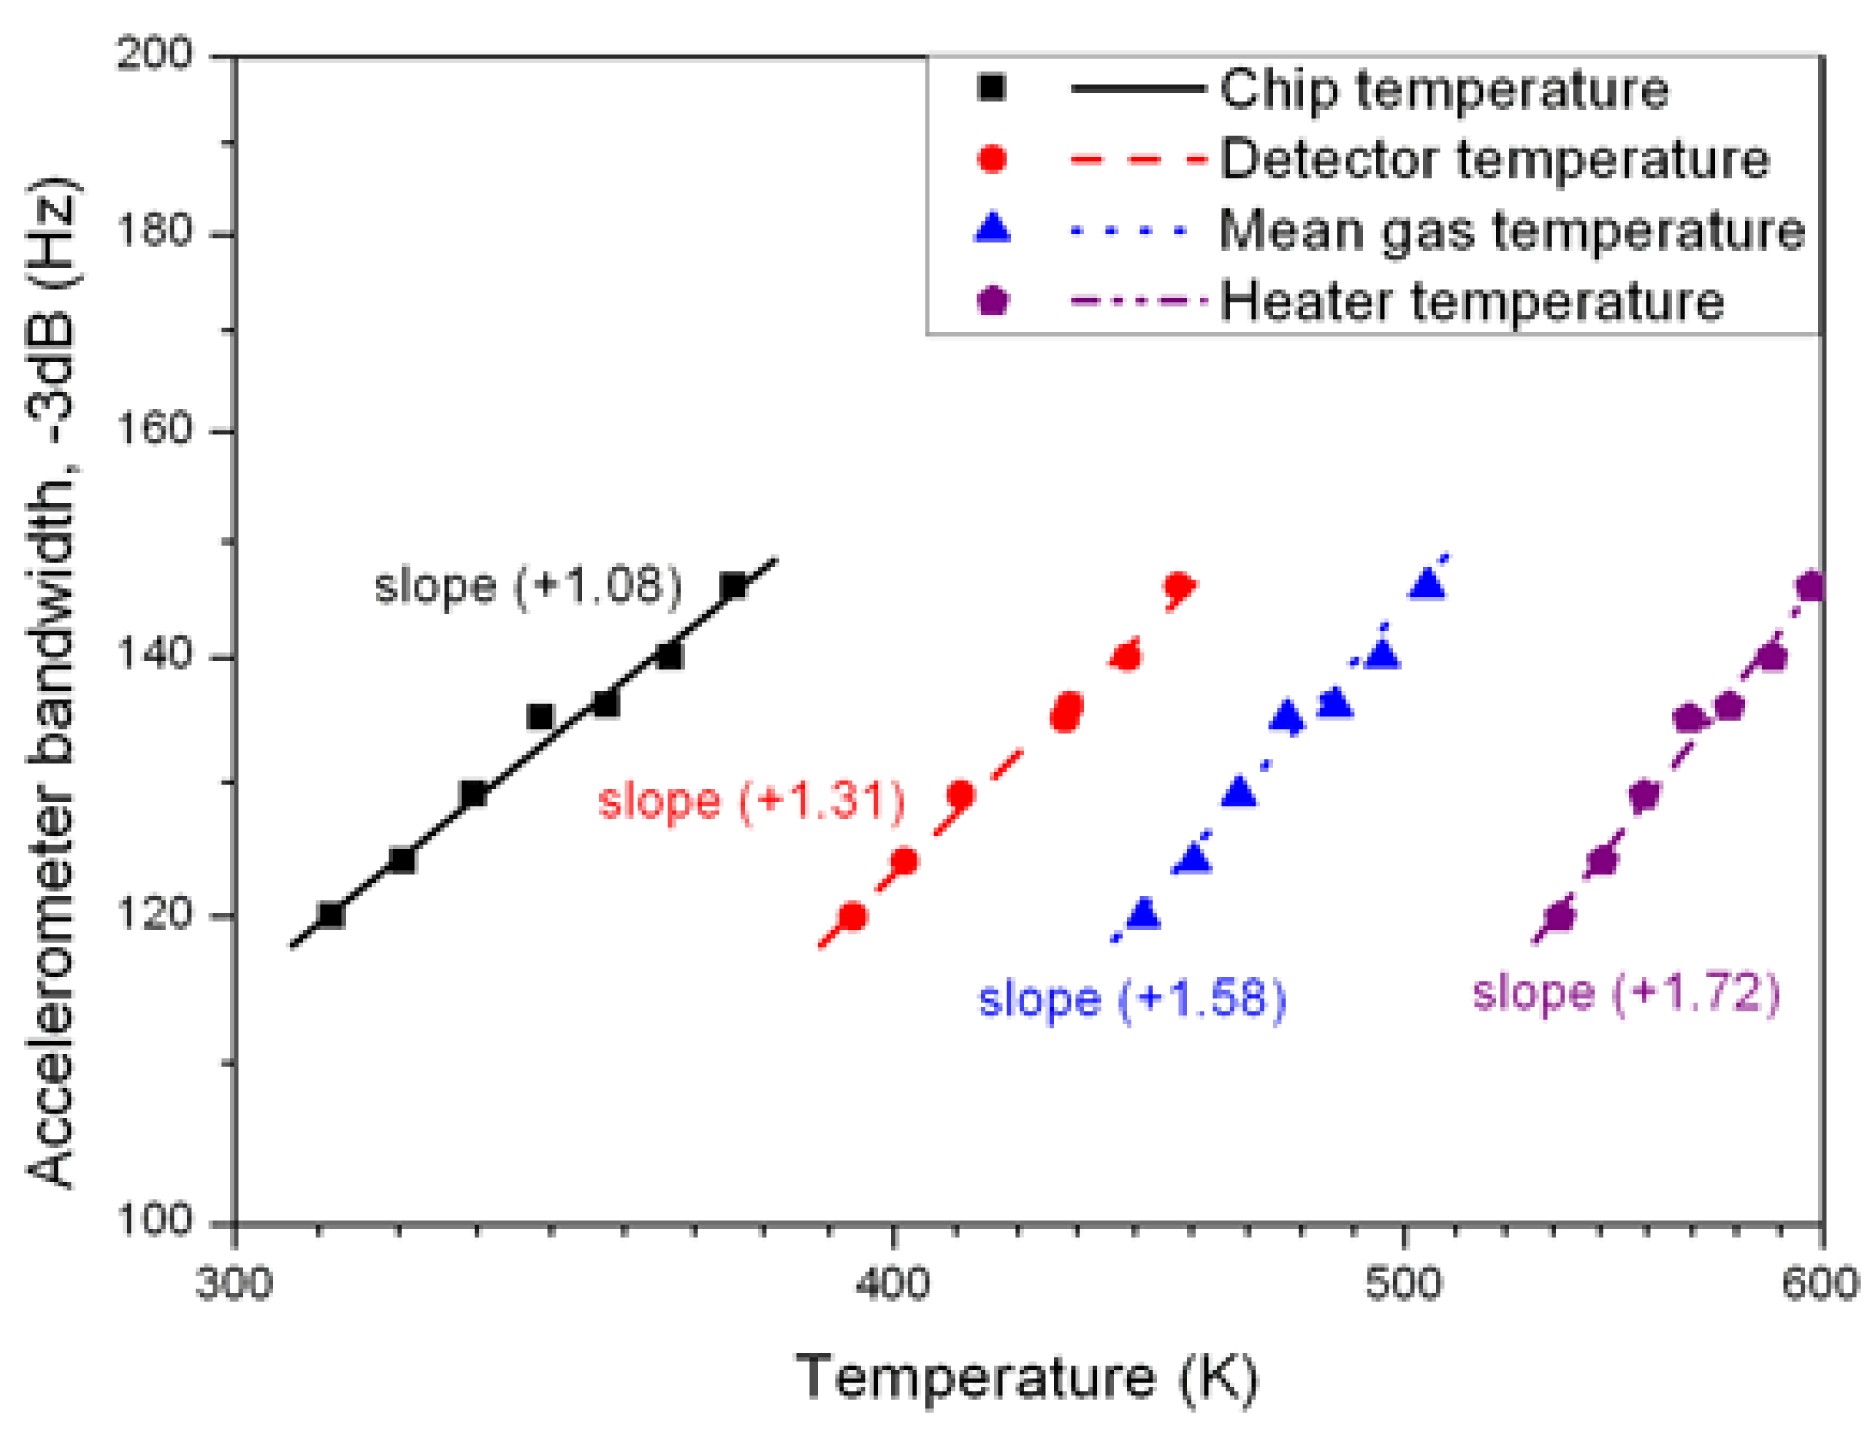
As mentioned in (8), cut-off frequency is a function of gas diffusivity a. This moves in temperature as T1.62 does for air [12]. Nevertheless, the temperature of gas contained in the cavity is not uniform, as described in Figure 1. Experimentally, temperature can only be measured at three points: Substrate, detector and heater. In order to obtain an estimation of the mean gas temperature, temperature profile has been analytically calculated, using a two-heated-concentric-circular-cylinder model as proposed in Section 3.2.1 [13].
Inducing a variation of external temperatures, the gas temperature was modified, as were detectors and the heater. In each case, bandwidth was estimated and results are reported in Figure 11 as a function of the substrate, detector and heater temperatures for the experimentally obtained values, and as a function of the calculated mean gas temperature. Bandwidth, as a function of the latter, moves as T1.58, value close to air thermal diffusivity behavior, T1.62.
8. Conclusion
These studies essentially investigate the bandwidth of a thermal accelerometer based on thermal exchange. The sensor was micromachined by using micro-electronics techniques. The response of the sensor has been modeled and experimentally investigated as a function of detector width and gas nature and pressure. The cylindrical and planar model results completed with an equivalent electrical circuit simulation have shown a good accordance with experimental results. This theoretical model has shown the variation of gas frequency response with a good accordance to the experimental results and shed light on the influence of the detectors on the global frequency response of the sensor. Finally, a frequency bandwidth at −3 dB of 320 Hz has been experimentally measured for a given cavity dimension for Helium gas at 2.15 bar.


Acknowledgments
The authors would like to sincerely acknowledge the work of MM J. Lyonnet, J.M. Peiris and F. Pichot for their technical assistance.
References
- Fraden, J. Handbook of Modern Sensors: Physics, Designs, and Applications; American Institute of Physics: Woodbury, NY, USA, 1997. [Google Scholar]
- Dauderstädt, U.A.; de Vries, P.H.S.; Hiratsuka, R.; Sarro, P.M. Silicon accelerometer based on thermopiles. Sens. Actuat. A 1995, 46, 201–204. [Google Scholar]
- Leung, A.M.; Jones, J.; Czyzewska, E.; Chen, J.; Pascal, M. Micromachined accelerometer with no proof mass. Proceedings of the Technical Digest of International Electron Device Meeting (IEDM'97), Washington, DC, USA, 10 December 1997; pp. 899–902.
- Milanović, V.; Bowen, E.; Zaghloul, M.E.; Tea, N.H.; Suehle, J.S.; Payne, B.; Gaitan, M. Micromachined convective accelerometers in standard integrated circuits technology. Appl. Phys. Lett. 2000, 76, 508–509. [Google Scholar]
- Mailly, F.; Giani, A.; Martinez, A.; Bonnot, R.; Temple-Boyer, P.; Boyer, A. Micromachined thermal accelerometer. Sens. Actuat. A 2003, 103, 359–363. [Google Scholar]
- Leung, A.M.; Jones, J.; Czyzewska, E.; Chen, J.; Woods, B. Micromachined accelerometer based on convection heat transfer. Proceedings of the IEEE MEMS'98, Heidelberg, Germany, 25–29 January 1998; pp. 627–630.
- Goustouridis, D.; Kalstas, G.; Nassiopoulou, A. A silicon thermal accelerometer without solid proof mass using porous silicon thermal isolation. IEEE Sens. J. 2007, 7, 983–989. [Google Scholar]
- Luo, X.B.; Yang, Y.J.; Zheng, F.; Li, Z.X.; Guo, Z.Y. An optimized micromachined convective accelerometer with no proof mass. J. Michromech. Microeng. 2001, 11, 504–508. [Google Scholar]
- Courteaud, J.; Crespy, N.; Combette, P.; Sorli, B.; Giani, A. Studies and optimization of the frequency response of a micromachined thermal accelerometer. Sens. Actuat. A 2008, 147, 75–82. [Google Scholar]
- Temple-Boyer, P.; Rossi, C.; Saint-Etienne, E.; Scheid, E. Residual stress in low pressure chemical vapor deposition SiNx films deposited from silane and ammonia. J. Vac. Sci. Technol. A 1998, 16, 2003–2007. [Google Scholar]
- Eyglunent, B. Manuel De Thermique: Théorie Et Pratique, 2nd ed.; Hermes Sciences Publicat: Paris, France, 1997. [Google Scholar]
- Thermophysical Properties of Fluid Systems. Available online: http://webbook.nist.gov/chemistry/fluid (accessed on 11 May 2011).
- Hodnett, P. Natural convection between horizontal heated concentric circular cylinders. J. Appl. Math. Phys. 1973, 24, 507–516. [Google Scholar]
© 2011 by the authors; licensee MDPI, Basel, Switzerland. This article is an open access article distributed under the terms and conditions of the Creative Commons Attribution license (http://creativecommons.org/licenses/by/3.0/).
Share and Cite
Garraud, A.; Combette, P.; Courteaud, J.; Giani, A. Effect of the Detector Width and Gas Pressure on the Frequency Response of a Micromachined Thermal Accelerometer. Micromachines 2011, 2, 167-178. https://doi.org/10.3390/mi2020167
Garraud A, Combette P, Courteaud J, Giani A. Effect of the Detector Width and Gas Pressure on the Frequency Response of a Micromachined Thermal Accelerometer. Micromachines. 2011; 2(2):167-178. https://doi.org/10.3390/mi2020167
Chicago/Turabian StyleGarraud, Alexandra, Philippe Combette, Johann Courteaud, and Alain Giani. 2011. "Effect of the Detector Width and Gas Pressure on the Frequency Response of a Micromachined Thermal Accelerometer" Micromachines 2, no. 2: 167-178. https://doi.org/10.3390/mi2020167