
Glutathione Transferases Responses Induced by Microcystin-LR in the Gills and Hepatopancreas of the Clam Venerupis philippinarum

 and
and
Abstract
:1. Introduction
2. Results
2.1. Enzyme Activity
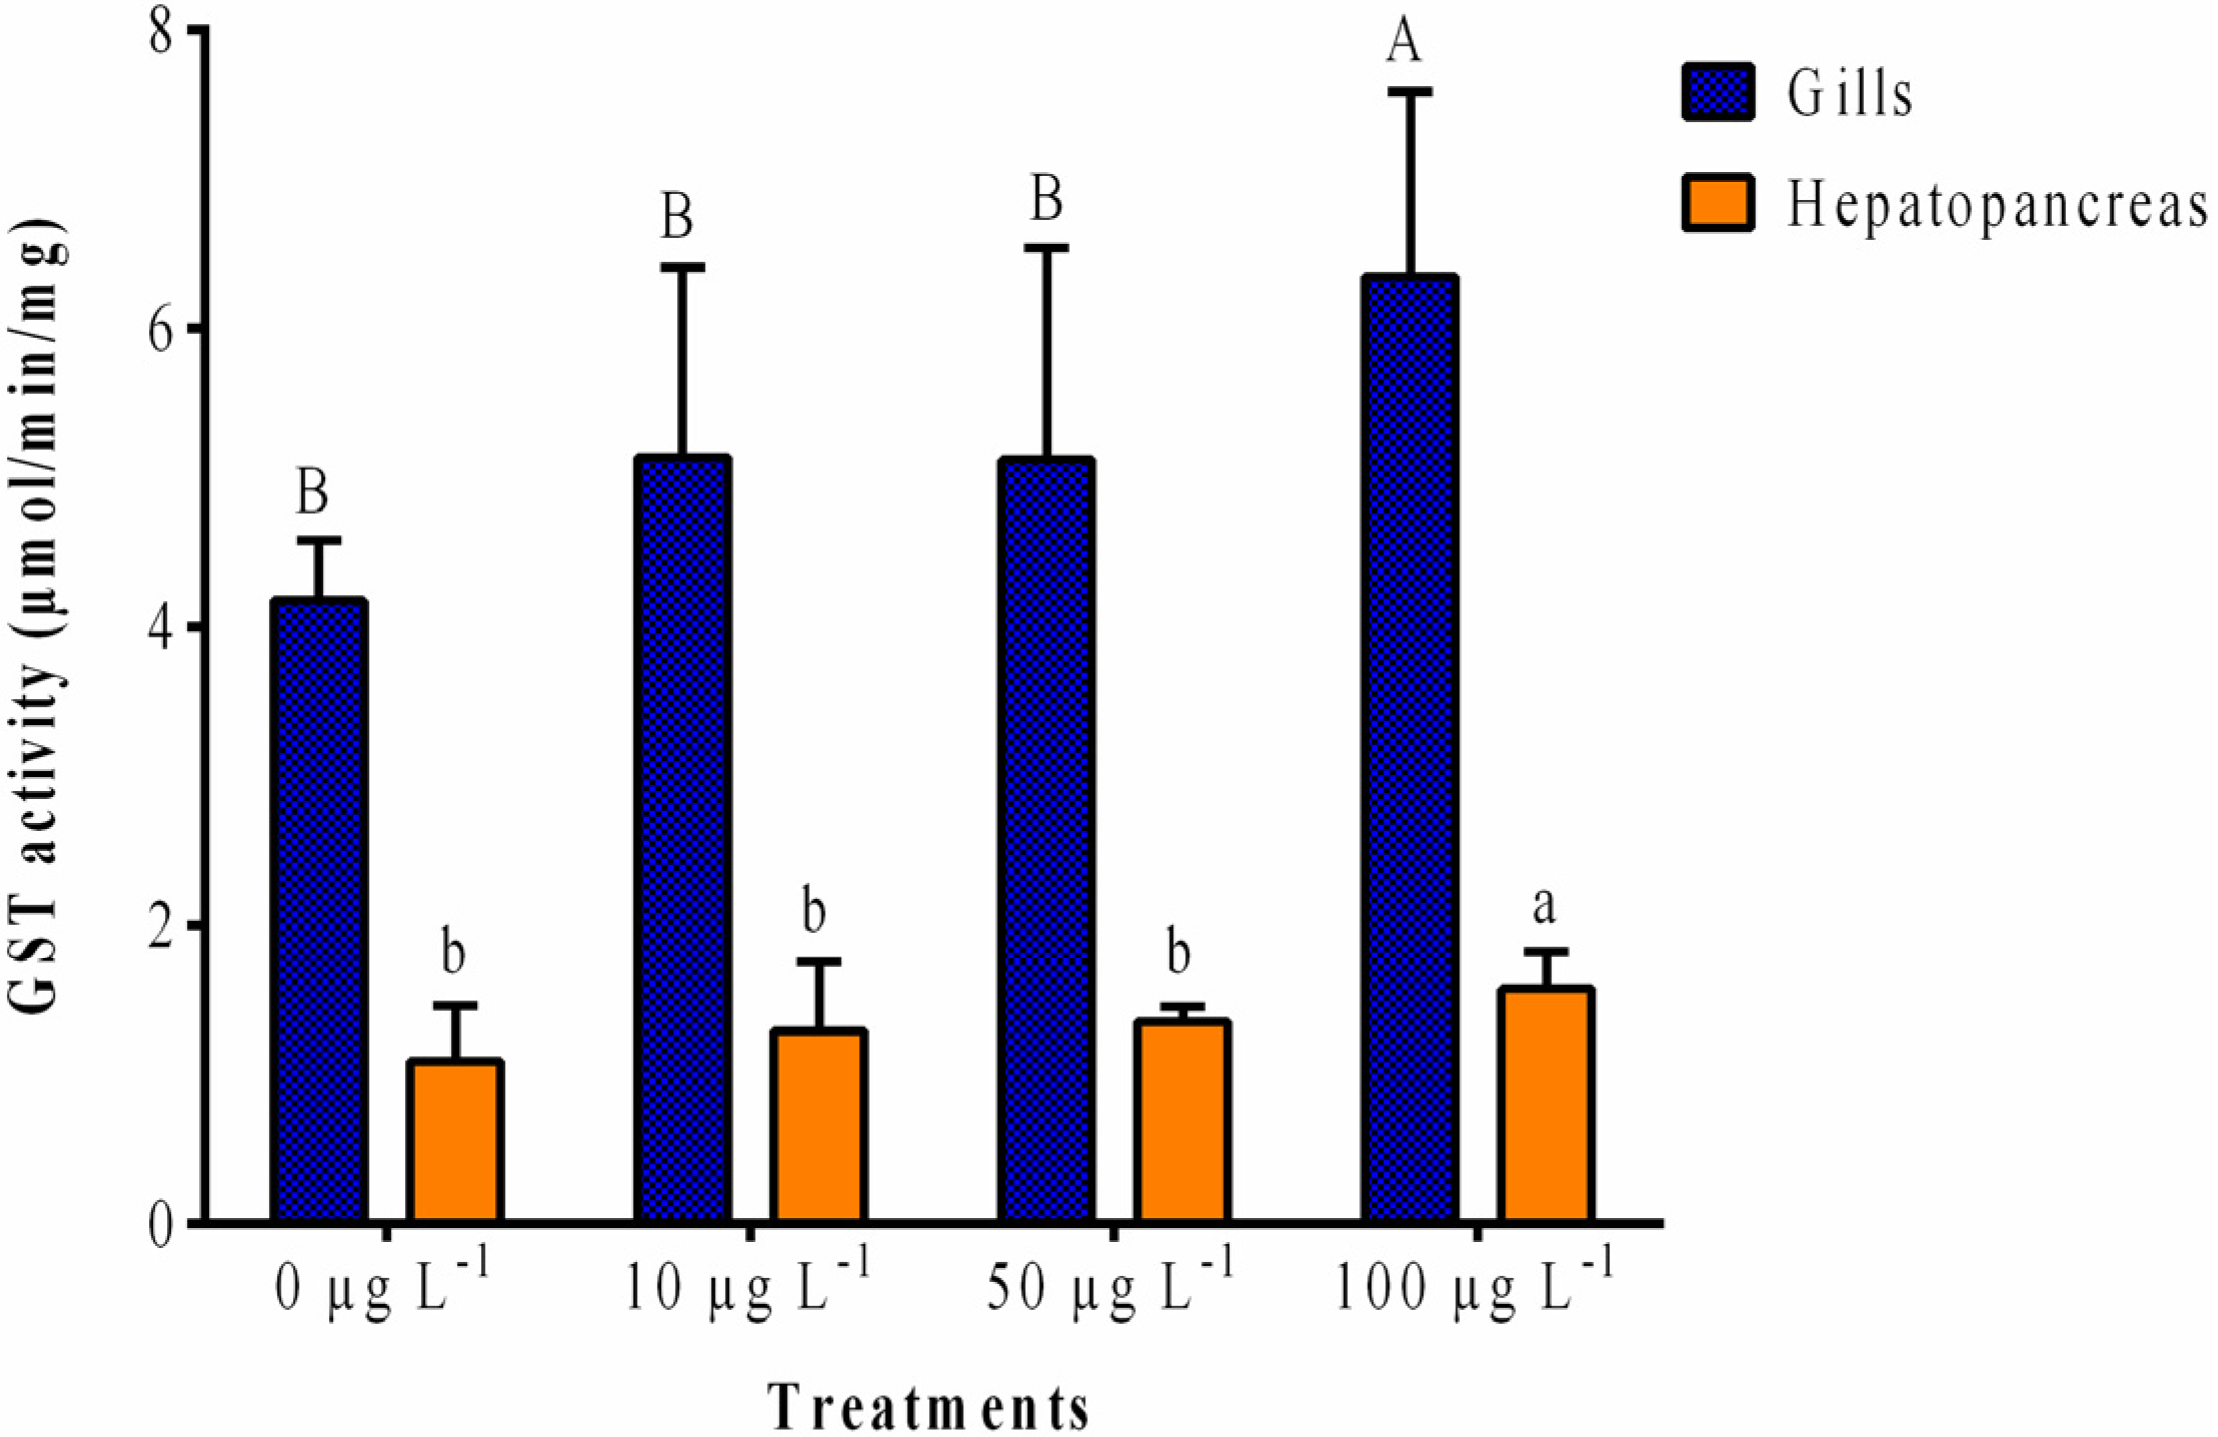
2.1.1. GST Activity

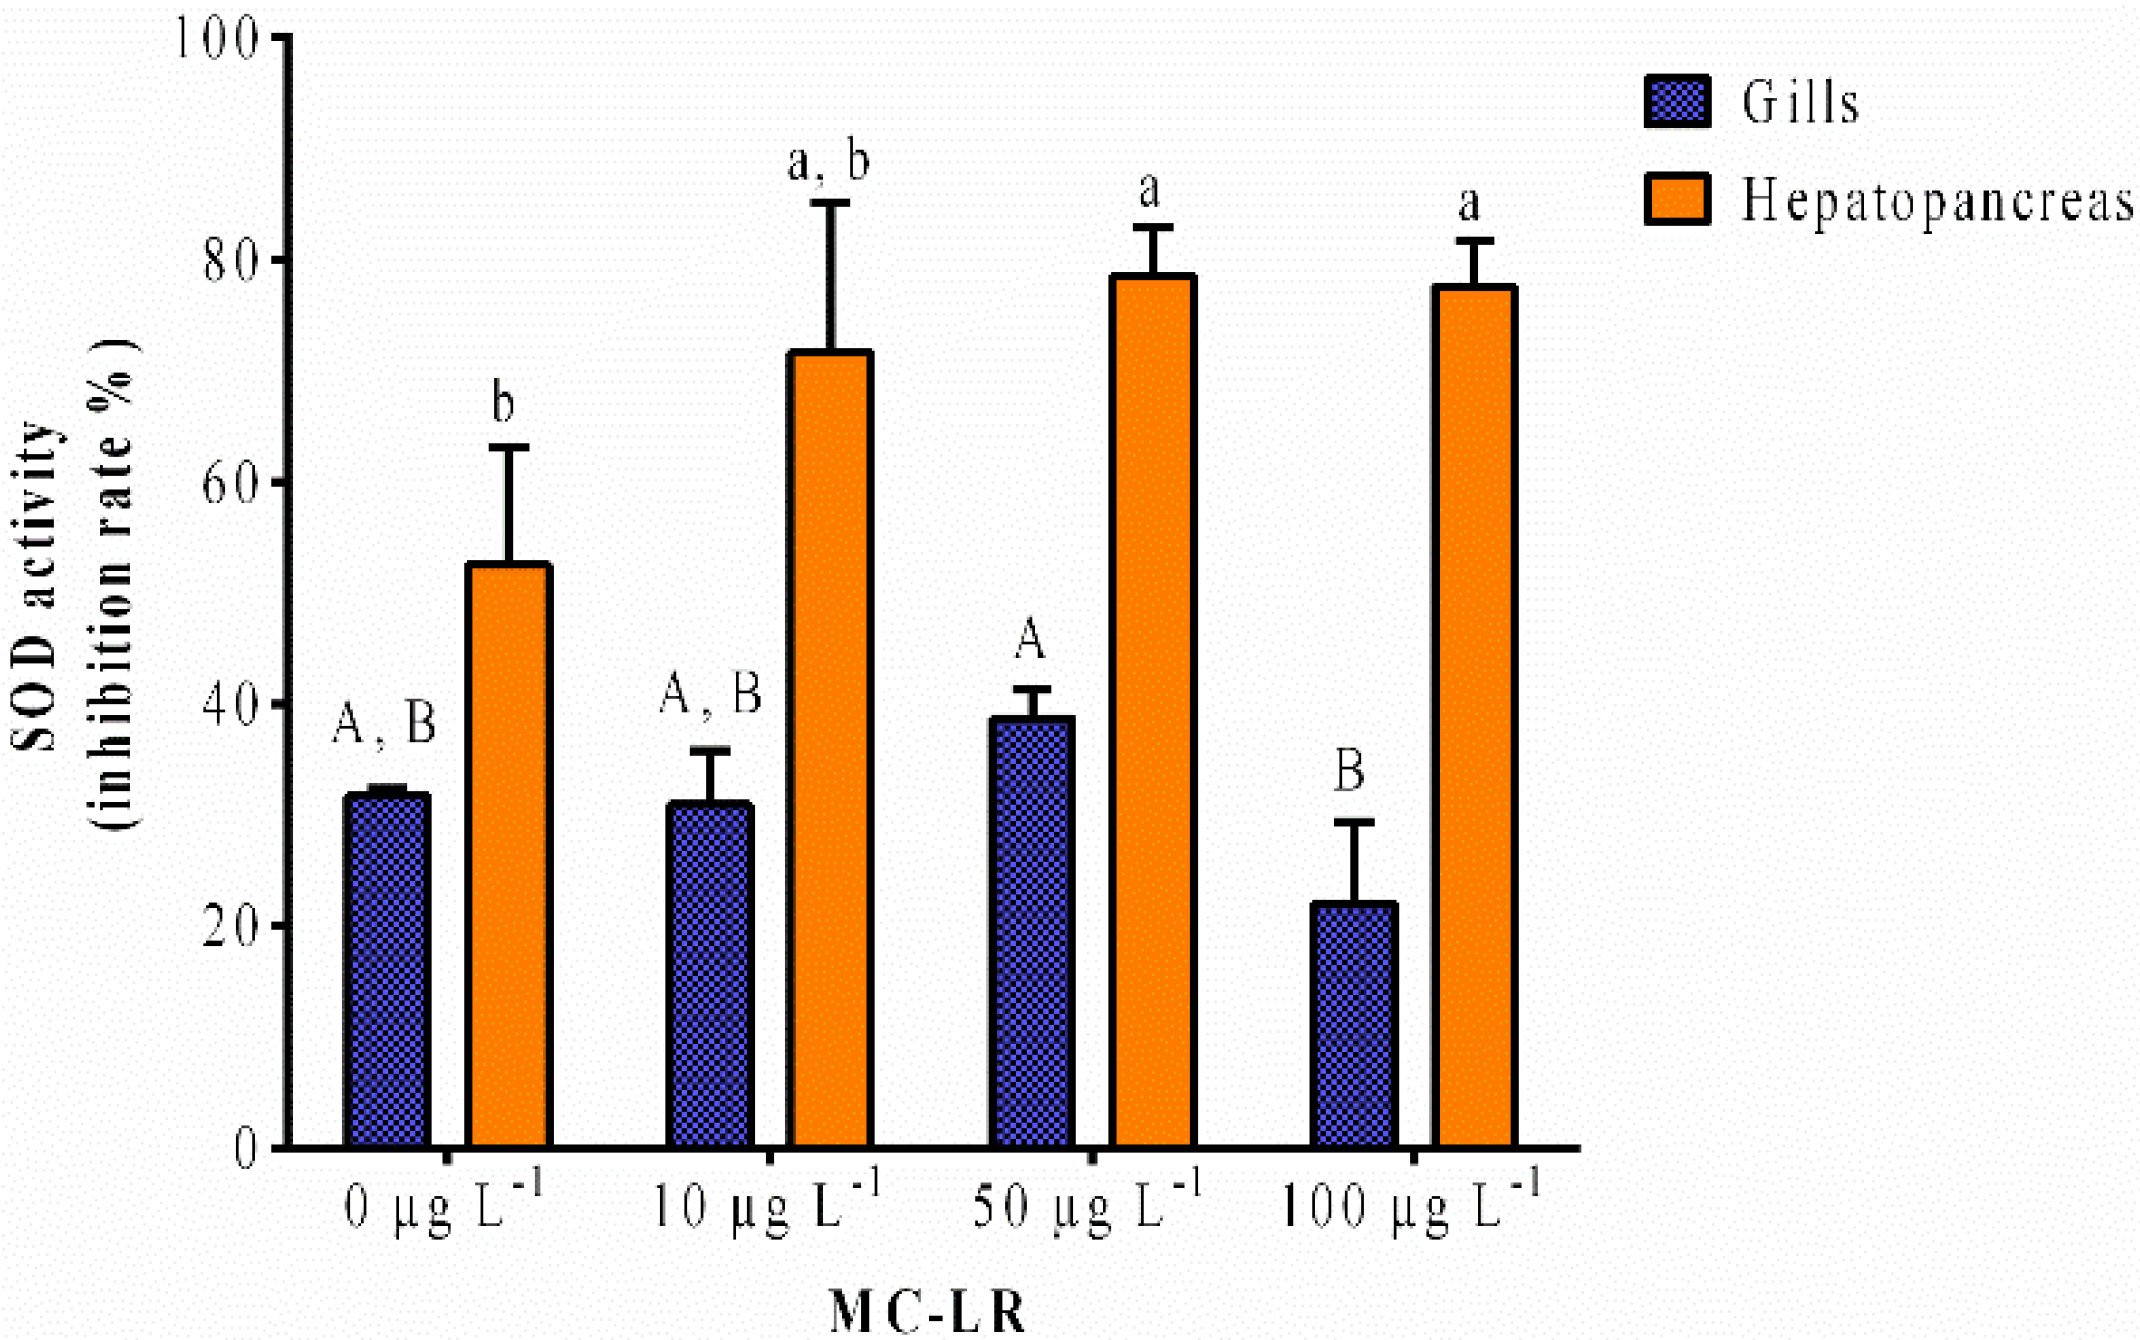
2.1.2. SOD Activity

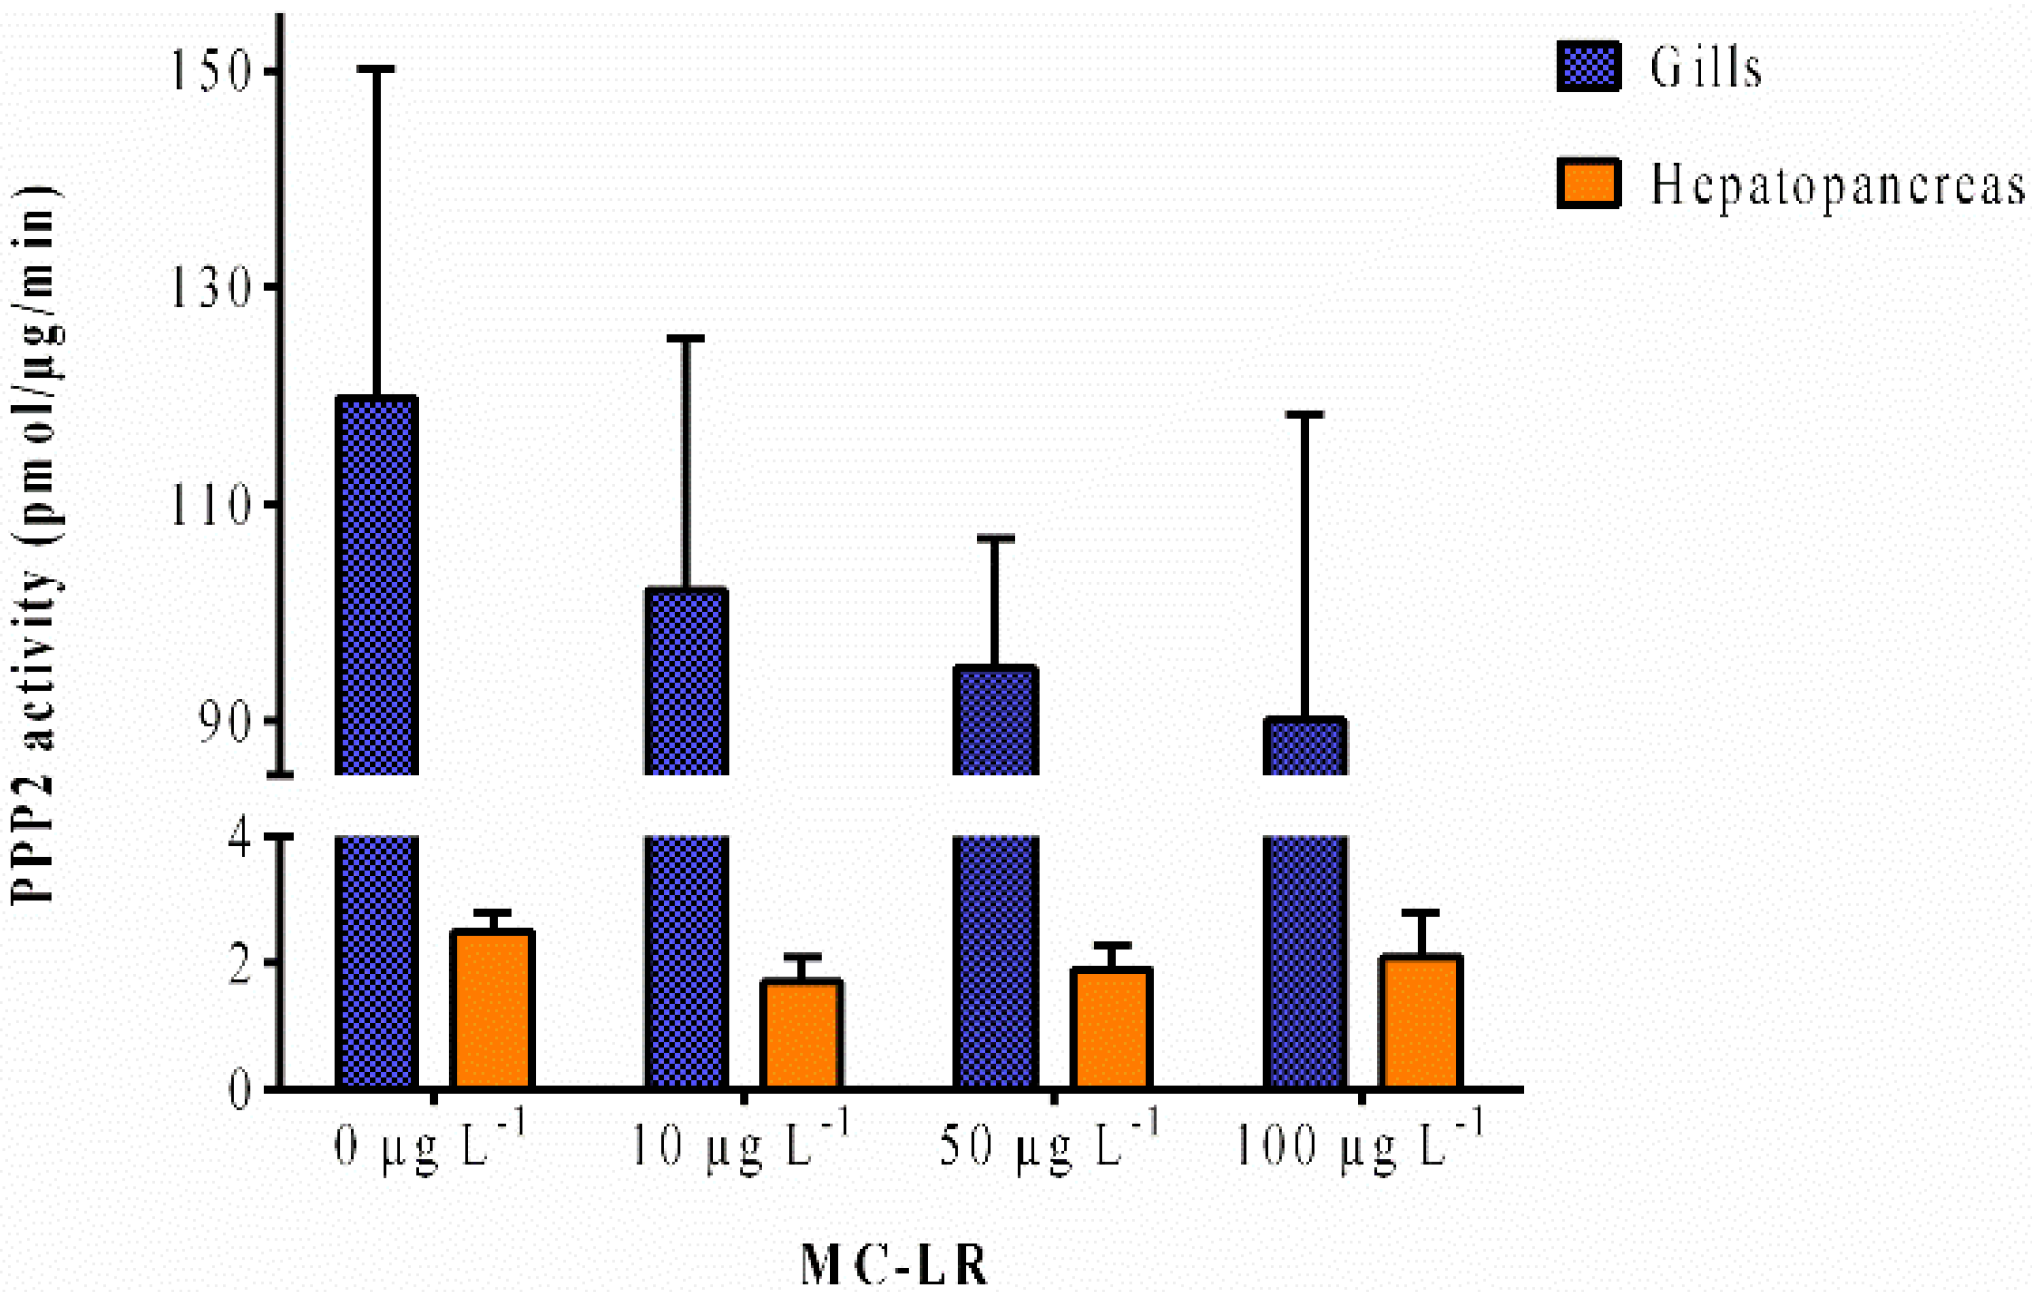
2.1.3. PPP2 Activity

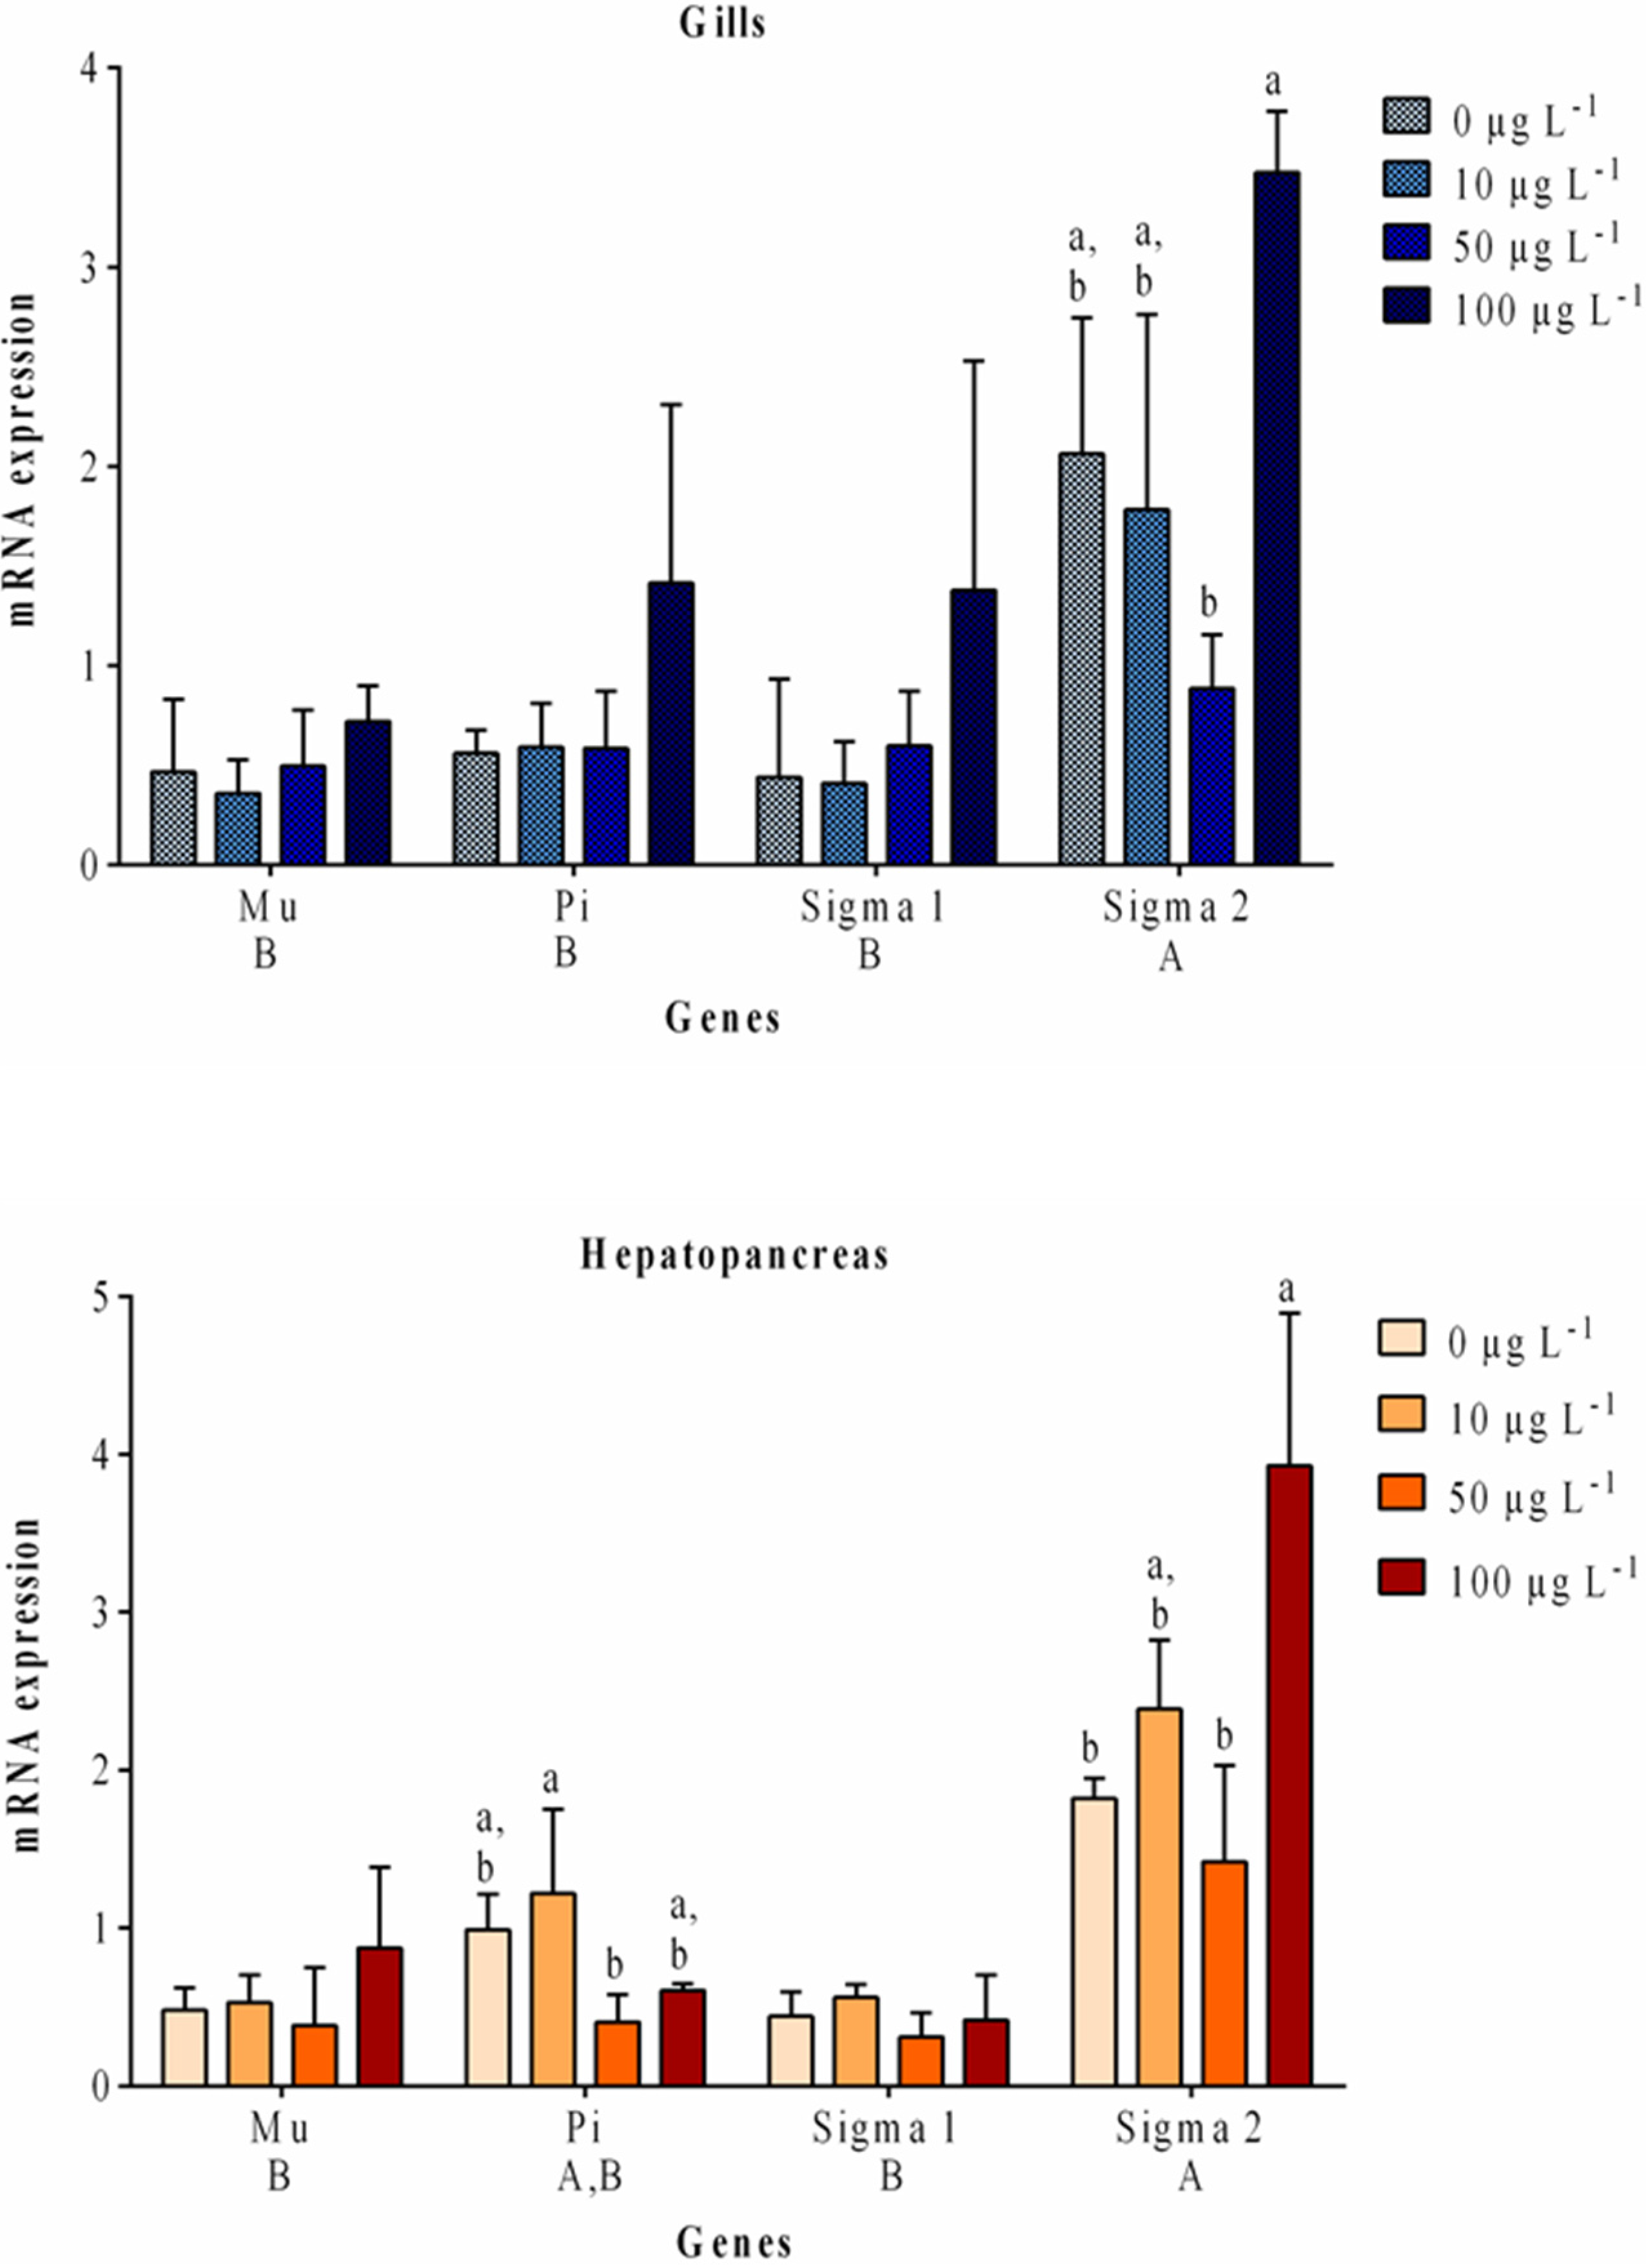
2.2. Gene Expression

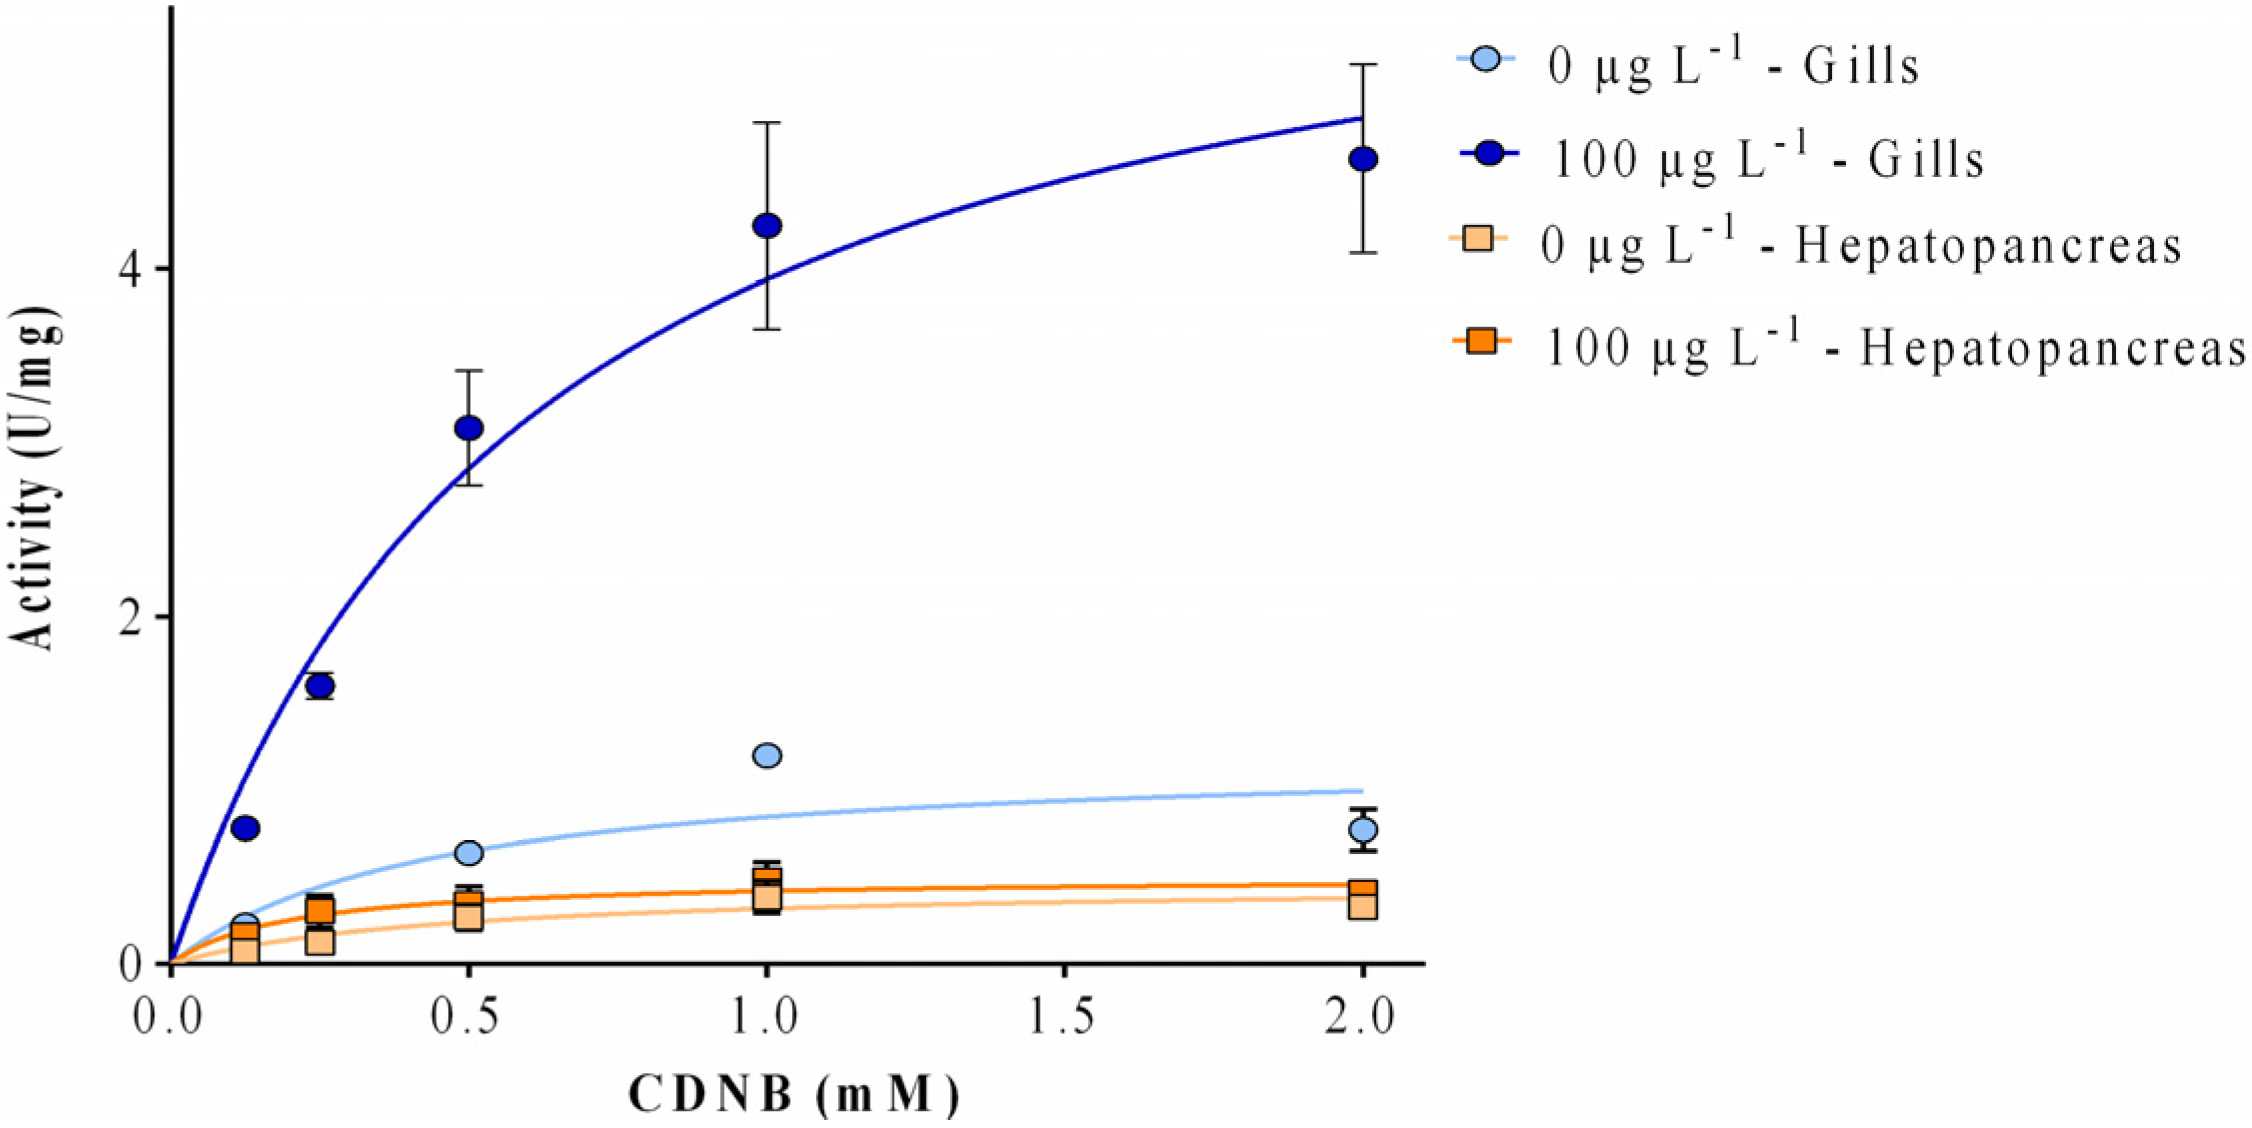
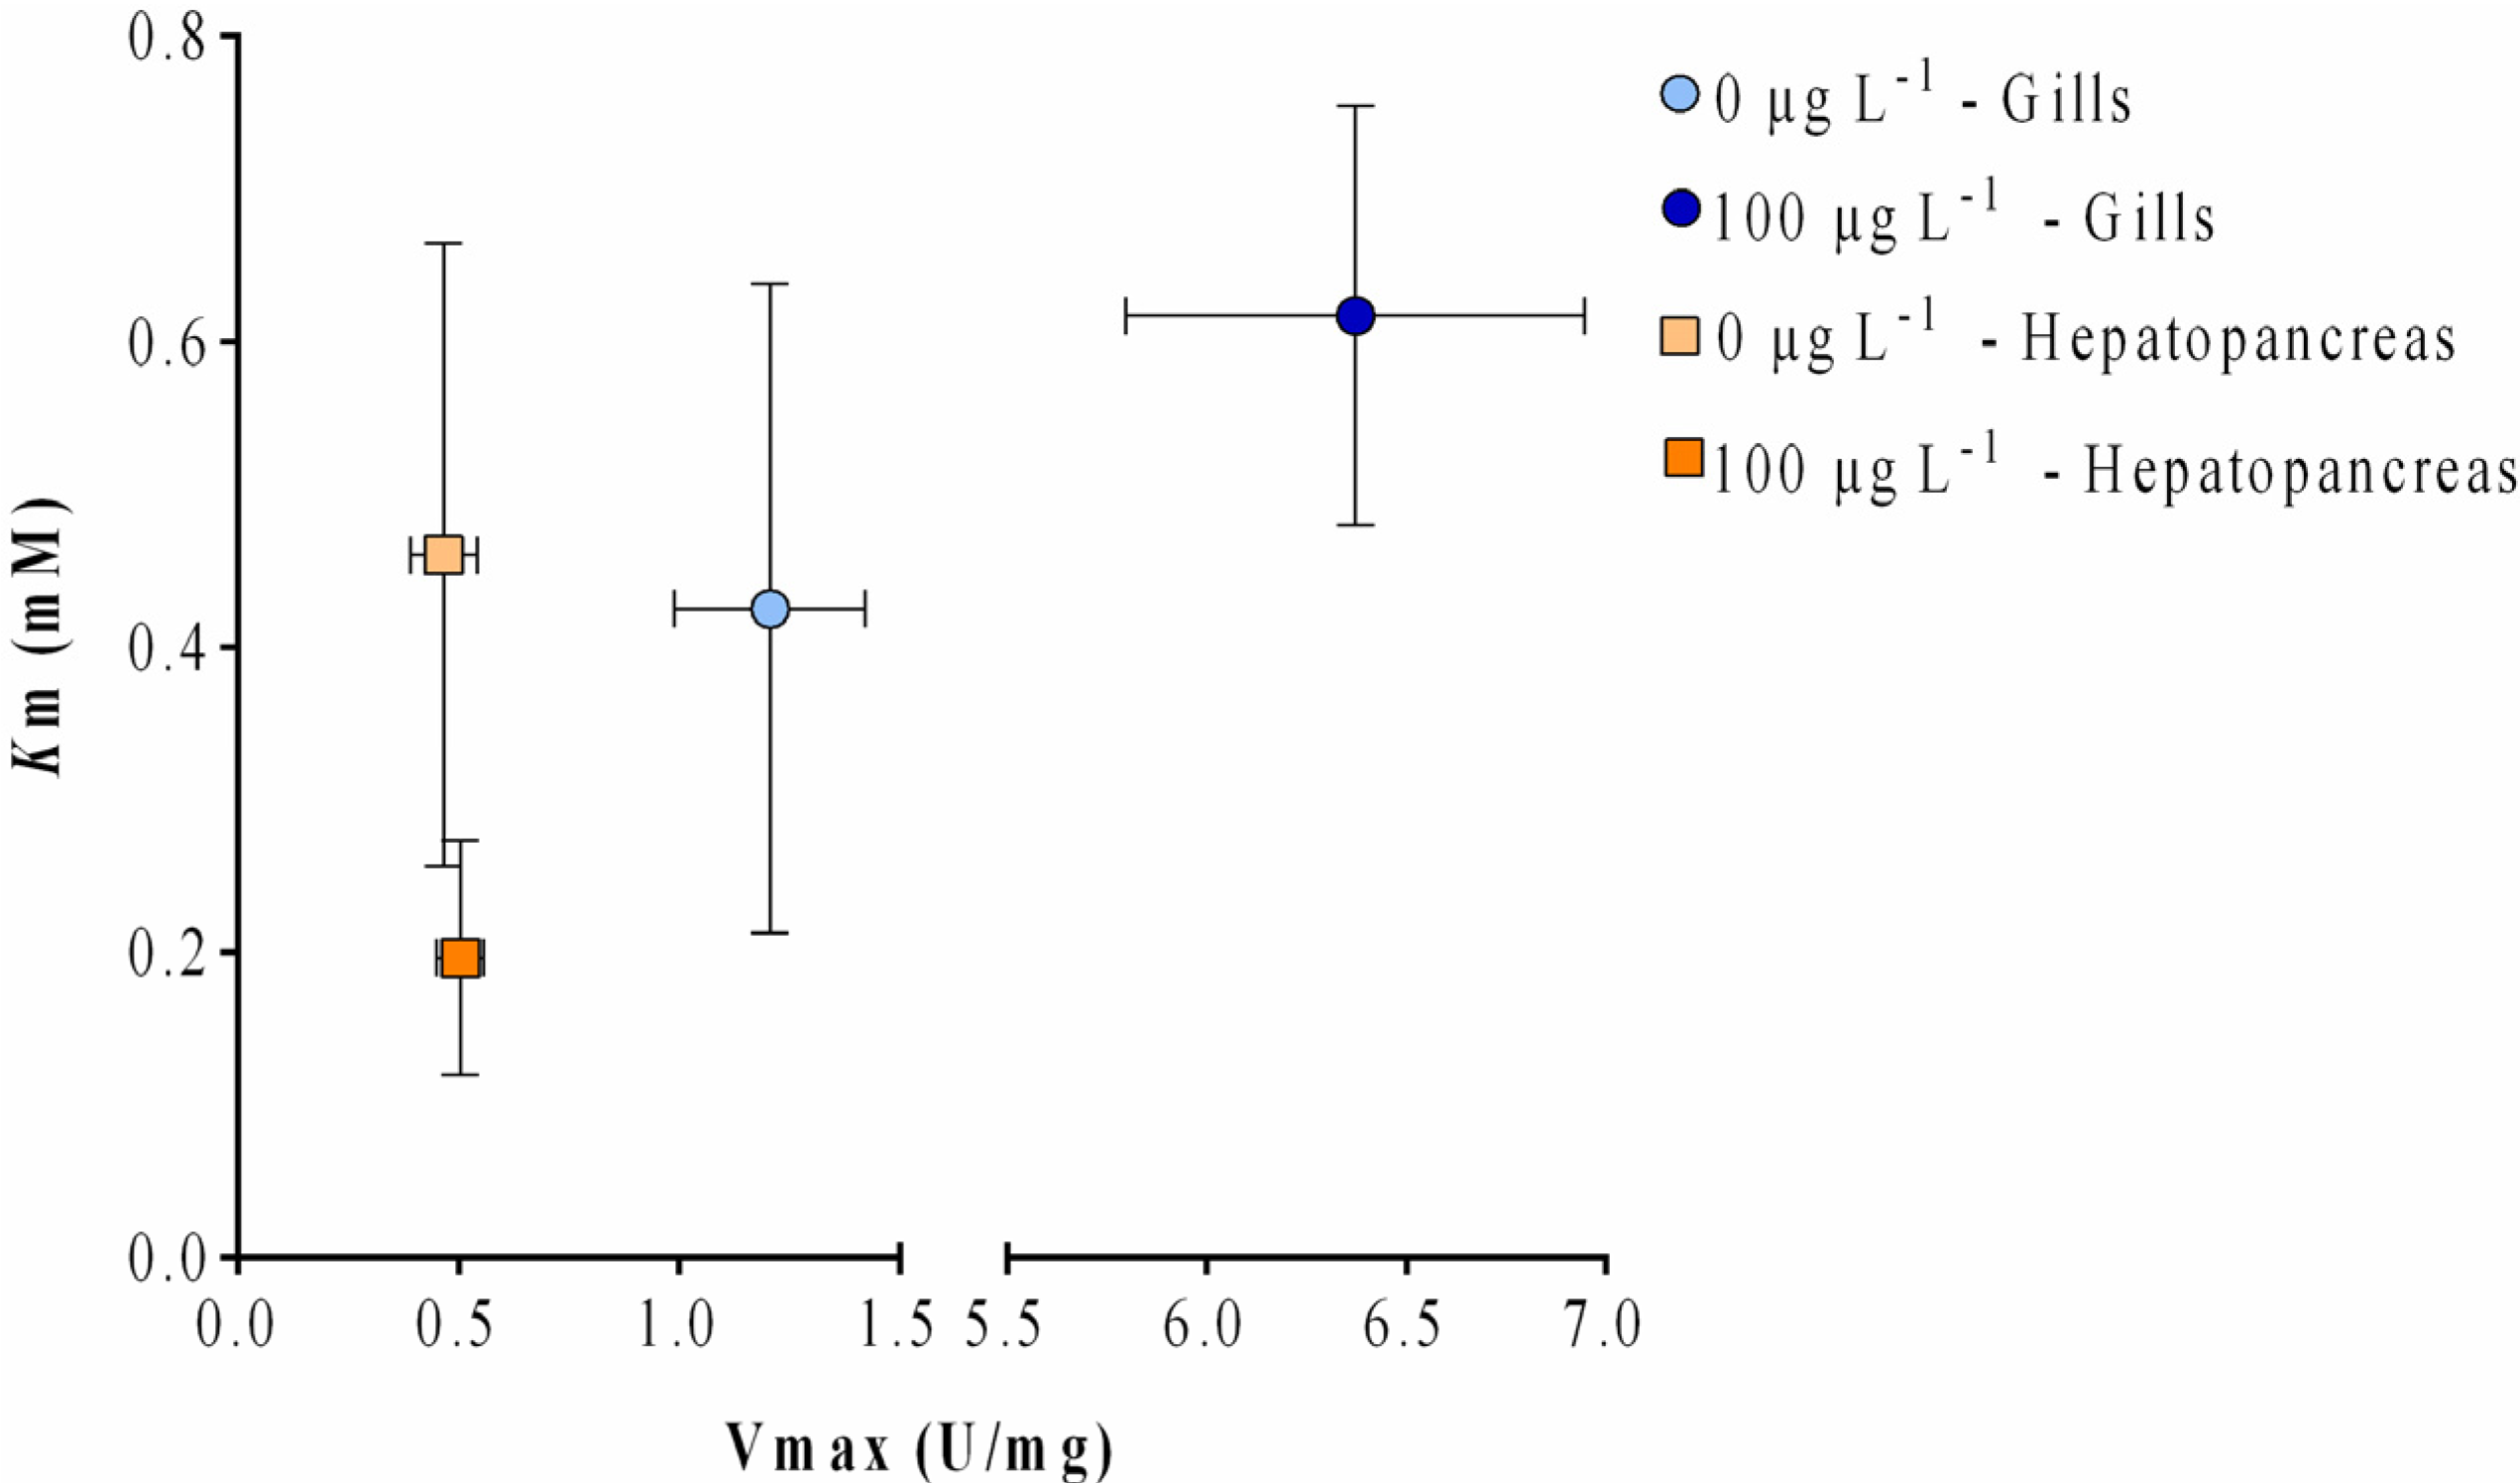
2.3. Enzyme Kinetics


| Spot Number | Nominal Mass (Da) | Calculated pI | Putative Identification | Accession | Protein Score | Protein Sequence Coverage (%) | Ratio to Control |
|---|---|---|---|---|---|---|---|
| 1 | 24023 | 7.67 | GST pi-class | B9VAW9 | 333 | 49 | −4.1 |
| 2 | 24516 | 6.64 | GST sigma2-class | G9HSP3 | 815 | 50 | 1.4 |
| 3 | 24516 | 6.64 | GST sigma2-class | G9HSP3 | 1460 | 85 | 2.2 |
| 4 | 24023 | 7.67 | GST pi-class | B9VAW9 | 1090 | 67 | 1.2 |
| 5 | 24023 | 7.67 | GST pi-class | B9VAW9 | 420 | 52 | - |
3. Discussion
4. Experimental Section
4.1. Biological Material
4.2. MC-LR Purification
4.2.1. MC-LR Extraction
4.2.2. MC-LR Purification by Semi-Preparative HPLC
4.2.3. Quantification of MC-LR by HPLC-PDA
4.3. Exposure Experiment
4.4. Sample Preparation
4.5. Enzymes
4.5.1. GST
4.5.2. SOD
4.5.3. PPP2
4.6. Gene Expression
4.6.1. RNA Extraction
4.6.2. cDNA Synthesis
4.6.3. Primers Design
| GST Gene | Primer Sequence (5'-3' order) | Product Length (bp) | |
|---|---|---|---|
| Forward | Reverse | ||
| sigma1 | CAGAAGAATTTGGCAGAAGTAG | AAGACAGCAAGATCAGCGAG | 121 |
| sigma2 | AAGGCTAAACTTACAGAGGAG | GTGTTTCTTGAGTTCAGGGT | 209 |
| mu | GACTTCCCAATGTACGAGCTT | ACACTTTCCTGAGCGAGATAC | 139 |
| pi | GCATTACCGACCCTCAAAGC | CCATTGACGGGCATTTTCTT | 101 |
| EF1-α | GCTCACAGAAGCTGTACCAGG | CTGGGCATAGAAGCTTGCAG | 136 |
4.6.4. Quantitative RT-PCR
4.7. Kinetic Characterization
4.8. Two-Dimensional Gel Electrophoresis (2DE)
4.8.1. Isoelectric Focusing
4.8.2. SDS-PAGE
4.8.3. Image Acquisition and Analysis
4.8.4. In-Gel Digestion of Proteins
4.8.5. MALDI-TOF/TOF and MS/MS Analysis and Database Search
4.9. Statistical Analysis
5. Conclusions
Acknowledgments
Author Contributions
Conflicts of Interest
References
- Neilan, B.A.; Pearson, L.A.; Muenchhoff, J.; Moffitt, M.C.; Dittmann, E. Environmental Conditions that Influence Toxin Biosynthesis in Cyanobacteria. Environ. Microbiol. 2013, 15, 1239–1253. [Google Scholar] [CrossRef] [PubMed]
- Miller, M.A.; Kudela, R.M.; Mekebri, A.; Crane, D.; Oates, S.C.; Tinker, M.T.; Staedler, M.; Miller, W.A.; Toy-Choutka, S.; Dominik, C.; et al. Evidence for a Novel Marine Harmful Algal Bloom: Cyanotoxin (Microcystin) Transfer from Land to Sea Otters. PLoS ONE 2010, 5. [Google Scholar] [CrossRef] [PubMed]
- Chorus, I.; Falconer, I.R.; Salas, H.J.; Bartram, J. Health Risks Caused by Freshwater Cyanobacteria in Recreational Waters. J. Toxicol. Environ. Health Part B 2000, 3, 323–347. [Google Scholar]
- Dietrich, D.; Hoeger, S. Guidance Values for Microcystins in Water and Cyanobacterial Supplement Products (Blue-Green Algal Supplements): A Reasonable or Misguided Approach? Toxicol. Appl. Pharmacol. 2005, 203, 273–289. [Google Scholar] [CrossRef] [PubMed]
- Vareli, K.; Jaeger, W.; Touka, A.; Frillingos, S.; Briasoulis, E.; Sainis, I. Hepatotoxic Seafood Poisoning (HSP) due to Microcystins: A Threat from the Ocean? Mar. Drugs 2013, 11, 2751–2768. [Google Scholar] [CrossRef] [PubMed]
- MacKintosh, C.; Beattie, K.A.; Klumpp, S.; Cohen, P.; Codd, G.A. Cyanobacterial Microcystin-LR is a Potent and Specific Inhibitor of Protein Phosphatases 1 and 2a from both Mammals and Higher Plants. FEBS Lett. 1990, 264, 187–192. [Google Scholar] [CrossRef]
- Runnegar, M.; Berndt, N.; Kong, S.M.; Lee, E.Y.; Zhang, L. In vivo and in vitro Binding of Microcystin to Protein Phosphatases 1 and 2a. Biochem. Biophys. Res. Commun. 1995, 216, 162–169. [Google Scholar] [CrossRef] [PubMed]
- Pereira, S.R.; Vasconcelos, V.M.; Antunes, A. Computational Study of the Covalent Bonding of Microcystins to Cysteine Residues—A Reaction Involved in the Inhibition of the PPP Family of Protein Phosphatases. FEBS J. 2013, 280, 674–680. [Google Scholar] [CrossRef] [PubMed]
- Carmichael, W.W. The Toxins of Cyanobacteria. Sci. Am. 1994, 270, 78–86. [Google Scholar] [CrossRef] [PubMed]
- Falconer, I.R. Tumor Promotion and Liver Injury Caused by oral Consumption of Cyanobacteria. Environ. Toxicol. Water Qual. 1991, 6, 177–184. [Google Scholar] [CrossRef]
- Prieto, A.I.; Jos, Á.; Pichardo, S.; Moreno, I.; Cameán, A.M. Differential Oxidative Stress Responses to Microcystins LR and RR in Intraperitoneally Exposed Tilapia Fish (Oreochromis sp.). Aquat. Toxicol. 2006, 77, 314–321. [Google Scholar] [CrossRef] [PubMed]
- Ding, W.X.; Shen, H.M.; Zhu, H.G.; Ong, C.N. Studies on Oxidative Damage Induced by Cyanobacteria Extract in Primary Cultured Rat Hepatocytes. Environ. Res. 1998, 78, 12–18. [Google Scholar] [CrossRef] [PubMed]
- Guzman, R.E.; Solter, P.F. Hepatic Oxidative Stress Following Prolonged Sublethal Microcystin LR Exposure. Toxicol. Pathol. 1999, 27, 582–588. [Google Scholar] [CrossRef] [PubMed]
- Li, X.; Liu, Y.; Song, L.; Liu, J. Responses of Antioxidant Systems in the Hepatocytes of Common Carp (Cyprinus Carpio L.) to the Toxicity of Microcystin-LR. Toxicon 2003, 42, 85–89. [Google Scholar] [CrossRef]
- Pinho, G.L.L.; Moura da Rosa, C.; Yunes, J.S.; Luquet, C.M.; Bianchini, A.; Monserrat, J.M. Toxic Effects of Microcystins in the Hepatopancreas of the Estuarine Crab Chasmagnathus Granulatus (Decapoda, Grapsidae). Comp. Biochem. Physiol. C Toxicol. Pharmacol. 2003, 135, 459–468. [Google Scholar] [CrossRef]
- Vinagre, T.M.; Alciati, J.C.; Regoli, F.; Bocchetti, R.; Yunes, J.S.; Bianchini, A.; Monserrat, J.M. Effect of Microcystin on Ion Regulation and Antioxidant System in Gills of the Estuarine Crab Chasmagnathus Granulatus (Decapoda, Grapsidae). Comp. Biochem. Physiol. C Toxicol. Pharmacol. 2003, 135, 67–75. [Google Scholar] [CrossRef]
- Botha, N.; Gehringer, M.M.; Downing, T.G.; van de Venter, M.; Shephard, E.G. The Role of Microcystin-LR in the Induction of Apoptosis and Oxidative Stress in CaCo2 Cells. Toxicon 2004, 43, 85–92. [Google Scholar] [CrossRef] [PubMed]
- Bouaicha, N.; Maatouk, I. Microcystin-LR and Nodularin Induce Intracellular Glutathione Alteration, Reactive Oxygen Species Production and Lipid Peroxidation in Primary Cultured Rat Hepatocytes. Toxicol. Lett. 2004, 148, 53–63. [Google Scholar] [CrossRef] [PubMed]
- Hayes, J.D.; Flanagan, J.U.; Jowsey, I.R. Glutathione Transferases. Annu. Rev. Pharmacol. Toxicol. 2005, 45, 51–88. [Google Scholar] [CrossRef] [PubMed]
- Šetlíková, I.; Wiegand, C. Hepatic and Branchial Glutathione S-Transferases of Two Fish Species: Substrate Specificity and Biotransformation of Microcystin-LR. Comp. Biochem. Physiol. C Toxicol. Pharmacol. 2009, 149, 515–523. [Google Scholar] [CrossRef] [PubMed]
- Hoarau, P.; Garello, G.; Gnassia-Barelli, M.; Romeo, M.; Girard, J.-P. Purification and Partial Characterization of Seven Glutathione S-Transferase Isoforms from the Clam Ruditapes gecussatus. Eur. J. Biochem. 2002, 269, 4359–4366. [Google Scholar] [CrossRef] [PubMed]
- Habig, W.H.; Pabst, M.J.; Jakoby, W.B. Glutathione S-Transferases. The first Enzymatic Step in Mercapturic Acid Formation. J. Biol. Chem. 1974, 249, 7130–7139. [Google Scholar] [PubMed]
- Kondo, F.; Ikai, Y.; Oka, H.; Okumura, M.; Ishikawa, N.; Harada, K.; Matsuura, K.; Murata, H.; Suzuki, M. Formation, Characterization, and Toxicity of the Glutathione and Cysteine Conjugates of Toxic Heptapeptide Microcystins. Chem. Res. Toxicol. 1992, 5, 591–596. [Google Scholar] [CrossRef] [PubMed]
- Pflugmacher, S.; Wiegand, C.; Oberemm, A.; Beattie, K.A.; Krause, E.; Codd, G.A.; Steinberg, C.E.W. Identification of an Enzymatically Formed Glutathione Conjugate of the Cyanobacterial Hepatotoxin Microcystin-LR: The First Step of Detoxication. Biochim. Biophys. Acta 1998, 1425, 527–533. [Google Scholar] [CrossRef]
- Frova, C. Glutathione Transferases in the Genomics Era: New Insights and Perspectives. Biomol. Eng. 2006, 23, 149–169. [Google Scholar] [CrossRef] [PubMed]
- Chen, J.; Xie, P. Seasonal Dynamics of the Hepatotoxic Microcystins in Various Organs of Four Freshwater Bivalves from the Large Eutrophic Lake Taihu of Subtropical China and the Risk to Human Consumption. Environ. Toxicol. 2005, 20, 572–584. [Google Scholar] [CrossRef] [PubMed]
- Wiegand, C.; Pflugmacher, S.; Oberemm, A.; Meems, N.; Beattie, K.A.; Steinberg, C.E.W.; Codd, G.A. Uptake and Effects of Microcystin-LR on Detoxication Enzymes of Early Life Stages of the Zebra Fish (Danio Rerio). Environ. Toxicol. 1999, 14, 89–95. [Google Scholar] [CrossRef]
- Martins, J.C.; Machado, J.; Martins, A.; Azevedo, J.; Teles, L.O.; Vasconcelos, V. Dynamics of Protein Phosphatase Gene Expression in Corbicula Fluminea Exposed to Microcystin-LR and to Toxic Microcystis Aeruginosa Cells. Int. J. Mol. Sci. 2011, 12, 9172–9188. [Google Scholar] [CrossRef] [PubMed]
- Martins, J.C.; Leão, P.N.; Vasconcelos, V. Differential Protein Expression in Corbicula Fluminea upon Exposure to a Microcystis Aeruginosa Toxic Strain. Toxicon 2009, 53, 409–416. [Google Scholar] [CrossRef] [PubMed]
- Ibelings, B.W.; Havens, K.E. Cyanobacterial Toxins: A Qualitative Meta-Analysis of Concentrations, Dosage and Effects in Freshwater, Estuarine and Marine Biota. Adv. Exp. Med. Biol. 2008, 619, 675–732. [Google Scholar] [PubMed]
- Martins, J.C.; Vasconcelos, V.M. Microcystin Dynamics in Aquatic Organisms. J. Toxicol. Environ. Health Part B 2009, 12, 65–82. [Google Scholar] [CrossRef] [PubMed]
- Wiegand, C.; Pflugmacher, S. Ecotoxicological Effects of Selected Cyanobacterial Secondary Metabolites: A Short Review. Toxicol. Appl. Pharmacol. 2005, 203, 201–218. [Google Scholar] [CrossRef] [PubMed]
- Donaghy, L.; Lambert, C.; Choi, K.-S.; Soudant, P. Hemocytes of the Carpet Shell Clam (Ruditapes Decussatus) and the Manila Clam (Ruditapes Philippinarum): Current Knowledge and Future Prospects. Aquaculture 2009, 297, 10–24. [Google Scholar] [CrossRef]
- Tanguy, A.; Bierne, N.; Saavedra, C.; Pina, B.; Bachere, E.; Kube, M.; Bazin, E.; Bonhomme, F.; Boudry, P.; Boulo, V.; et al. Increasing Genomic Information in Bivalves Through New Est Collections in Four Species: Development of New Genetic Markers for Environmental Studies and Genome Evolution. Gene 2008, 408, 27–36. [Google Scholar] [CrossRef] [PubMed]
- Rita, D.P.; Valeria, V.; Silvia, B.M.; Pasquale, G.; Milena, B. Microcystin Contamination in Sea Mussel Farms from the Italian Southern Adriatic Coast Following Cyanobacterial Blooms in an Artificial Reservoir. J. Ecosyst. 2014, 2014. [Google Scholar] [CrossRef]
- Vasconcelos, V.M.; Wiegand, C.; Pflugmacher, S. Dynamics of Glutathione-S-Transferases in Mytilus Galloprovincialis Exposed to Toxic Microcystis Aeruginosa Cells, Extracts and Pure Toxins. Toxicon 2007, 50, 740–745. [Google Scholar] [CrossRef] [PubMed]
- Reis, B.; Carneiro, M.; Machado, J.; Azevedo, J.; Vasconcelos, V.; Martins, J. Transcriptional Responses of Glutathione Transferase Genes in Ruditapes Philippinarum Exposed to Microcystin-LR. Int. J. Mol. Sci. 2015, 16, 8397–8414. [Google Scholar] [CrossRef] [PubMed]
- Buratti, F.M.; Scardala, S.; Funari, E.; Testai, E. Human Glutathione Transferases Catalyzing the Conjugation of the Hepatoxin Microcystin-LR. Chem. Res. Toxicol. 2011, 24, 926–933. [Google Scholar] [CrossRef] [PubMed]
- Fernandes, S.; Welker, M.; Vasconcelos, V.M. Changes in the GST Activity of the Mussel Mytilus Galloprovincialis during Exposure and Depuration of Microcystins. J. Exp. Zool. A Ecol. Genet. Physiol. 2009, 311, 226–230. [Google Scholar] [CrossRef] [PubMed]
- Sivonen, K.K.; Jones, G. Cyanobacterial Toxins. In Toxic Cyanobacteria in Water; Chorus, I., Bartram, J., Eds.; E&FN Spon: London, UK, 1999; pp. 41–111. [Google Scholar]
- Fitzpatrick, P.J.; Sheehan, D.; Livingstone, D.R. Studies on Isoenzymes of Glutathione S-Transferase in the Digestive Gland of Mytilus Galloprovincialis with Exposure to Pollution. Mar. Environ. Res. 1995, 39, 241–244. [Google Scholar] [CrossRef]
- Yoshizawa, S.; Matsushima, R.; Watanabe, M.; Harada, K.-I.; Ichihara, A.; Carmichael, W.; Fujiki, H. Inhibition of Protein Phosphatases by Microcystis and Nodularin Associated with Hepatotoxicity. J. Cancer Res. Clin. Oncol. 1990, 116, 609–614. [Google Scholar] [CrossRef] [PubMed]
- Cheung, C.C.C.; Zheng, G.J.; Li, A.M.Y.; Richardson, B.J.; Lam, P.K.S. Relationships between Tissue Concentrations of Polycyclic Aromatic Hydrocarbons and Antioxidative Responses of Marine Mussels, Perna Viridis. Aquat. Toxicol. 2001, 52, 189–203. [Google Scholar] [CrossRef]
- Power, A.; Sheehan, D. Seasonal Variation in the Antioxidant Defence Systems of Gill and Digestive Gland of the Blue Mussel, Mytilus Edulis. Comp. Biochem. Physiol. C Pharmacol. Toxicol. Endocrinol. 1996, 114, 99–103. [Google Scholar] [CrossRef]
- Wang, L.; Pan, L.; Liu, N.; Liu, D.; Xu, C.; Miao, J. Biomarkers and Bioaccumulation of Clam Ruditapes Philippinarum in Response to Combined Cadmium and Benzo[α]Pyrene Exposure. Food Chem. Toxicol. 2011, 49, 3407–3417. [Google Scholar] [CrossRef] [PubMed]
- Borković-Mitić, S.S.; Kovačević, T.B.; Perendija, B.R.; Despotović, S.G.; Gavrić, J.P.; Pavlović, S.Z.; Saičić, Z.S. Superoxide Dismutase and Catalase Activities in the Digestive Gland and Gills of the Freshwater Bivalve Unio Pictorum from the Sava River. Arch. Biol. Sci. 2011, 63, 185–192. [Google Scholar] [CrossRef]
- Contardo-Jara, V.; Pflugmacher, S.; Wiegand, C. Multi-Xenobiotic-Resistance a Possible Explanation for the Insensitivity of Bivalves towards Cyanobacterial Toxins. Toxicon 2008, 52, 936–943. [Google Scholar] [CrossRef] [PubMed]
- Wang, M.; Chan, L.L.; Si, M.; Hong, H.; Wang, D. Proteomic Analysis of Hepatic Tissue of Zebrafish (Danio Rerio) Experimentally Exposed to Chronic Microcystin-LR. Toxicol. Sci. 2009. [Google Scholar] [CrossRef] [PubMed]
- Zhang, L.; Qiu, L.; Wu, H.; Liu, X.; You, L.; Pei, D.; Chen, L.; Wang, Q.; Zhao, J. Expression Profiles of Seven Glutathione S-Transferase (GST) Genes from Venerupis Philippinarum Exposed to Heavy Metals and Benzo[α]Pyrene. Comp. Biochem. Physiol. C Toxicol. Pharmacol. 2012, 155, 517–527. [Google Scholar] [CrossRef] [PubMed]
- Fu, J.; Xie, P. The Acute Effects of Microcystin LR on the Transcription of Nine Glutathione S-Transferase Genes in Common Carp Cyprinus Carpio L. Aquat. Toxicol. 2006, 80, 261–266. [Google Scholar] [CrossRef] [PubMed]
- Wang, L.; Liang, X.-F.; Liao, W.-Q.; Lei, L.-M.; Han, B.-P. Structural and Functional Characterization of Microcystin Detoxification-Related Liver Genes in a Phytoplanktivorous Fish, Nile Tilapia (Oreochromis Niloticus). Comp. Biochem. Physiol. C Toxicol. Pharmacol. 2006, 144, 216–227. [Google Scholar] [CrossRef] [PubMed]
- Li, G.; Xie, P.; Fu, J.; Hao, L.; Xiong, Q.; Li, H. Microcystin-Induced Variations in Transcription of GSTS in an Omnivorous Freshwater Fish, Goldfish. Aquat. Toxicol. 2008, 88, 75–80. [Google Scholar] [CrossRef] [PubMed]
- Amado, L.L.; Monserrat, J.M. Oxidative Stress Generation by Microcystins in Aquatic Animals: Why and How. Environ. Int. 2010, 36, 226–235. [Google Scholar] [CrossRef] [PubMed]
- Umasuthan, N.; Revathy, K.S.; Lee, Y.; Whang, I.; Choi, C.Y.; Lee, J. A Novel Molluscan Sigma-Like Glutathione S-Transferase from Manila Clam, Ruditapes Philippinarum: Cloning, Characterization and Transcriptional Profiling. Comp. Biochem. Physiol. C Toxicol. Pharmacol. 2012, 155, 539–550. [Google Scholar] [CrossRef] [PubMed]
- Hao, L.; Xie, P.; Fu, J.; Li, G.; Xiong, Q.; Li, H. The Effect of Cyanobacterial Crude Extract on the Transcription of GST Mu, GST Kappa and GST Rho in Different Organs of Goldfish (Carassius Auratus). Aquat. Toxicol. 2008, 90, 1–7. [Google Scholar] [CrossRef] [PubMed]
- Hoarau, P.; Damiens, G.; Roméo, M.; Gnassia-Barelli, M.; Bebianno, M.J. Cloning and Expression of a GST-Pi Gene in Mytilus Galloprovincialis. Attempt to Use the GST-Pi Transcript as a Biomarker of Pollution. Comp. Biochem. Physiol. C Toxicol. Pharmacol. 2006, 143, 196–203. [Google Scholar] [CrossRef] [PubMed]
- Yang, H.-L.; Zeng, Q.-Y.; Nie, L.-J.; Zhu, S.-G.; Zhou, X.-W. Purification and Characterization of a Novel Glutathione S-Transferase from Atactodea Striata. Biochem. Biophys. Res. Commun. 2003, 307, 626–631. [Google Scholar] [CrossRef]
- Yang, H.; Nie, L.; Zhu, S.; Zhou, X. Purification and Characterization of a Novel Glutathione S-Transferase from Asaphis Dichotoma. Arch. Biochem. Biophys. 2002, 403, 202–208. [Google Scholar] [CrossRef]
- Vidal, M.L.; Rouimi, P.; Debrauwer, L.; Narbonne, J.F. Purification and Characterisation of Glutathione S-Transferases from the Freshwater Clam Corbicula Fluminea (Muller). Comp. Biochem. Physiol. C Toxicol. Pharmacol. 2002, 131, 477–489. [Google Scholar] [CrossRef]
- Fitzpatrick, P.J.; Krag, T.O.; Højrup, P.; Sheehan, D. Characterization of a Glutathione S-Transferase and a Related Glutathione-Binding Protein from Gill of the Blue Mussel, Mytilus Edulis. Biochem. J. 1995, 305, 145–150. [Google Scholar] [PubMed]
- Martins, J.C.; Campos, A.; Osorio, H.; da Fonseca, R.; Vasconcelos, V. Proteomic Profiling of Cytosolic Glutathione Transferases from Three Bivalve Species: Corbicula Fluminea, Mytilus galloprovincialis and Anodonta Cygnea. Int. J. Mol. Sci. 2014, 15, 1887–1900. [Google Scholar] [CrossRef] [PubMed]
- Kotai, J. Instructions for Preparation of Modified Nutrient Solution Z8 for Algae; Norwegian Institute for Water Research B-11769: Blindern, Oslo, Norway, 1972; p. 5. [Google Scholar]
- Vasconcelos, V.M. Uptake and Depuration of the Heptapeptide Toxin Microcystin-LR in Mytilus galloprovincialis. Aquat. Toxicol. 1995, 32, 227–237. [Google Scholar] [CrossRef]
- Bradford, M.M. A Rapid and Sensitive Method for the Quantitation of Microgram Quantities of Protein Utilizing the Principle of Protein-Dye Binding. Anal. Biochem. 1976, 72, 248–254. [Google Scholar] [CrossRef]
- Frasco, M.F.; Guilhermino, L. Effects of Dimethoate and Beta-Naphthoflavone on Selected Biomarkers of Poecilia Reticulata. Fish Physiol. Biochem. 2002, 26, 149–156. [Google Scholar] [CrossRef]
- Pfaffl, M.W. A New Mathematical Model for Relative Quantification in Real-Time RT-PCR. Nucleic Acids Res. 2001, 29, e45. [Google Scholar] [CrossRef] [PubMed]
- Campos, A.; Puerto, M.; Prieto, A.; Cameán, A.; Almeida, A.M.; Coelho, A.V.; Vasconcelos, V. Protein Extraction and Two-Dimensional Gel Electrophoresis of Proteins in the Marine Mussel Mytilus Galloprovincialis: An Important Tool for Protein Expression Studies, Food Quality and Safety Assessment. J. Sci. Food Agric. 2013, 93, 1779–1787. [Google Scholar] [CrossRef] [PubMed]
- Görg, A.; Weiss, W.; Dunn, M.J. Current Two-Dimensional Electrophoresis Technology for Proteomics. Proteomics 2004, 4, 3665–3685. [Google Scholar] [CrossRef] [PubMed]
- Neuhoff, V.; Arold, N.; Taube, D.; Ehrhardt, W. Improved Staining of Proteins in Polyacrylamide Gels including Isoelectric Focusing Gels with Clear Background at Nanogram Sensitivity Using Coomassie Brilliant Blue G-250 and R-250. Electrophoresis 1988, 9, 255–262. [Google Scholar] [CrossRef] [PubMed]
- Campos, A.; Araújo, P.; Pinheiro, C.; Azevedo, J.; Osório, H.; Vasconcelos, V. Effects on Growth, Antioxidant Enzyme Activity and Levels of Extracellular Proteins in the Green Alga Chlorella Vulgaris Exposed to Crude Cyanobacterial Extracts and Pure Microcystin and Cylindrospermopsin. Ecotoxicol. Environ. Saf. 2013, 94, 45–53. [Google Scholar] [CrossRef] [PubMed]
- Perkins, D.N.; Pappin, D.J.; Creasy, D.M.; Cottrell, J.S. Probability-Based Protein Identification by Searching Sequence Databases Using Mass Spectrometry Data. Electrophoresis 1999, 20, 3551–3567. [Google Scholar] [CrossRef]
© 2015 by the authors; licensee MDPI, Basel, Switzerland. This article is an open access article distributed under the terms and conditions of the Creative Commons Attribution license (http://creativecommons.org/licenses/by/4.0/).
Share and Cite
Carneiro, M.; Reis, B.; Azevedo, J.; Campos, A.; Osório, H.; Vasconcelos, V.; Martins, J.C. Glutathione Transferases Responses Induced by Microcystin-LR in the Gills and Hepatopancreas of the Clam Venerupis philippinarum. Toxins 2015, 7, 2096-2120. https://doi.org/10.3390/toxins7062096
Carneiro M, Reis B, Azevedo J, Campos A, Osório H, Vasconcelos V, Martins JC. Glutathione Transferases Responses Induced by Microcystin-LR in the Gills and Hepatopancreas of the Clam Venerupis philippinarum. Toxins. 2015; 7(6):2096-2120. https://doi.org/10.3390/toxins7062096
Chicago/Turabian StyleCarneiro, Mariana, Bruno Reis, Joana Azevedo, Alexandre Campos, Hugo Osório, Vítor Vasconcelos, and José Carlos Martins. 2015. "Glutathione Transferases Responses Induced by Microcystin-LR in the Gills and Hepatopancreas of the Clam Venerupis philippinarum" Toxins 7, no. 6: 2096-2120. https://doi.org/10.3390/toxins7062096