Article

In Vitro Glucuronidation of Ochratoxin A by Rat Liver Microsomes

1
Institute for Agri-food Standards and Testing Technology, Shanghai Academy of Agricultural Sciences, 1000 Jinqi Road, Shanghai 201403, China
2
Veterinary and Agrochemical Research Centre (CODA-CERVA), Unit of Toxins and Natural Components, Leuvensesteenweg 17, Tervuren B-3080, Belgium
3
Laboratory of Food Analysis, Faculty of Pharmaceutical Sciences, Ghent University, Harelbekestraat 72, Ghent B-9000, Belgium
4
Laboratory of Chemical Analysis, Faculty of Veterinary Medicine, Ghent University, Salisburylaan 133, Merelbeke B-9820, Belgium
*
Author to whom correspondence should be addressed.
Toxins 2013, 5(12), 2671-2685; https://doi.org/10.3390/toxins5122671
Submission received: 29 October 2013 / Revised: 2 December 2013 / Accepted: 4 December 2013 / Published: 18 December 2013
(This article belongs to the Special Issue Recent Advances in Ochratoxins Research)

Abstract

:
Ochratoxin A (OTA), one of the most toxic mycotoxins, can contaminate a wide range of food and feedstuff. To date, the data on its conjugates via glucuronidation request clarification and consolidation. In the present study, the combined approaches of ultra high performance liquid chromatography-tandem mass spectrometry (UHPLC-MS/MS), UHPLC-Orbitrap-high resolution mass spectrometry (HRMS) and liquid chromatography-multiple stage mass spectrometry (LC-MSn) were utilized to investigate the metabolic profile of OTA in rat liver microsomes. Three conjugated products of OTA corresponding to amino-, phenol- and acyl-glucuronides were identified, and the related structures were confirmed by hydrolysis with β-glucuronidase. Moreover, OTA methyl ester, OTα and OTα-glucuronide were also found in the reaction solution. Based on these results, an in vitro metabolic pathway of OTA has been proposed for the first time.

Graphical Abstract

1. Introduction

Ochratoxin A (OTA), one of the most potent mycotoxins in cereals and related products, is a secondary metabolite produced by several Aspergillus species notably A. melleus, A. auricomus, A. alliaceus, A. petrakii, as well as Penicillium verrucosum [1]. Because of its acute toxicity like nephrotoxicity, hepatotoxicity, teratogenicity and immunosuppression [2,3,4,5,6,7], OTA has been speculated to be associated with chronic renal diseases in humans (Balkan endemic nephropathy, interstitial nephritis) [8,9,10,11] and was designated by the International Agency for Research on Cancer (IARC) as a possible human carcinogen (group 2B) [12]. Based on animal experiments and epidemiological studies on humans, OTA has been regulated by legal limits in many countries [13]. A tolerable daily intake (TDI) of 5 ng/kg b.w. was derived for OTA on the basis of the lowest observed adverse effect level [14].
Contamination of food and animal feed with OTA may result in the presence of residues in edible offal and blood serum [15]. Despite efforts to reduce the amount of this mycotoxin in food and animal feed, a certain degree of contamination seems unavoidable at present. Also, OTA has been found regularly in human biofluids showing the exposure of humans to this mycotoxin [16,17].
There is a need for a deeper and more comprehensive understanding of toxicological findings in animals and extrapolation of the resulting data as reference to human. In this regard, in recent years many in vitro and in vivo kinetics and metabolic studies have been performed to provide information on its toxicology and food safety assessment [18,19,20]. OTA can be transformed by hydrolysis, hydroxylation and oxidation into a series of metabolites, i.e., OTα, 4-OH-OTA, opened-OTA and ochratoxin quinone [19,21,22,23,24,25,26]. Moreover, one of the most important metabolisation reactions is glucuronidation, mainly in liver microsomes. Some other mycotoxins have been thoroughly investigated. Deoxynivalenol (DON) can be metabolized into DON-3-glucuronide and DON-15-glucuronide, which account for about 91% of total DON excreted in human urine [27]. The excretion rate of zearalenone (ZEN) was about 9.4%, also mainly as glucuronide [28,29]. These glucuronides have been successfully employed as biomarkers for assessment of human mycotoxin exposure [30,31]. With regard to OTA, at the cellular level, endogenous glucuronic acid can be conjugated to the phenolic group or carboxylic group under the catalytic reaction by uridine-diphosphate glucuronosyltransferase (UGT), which is a membrane bound microsomal enzyme adjacent to CYP [20]. OTA-conjugates have been detected in liver (8%–17%) and intestinal tissue (6%) [32]. Interestingly, the presence of glucuronide conjugates was also reported in bile of pigs upon feeding with OTA contaminated feed [33]. However, in all these reports, OTA-glucuronides were determined indirectly by using β-glucuronidase hydrolysis. No direct or definite evidence for the formation of OTA-glucuronides as well as complete chemical configurations are available. For example, Gross-Steinmeyer et al. did not observe any OTA glucuronide conjugates in in vitro experiments with rat and human hepatocytes [34].
These in vivo and in vitro data indicate that relevant data on OTA glucuronidation are still missing. Therefore, the purpose of this present work was to further clarify the formation of OTA metabolites by rat microsomal preparations and to clearly identify the structures of these metabolites to propose the major metabolic pathways of OTA in rat liver microsomes.

2. Results and Discussion
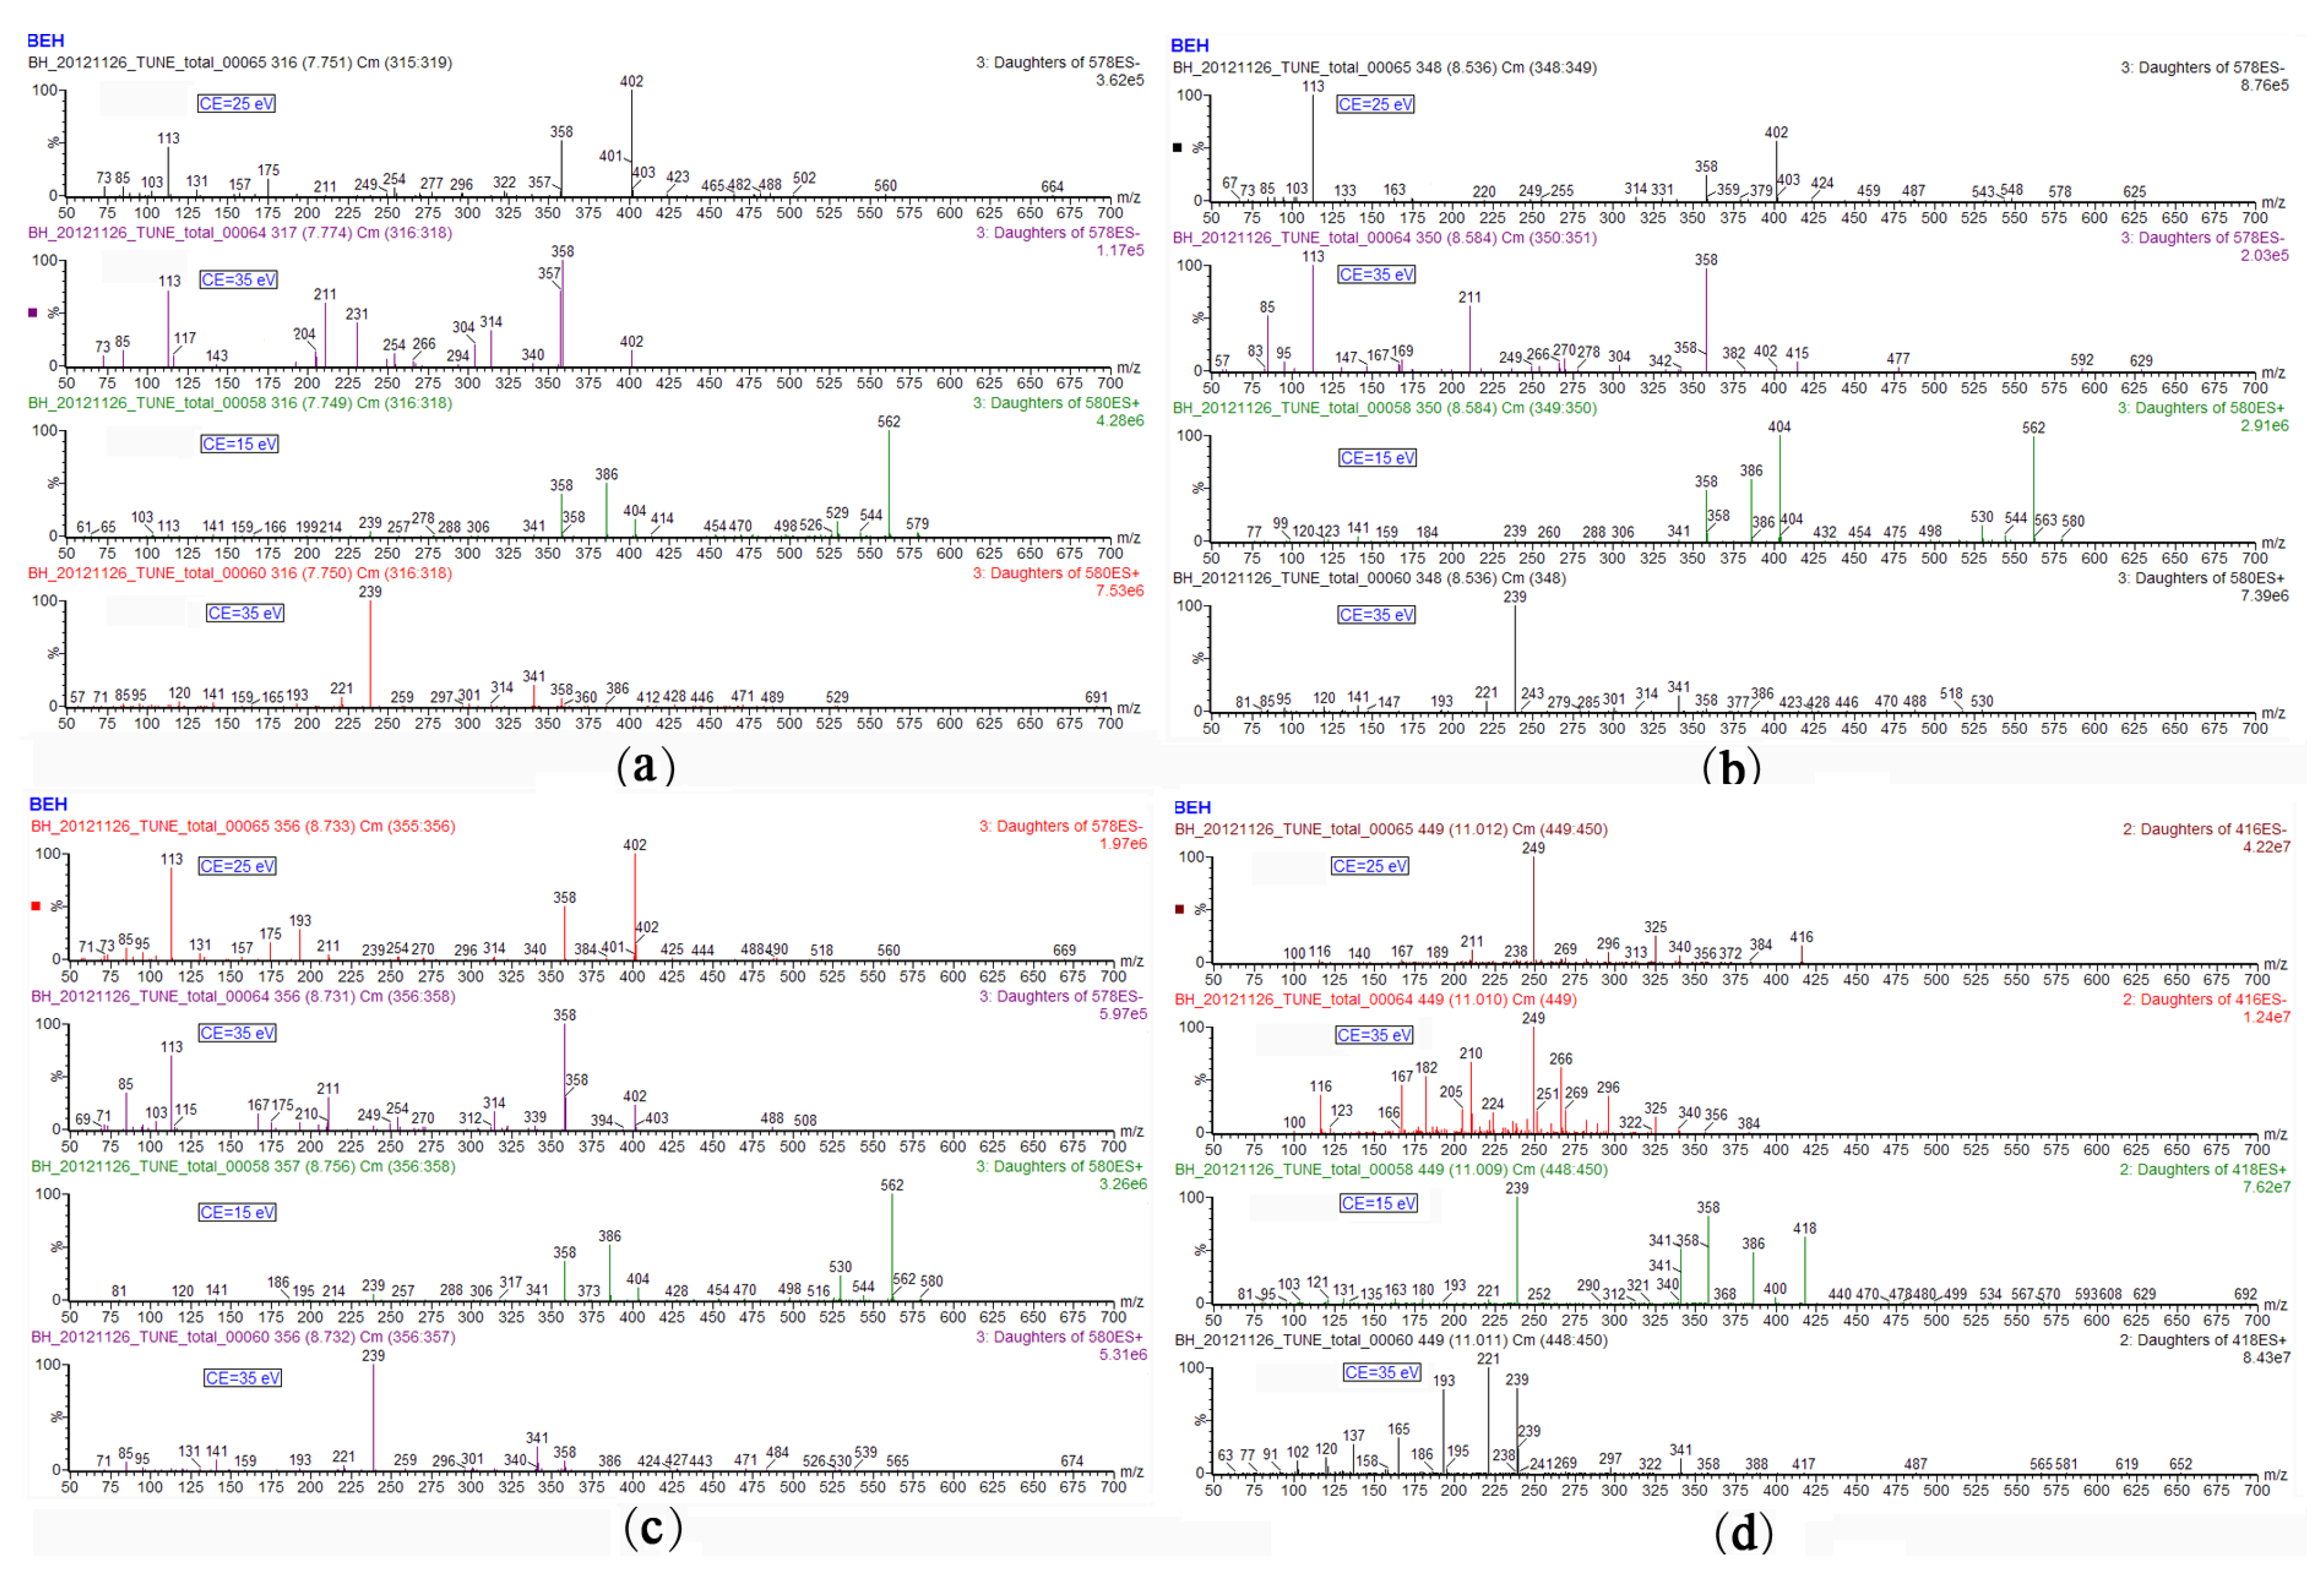
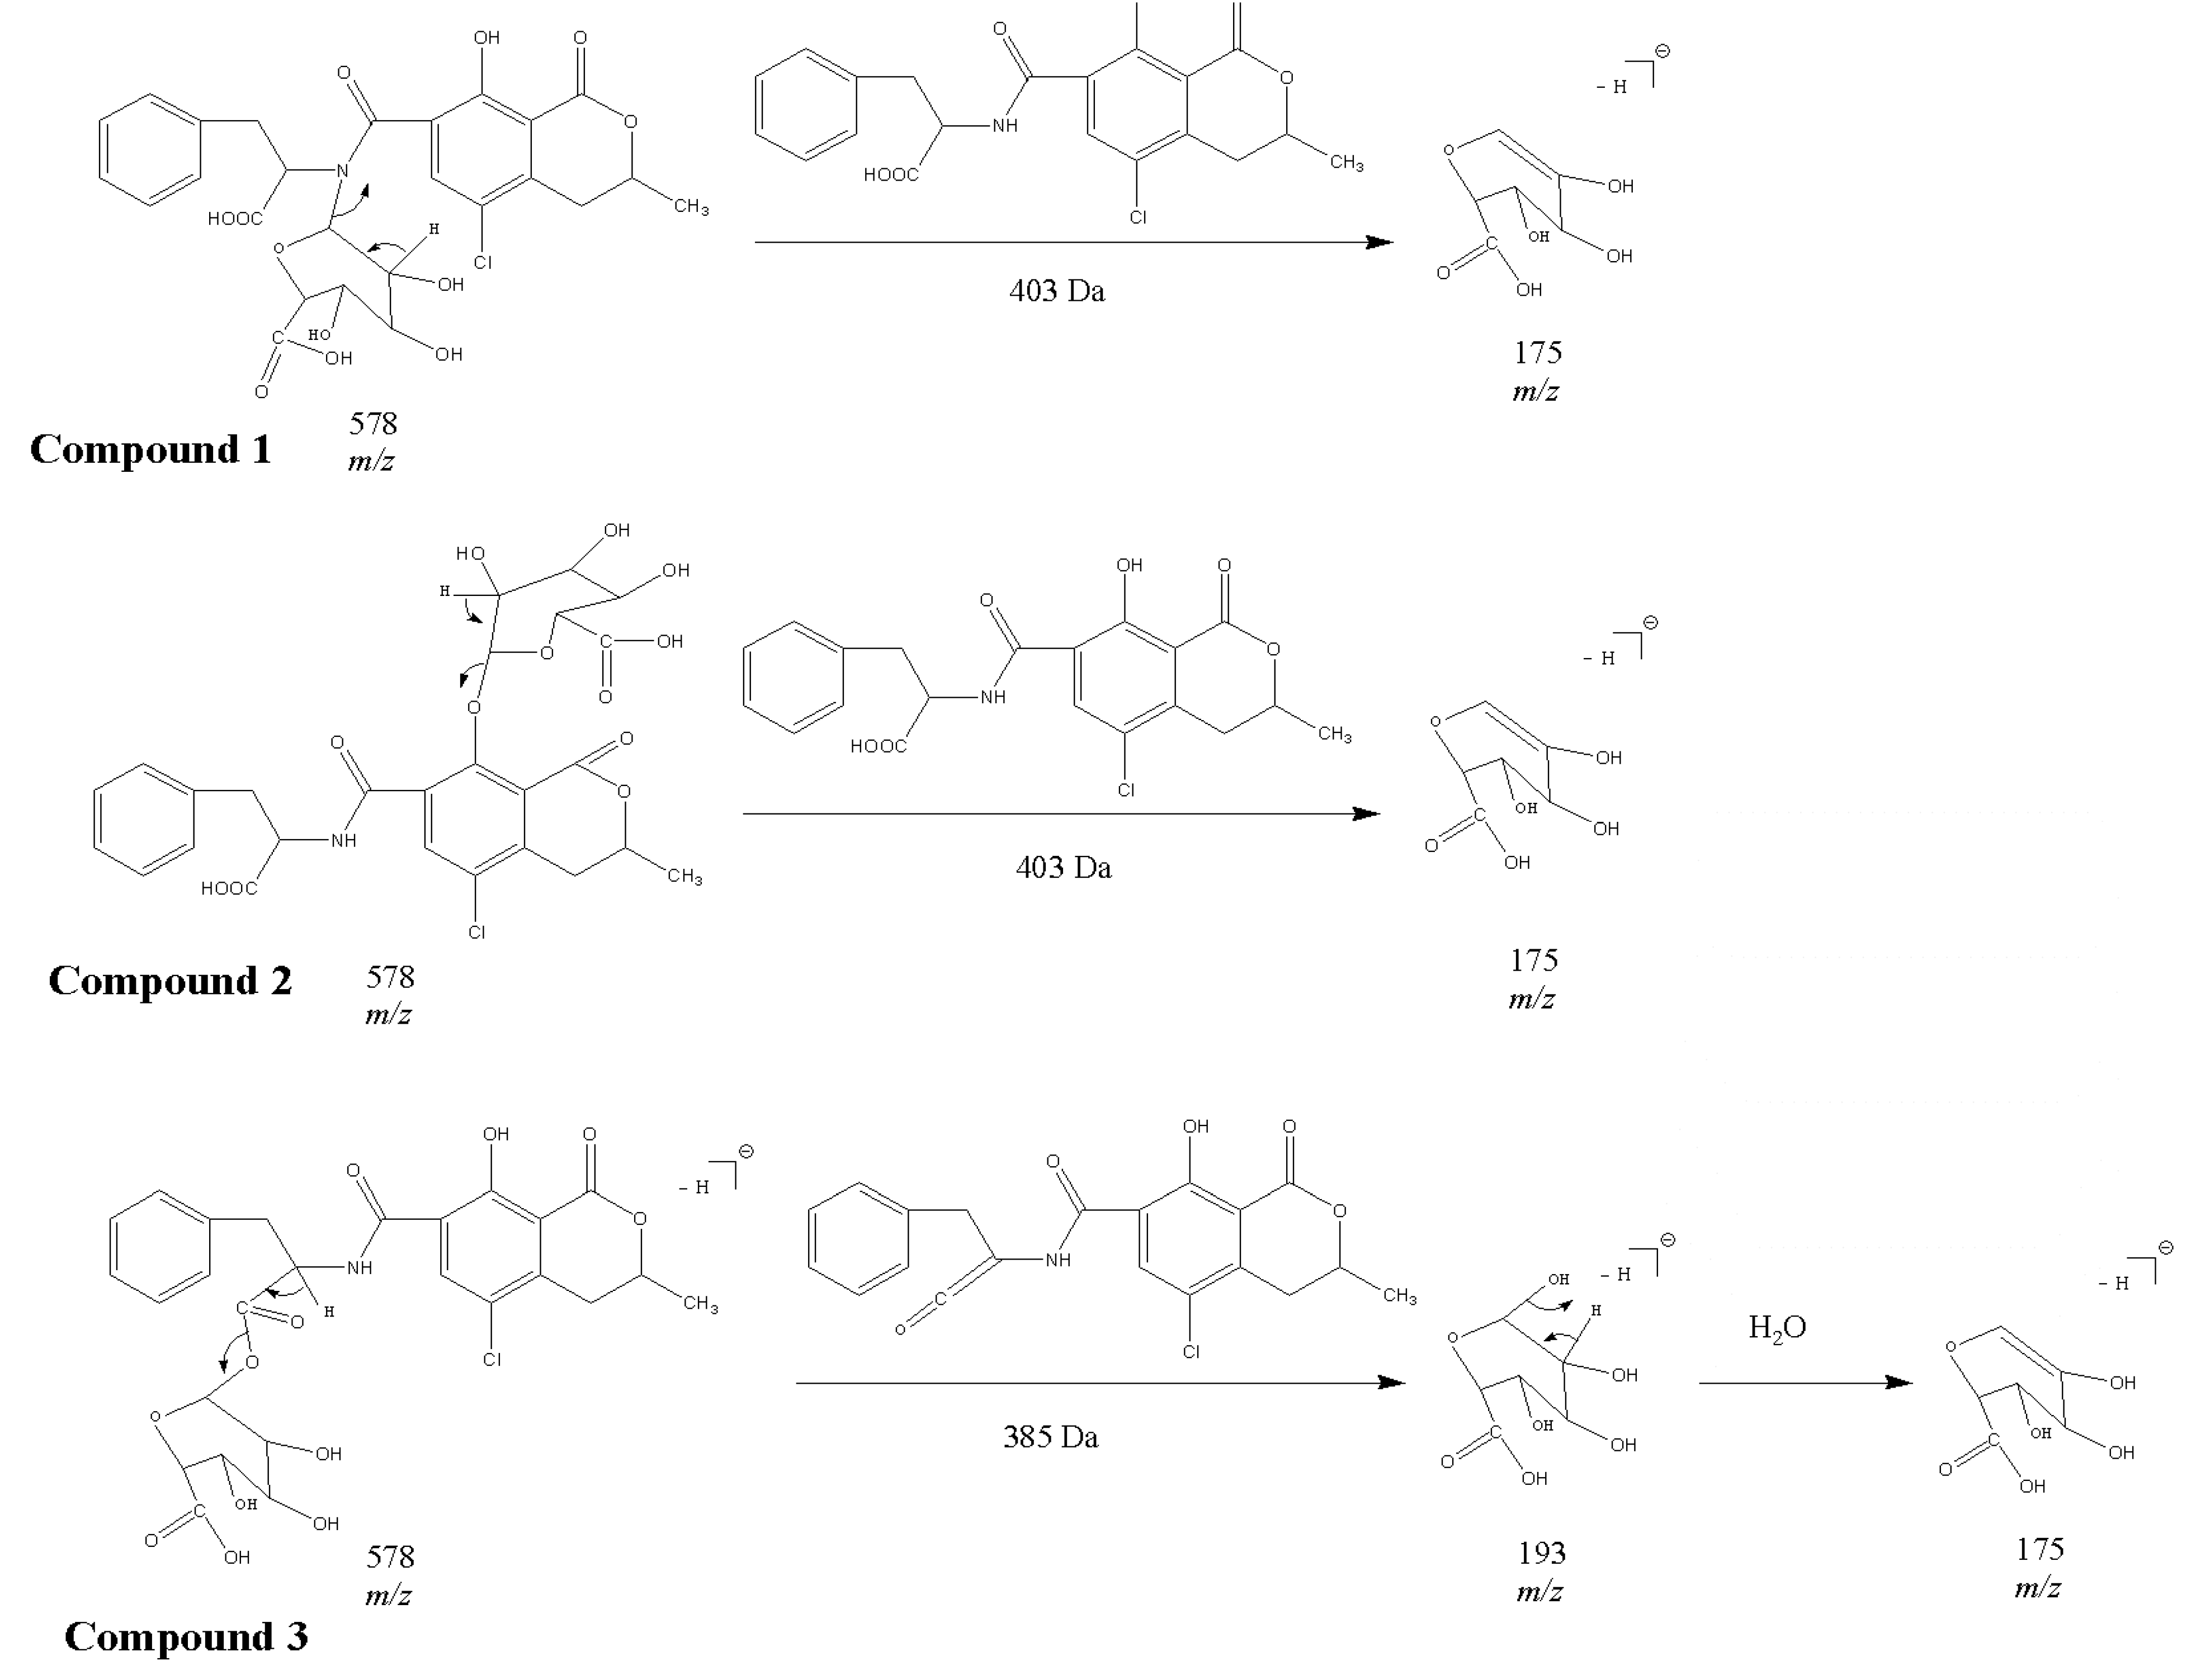
Metabolic profiling, focusing on metabolites of targeted analytes, provides important information on in vivo biotransformation, which is useful in toxicity testing. To identify the metabolites of OTA, liquid chromatography–mass spectrometry LC-MS analyses of reaction mixtures 1, 2, 3 and 4 were performed first. The full scan chromatogram of the Reaction 1 solution under positive electrospray ionization mode (ESI+) mode is shown in Figure 1 and is similar to that of Reaction 2, which indicates that alamethicin does not affect the yield of OTA glucuronides in the current reaction even though it should be used in the glucuronidation of T-2 and HT2 [35]. Four new peaks with retention times at 7.751 min (Compound 1), 8.536 min (Compound 2), 8.733 min (Compound 3) and 11.012 min (Compound 4) were evident while they could not be found in control incubations (Reactions 3 and 4). Special attention should be paid to the fact that OTB existed in Reactions 1, 2 and 3 with the same peak area. After direct injection of the standard solution of OTA, a similar amount of OTB was also detected, suggesting that OTB was the impurity in the standard solution but not formed by dechlorination of OTA.
Figure 1. Full scan chromatograph of the Reaction 1 solution in positive electrospray ionization (ESI+) mode.
Toxins 05 02671 g001

2.1. Compound 1

The negative full-scan mass spectrum showed a signal at m/z 578, which corresponds to the deprotonated molecule. Exact mass measurement of this signal (Table 1) provided the ion formula C26H25O12NCl.
Table 1. Ultra performance liquid chromatography-high resolution mass spectrometry (UHPLC-HRMS) data obtained from the four metabolites in HESI+ and HESI mode. Compounds, polarity, chemical configuration, observed masses, calculated masses and mass error of the molecular are reported.
CompoundPolarityIon formulaObserved m/z (Da)Calculated m/z (Da)Mass error (ppm)
1-3+C26 H27 O12 N Cl580.12042580.12219−0.59
1-3C26 H25 O12 N Cl578.10812578.106512.14
4+C21 H21 O6 N Cl418.10428418.10574−0.91
4C21 H19 O6 N Cl416.09120416.090091.66
Structural elucidation of this compound was accomplished through product ion measurements by UHPLC-MS/MS analysis, and MSn experiments by LC ion trap MS. The product ion spectrum of [M − H] (Figure 2a) showed four fragments at m/z 402, 358, 175 and 113. The fragments at m/z 175 and 113 are known to be diagnostic ions of glucuronate moieties [36], so it is reasonable to suppose that Compound 1 should correspond to a glucuronidated OTA. The fragment with m/z 402 is the negative ion [M − H] of OTA. The fragment ion at m/z 358 results from a neutral loss of CO2, revealing the presence of a carboxylic group, which is in agreement with previous data for OTA fragmentation [21,37,38,39].
Figure 2. Product ion spectra of Compound 1 (a); Compound 2 (b); Compound 3 (c); and Compound 4 (d) using ultra performance liquid chromatography-tandem mass spectrometry (UPLC-MS/MS).
Toxins 05 02671 g002
Positive full-scan spectra of Compound 1 showed the ion at m/z 580 corresponded to [M + H]+, which was also confirmed by UHPLC-HRMS measurements, as shown in Table 1.
The product ion spectrum of [M + H]+ showed different fragments. The protonated glucuronide first lost water and formed the fragment with m/z 562. Commonly, the product ion scan of glucuronide conjugates by LC-MS/MS provides the neutral loss of 176 Da (dehydrated glucuronic acid) due to the cleavage of glycosidic bond, with charge retention by the aglycone moiety. Therefore, as shown in Figure 3a, the mass difference between the ions 580 and 404 (protonated OTA ion), as well as between the fragments 562 and 386, corresponded to 176. The protonated ion at m/z 386, through losing CO, formed the fragments at m/z 358 (Figure 3a).
Figure 3. MSn spectra of Compounds 1–3 (a, b, c) and Compound 4 (d, e, f). (a) MS2 (+) 580; (b) MS3 (+) 580→562; (c) MS4 (+) 580→562→404; (d) MS2 (+) 418; (e) MS3 (+) 418→386; (f) MS4 (+) 418→386→358 using LC ion trap MS.
Toxins 05 02671 g003

2.2. Compounds 2 and 3

The negative full scan showing the deprotonated molecules (m/z 578) of Compounds 2 and 3 were isobaric with the [M − H] of Compound 1, and therefore exhibited the same ion formula C26H25O12NCl (Table 1). The product ion spectrum of [M − H] also showed the same fragments of m/z 402, 358, 175 and 113. Meanwhile, under the ESI+ mode, the same data on the full scan and product ions indicated that Compounds 1, 2 and 3 were isomers, which all belonged to the OTA glucuronide conjugates.

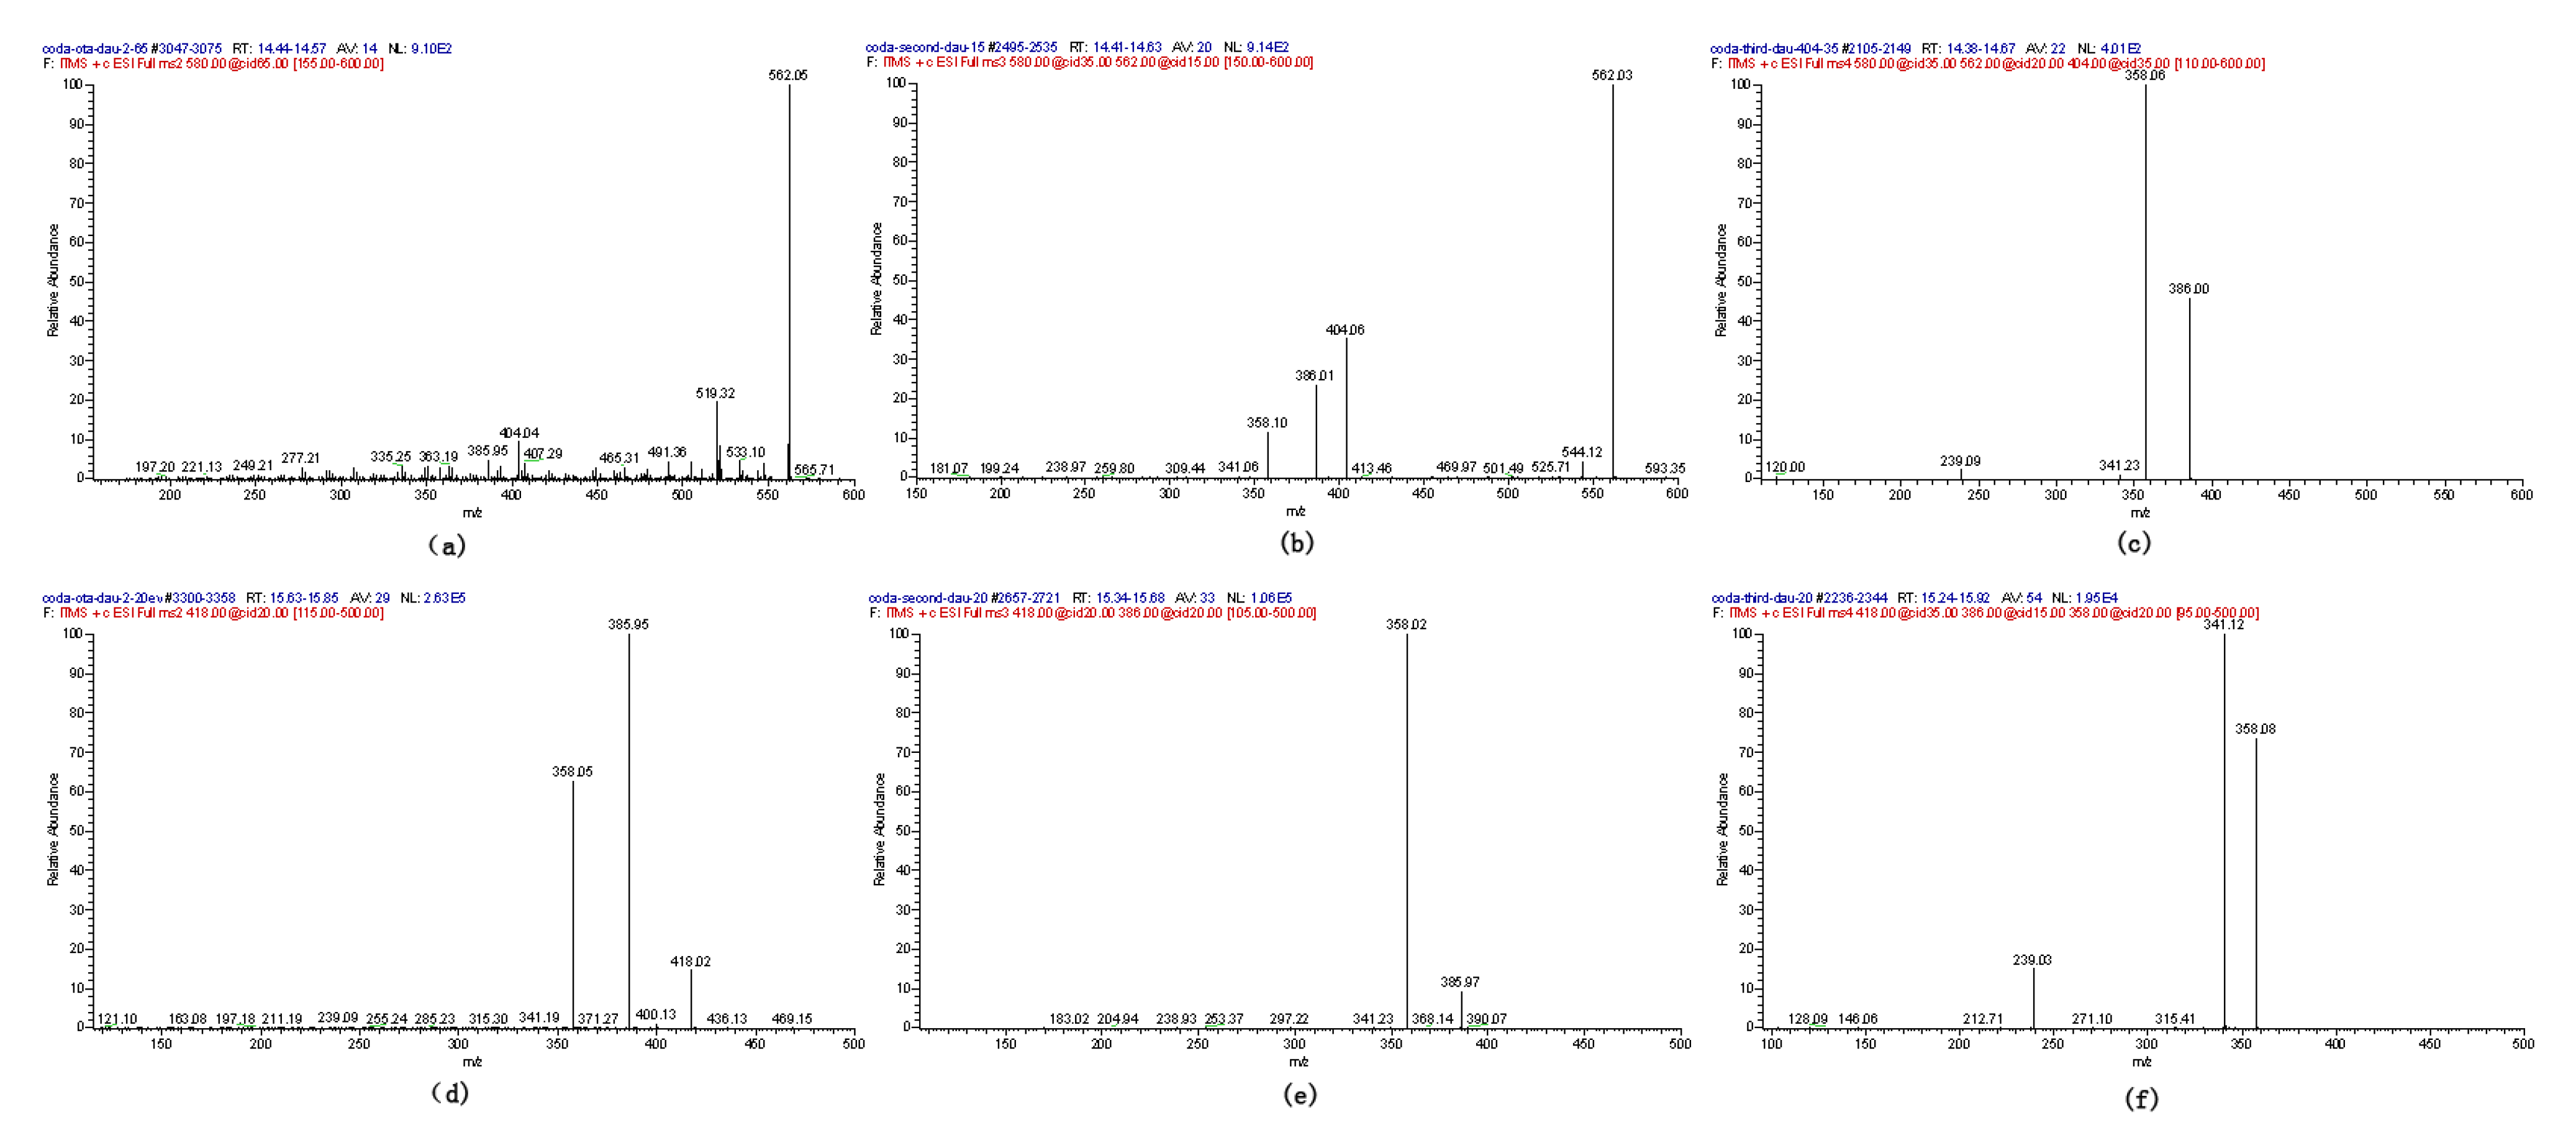
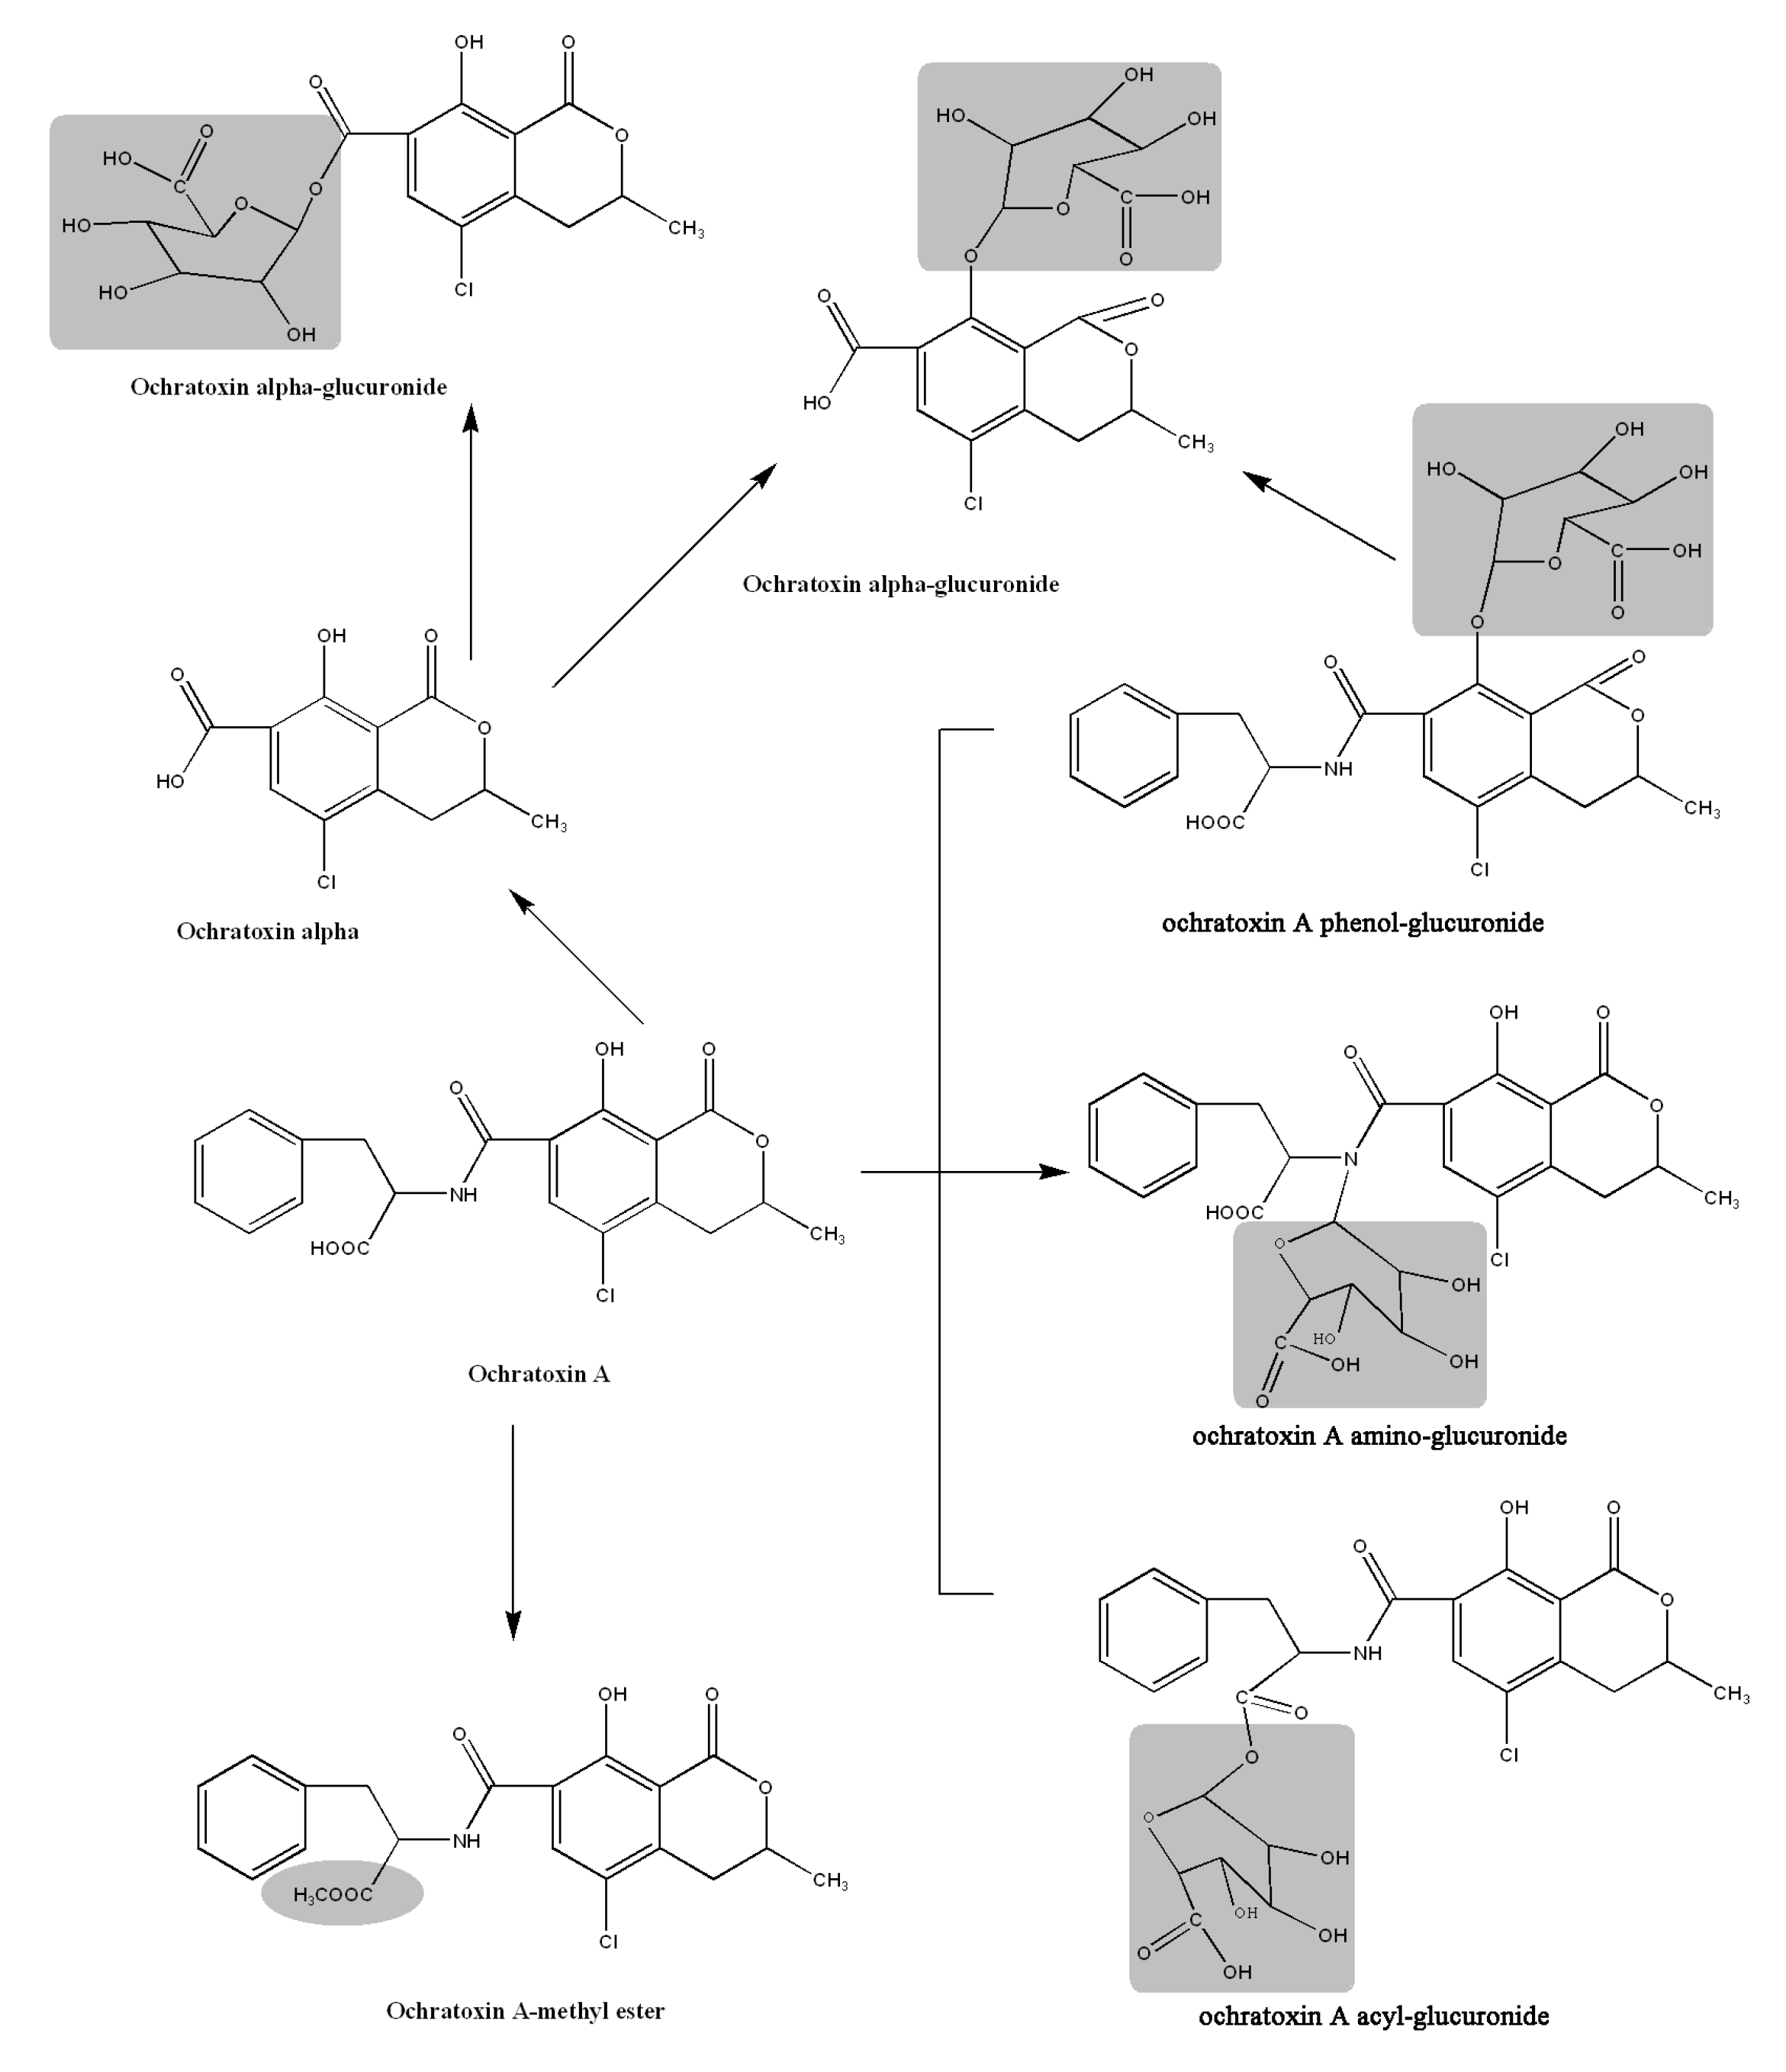
2.3. Acylic, Phenolic and Amino Glucuronides

OTA has three possible glucuronidation sites; in fact, it could form a phenol-, an acyl- or an amino-glucuronide. As shown in Figure 1, only small amounts of Compounds 1–3 were found indicating the low transformation rate from OTA to OTA-glucuronides. All three compounds were unknown and in order to characterize these isomers, different paths including retention times, literature references, MS/MS spectra and non-specific hydrolysis with β-glucuronidase were exploited in this work.
In the chromatographic separation (Figure 1), Compound 1 eluted at a retention time of 7.751 min, 0.785 min less than Compound 2 and 0.978 min less than Compound 3. This means that Compound 1 is the most polar, Compound 2 a bit less and Compound 3 the least polar. From the structure, OTA amino-glucuronide contained one carboxylic group and one phenolic hydroxyl group, so it should be more polar than OTA phenol-glucuronide or acyl-glucuronide. Compared to OTA phenol-glucuronide containing one carboxylic group, OTA acyl-glucuronide should be less polar due to only one phenolic hydroxyl group. Therefore, Compound 1 was proposed to be OTA amino-glucuronide, Compound 2 was OTA phenol-glucuronide and the last one was OTA acyl-glucuronide.
The subsequent analyses of negative electrospray ionization mode (ESI) product ions of the three compounds showed that besides the characteristic fragments (m/z 175 and 113) of glucuronate moieties, an intense peak at m/z 193 corresponding to the glucuronate anion was observed in the spectra of Compound 3 (Figure 2c). The proposed fragmentation pathways of the three glucuronide conjugates are shown in Figure 4. For Compound 1 and Compound 2, the ions at m/z 193 could not be found; as a consequence, the proposed pathway also assigned the structure of acyl-glucuronide to Compound 3. Similar results have been obtained in the previous reports for the other glucuronide conjugates, according to which, in the negative MS2 spectrum of acyl-glucuronide conjugates, the base peak fragment was the glucuronate anion at m/z 193 [36,40,41,42]. To the best of our knowledge, this is the first report to provide direct evidence for OTA-glucuronide generation.
Figure 4. The proposed fragmentation pathways for Compounds 1–3.
Toxins 05 02671 g004
Hydrolysis of the glucuronide conjugates was performed to provide more information for definite identification of the three compounds. The enzyme could hydrolyze the amino-, phenol- and acyl-glucuronide. The contents of the targeted analytes were accurately quantified by the established LC-MS/MS using the standard purified version in the present study. The parameters and collision energies of precursor ions and product ions selected for the analysis are listed in Table 2. The results demonstrated that after hydrolysis by β-glucuronidase, a significant signal decrease was clearly observed for all three compounds with similar extents, indicating their glucuronide forms (Figure S-1, Supplementary Data).
Table 2. The parameters and collision energies of precursor ions, product ions for the targeted analytes.
NamesPrecursor ion (m/z)Primary product ion (m/z)Collision energy (eV)Secondary product ion (m/z)Collision energy (eV)Ionization mode
Compound 1–35803582023938ESI+
OTA methyl ester4183581823932ESI+
OTα2572212010240ESI+

2.4. Identification of Compound 4

The positive and negative full-scan mass spectra analyzed showed the signal at m/z 580 and 578 that corresponded to the protonated and deprotonated molecules, respectively. Exact mass measurement of [M + H] and [M − H]+ (Table 1) provided the ion formula C21H21O6NCl and C21H19O6NCl. After analysis by LC ion trap MS, typical fragments at m/z 386, 358, 341 and 239 indicated that this compound was OTA methyl ester [37] (Figure 3d–f).
Unambiguous confirmation of this compound was obtained by means of OTA methyl ester preparation and from mass spectral comparison. The multiple reaction monitoring (MRM) method was established using the obtained standards (Table 2). The transformation rate from OTA to OTA methyl ester was almost 95% (Figure S-2, Supplementary Data). Then, Reaction 1 and Reaction 2 solutions were analyzed by the established method, and OTA methyl ester was clearly identified. Although a little amount of OTA methyl ester could be found in Reaction 3, the quantity was less than 5% of that in Reaction 1 or 2, in addition to the fact that no OTA methyl was found in Reaction 4, indicating that OTA methyl was not an artifact but produced by this reaction (Figure S-3, Supplementary Data). The reaction conditions in the present study were favorable for the glucuronidation biotransformation resulting in the production of OTA-glucuronides, while esterification reaction in principle could not be catalyzed by microsomes. However, in the present study, it was clearly demonstrated that OTA methyl ester could be produced with relative high content.

2.5. Identification of OTα

As reported, OTα is a very important metabolite [43,44]. However, it was not found in the reaction solution in full scan MS mode. A MRM method for detection of OTα was established by direct injection of the standard solution (1 μg mL−1), with the parameters indicated in Table 2. The solutions of Reactions 1 and 2 before and after hydrolysis were analyzed by the established MRM method. The results showed that a very low content of OTα was present in the solutions of Reactions 1, 2 and 3, however, after hydrolysis, the concentration of OTα in Reactions 1 and 2 significantly increased (Figure S-4, Supplementary Data), indicating the existence of OTα-glucuronide formed by the glucuronidation transformation. It is not surprising that OTα, a major metabolite in vivo, was hardly found in incubations with liver microsomes, since hydrolysis is known to occur in the gut. When peptide cleavage occurs by an unspecific hydrolytic activity in the reaction mixture, OTα is then apparently further conjugated by microsomal UGTs in Reactions 1 and 2. As hydrolysis but not conjugation could occur in Reaction 3, however, a low content of OTα was also found in Mixture 3.

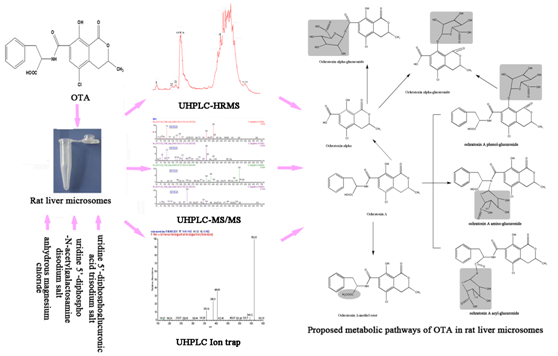
2.6. Proposed Metabolic Pathways

Based on the above observations, the in vitro metabolic profile of OTA via biotransformation by rat liver microsomes is proposed in Figure 5. First, the glucuronidation reaction could occur. There are three possible glucuronidation sites, and OTA has been transformed to phenol-, acyl- and an amino-glucuronide. Second, the Phase I methylation reaction could happen on OTA under such conditions, and a relatively high amount of OTA methyl ester was formed. Last but not least, hydrolysis could occur and OTA was conversed to OTα. The site of hydrolysis was tentatively proposed to be N-C9. Then, OTα was glucuronidated to form OTα-glucuronide. On the other side, OTA-glucuronides also might be directly hydrolyzed to form OTα-glucuronide.
Figure 5. The proposed metabolic pathway for ochratoxin A (OTA) via glucuronidation by rat liver microsomes.
Toxins 05 02671 g005

3. Experimental Section

3.1. Chemicals and Reagents

Methanol and acetonitrile were ultra-high performance liquid chromatography-mass spectrometry (UHPLC-MS) grade from Biosolve (Valkenswaard, the Netherlands). Water was purified by a Milli-Q system (Millipore, Brussels, Belgium). Ammonium acetate (AmAc), ammonium formate (AF), formic acid (FA), uridine 5’-diphosphoglucuronic acid trisodium salt (UDPGA), uridine 5’-diphospho-N-acetylgalactosamine disodium salt (UDPAG), anhydrous magnesium chloride (MgCl2) and 2-amino-2-(hydroxymethyl)-1,3-propanediol (Tris) were from Sigma-Aldrich (Saint Louis, MO, USA). β-glucuronidase and microsomes (pooled from male rat liver) were from Sigma-Aldrich (Saint Louis, MO, USA).
Ochratoxin A (OTA) and ochratoxin α (OTα) were from Coring System Diagnostix GmbH (Gernshein, Germany). Accurately weighed solid portions of OTA and OTα standards were dissolved in acetonitrile to prepare 0.5 mg mL−1 of stock solutions.
The OTA methyl ester was prepared according to the previous report with a minor modification [45]. The OTA standard solution (0.5 mL) was mixed with 9 mL of methanol and 0.5 mL of 12 N HCl, and incubated for 24 h at room temperature. Afterwards, 2.5 mL of extracts were dried under a nitrogen stream, redissolved with 1.5 mL of methanol and ready for analysis.

3.2. UHPLC-MS/MS Analysis

The LC system consisted of an Acquity UPLC® H-class (Waters, Milford, MA, USA). The compounds were separated on an Acquity® UPLC HSS T3 column (100 mm × 2.1 mm, 1.7 μm) at 40 °C, with a mobile phase flow rate of 0.5 mL min−1. The mobile phase consisted of (A) 10 mmol L−1 ammonium acetate solution, (B) water and (C) methanol. A linear gradient elution program was applied as follows: 0 min 1% A and 29% C, 10 min 1% A and 59% C, 10.2 min 1% A and 99% C, 11 min 1% A and 99% C, 11.8 min 1% A and 29% C, and hold on for a further 2.2 min for re-equilibration, giving a total run time of 13 min. The injection volume was 5.0 μL (partial loop with needle overfill).
A XEVO TQ-S® mass spectrometer (Waters) was used for the analysis of the target compounds. Full scan analysis was performed both in the positive electrospray ionization mode (ESI+) and the negative electrospray ionization (ESI) mode. The following settings were used: source temperature, 150 °C; desolvation temperature, 500 °C, scan range, m/z 100–1000, inter-scan delay, 0.01 s. The cone and desolvation gas flows were 30 and 1,000 L h−1, respectively. Data acquisition and processing were performed using MassLynx v4.1 (Waters).

3.3. UHPLC-Orbitrap-HRMS Analysis

UHPLC-ExactiveTM Benchtop Orbitrap mass spectrometer (Thermo Fisher Scientific, San José, CA, USA) analysis in the full scan mode (m/z, 100–1000) was utilized for the metabolic profiling study. Chromatographic separation was achieved on a Zorbax Eclipse Plus C18 column (100 mm × 2.1 mm, 1.8 μm) at 30 °C, with a mobile phase flow rate of 0.4 mL min1. The mobile phase consisted of (A) water/methanol (5/95, v/v) containing 0.1% formic acid and 10 mM ammonium formate and (B) water/methanol (95/5, v/v) containing 0.1% formic acid and 10 mM ammonium formate. A linear gradient elution program was applied as follows: 0 min 0% B, 0.5 min 0% B, 20 min 99.1% B, 21 min 99.1% B, 24 min 0% B and hold on for a further 4 min for re-equilibration, giving a total run time of 28 min. The injection volume was 5.0 μL. The mass spectrometer was operated both in HESI+ and in HESI. The following settings were used: spray voltage, 4.5 kV; capillary temperature, 250 °C; heater temperature, 250 °C; sheath gas flow, 45 a.u.; auxiliary gas, 10 a.u; sweep gas, 2 a.u., resolution 100000 FWHM at 1 Hz (1 scan per second). The automatic gain control (AGC) target was set at high dynamic range (3e6), and the maximum injection time was 20 ms. Initial instrument calibration was achieved by infusing calibration mixtures (Thermo Fisher Scientific) for positive and negative ion modes. The positive calibration mixture included caffeine, Met-Arg-Phe-Ala acetate salt (MRFA) and Ultramark 1621®, while the negative calibration solution comprised sodium dodecyl sulfate, sodium taurocholate and Ultramark 1621®. These compounds were dissolved in a mixture of acetonitrile, water and methanol, and both mixtures were infused with a Chemyx Fusion 100 syringe pump (Thermo Fisher Scientific). Data were acquired and processed by Xcalibur 2.1 and Sieve 2.0 software (Thermo Fisher Scientific, Brookfield, Los Angeles, CA, USA).

3.4. LC-Ion-Trap Analysis

HPLC-ion-trap-MS system (Thermo Fisher Scientific) was used for the fragments analysis of the targeted analytes. The column used was an X-bridge C18 column (3.5 μm, 2.1 × 150 mm), supplied by Waters (Milford, MA, USA). The mobile phase consisted of (A) water/methanol (5/95, v/v) containing 0.1% formic acid and 10 mM ammonium formate and (B) water/methanol (95/5, v/v) containing 0.1% formic acid and 10 mM ammonium formate. The linear gradient elution program for LC-Ion-trap analysis was: 0–1 min B = 50%, 1–13 min B = 50%–97%, 13–18 min B = 97%, 18–19 min B = 97%–50%, and hold on for a further 6 min for re-equilibration, giving a total run time of 25 min. The mass spectrometer was operated both in HESI+ and in HESI with the following settings: source voltage of 5 kV, capillary temperature of 250 °C; heater temperature of 175 °C; sheath gas flow of 45 a.u.; aux gas of 10 a.u. The Xcalibur 2.0.7 software (Thermo Scientific) was used for instrument control, data acquisition and processing.

3.5. Model Reactions

The in vitro metabolic study of OTA via glucuronidation biotransformation by rat liver microsomes (Sigma-Aldrich, Saint Louis, MO, USA) was performed based on a slightly modified procedure adopted from Wu et al. [46] and Welsch et al. [35] for synthesis of DON-glucuronides.
Reaction 1: An aliquot of OTA stock solution (241.8 μL, 0.3 μM) was transferred into a 5 mL tube and dried by nitrogen gas under 40 °C. Next, 15 μM of UDPGA, 0.25 μM of UDPAG and 5 μM of MgCl2 were added and all these reagents were dissolved in 400 μL of 50 mM Tris-HCl buffer (pH = 7.4). Rat liver microsomes (100 μL) were firstly mixed with 5 μg of alamethicin and kept on ice for 10 min before adding into the tubes. Then, the 500 μL reaction mixture was inverted a few times and incubated at 37 °C in a water bath for 1.5 h. The reaction was terminated by addition of 1 mL of methanol, vortexed for 30 s and centrifuged at 14,000 rpm for 10 min. The supernatant (100 µL) was diluted with 900 μL of methanol/water solution (20/80, v/v) and was ready for injection.
Reaction 2: An aliquot of OTA stock solution (241.8 μL, 0.3 μM) was transferred to a 5 mL tube and dried by nitrogen gas under 40 °C. Next, 15 μM of UDPGA, 0.25 μM of UDPAG and 5 μM of MgCl2 were added and all these reagents were dissolved in 400 μL of 50 mM Tris-HCl buffer (pH = 7.4). Then 100 μL (~2 mg of microsomal protein) of rat liver microsomes were added. The reaction mixture (500 μL) was subsequently pretreated as reaction 1.
Reaction 3: A blank reaction was performed using the same procedure and ingredients as in reaction 2, except for UDPGA.
Reaction 4: A control reaction was also performed using the same procedure and ingredients as in Reaction 2, except for OTA.

3.6. Hydrolysis of the Glucuronides

Hydrolysis of the reaction solution was performed for further identification of the OTA-glucuronides. An aliquot of the reaction solution (10 μL) was incubated with β-glucuronidase (1.5 units/reaction) (type IX, from E. coli, Sigma-Aldrich, Saint Louis, MO, USA) at 37 °C in 0.25 mL of 0.1 M NaAc buffer (pH = 5) for 18 h. The reaction was terminated by addition of 1 mL methanol, vortexed for 30 s and centrifuged at 14,000 rpm for 10 min. The supernatant was passed through a 0.22 μm nylon filter and was ready for injection

4. Conclusions

To address the remaining uncertainties regarding OTA biotransformation by liver microsomes, UHPLC-MS/MS, UHPLC-Orbitrap-HRMS and LC-ion-trap were applied as combined strategies to investigate the metabolic profile of OTA via glucuronidation by rat liver microsomes. Three different OTA glucuronide conjugates, which corresponded to OTA amino-glucuronide, OTA phenol-glucuronide and OTA acyl-glucuronide were clearly identified. The suggested structures were supported by the fragments observed in the mass spectrometers and by hydrolysis with β-glucuronidase. OTA methyl ester, OTα and OTα-glucuronide were formed in the same reaction mixture. A possible in vitro biotransformation pathway of OTA in rat microsomes was proposed. The results obtained here will help to have deeper understanding on the theoretical basis of OTA clinical toxicology.

Acknowledgements

This research was financially supported by the National Basic Research Program of China (2013CB127801), Shanghai Technical Standards Project (12DZ0502801), Shanghai Science Foundation for Youths (12ZR1448900) and the Chinese-Belgian Joint Project of BELSPO, Belgium (BL/02/C58) and MOST, China (2012DFG31840).

Conflicts of Interest

The authors declare no conflict of interest.

References

  1. Rizzo, I.; Vedoya, G.; Maurutto, S.; Haidukowski, M.; Varsavsky, E. Assessment of toxigenic fungi on Argentinean medicinal herbs. Microbiol. Res. 2004, 159, 113–120. [Google Scholar] [CrossRef]
  2. Obrecht-Pflumio, S.; Chassat, T.; Dirheimer, G.; Marzin, D. Genotoxicity of ochratoxin A by Salmonella mutagenicity test after bioactivation by mouse kidney microsomes. Mutat. Res. 1999, 446, 95–102. [Google Scholar] [CrossRef]
  3. Huff, J.E. Carcinogenicity of ochratoxin A in experimental animals. IARC Sci. Publ. 1991, 229–244. [Google Scholar]
  4. Gagliano, N.; Donne, I.D.; Torri, C.; Migliori, M.; Grizzi, F.; Milzani, A.; Filippi, C.; Annoni, G.; Colombo, P.; Costa, F.; et al. Early cytotoxic effects of ochratoxin A in rat liver: A morphological, biochemical and molecular study. Toxicology 2006, 225, 214–224. [Google Scholar] [CrossRef]
  5. Gagliano, N.; Torri, C.; Donetti, E.; Grizzi, F.; Costa, F.; Bertelli, A.A.; Migliori, M.; Filippi, C.; Bedoni, M.; Panichi, V.; Giovannini, L.; Gioia, M. Ochratoxin A-induced renal cortex fibrosis and epithelial-to-mesenchymal transition: molecular mechanisms of ochratoxin A-injury and potential effects of red wine. Mol. Med. 2005, 11, 30–38. [Google Scholar]
  6. Pfohl-Leszkowicz, A.; Manderville, R.A. Ochratoxin A: An overview on toxicity and carcinogenicity in animals and humans. Mol. Nutr. Food Res. 2007, 51, 61–99. [Google Scholar] [CrossRef]
  7. Pfohl-Leszkowicz, A.; Manderville, R.A. An update on direct genotoxicity as a molecular mechanism of ochratoxin a carcinogenicity. Chem. Res. Toxicol. 2012, 25, 252–262. [Google Scholar] [CrossRef]
  8. Castegnaro, M.; Canadas, D.; Vrabcheva, T.; Petkova-Bocharova, T.; Chernozemsky, I.N.; Pfohl-Leszkowicz, A. Balkan endemic nephropathy: Role of ochratoxins A through biomarkers. Mol. Nutr. Food Res. 2006, 50, 519–529. [Google Scholar] [CrossRef]
  9. Pfohl-Leszkowicz, A.; Petkova-Bocharova, T.; Chernozemsky, I.N.; Castegnaro, M. Balkan endemic nephropathy and associated urinary tract tumours: A review on aetiological causes and the potential role of mycotoxins. Food Addit. Contam. 2002, 19, 282–302. [Google Scholar] [CrossRef]
  10. Pfohl-Leszkowicz, A.; Tozlovanu, M.; Manderville, R.; Peraica, M.; Castegnaro, M.; Stefanovic, V. New molecular and field evidences for the implication of mycotoxins but not aristolochic acid in human nephropathy and urinary tract tumor. Mol. Nutr. Food Res. 2007, 51, 1131–1146. [Google Scholar] [CrossRef]
  11. Pfohl-Leszkowicz, A. Ochratoxin A and aristolochic acid involvement in nephropathies and associated urothelial tract tumours. Arh. Hig. Rada. Toksikol. 2009, 60, 465–483. [Google Scholar]
  12. International Agency for Research on Cancer (IARC). Monograph on the Evaluation of Carcinogenic Risk to Humans; IARC: Lyon, France, 2002; Volume 82, pp. 171–300. [Google Scholar]
  13. Commission Regulation (EC). No 1881/2006 of 19 December 2006 setting maximum levels for certain contaminants in foodstuffs. 2001; 466. [Google Scholar]
  14. EFSA Panel on Contaminants in the Food Chain (CONTAM). Opinion of the Scientific Panel on contaminants in the food chain [CONTAM] related to ochratoxin A in food. 2006. [Google Scholar]
  15. Milićević Dragan, R.; Jurić Verica, B.; Vuković Dubravka, Z.; Mandić Miodrag, M.; Baltić Tatjana, M. Residue of ochratoxin A in swine tissues: Risk assessment. Arch. Oncol. 2009, 17, 56–60. [Google Scholar] [CrossRef]
  16. Duarte, S.C.; Pena, A.; Lino, C.M. Human ochratoxin a biomarkers—From exposure to effect. Crit. Rev. Toxicol. 2011, 41, 187–212. [Google Scholar] [CrossRef]
  17. Malir, F.; Ostry, V.; Pfohl-Leszkowicz, A.; Roubal, T. Ochratoxin A exposure biomarkers in the Czech Republic and comparison with foreign countries. Biomarkers 2012, 17, 577–589. [Google Scholar] [CrossRef]
  18. Han, Z.; Zhao, Z.; Shi, J.; Liao, Y.; Zhao, Z.; Zhang, D.; Wu, Y.; De Saeger, S.; Wu, A. Combinatorial approach of LC-MS/MS and LC-TOF-MS for uncovering in vivo kinetics and biotransformation of ochratoxin A in rat. J. Chromatogr. B 2013, 925, 46–53. [Google Scholar] [CrossRef]
  19. Pfohl-Leszkowicz, A.; Castegnaro, M. Further arguments in favour of direct covalent binding of Ochratoxin A (OTA) after metabolic biotransformation. Food Addit. Contam. 2005, 22 Suppl 1, 75–87. [Google Scholar] [CrossRef]
  20. Ringot, D.; Chango, A.; Schneider, Y.J.; Larondelle, Y. Toxicokinetics and toxicodynamics of ochratoxin A, an update. Chem. Biol. Interact. 2006, 159, 18–46. [Google Scholar] [CrossRef]
  21. Faucet-Marquis, V.; Pont, F.; Stormer, F.C.; Rizk, T.; Castegnaro, M.; Pfohl-Leszkowicz, A. Evidence of a new dechlorinated ochratoxin A derivative formed in opossum kidney cell cultures after pretreatment by modulators of glutathione pathways: correlation with DNA-adduct formation. Mol. Nutr. Food Res. 2006, 50, 530–542. [Google Scholar] [CrossRef]
  22. Wu, Q.; Dohnal, V.; Huang, L.; Kuca, K.; Wang, X.; Chen, G.; Yuan, Z. Metabolic pathways of ochratoxin A. Curr. Drug Metab. 2011, 12, 1–10. [Google Scholar] [CrossRef]
  23. Manderville, R.A.; Pfohl-Leszkowicz, A. Bioactivation and DNA adduction as a rationale for ochratoxin A carcinogenesis. World Mycotoxin J. 2008, 1, 357–367. [Google Scholar] [CrossRef]
  24. Tozlovanu, M.; Faucet-Marquis, V.; Pfohl-Leszkowicz, A.; Manderville, R.A. Genotoxicity of the hydroquinone metabolite of ochratoxin A: structure-activity relationships for covalent DNA adduction. Chem. Res. Toxicol. 2006, 19, 1241–1247. [Google Scholar] [CrossRef]
  25. Tozlovanu, M.; Canadas, D.; Pfohl-Leszkowicz, A.; Frenette, C.; Paugh, R.J.; Manderville, R.A. Glutathione conjugates of ochratoxin A as biomarkers of exposure. Arh. Hig. Rada. Toksikol. 2012, 63, 417–427. [Google Scholar]
  26. Jennings-Gee, J.E.; Tozlovanu, M.; Manderville, R.; Miller, M.S.; Pfohl-Leszkowicz, A.; Schwartz, G.G. Ochratoxin A: In utero exposure in mice induces adducts in testicular DNA. Toxins 2010, 2, 1428–1444. [Google Scholar] [CrossRef] [Green Version]
  27. Maul, R.; Warth, B.; Kant, J.S.; Schebb, N.H.; Krska, R.; Koch, M.; Sulyok, M. Investigation of the hepatic glucuronidation pattern of the Fusarium mycotoxin deoxynivalenol in various species. Chem. Res. Toxicol. 2012, 25, 2715–2717. [Google Scholar] [CrossRef]
  28. Warth, B.; Sulyok, M.; Berthiller, F.; Schuhmacher, R.; Krska, R. New insights into the human metabolism of the Fusarium mycotoxins deoxynivalenol and zearalenone. Toxicol. Lett. 2013, 220, 88–94. [Google Scholar] [CrossRef]
  29. Mikula, H.; Weber, J.; Lexmuller, S.; Bichl, G.; Schwartz, H.; Varga, E.; Berthiller, F.; Hametner, C.; Krska, R.; Frohlich, J. Simultaneous preparation of alpha/beta-zearalenol glucosides and glucuronides. Carbohydr. Res. 2013, 373, 59–63. [Google Scholar] [CrossRef]
  30. Shephard, G.S.; Burger, H.M.; Gambacorta, L.; Gong, Y.Y.; Krska, R.; Rheeder, J.P.; Solfrizzo, M.; Srey, C.; Sulyok, M.; Visconti, A.; et al. Multiple mycotoxin exposure determined by urinary biomarkers in rural subsistence farmers in the former Transkei, South Africa. Food Chem. Toxicol. 2013, 62, 217–225. [Google Scholar] [CrossRef]
  31. Warth, B.; Sulyok, M.; Fruhmann, P.; Mikula, H.; Berthiller, F.; Schuhmacher, R.; Hametner, C.; Abia, W.A.; Adam, G.; Frohlich, J.; et al. Development and validation of a rapid multi-biomarker liquid chromatography/tandem mass spectrometry method to assess human exposure to mycotoxins. Rapid Commun. Mass Spectrom. 2012, 26, 1533–1540. [Google Scholar] [CrossRef]
  32. Li, S.; Marquardt, R.R.; Frohlich, A.A.; Vitti, T.G.; Crow, G. Pharmacokinetics of ochratoxin A and its metabolites in rats. Toxicol. Appl. Pharmacol. 1997, 145, 82–90. [Google Scholar] [CrossRef]
  33. Kuhn, I.; Valenta, H.; Rohr, K. Determination of ochratoxin A in bile of swine by high-performance liquid chromatography. J. Chromatogr. B 1995, 668, 333–337. [Google Scholar] [CrossRef]
  34. Gross-Steinmeyer, K.; Weymann, J.; Hege, H.G.; Metzler, M. Metabolism and lack of DNA reactivity of the mycotoxin ochratoxin A in cultured rat and human primary hepatocytes. J. Agric. Food. Chem. 2002, 50, 938–945. [Google Scholar] [CrossRef]
  35. Welsch, T.; Humpf, H.U. HT-2 Toxin 4-glucuronide as new T-2 toxin metabolite: Enzymatic synthesis, analysis, and species specific formation of T-2 and HT-2 toxin glucuronides by rat, mouse, pig, and human liver microsomes. J. Agric. Food. Chem. 2012, 60, 10170–10178. [Google Scholar] [CrossRef]
  36. Scapolla, C.; Cangemi, G.; Barco, S.; Barbagallo, L.; Bugnone, D.; Maffia, A.; Melioli, G.; Profumo, A.; Benatti, U.; Damonte, G. Identification and structural characterization by LC-ESI-IONTRAP and LC-ESI-TOF of some metabolic conjugation products of homovanillic acid in urine of neuroblastoma patients. J. Mass Spectrom. 2012, 47, 816–824. [Google Scholar] [CrossRef]
  37. Han, Z.; Zheng, Y.; Luan, L.; Ren, Y.; Wu, Y. Analysis of ochratoxin A and ochratoxin B in traditional Chinese medicines by ultra-high-performance liquid chromatography-tandem mass spectrometry using [(13)C(20)]-ochratoxin A as an internal standard. J. Chromatogr. A 2010, 1217, 4365–4374. [Google Scholar] [CrossRef]
  38. Frenette, C.; Paugh, R.J.; Tozlovanu, M.; Juzio, M.; Pfohl-Leszkowicz, A.; Manderville, R.A. Structure-activity relationships for the fluorescence of ochratoxin A: Insight for detection of ochratoxin A metabolites. Anal. Chim. Acta 2008, 617, 153–161. [Google Scholar] [CrossRef]
  39. Hadjeba-Medjdoub, K.; Tozlovanu, M.; Pfohl-Leszkowicz, A.; Frenette, C.; Paugh, R.J.; Manderville, R.A. Structure-activity relationships imply different mechanisms of action for ochratoxin A-mediated cytotoxicity and genotoxicity. Chem. Res. Toxicol. 2012, 25, 181–190. [Google Scholar] [CrossRef]
  40. Jaggi, R.; Addison, R.S.; King, A.R.; Suthers, B.D.; Dickinson, R.G. Conjugation of desmethylnaproxen in the rat—A novel acyl glucuronide-sulfate diconjugate as a major biliary metabolite. Drug Metab. Dispos. 2002, 30, 161–166. [Google Scholar] [CrossRef]
  41. Wen, Z.; Tallman, M.N.; Ali, S.Y.; Smith, P.C. UDP-glucuronosyltransferase 1A1 is the principal enzyme responsible for etoposide glucuronidation in human liver and intestinal microsomes: Structural characterization of phenolic and alcoholic glucuronides of etoposide and estimation of enzyme kinetics. Drug Metab. Dispos. 2007, 35, 371–380. [Google Scholar]
  42. Srinivasan, K.; Nouri, P.; Kavetskaia, O. Challenges in the indirect quantitation of acyl-glucuronide metabolites of a cardiovascular drug from complex biological mixtures in the absence of reference standards. Biomed. Chromatogr. 2010, 24, 759–767. [Google Scholar] [CrossRef]
  43. Munoz, K.; Blaszkewicz, M.; Degen, G.H. Simultaneous analysis of ochratoxin A and its major metabolite ochratoxin alpha in plasma and urine for an advanced biomonitoring of the mycotoxin. J. Chromatogr. B 2010, 878, 2623–2629. [Google Scholar] [CrossRef]
  44. Coronel, M.B.; Marin, S.; Tarrago, M.; Cano-Sancho, G.; Ramos, A.J.; Sanchis, V. Ochratoxin A and its metabolite ochratoxin alpha in urine and assessment of the exposure of inhabitants of Lleida, Spain. Food Chem. Toxicol. 2011, 49, 1436–1442. [Google Scholar] [CrossRef]
  45. Almela, L.; Rabe, V.; Sanchez, B.; Torrella, F.; Lopez-Perez, J.P.; Gabaldon, J.A.; Guardiola, L. Ochratoxin A in red paprika: relationship with the origin of the raw material. Food Microbiol. 2007, 24, 319–327. [Google Scholar] [CrossRef]
  46. Wu, X.; Murphy, P.; Cunnick, J.; Hendrich, S. Synthesis and characterization of deoxynivalenol glucuronide: Its comparative immunotoxicity with deoxynivalenol. Food Chem. Toxicol. 2007, 45, 1846–1855. [Google Scholar] [CrossRef]

Supplementary Files

  • Supplementary File 1:

    Supplementary Data (PDF, 525 KB)

  • Share and Cite

    MDPI and ACS Style

    Han, Z.; Tangni, E.K.; Di Mavungu, J.D.; Vanhaecke, L.; De Saeger, S.; Wu, A.; Callebaut, A. In Vitro Glucuronidation of Ochratoxin A by Rat Liver Microsomes. Toxins 2013, 5, 2671-2685. https://doi.org/10.3390/toxins5122671

    AMA Style

    Han Z, Tangni EK, Di Mavungu JD, Vanhaecke L, De Saeger S, Wu A, Callebaut A. In Vitro Glucuronidation of Ochratoxin A by Rat Liver Microsomes. Toxins. 2013; 5(12):2671-2685. https://doi.org/10.3390/toxins5122671

    Chicago/Turabian Style

    Han, Zheng, Emmanuel K. Tangni, José Diana Di Mavungu, Lynn Vanhaecke, Sarah De Saeger, Aibo Wu, and Alfons Callebaut. 2013. "In Vitro Glucuronidation of Ochratoxin A by Rat Liver Microsomes" Toxins 5, no. 12: 2671-2685. https://doi.org/10.3390/toxins5122671

    Article Metrics

    Back to TopTop