Appetite and Gut Hormones Response to a Putative α-Glucosidase Inhibitor, Salacia Chinensis, in Overweight/Obese Adults: A Double Blind Randomized Controlled Trial


Abstract
:1. Introduction
2. Materials and Methods
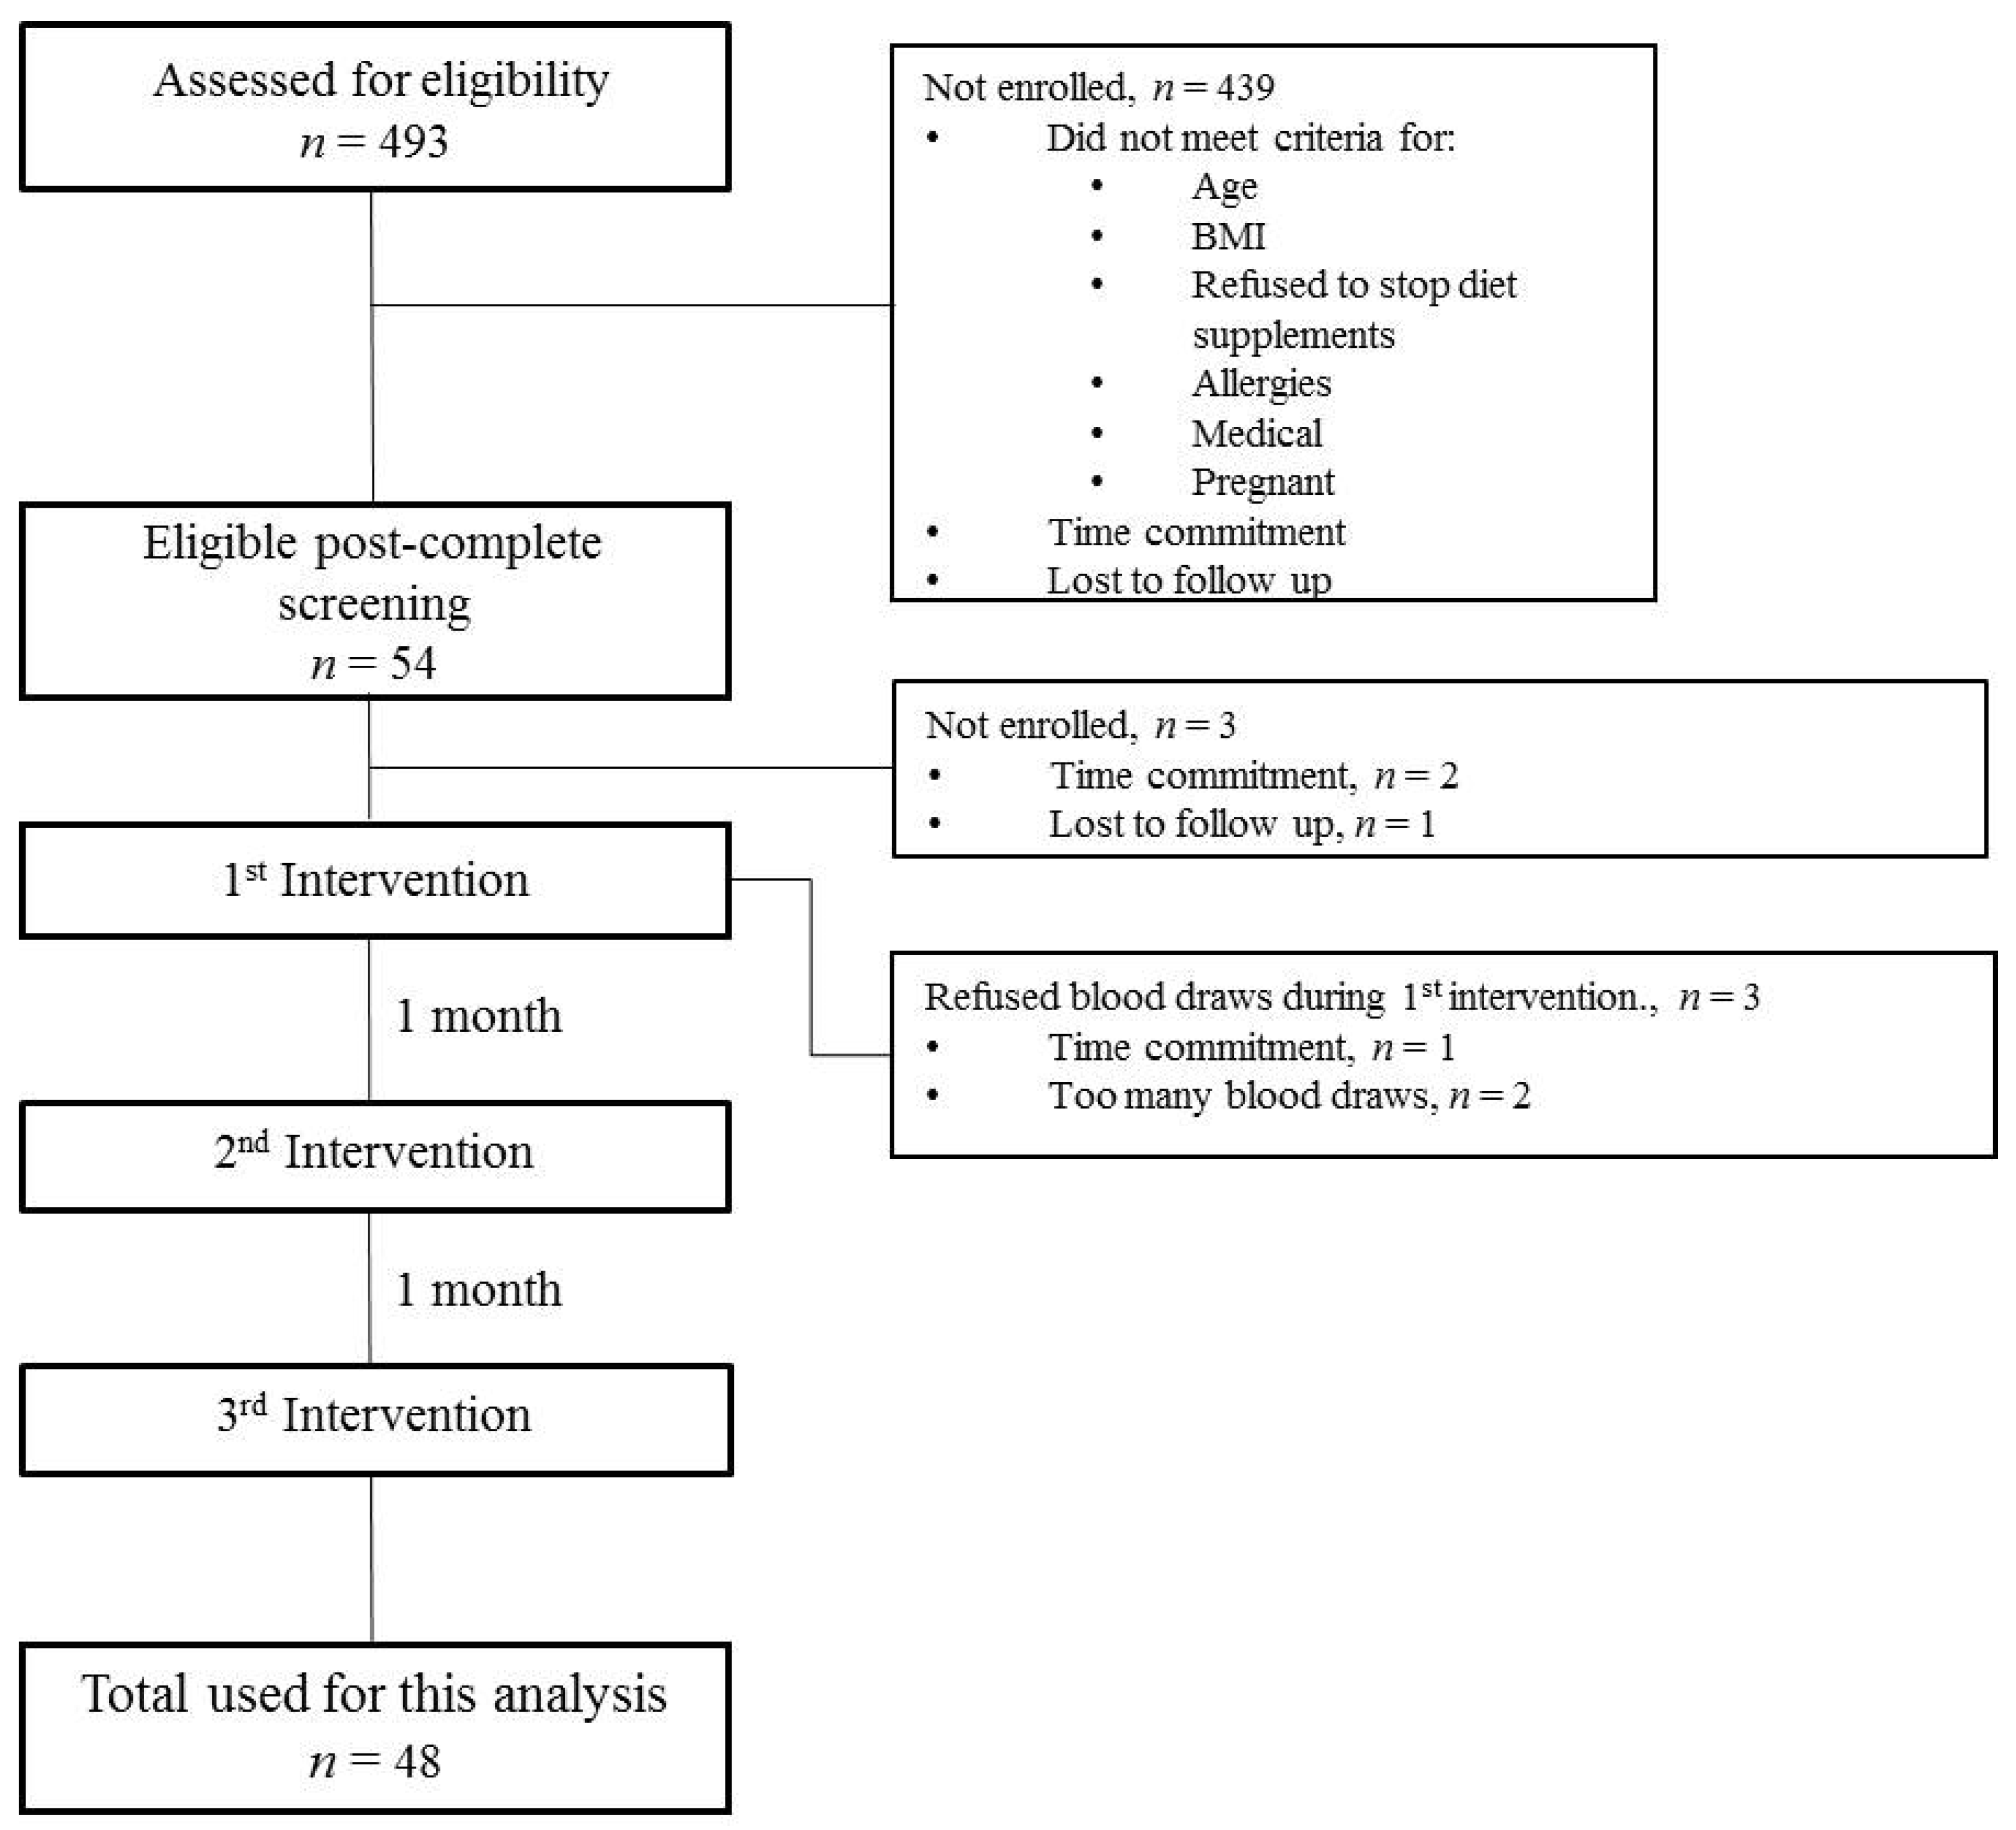
2.1. Participants
2.2. Study Design and Procedure
2.3. Measurements
2.3.1. Appetite Measures
2.3.2. Serum Biochemistry
2.4. Sample Size Estimation
2.5. Statistical Analysis
3. Results
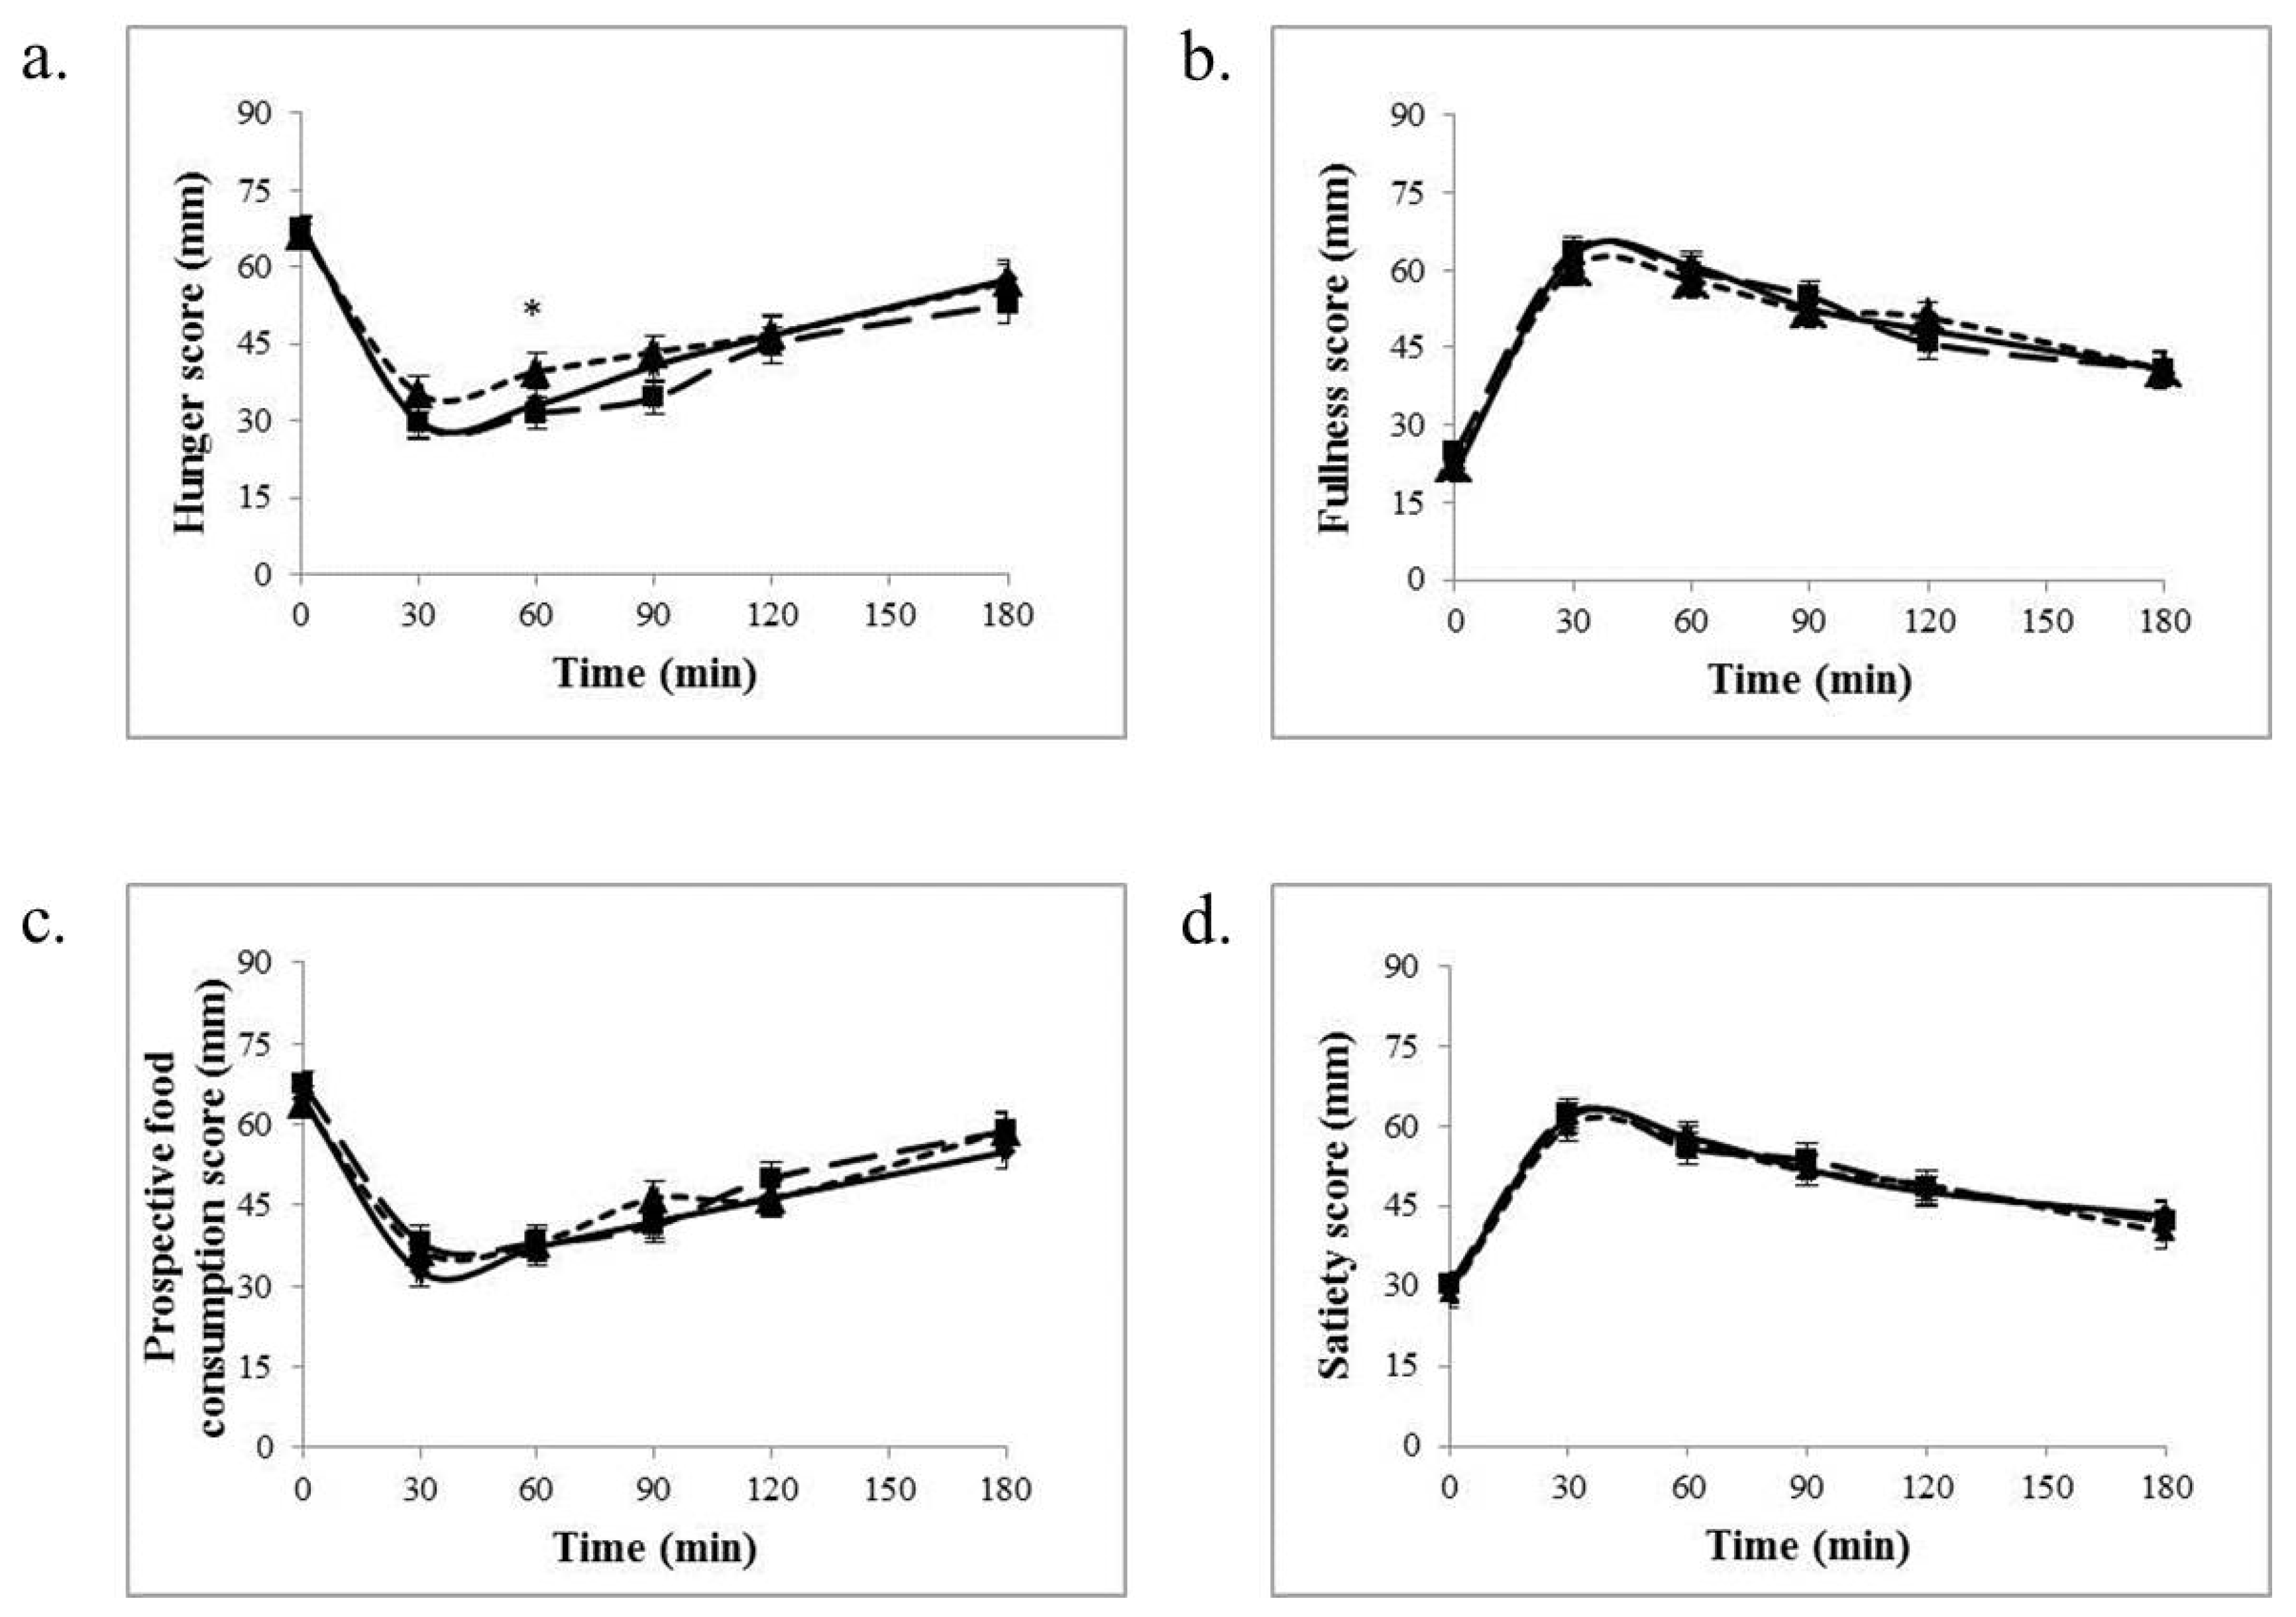
3.1. Appetite Measures
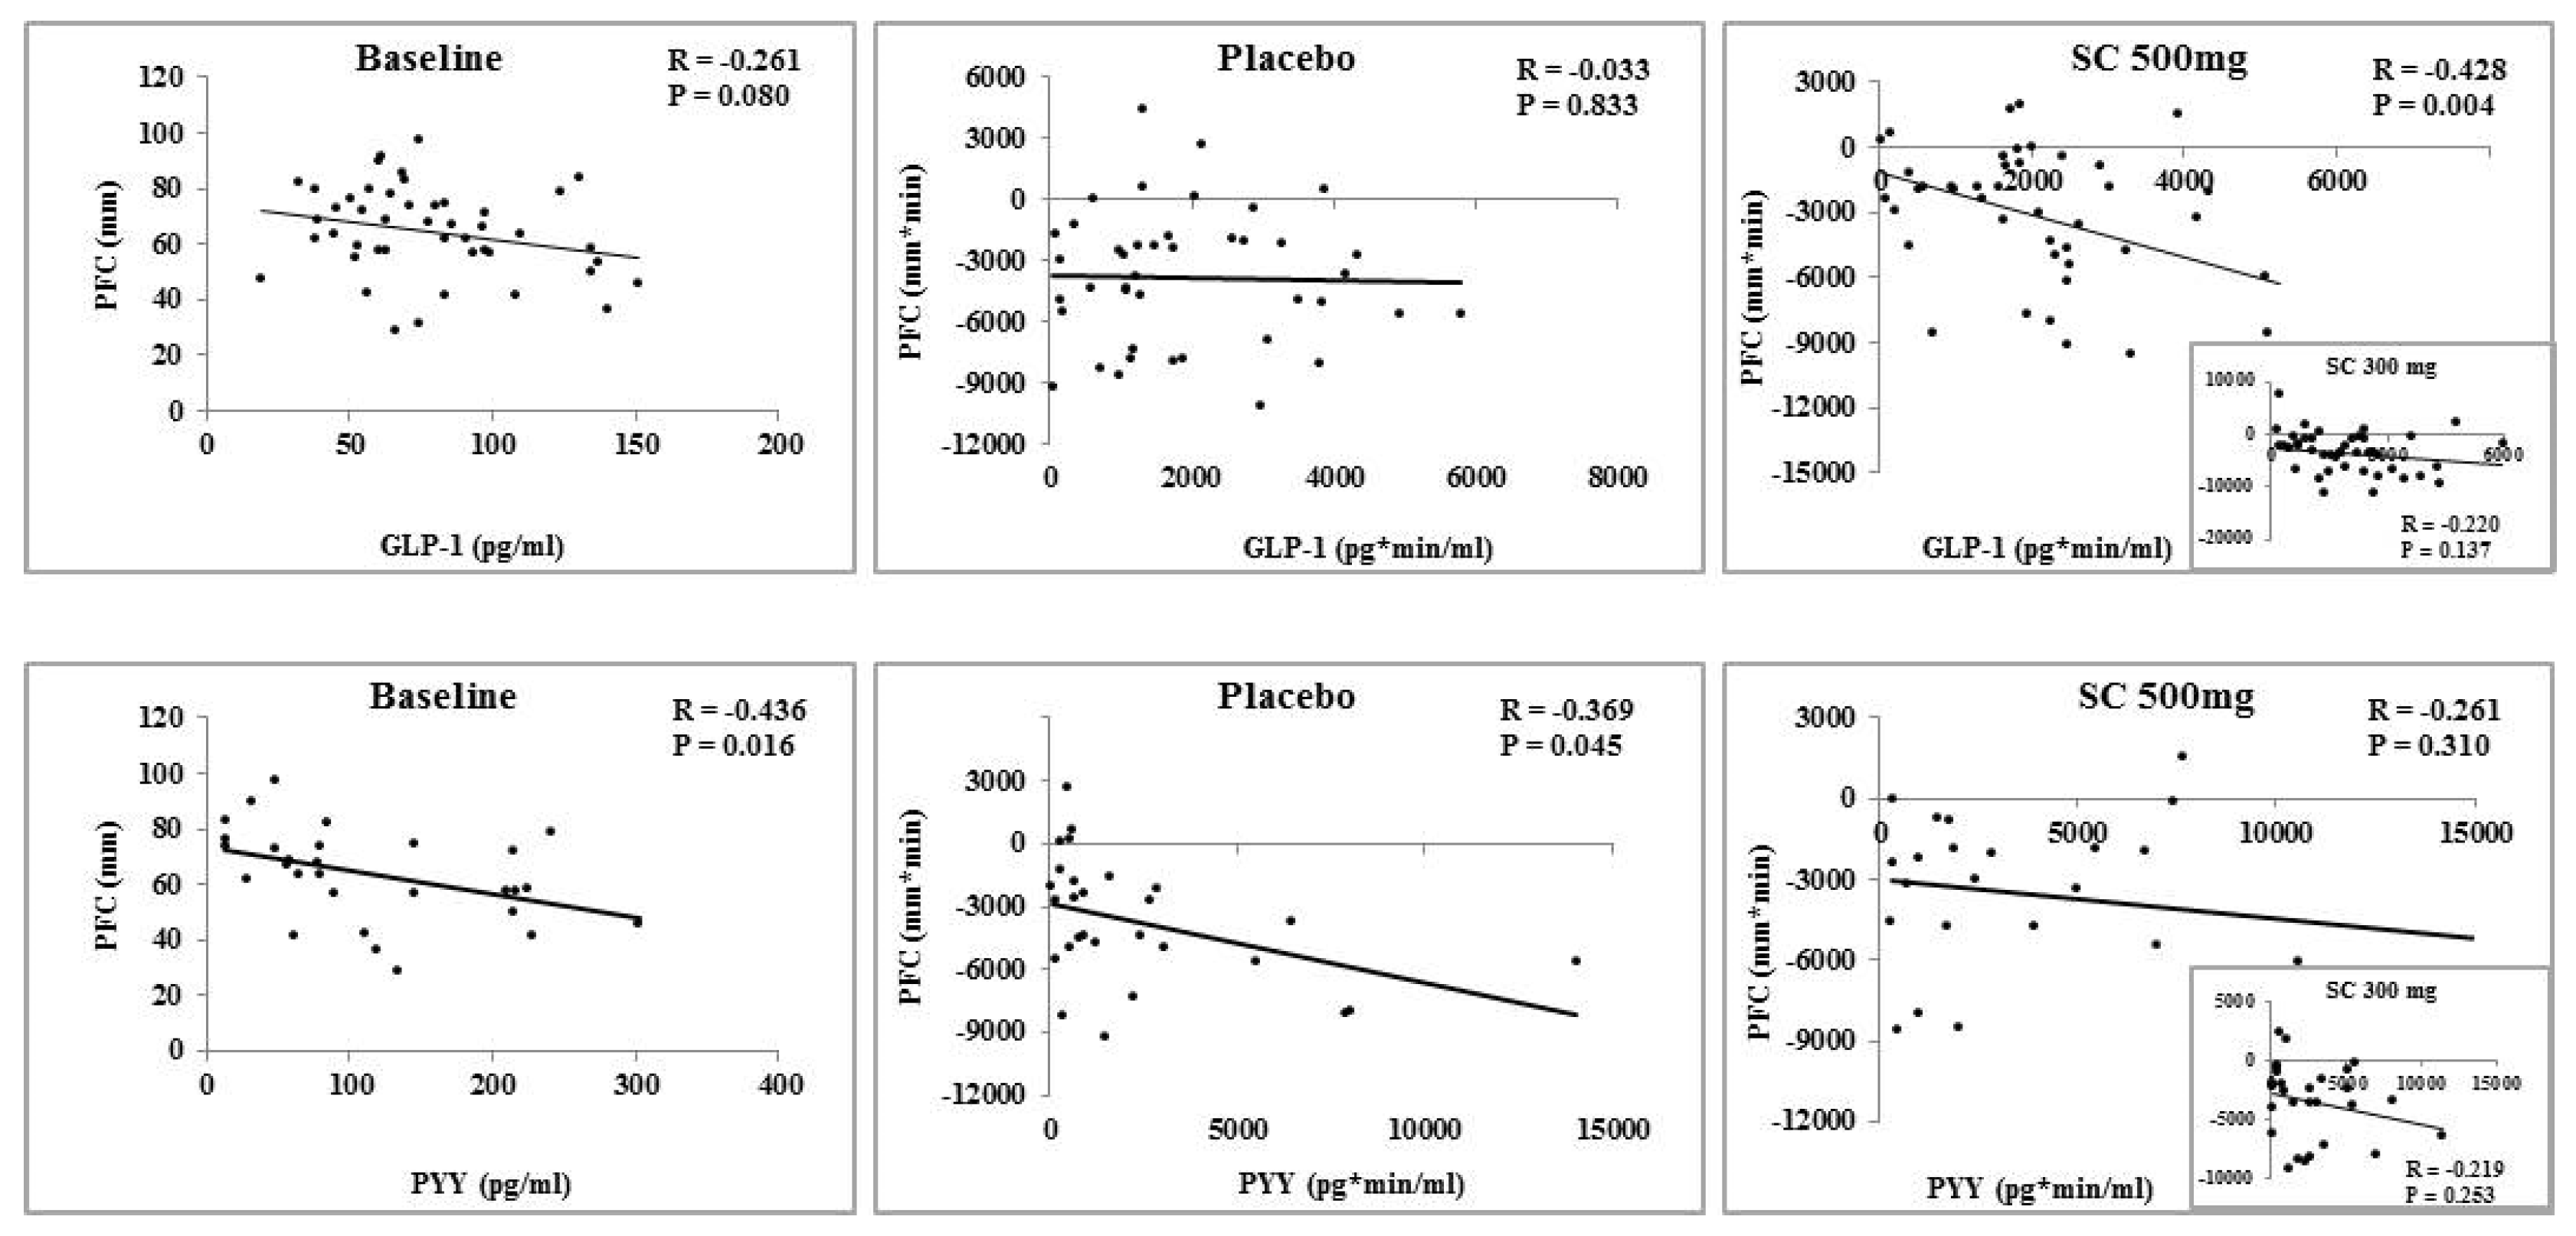
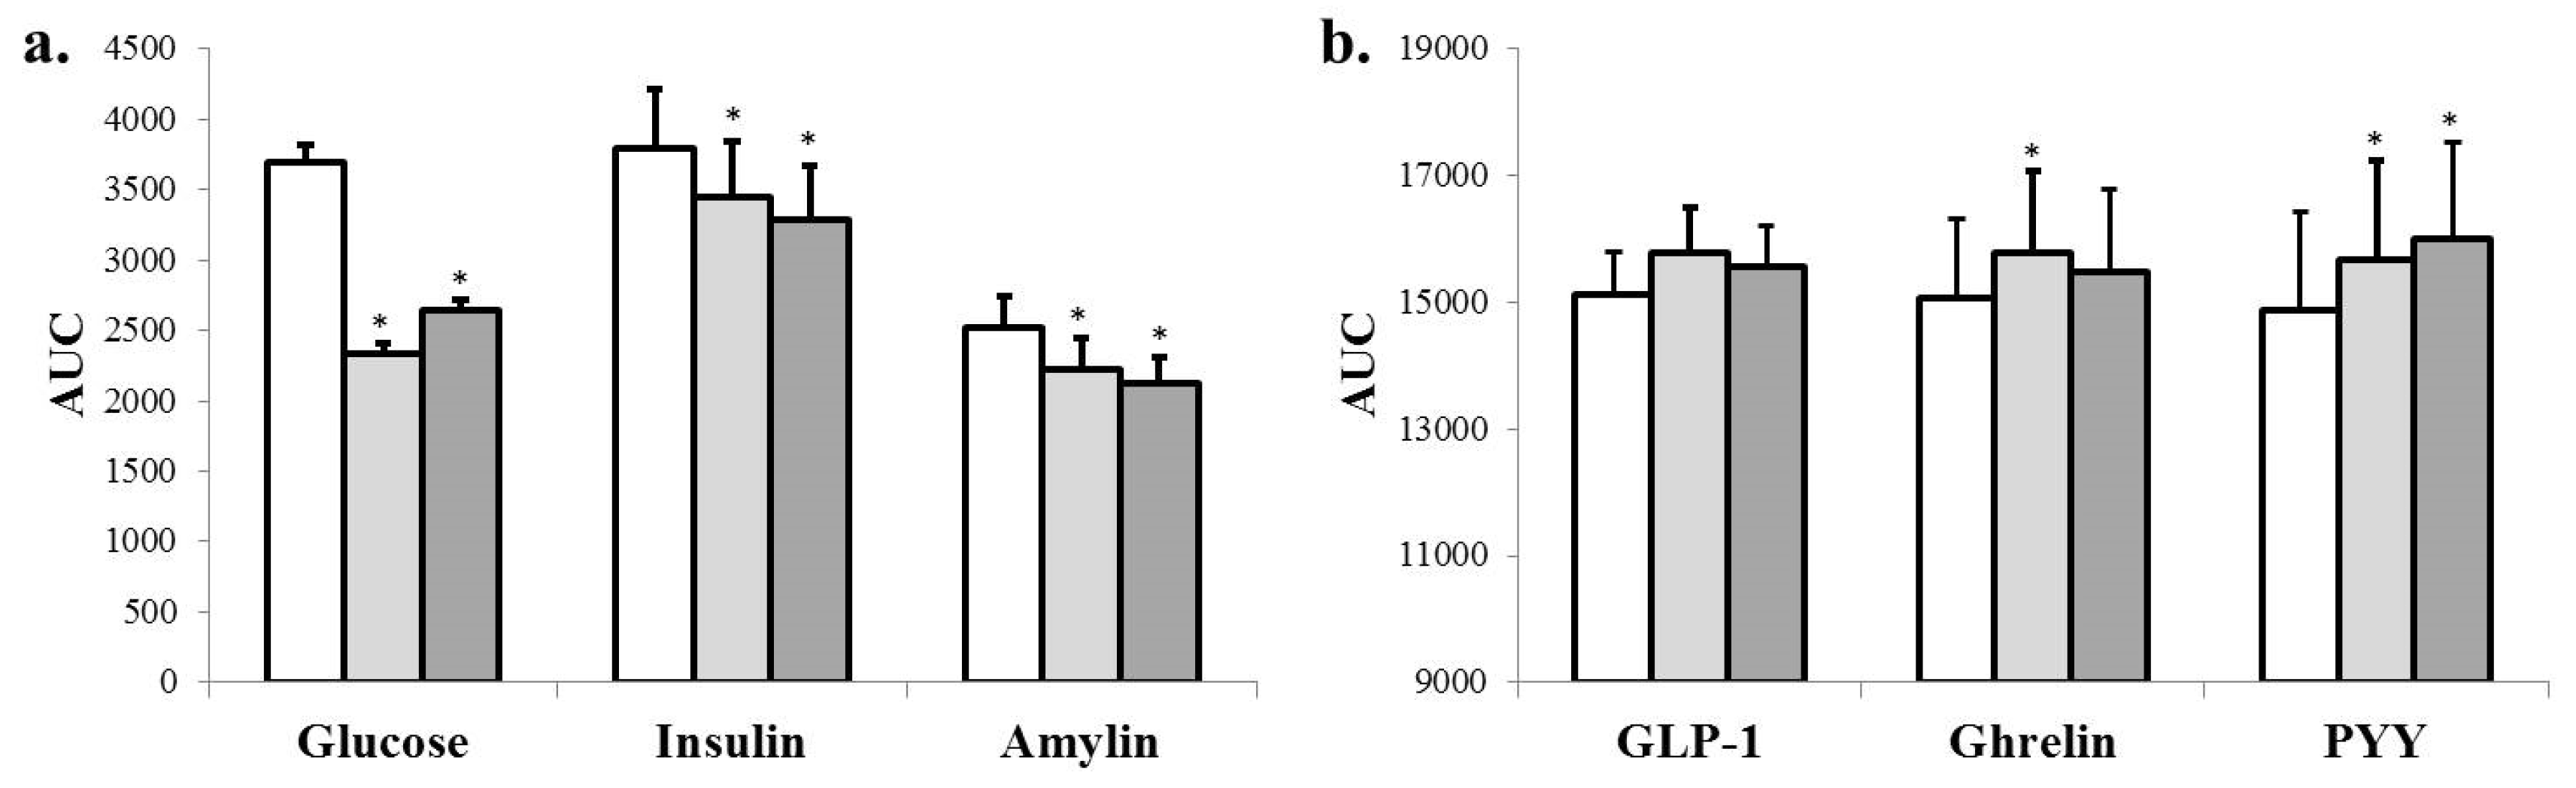
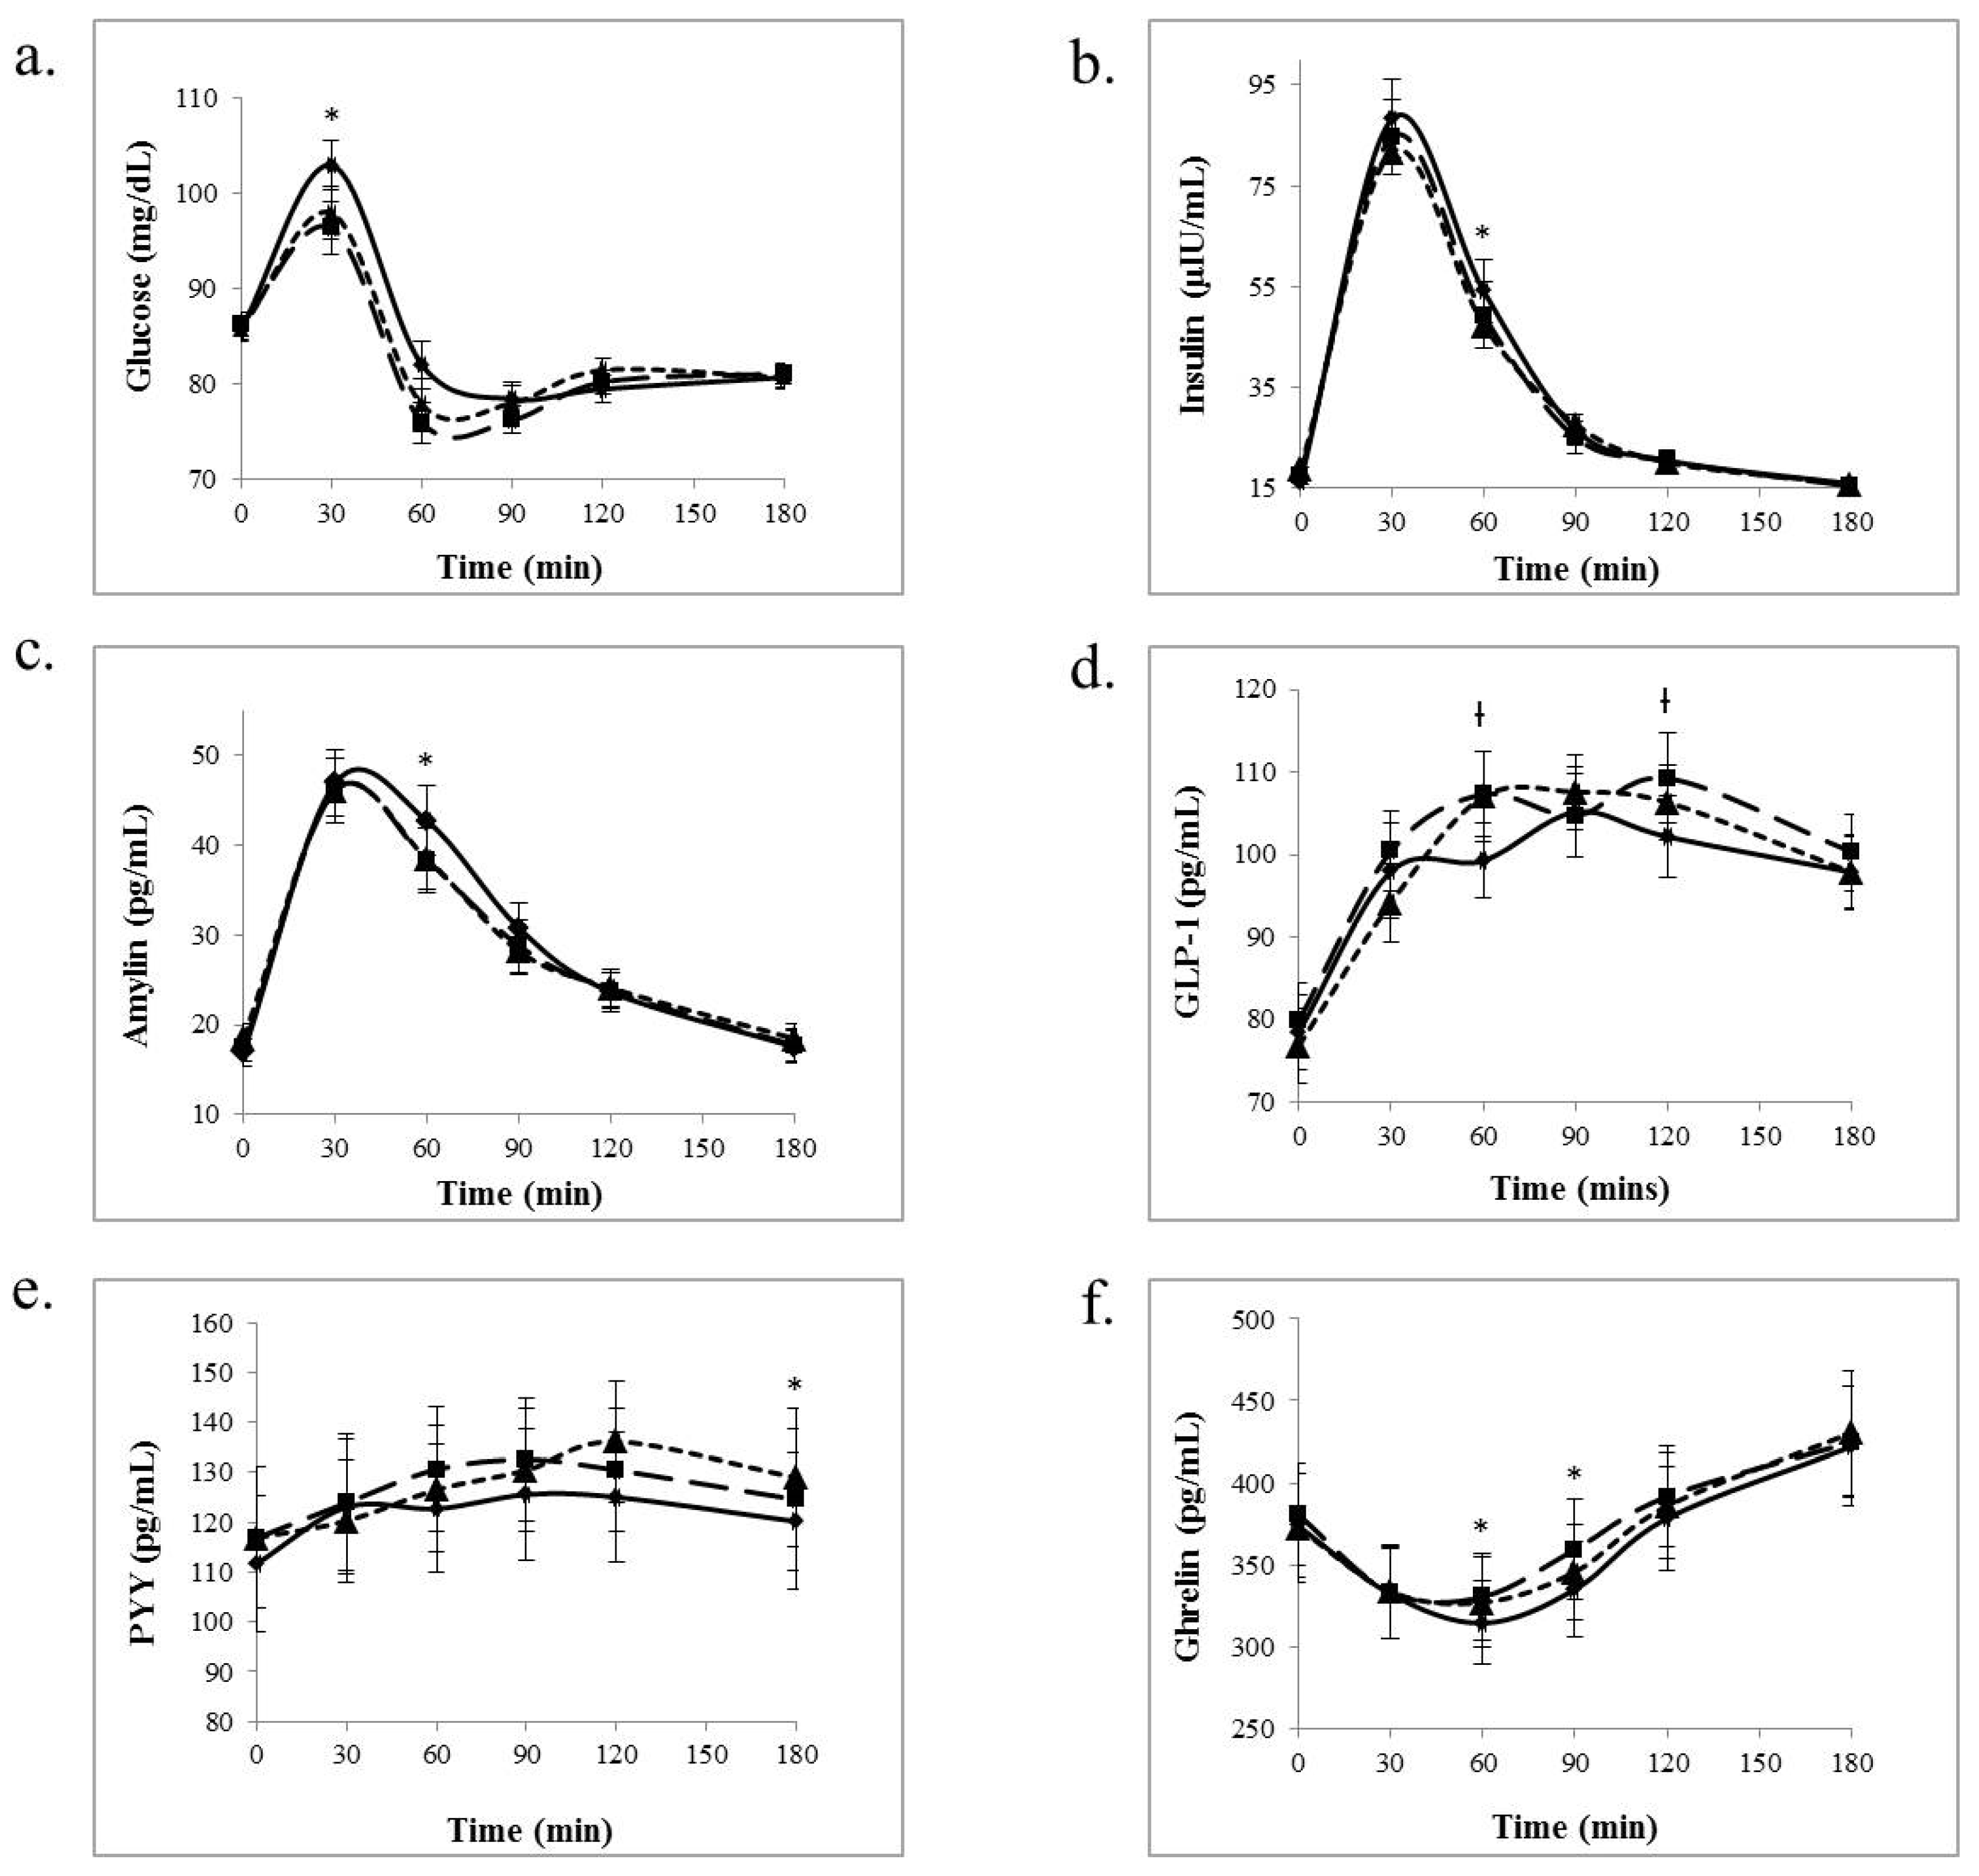
3.2. Serum Glycemic Indices and Gut Peptides
3.3. Effect of Body Mass Index on Appetite and Serum Variables
4. Discussion
5. Strengths and Limitations
Acknowledgments
Author Contributions
Conflicts of Interest
Appendix
 ; 300 mg:
  ; 500 mg:
  .
; 300 mg: ; 500 mg: .
.
; 300 mg: ; 500 mg: .
References
- Flegal, K.M.; Carroll, M.D.; Ogden, C.L.; Curtin, L.R. Prevalence and trends in obesity among US adults, 1999–2008. JAMA 2010, 303, 235–241. [Google Scholar] [CrossRef] [PubMed]
- Wing, R.R.; Hill, J.O. Successful weight loss maintenance. Annu. Rev. Nutr. 2001, 21, 323–341. [Google Scholar] [CrossRef] [PubMed]
- Cameron, J.D.; Goldfield, G.S.; Cyr, M.J.; Doucet, E. The effects of prolonged caloric restriction leading to weight-loss on food hedonics and reinforcement. Physiol. Behav. 2008, 94, 474–480. [Google Scholar] [CrossRef] [PubMed]
- Polidori, D.; Sanghvi, A.; Seeley, R.J.; Hall, K.D. How Strongly Does Appetite Counter Weight Loss? Quantification of the Feedback Control of Human Energy Intake. Obesity 2016, 24, 2289–2295. [Google Scholar] [CrossRef] [PubMed]
- Batterham, R.L.; Cohen, M.A.; Ellis, S.M.; Le Roux, C.W.; Withers, D.J.; Frost, G.S.; Ghatei, M.A.; Bloom, S.R. Inhibition of food intake in obese subjects by peptide YY3–36. N. Engl. J. Med. 2003, 349, 941–948. [Google Scholar] [CrossRef] [PubMed]
- Gutzwiller, J.P.; Drewe, J.; Goke, B.; Schmidt, H.; Rohrer, B.; Lareida, J.; Beglinger, C. Glucagon-like peptide-1 promotes satiety and reduces food intake in patients with diabetes mellitus type 2. Am. J. Physiol. 1999, 276, R1541–R1544. [Google Scholar] [PubMed]
- Spreckley, E.; Murphy, K.G. The L-Cell in Nutritional Sensing and the Regulation of Appetite. Front. Nutr. 2015, 2, 23. [Google Scholar] [CrossRef] [PubMed]
- Kaku, H.; Tajiri, Y.; Yamada, K. Anorexigenic effects of miglitol in concert with the alterations of gut hormone secretion and gastric emptying in healthy subjects. Horm. Metab. Res. 2012, 44, 312–318. [Google Scholar] [CrossRef] [PubMed]
- Aoki, K.; Kamiyama, H.; Masuda, K.; Kamiko, K.; Noguchi, Y.; Tajima, K.; Terauchi, Y. Effects of miglitol, vildagliptin, or their combination on serum insulin and peptide YY levels and plasma glucose, cholecystokinin, ghrelin, and obestatin levels. Endocr. J. 2014, 61, 249–256. [Google Scholar] [CrossRef] [PubMed]
- Lee, A.; Patrick, P.; Wishart, J.; Horowitz, M.; Morley, J.E. The effects of miglitol on glucagon-like peptide-1 secretion and appetite sensations in obese type 2 diabetics. Diabetes Obes. Metab. 2002, 4, 329–335. [Google Scholar] [CrossRef] [PubMed]
- Chiasson, J.L.; Josse, R.G.; Gomis, R.; Hanefeld, M.; Karasik, A.; Laakso, M. Acarbose for prevention of type 2 diabetes mellitus: the STOP-NIDDM randomised trial. Lancet 2002, 359, 2072–2077. [Google Scholar] [CrossRef]
- Kawamori, R.; Tajima, N.; Iwamoto, Y.; Kashiwagi, A.; Shimamoto, K.; Kaku, K. Voglibose for prevention of type 2 diabetes mellitus: A randomised, double-blind trial in Japanese individuals with impaired glucose tolerance. Lancet 2009, 373, 1607–1614. [Google Scholar] [CrossRef]
- Domecq, J.P.; Prutsky, G.; Leppin, A.; Sonbol, M.B.; Altayar, O.; Undavalli, C.; Wang, Z.; Elraiyah, T.; Brito, J.P.; Mauck, K.F.; et al. Drugs commonly associated with weight change: A systematic review and meta-analysis. J. Clin. Endocrinol. Metab. 2015, 100, 363–370. [Google Scholar] [CrossRef] [PubMed]
- Wolf, B.W.; Weisbrode, S.E. Safety evaluation of an extract from Salacia oblonga. Food Chem. Toxicol. 2003, 41, 867–874. [Google Scholar] [CrossRef]
- Jeykodi, S.; Deshpande, J.; Juturu, V. Salacia Extract Improves Postprandial Glucose and Insulin Response: A Randomized Double-Blind, Placebo Controlled, Crossover Study in Healthy Volunteers. J. Diabetes Res. 2016, 2016, 7971831. [Google Scholar] [CrossRef] [PubMed]
- Shimada, T.; Nakayama, Y.; Harasawa, Y.; Matsui, H.; Kobayashi, H.; Sai, Y.; Miyamoto, K.; Tomatsu, S.; Aburada, M. Salacia reticulata has therapeutic effects on obesity. J. Nat. Med. 2014, 68, 668–676. [Google Scholar] [CrossRef] [PubMed]
- Flint, A.; Raben, A.; Blundell, J.E.; Astrup, A. Reproducibility, power and validity of visual analogue scales in assessment of appetite sensations in single test meal studies. Int. J. Obes. Relat. Metab. Disord. 2000, 24, 38–48. [Google Scholar] [CrossRef] [PubMed]
- Ibrugger, S.; Kristensen, M.; Mikkelsen, M.S.; Astrup, A. Flaxseed dietary fiber supplements for suppression of appetite and food intake. Appetite 2012, 58, 490–495. [Google Scholar] [CrossRef] [PubMed]
- Williams, J.A.; Choe, Y.S.; Noss, M.J.; Baumgartner, C.J.; Mustad, V.A. Extract of Salacia oblonga lowers acute glycemia in patients with type 2 diabetes. Am. J. Clin. Nutr. 2007, 86, 124–130. [Google Scholar] [PubMed]
- Blom, W.A.; Lluch, A.; Stafleu, A.; Vinoy, S.; Holst, J.J.; Schaafsma, G.; Hendriks, H.F. Effect of a high-protein breakfast on the postprandial ghrelin response. Am. J. Clin. Nutr. 2006, 83, 211–220. [Google Scholar] [PubMed]
- Zhang, J.; Guo, L. Effectiveness of acarbose in treating elderly patients with diabetes with postprandial hypotension. J. Investig. Med. 2017. [CrossRef] [PubMed]
- Reda, T.K.; Geliebter, A.; Pi-Sunyer, F.X. Amylin, food intake, and obesity. Obes. Res. 2002, 10, 1087–1091. [Google Scholar] [CrossRef] [PubMed]
- Lutz, T.A. Amylinergic control of food intake. Physiol. Behav. 2006, 89, 465–471. [Google Scholar] [CrossRef] [PubMed]
- Maggio, C.A.; Decarr, L.B.; Vasselli, J.R. Differential effects of sugars and the alpha-glucosidase inhibitor acarbose (Bay g 5421) on satiety in the Zucker obese rat. Int. J. Obes. 1987, 11 (Suppl 3), 53–56. [Google Scholar] [PubMed]
- Emilien, C.; Hollis, J.H. A brief review of salient factors influencing adult eating behaviour. Nutr. Res. Rev. 2017, 1–14. [Google Scholar] [CrossRef] [PubMed]
- Hirschberg, A.L. Sex hormones, appetite and eating behaviour in women. Maturitas 2012, 71, 248–256. [Google Scholar] [CrossRef] [PubMed]
- Butera, P.C. Estradiol and the control of food intake. Physiol. Behav. 2010, 99, 175–180. [Google Scholar] [CrossRef] [PubMed]
- Asarian, L.; Geary, N. Modulation of appetite by gonadal steroid hormones. Philos. Trans. R. Soc. Lond. B. Biol. Sci. 2006, 361, 1251–1263. [Google Scholar] [CrossRef] [PubMed]
- Drapeau, V.; King, N.; Hetherington, M.; Doucet, E.; Blundell, J.; Tremblay, A. Appetite sensations and satiety quotient: Predictors of energy intake and weight loss. Appetite 2007, 48, 159–166. [Google Scholar] [CrossRef] [PubMed] [Green Version]
- Cummings, D.E.; Shannon, M.H. Ghrelin and gastric bypass: Is there a hormonal contribution to surgical weight loss? J. Clin. Endocrinol. Metab. 2003, 88, 2999–3002. [Google Scholar] [CrossRef] [PubMed]
- Nagaya, N.; Kojima, M.; Kangawa, K. Ghrelin, a novel growth hormone-releasing peptide, in the treatment of cardiopulmonary-associated cachexia. Intern. Med. 2006, 45, 127–134. [Google Scholar] [CrossRef] [PubMed]
- Borner, T.; Loi, L.; Pietra, C.; Giuliano, C.; Lutz, T.A.; Riediger, T. The ghrelin receptor agonist HM01 mimics the neuronal effects of ghrelin in the arcuate nucleus and attenuates anorexia-cachexia syndrome in tumor-bearing rats. Am. J. Physiol. Regul. Integr. Comp. Physiol. 2016, 311, R89–R96. [Google Scholar] [CrossRef] [PubMed]
- Kojima, M.; Hosoda, H.; Date, Y.; Nakazato, M.; Matsuo, H.; Kangawa, K. Ghrelin is a growth-hormone-releasing acylated peptide from stomach. Nature 1999, 402, 656–660. [Google Scholar] [CrossRef] [PubMed]
- Ariyasu, H.; Takaya, K.; Tagami, T.; Ogawa, Y.; Hosoda, K.; Akamizu, T.; Suda, M.; Koh, T.; Natsui, K.; Toyooka, S.; et al. Stomach is a major source of circulating ghrelin, and feeding state determines plasma ghrelin-like immunoreactivity levels in humans. J. Clin. Endocrinol. Metab. 2001, 86, 4753–4758. [Google Scholar] [CrossRef] [PubMed]
- Date, Y.; Kojima, M.; Hosoda, H.; Sawaguchi, A.; Mondal, M.S.; Suganuma, T.; Matsukura, S.; Kangawa, K.; Nakazato, M. Ghrelin, a novel growth hormone-releasing acylated peptide, is synthesized in a distinct endocrine cell type in the gastrointestinal tracts of rats and humans. Endocrinology 2000, 141, 4255–4261. [Google Scholar] [CrossRef] [PubMed]
- Zheng, F.; Yin, X.; Lu, W.; Zhou, J.; Yuan, H.; Li, H. Improved post-prandial ghrelin response by nateglinide or acarbose therapy contributes to glucose stability in Type 2 diabetic patients. J. Endocrinol. Invest. 2013, 36, 489–496. [Google Scholar] [PubMed]
- Ueno, H.; Tsuchimochi, W.; Wang, H.W.; Yamashita, E.; Tsubouchi, C.; Nagamine, K.; Sakoda, H.; Nakazato, M. Effects of Miglitol, Acarbose, and Sitagliptin on Plasma Insulin and Gut Peptides in Type 2 Diabetes Mellitus: A Crossover Study. Diabetes Ther. 2015, 6, 187–196. [Google Scholar] [CrossRef] [PubMed]
- Tai, K.; Hammond, A.J.; Wishart, J.M.; Horowitz, M.; Chapman, I.M. Carbohydrate and fat digestion is necessary for maximal suppression of total plasma ghrelin in healthy adults. Appetite 2010, 55, 407–412. [Google Scholar] [CrossRef] [PubMed]
- Shiiya, T.; Nakazato, M.; Mizuta, M.; Date, Y.; Mondal, M.S.; Tanaka, M.; Nozoe, S.; Hosoda, H.; Kangawa, K.; Matsukura, S. Plasma ghrelin levels in lean and obese humans and the effect of glucose on ghrelin secretion. J. Clin. Endocrinol. Metab. 2002, 87, 240–244. [Google Scholar] [CrossRef] [PubMed]
- Flanagan, D.E.; Evans, M.L.; Monsod, T.P.; Rife, F.; Heptulla, R.A.; Tamborlane, W.V.; Sherwin, R.S. The influence of insulin on circulating ghrelin. Am. J. Physiol. Endocrinol. Metab. 2003, 284, E313–E316. [Google Scholar] [CrossRef] [PubMed]
- Shirakawa, J.; Arakawa, S.; Tagawa, T.; Gotoh, K.; Oikawa, N.; Ohno, R.; Shinagawa, M.; Hatano, K.; Sugawa, H.; Ichimaru, K.; et al. Salacia chinensis L. extract ameliorates abnormal glucose metabolism and improves the bone strength and accumulation of AGEs in type 1 diabetic rats. Food Funct. 2016, 7, 2508–2515. [Google Scholar] [CrossRef] [PubMed]
- Morikawa, T.; Akaki, J.; Ninomiya, K.; Kinouchi, E.; Tanabe, G.; Pongpiriyadacha, Y.; Yoshikawa, M.; Muraoka, O. Salacinol and Related Analogs: New Leads for Type 2 Diabetes Therapeutic Candidates from the Thai Traditional Natural Medicine Salacia chinensis. Nutrients 2015, 7, 1480–1493. [Google Scholar] [CrossRef] [PubMed]
- Shivaprasad, H.N.; Bhanumathy, M.; Sushma, G.; Midhun, T.; Raveendra, K.R.; Sushma, K.R.; Venkateshwarlu, K. Salacia reticulata improves serum lipid profiles and glycemic control in patients with prediabetes and mild to moderate hyperlipidemia: A double-blind, placebo-controlled, randomized trial. J. Med. Food 2013, 16, 564–568. [Google Scholar] [CrossRef] [PubMed]
- Tong, J.J.; Chen, G.H.; Wang, F.; Li, X.W.; Cao, L.; Sui, X.; Tao, F.; Yan, W.W.; Wei, Z.J. Chronic acarbose treatment alleviates age-related behavioral and biochemical changes in SAMP8 mice. Behav. Brain. Res. 2015, 284, 138–152. [Google Scholar] [CrossRef] [PubMed]
- Moritoh, Y.; Takeuchi, K.; Hazama, M. Chronic administration of voglibose, an alpha-glucosidase inhibitor, increases active glucagon-like peptide-1 levels by increasing its secretion and decreasing dipeptidyl peptidase-4 activity in ob/ob mice. J. Pharmacol. Exp. Ther. 2009, 329, 669–676. [Google Scholar] [CrossRef] [PubMed]
 ; 300 mg: ; 500 mg: .
; 300 mg: ; 500 mg: .
; 300 mg: ; 500 mg: . ; 300 mg: ; 500 mg: .
; 300 mg: ; 500 mg: .
; 300 mg: ; 500 mg: .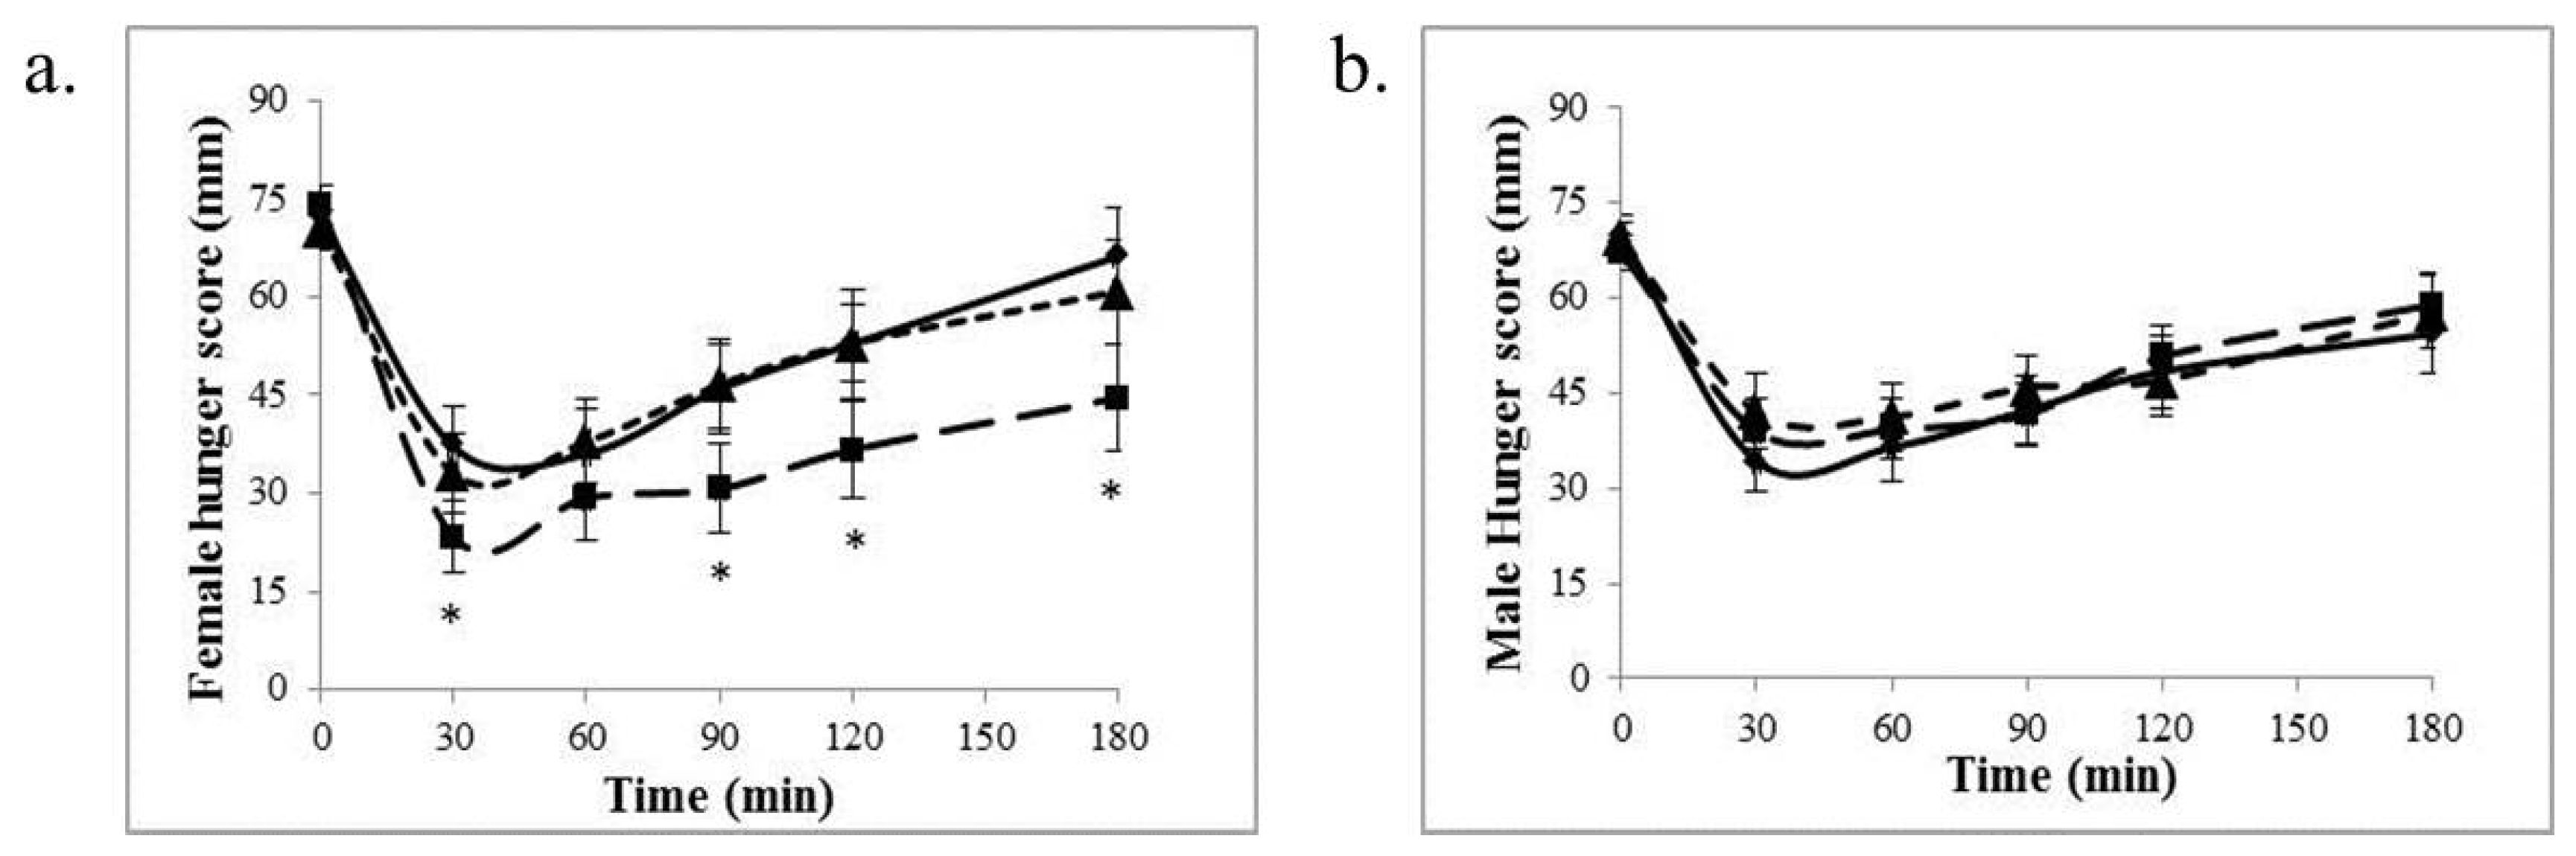
 ; 300 mg:
  ; 500 mg:
  .
; 300 mg: ; 500 mg: .
.
; 300 mg: ; 500 mg: .

| Age (year) | 32 ± 12 |
| Height (m) | 1.69 ± 0.09 |
| Weight (kg) | 83.2 ± 15.5 |
| Body mass index (kg/m2) | 28.8 ± 3.6 |
| Body fat (%) | 27.4 ± 7.3 |
| Waist circumference (cm) | 98.8 ± 15.0 |
| Blood pressure (systolic, mm Hg) | 112 ± 13 |
| Blood pressure (diastolic, mm Hg) | 80 ± 8 |
| Glucose (mg/dL) | 85.9 ± 8.2 |
| Insulin (µIU/mL) | 16.8 ± 7.4 |
| Amylin (pg/mL) | 17.6 ± 10.8 |
| GLP-1 (pg/mL) | 78.4 ± 31.0 |
| PYY * (pg/mL) | 116.1 ± 81.0 |
| Ghrelin (pg/mL) | 375.9 ± 223.4 |
© 2017 by the authors. Licensee MDPI, Basel, Switzerland. This article is an open access article distributed under the terms and conditions of the Creative Commons Attribution (CC BY) license (http://creativecommons.org/licenses/by/4.0/).
Share and Cite
Hao, L.; Schlussel, Y.; Fieselmann, K.; Schneider, S.H.; Shapses, S.A. Appetite and Gut Hormones Response to a Putative α-Glucosidase Inhibitor, Salacia Chinensis, in Overweight/Obese Adults: A Double Blind Randomized Controlled Trial. Nutrients 2017, 9, 869. https://doi.org/10.3390/nu9080869
Hao L, Schlussel Y, Fieselmann K, Schneider SH, Shapses SA. Appetite and Gut Hormones Response to a Putative α-Glucosidase Inhibitor, Salacia Chinensis, in Overweight/Obese Adults: A Double Blind Randomized Controlled Trial. Nutrients. 2017; 9(8):869. https://doi.org/10.3390/nu9080869
Chicago/Turabian StyleHao, Lihong, Yvette Schlussel, Krista Fieselmann, Stephen H. Schneider, and Sue A. Shapses. 2017. "Appetite and Gut Hormones Response to a Putative α-Glucosidase Inhibitor, Salacia Chinensis, in Overweight/Obese Adults: A Double Blind Randomized Controlled Trial" Nutrients 9, no. 8: 869. https://doi.org/10.3390/nu9080869