Margarines and Fast-Food French Fries: Low Content of trans Fatty Acids


Department of Nutrition, Food Science and Physiology, Faculty of Pharmacy and Nutrition, Universidad de Navarra, C/Irunlarrea s/n, IDISNA—Instituto de Investigación Sanitaria de Navarra, 31008 Pamplona, Spain
*
Author to whom correspondence should be addressed.
Nutrients 2017, 9(7), 662; https://doi.org/10.3390/nu9070662
Submission received: 30 May 2017
/
Revised: 20 June 2017
/
Accepted: 23 June 2017
/
Published: 28 June 2017
Abstract
:The lipid fraction of margarines and fast food French fries, two types of foods traditionally high in trans fatty acids (TFA), is assessed. TFA data reported worldwide during the last 20 years have been gathered and show that some countries still report high TFA amounts in these products. The content of TFA was analysed in margarines (two store and four premium brands) and French-fries from fast-food restaurants (five chains). All samples were collected in Pamplona (Navarra, Spain). The margarines showed mean values of 0.68% and 0.43% (g TFA/100 g fat) for the store and premium brands, respectively. The French fries’ values ranged from 0.49% to 0.89%. All samples were lower than the 2% set by some European countries as the maximum legal content of TFA in fats, and contained less than 0.5 g/serving, so they could also be considered “trans free products”. This work confirmed that the presence of TFA is not significant in the two analysed products and contributes updated food composition tables, key tools for epidemiological and nutrition studies.
1. Introduction
From 1990 to 2010 globally, the estimated proportional CHD (coronary heart disease) mortality increased by 4% for higher TFA (trans fatty acids) consumption, driven basically by increases in low and middle-income countries [1]. As a reaction to the evidences showing a detrimental effect on health caused by the consumption of TFA [2], several countries and organizations established recommendations, limitations, and bans in order to control TFA levels in food [3,4]. It has been stated that removing these fats from the food supply is considered an optimum public health intervention for reducing CVD risk and improving the nutritional quality of diets [5]. Furthermore, these policies have resulted, for instance, in lower concentrations of trans fat in Canadian women’s breast milk samples [6] and in lower plasma TFA concentrations in persons with type-2 diabetes [7] and might have contributed to low TFA values in erythrocytes in Europe [8].
The first organisation to suggest a guideline to regulate TFA content in food was the Food and Drug Administration (FDA) in 1999. The proposal established the compulsory inclusion of the amount of TFA on the label of those products in which the content of TFA was higher than 0.5 or more grams (g) per serving. In 2003, Denmark was the first country that introduced a legislation regarding the use of TFA in industrial processed food, limiting the permitted level of TFA to 2 g of TFA per 100 g of fats or oil in the product as sold to the final consumer [9]. This initiative led to a decrease in their CVD mortality rates [10]. On the other hand, in 2009, the World Health Organization (WHO) published a report in which the recommended intake for TFA was set at less than 1% of total energy intake (E) [11]. However, recently this value has been decreased to 0.5% E based on the impact of these fatty acids (FA) on CHD mortality data [1].
The main reason for the food industry to use TFA-containing fats is the interesting characteristics that these type of fatty acids present; solid, edible fat at room temperature, enhanced stability, reduced oxidation susceptibility, and improved organoleptic properties [12].
Since the above-mentioned legislative measures were taken, different strategies to replace TFA have been studied; new processes, treatments, and reformulations such as the modification of the hydrogenation process, interesterification, fractionation, or the combination of several technologies [13,14,15].
In the past few years many efforts have been made to reduce the presence and dietary intake of TFA in foods traditionally rich in TFA such as bakery products, snacks, margarines, fats, and fast foods with mixed success. This is the subject of elegant works carried out in Portugal [16], Pakistan [17], Brazil [18], UK [19], Austria [20], Costa Rica [21], Estonia [22], New Zealand [23], Switzerland [24], Serbia [25], or Lebanon [26]. Our research group conducted a study of bakery products and also in snacks commercialized in Spain and also found very low TFA in these products [27,28]. Regarding fast food, some studies carried out a few years ago reported a high variability among products [29] and even between international fast food companies’ outlets located in different countries [30]. However, other studies carried out during the last few years showed a significant reduction in the amounts of TFA. Thus, monitoring TFA in foods and having updated databases becomes crucial to verify that the progress in the reduction of their presence in diets continues [3,31,32] and that this occurs across all food sectors and countries.
The objective of this work was to test the TFA amounts of different brands of margarines and French fries sold by different well-known fast food chains. These two food items had traditionally high amounts of these fatty acids [33,34]. A contribution to updating food composition tables was also aimed at in this paper. This second objective was in agreement with the proposal of the Spanish Federation of Scientific Societies of Food, Nutrition, and Dietetics (FESNAD), which suggest including TFA content in food labels [33].
2. Material and Methods
2.1. Materials
Fatty acid methyl esters (individual standards and mixtures of isomers) were purchased from Sigma-Aldrich Chemical® (St. Louis, MO, USA), except for brassidic acid, which was purchased from Nu-Check Prep. Inc. (Elysian, MN, USA). Boron trifluoride/methanol was obtained from Merck® (Whitehouse Station, Hunterdon County, NJ, USA). Methanol, chloroform, petroleum ether, and potassium chloride were from Panreac® (Barcelona, Spain).
2.2. Sampling
Margarines: 18 samples from six different brands of well-known and widely distributed margarines were analysed (three of them were three-quarter-fat margarine and three of them half-fat margarine, according to Council Regulation, European Council, 1994) [35]. Among the ¾ Margarines, two of them were store brands (brand 1 and 2) and one of them a premium brand (brand 3). All the half-fat margarines were premium brands. All samples were purchased in regular supermarkets located in Pamplona (Navarra, Spain) and immediately transported to the laboratory, where they were kept in the fridge (4 °C) until analysis. For each brand, three samples (250 g each) from different lots were collected on three different days (n = 18).
The following fat sources were declared on the labels of the margarines: Brand 1 had sunflower, rapeseed, and palm oil; Brand 2 had palm and sunflower oil; Brand 3 had sunflower, palm, and linseed oil; Brand 4 had sunflower, olive, palm, and linseed oil; Brand 5 had sunflower, palm, and linseed oil; and Brand 6 had no ingredients reported. The energy values (kcal/100 g) declared for these products were 544, 550, 540, 360, 320, and 316, respectively. Analyses in each batch were performed in triplicate.
French fries: 15 samples of French fries were purchased in the same conditions as customers do in fast food restaurants belonging to well-known international chains (these brands would cover approximately 70% of the Spanish fast food market share. The restaurants were located in Pamplona (Navarra, Spain). After purchase, they were immediately transported to the laboratory, homogenized, and frozen (−20 °C) until further analysis. For each of the five different brands studied (food outlets), three batches (1 kg each) were collected on three different days (n = 15). The serving sizes (small portions) reported by the companies for these products were 100 g, 90 g, 103 g, 80 g, and 215 g for brands 1, 2, 3, 4, and 5, respectively. The energy values (kcal/100 g) declared for these products were 323, 258, 223, 290, and 258, respectively. Analyses in each batch were performed in triplicate.
2.3. Analysis of Samples
The official method 960.39 of the AOAC [36] was applied for quantitative fat extraction (Soxhlet with Petroleum ether as solvent) (Büchi model B-811 Extraction System, Büchi, Flawil, Switzerland). In order to carry out qualitative fat extraction for the further analysis of the lipid profile, the method described by Folch et al. [37] was followed.
The fatty acid profile was determined in the lipid extracts by gas chromatography [27]. Boron trifluoride/methanol was used for the preparation of fatty acid methyl esters (FAME) [38]. A Perkin-Elmer Autosystem XL gas chromatograph fitted with a capillary column SPTM-2560 (100 m × 0.25 mm × 0.2 μm—Sigma Aldrich, St. Louis, MO, USA) and flame ionization detection was used. The temperature of the injection port was 250 °C and of the detector was 260 °C. The oven temperature was programmed at 175 °C for 10 min and increased to 200 °C at a rate of 10 °C/min, then increased to 220 °C at a rate of 4 °C/min, which was kept for 15 min. The carrier gas was hydrogen, and the pressure was 20.5 psi. The split flow was 120 cm/s. The identification of the fatty acid methyl esters was done by the comparison of the retention times of the peaks in the sample with those of standard pure compounds. Individual methylated standards were used for all fatty acids except for the following mixtures of isomers: linoleic acid isomers (mixture 47791), linolenic acid isomers (mixture 47792), and mixtures 20:1, 20:2, 20:4, and 20:5 (mixture 18912), all from Sigma-Aldrich (St. Louis, MO, USA). The order of elution in the case of the mixtures of isomers (linoleic and linolenic acid cis/trans isomers) was also taken into account (Sigmaldrich.com—FAME Application guide) [39,40]. Spiking the sample with each individual standard (or mixture of standards in the case of the linoleic or linolenic acid isomers and the C20 mixture) was finally used for confirming the identification. The quantification of individual fatty acids was based on the internal standard method using heptadecanoic acid methyl ester (Sigma-Aldrich, St. Louis, MO, USA). Elaidic acid (9t-18:1) eluted very closely to other 18:1 trans isomers (possibly t6 to t12), which were all located earlier than oleic acid (9c-18:1). Quantification for all these 18:1 trans isomers was done as the sum of all of them. The chromatograms obtained for margarine and French fries are shown as supplementary material (Figures S1 and S2, respectively).
3. Statistical Analysis
Statistical analyses were performed with Stata IC 12 software (Copyright 1985–2011 StataCorp LPm, Revision 2014, College Station, TX, USA). The mean and standard deviation of data are reported in the tables. The median, 25th, and 75th percentiles are shown in the figures. A one-way ANOVA test (Analysis of variance) followed by a post-estimation test (Bonferroni) were used to determine significant differences among the different brands. A significance level of p ≤ 0.05 was used for all evaluations. The Pearson correlation test was applied for the evaluation of the association between polyunsaturated fatty acids (PUFA) and TFA content in French fries.
4. Results and Discussion
Information on trans-fat intake in several countries of the WHO European Region is still very limited, and a large number of products containing high levels of trans fat are still available on the market [5]. A display of the TFA content of foods in the Nutrition Facts table is not mandatory according to current legislation in Europe, and therefore consumers and health-related professionals are not provided with information on the levels of TFA in products. Thus, this work reports updated lipid composition data on two products included within the list of foodstuffs susceptible to containing TFA [34]. For both types of products (margarines and French fries), the lipid profile was expressed in g/100 g fat and also in g/100 g product in order to discuss the differences found with previous studies and also to estimate the intake of TFA in diets.
Table 1 gathers the lipid composition data of margarines and French fries reported by different research groups during the last decades. Regarding margarines, although a general trend towards an average reduction in the TFA content was observed, large differences between countries were noticed. Also, Stender et al. [41] pointed out wide differences in the TFA content of several popular foods in Europe. These are probably linked to the different types of interventions to reduce the intake of industrially produced TFA worldwide (legislative limits or voluntary policy programs), showing certain variability in their success [42]. In 2003, the first regulation on TFA content in foods came into force in Denmark. Since then, only seven out of 37 types of margarines and spreads analysed all over the world and presented in Table 1 showed mean values lower than 2% TFA. Moreover, in the last five years, values of up to 30% TFA of total fat were still observed in some European margarine samples [22,25]. In Spain, the last data published on these products showed an average TFA content of 2.8 g/100 g fat [43]. Since then, a careful reformulation of products was undertaken by the Spanish industry, evident by the data provided in this study.
Far fewer studies reported the TFA content in French fries (Table 1). Although the results showed great diversity, there was a trend towards a lower TFA content is these products in the last few years.
4.1. Analysed Margarines
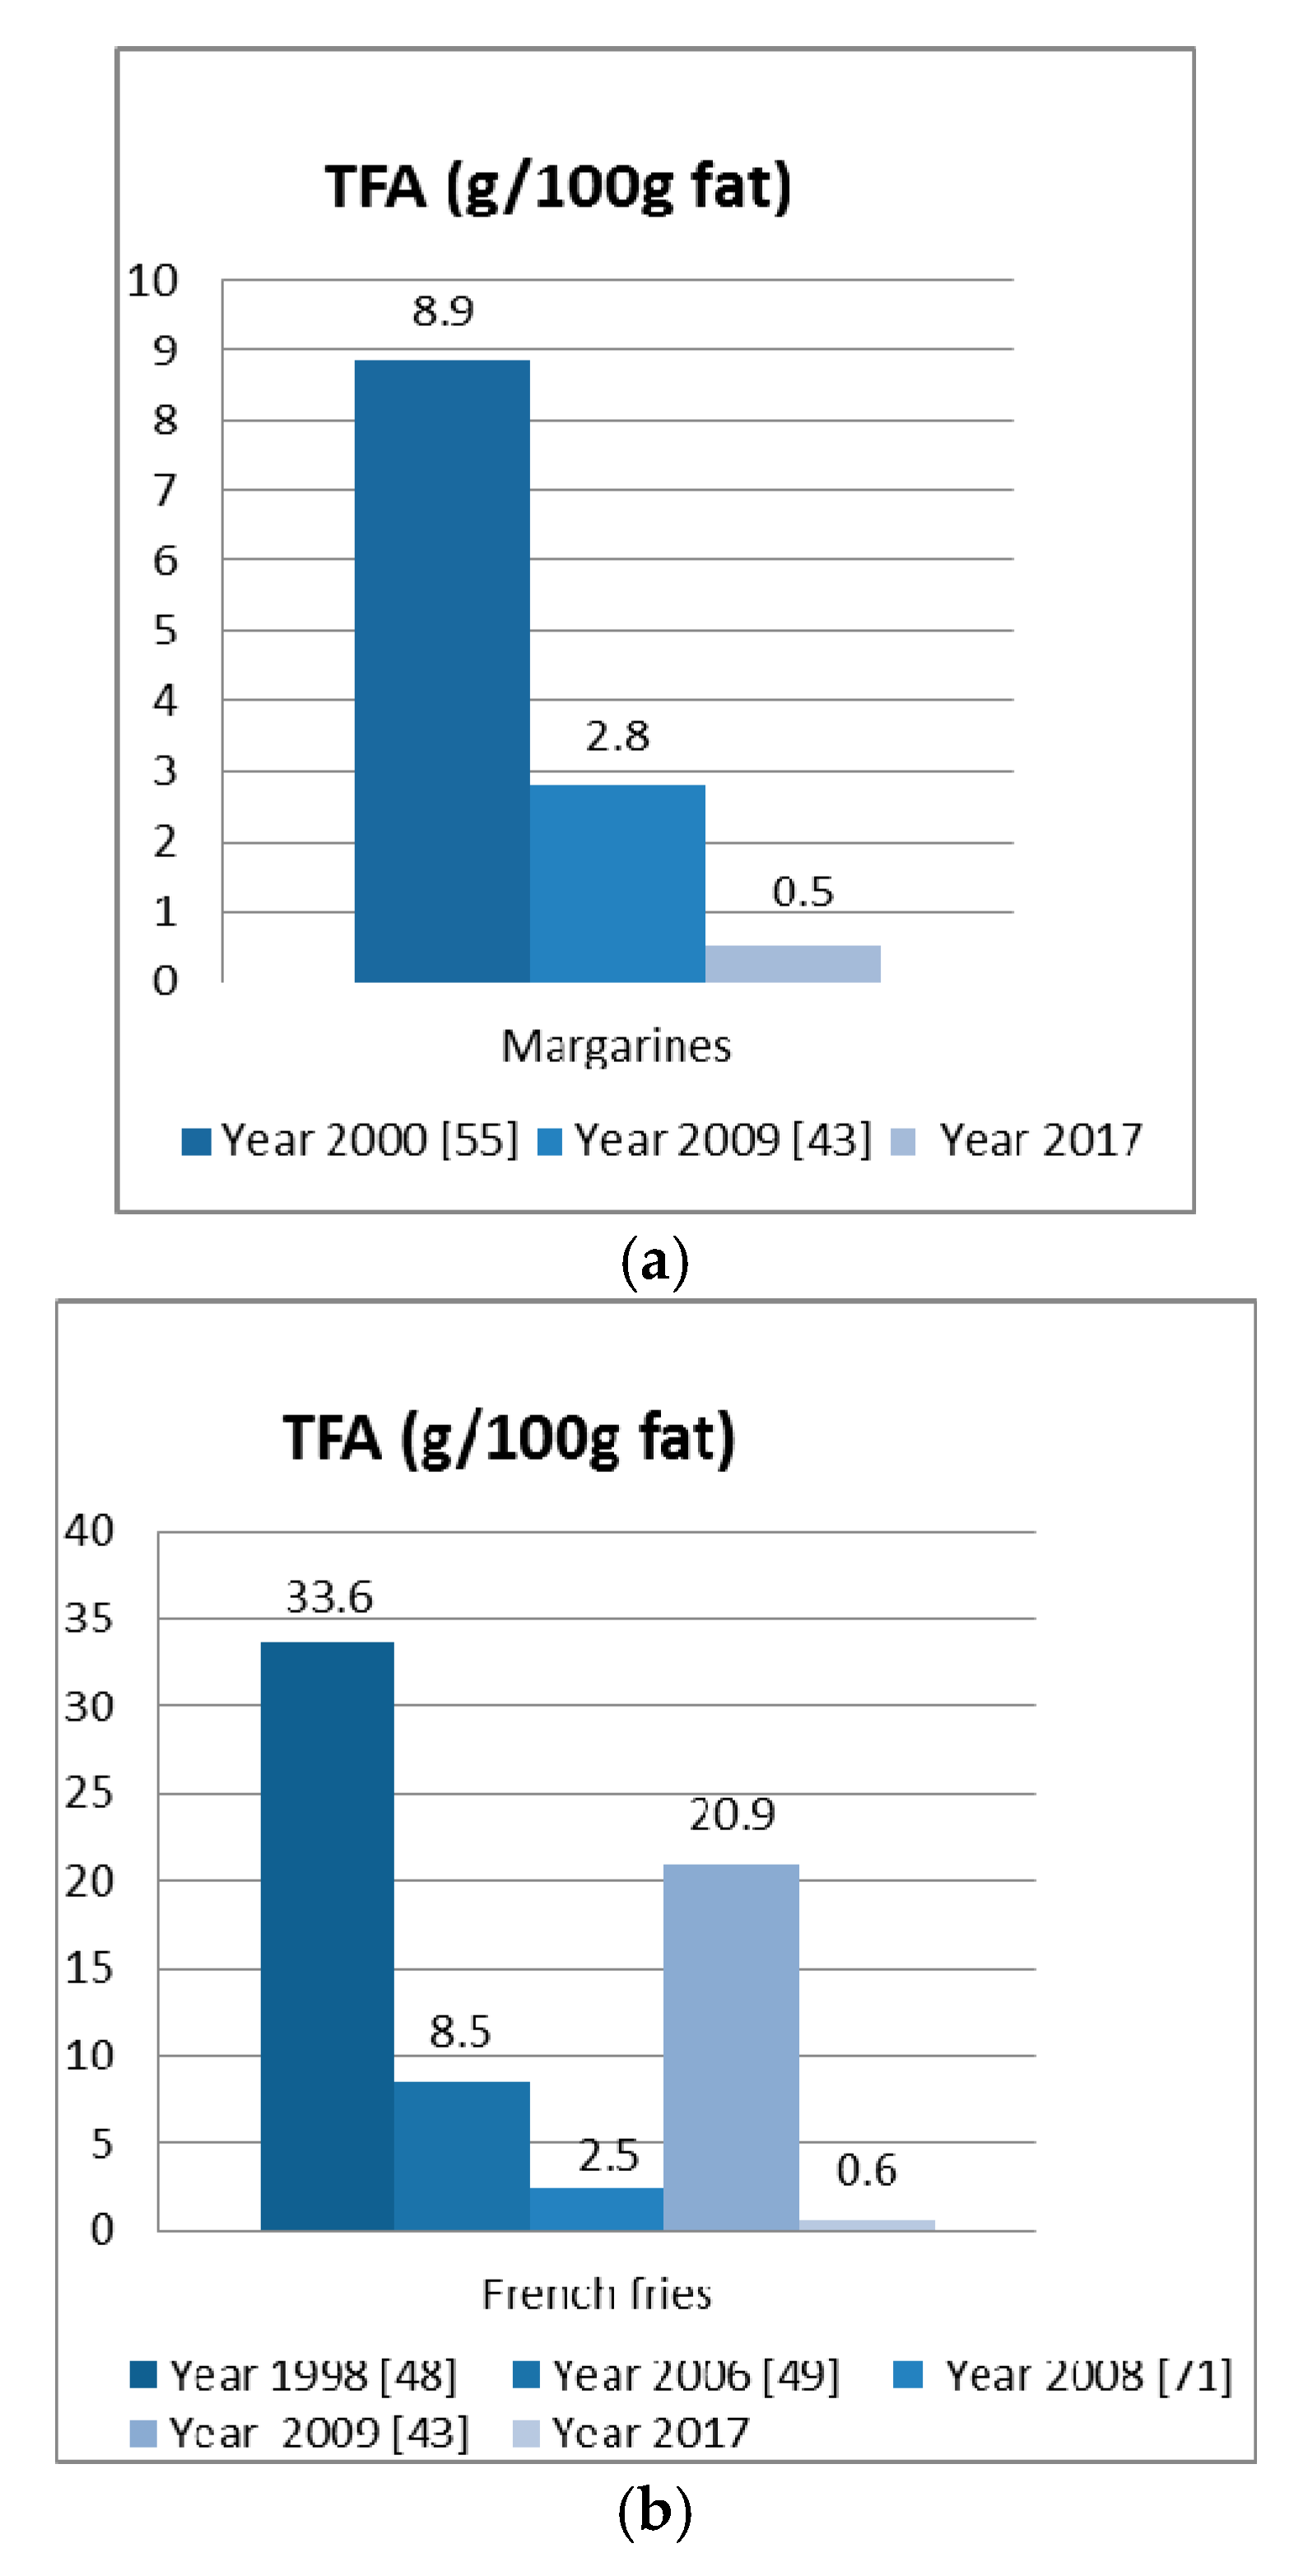
The detailed lipid profile (g/100 g fatty acids) of the six types of margarines analysed in this study is shown in Table 2. The mean value for the six brands was significantly lower (0.51 g/100 g) than data reported by previous studies in Spain. Figure 1a shows the differences between this value and those obtained from previous studies (in the year 2000 [44] and the year 2009 [43]). The minimum value found in our work was 0.29 g/100 g (the mean for brand 4), and the maximum one was 0.72 g/100 g (the mean for brand 2). A comparison of the ¾ to the ½ fat containing margarine showed, in general, that the former had a higher proportion of TFA. However, brand 3 (premium brand), showed similar TFA values to the ½ fat margarines. Based on these results, it was concluded that there was, on average, a 5.5-fold reduction in TFA content compared to the data published in 2009 [43].
Remarkably, none of the samples reached the 2% value set by those European countries in which a trans-fat policy is currently in place by legislation (Denmark, Switzerland, Austria, Iceland, Hungary, and Norway). None of the samples declared partially hydrogenated vegetable oils among their ingredients, which is in agreement with our results. The current results were consistent with those found for two margarines analysed by ATR-FTIR (attenuated total reflection-Fourier transform infrared) spectroscopy in Spain [45].
In all cases, the solution to reach a compromise between a healthier lipid profile and the desired textural properties for these products was adequately addressed without the use of partially hydrogenated oils. A complete lipid analysis of the margarine showed that oleic acid was the most abundant fatty acid in three out of six brands, which suggested that olive oil or rapeseed oil was used in their formulations. In fact, brand 1 (store brand) showed the highest MUFA and lowest n-6/n-3 ratio among all the tested margarines, which would suggest that rapeseed was included in this product. In brands 2, 3, and 5, linoleic acid was the major fatty acid, which is consistent with the use of sunflower oil in their formulae. Relevant percentages of alpha-linolenic acid were also noticed (up to 8.68% in brand 5) as a consequence of the incorporation of linseed oil in the fat blends. When this oil was present in the blends (in brands 3, 4, and 5), it significantly contributed to obtaining n-6/n-3 ratios of 4.7 to 5.9. However, it did not contribute trans linolenic isomers.
The use of palm oil is one of the technological strategies currently applied to reduce the TFA content in margarines without drastic modification of their textural properties. Its saturated fatty acids (SFA) content and high melting point make this oil a good alternative for that purpose. Palm oil was present in all the analysed products, which resulted in increased levels of palmitic acid from 13% (brand 3) to 19% (brand 1). The incorporation of palm oil into the final blends was well balanced from the nutritional perspective. The total SFA content of the new margarines is lower (Table 2) than in the high TFA margarines of the past, wherein the mean value of SFA plus TFA was generally 40 g/100 g fat (Table 1), a value that even exceeded the content of MUFA or PUFA in the earlier products. Furthermore, according to current European nutrition claims regulation (Regulation 1924/2006) [70], brands 3 and 5 could claim “high in polyunsaturated fat” (with >45% PUFA content and PUFA providing >20% total energy of the product).
Table 3 shows the lipid profile data expressed over g/100 g product. Brands 1 to 3 contained approximately 60 g fat/100 g and led to higher TFA values (up to 0.44 g/100 g product) than brands 4 to 6, which contained only 40% fat and lower TFA values (up to 0.22 g/100 g). When comparing these data to the limit set by the USA regulation to consider a “trans free product” (0.5 g TFA/serving), all of them complied with this condition, including the store brands, with values from 0.02 to 0.07 g/serving (serving size = 15 g). SFA content, which should be declared in the nutrition facts table, ranged from 9.66 g/100 g product (brand 5) to 16.72 g/100 g (brand 2). Thus, taking into account these data, one serving of the analysed products would supply between 0.65 and 1.12% of an individual’s total energy value, which can be considered low, taking into account the suggestion to limit the intake of SFA to less that 10% of total energy [1].
4.2. Analysed French Fries
The frying process implies degradation of oils and fats, leading to numerous fatty acid alteration products that are absorbed by the fried foods. Among the degradation products are trans fatty acids formed as a consequence of the geometrical isomerization of double bonds [71]. In this sense, it has been described that the repeated use of frying oil for two weeks resulted in a significant increase in TFA content in the extracted oils from French fries purchased in fast food restaurants [69]. It was for this reason that partially hydrogenated oils were generally used for deep fat frying because of the stability of these lipids against oxidative deterioration during frying.
For some time now, frying methods and oils used have been progressively altered to minimize TFA presence in French fries. As is evident in Table 1, better frying practices led to decreased TFA content from values around 30% in 1998 [64], and even up to 42% in 2006 [65], to values lower than 2% in more recent studies [17,19,69].
Our data confirmed the reduction of TFA in French fries available from five Spanish fast food chains (Table 4). The mean value for the five brands was 0.61 g/100 g, which is significantly lower than the data reported by previous studies in Spain. Figure 1b shows the differences between this data and that obtained from earlier studies (1998 [64] and 2006 [65], 2008 [66] and 2009 [43]).
Brand 4, the highest in TFA (0.89 g/100 g), was characterized by a higher linoleic and lower oleic content compared to the rest of brands. Oleic was by far the most abundant fatty acid in brands 1, 2, 3, and 5 (mean value 64.13%), while linoleic acid was the most abundant acid in brand 4 (51.03%). These data were related to another remarkable difference of brand 4, which was the relative abundance of the trans 18:2 to the trans 18:1 FA isomer; only 30% of the total TFA derived from C18:1 isomers, with C18:2 isomers being the major contributors to this type of lipid (64%). The high oleic acid content in four of the five brands analysed could be explained by the use of high oleic sunflower oil (probably in brands 1 and 5, in which very low values of palmitic acid were noticed) or by the use of olive oil or blends of high oleic sunflower with palm oil (brands 2 and 3, with palmitic around 14%).
Also, a noticeable reduction in the total fat content of the French fries was observed in this study (Table 5) compared to previous reports. Fernández-San Juan [43] reported an average fat content of 20.4 g/100 g, whereas, in our study, the percentage of fat for different brands ranged from 8.32% (brand 3) to 14.58% (brand 1). This decrease in the fat content led to the significantly lower energy value of these products, which was a positive consequence, as high energy content has been one of the drawbacks that has traditionally been pointed out for fast food French fries [72].
Expressing the TFA content in g/100 g product (Table 5) led to very low values, ranging from 0.04 to 0.11 g TFA/100 g product. It has to be mentioned that a significant correlation was found between the PUFA content and the TFA content (Pearson R = 0.6; p < 0.001), whereas no association was found for TFA and MUFA, pointing to a higher susceptibility of trans fat formation from PUFA than from MUFA. Using the serving size criteria, very low values were also found (lower than 0.11 g TFA/serving), which allowed all these products to claim “trans free product”. On the other hand, the energy supply from the high MUFA content in brands 1, 2, 3, and 4 (>20% of total energy) allowed these products to claim ‘high monounsaturated fat’ according to the current European Regulation 1924/2006.
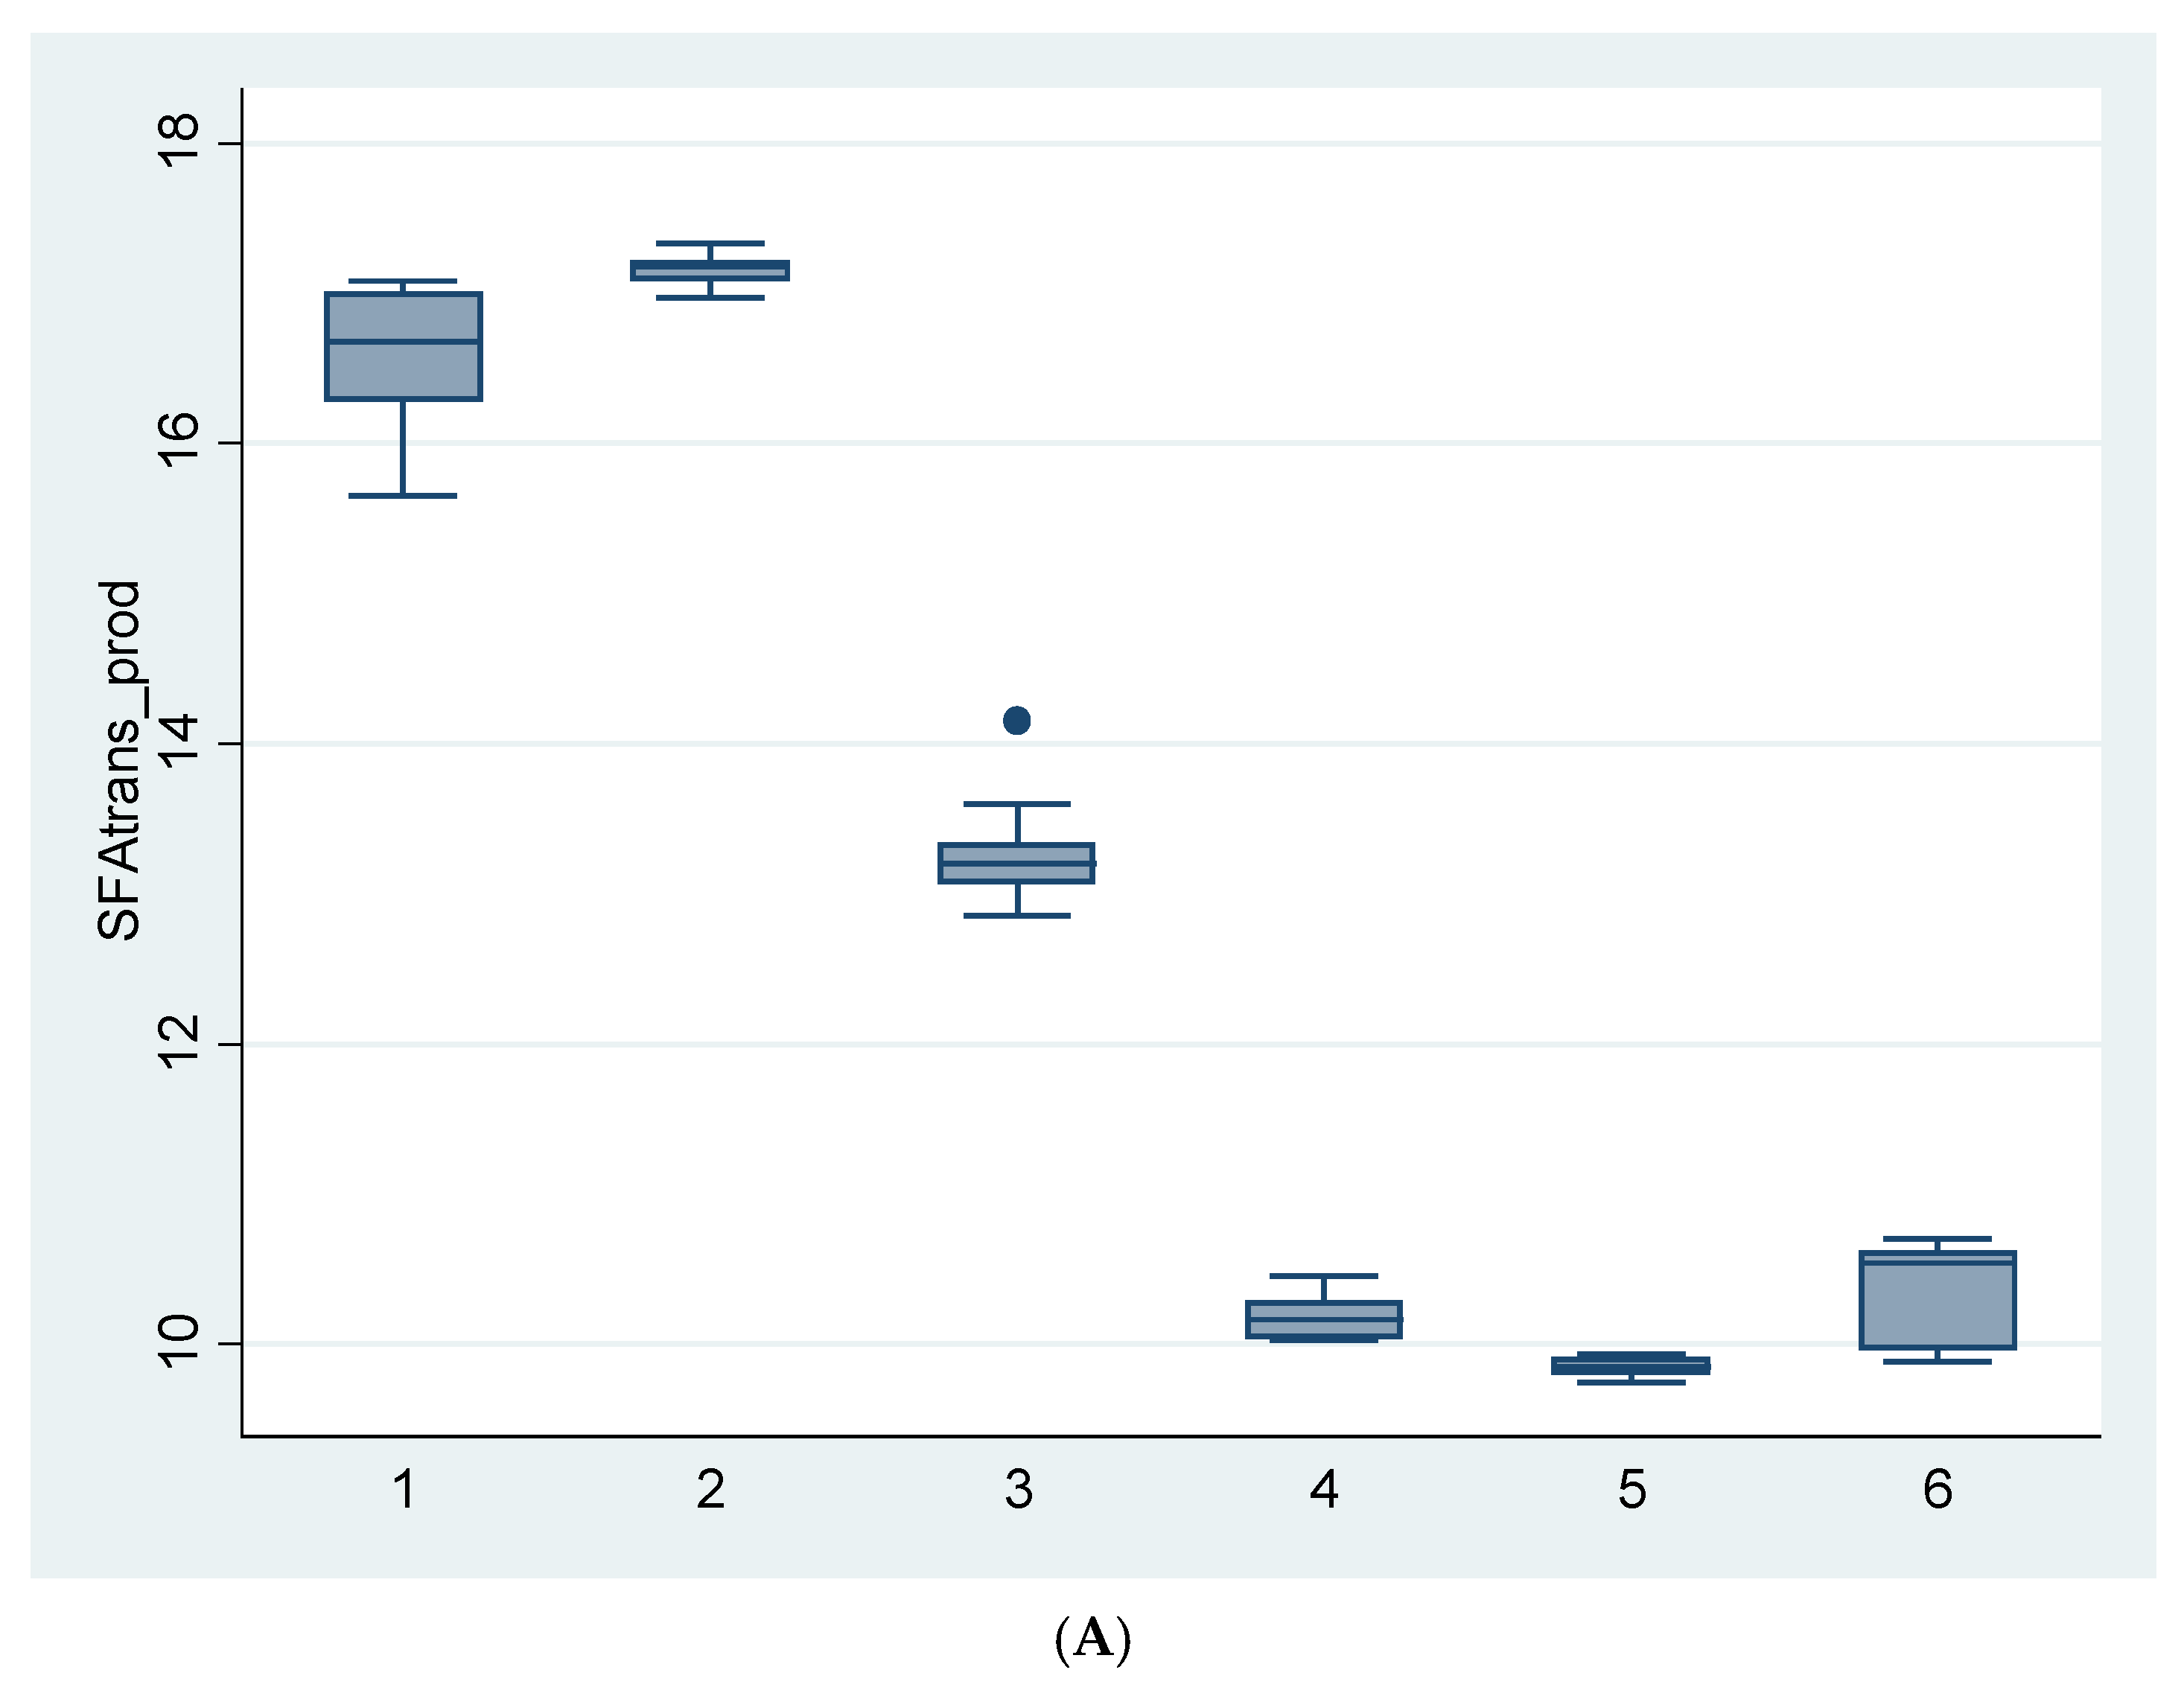
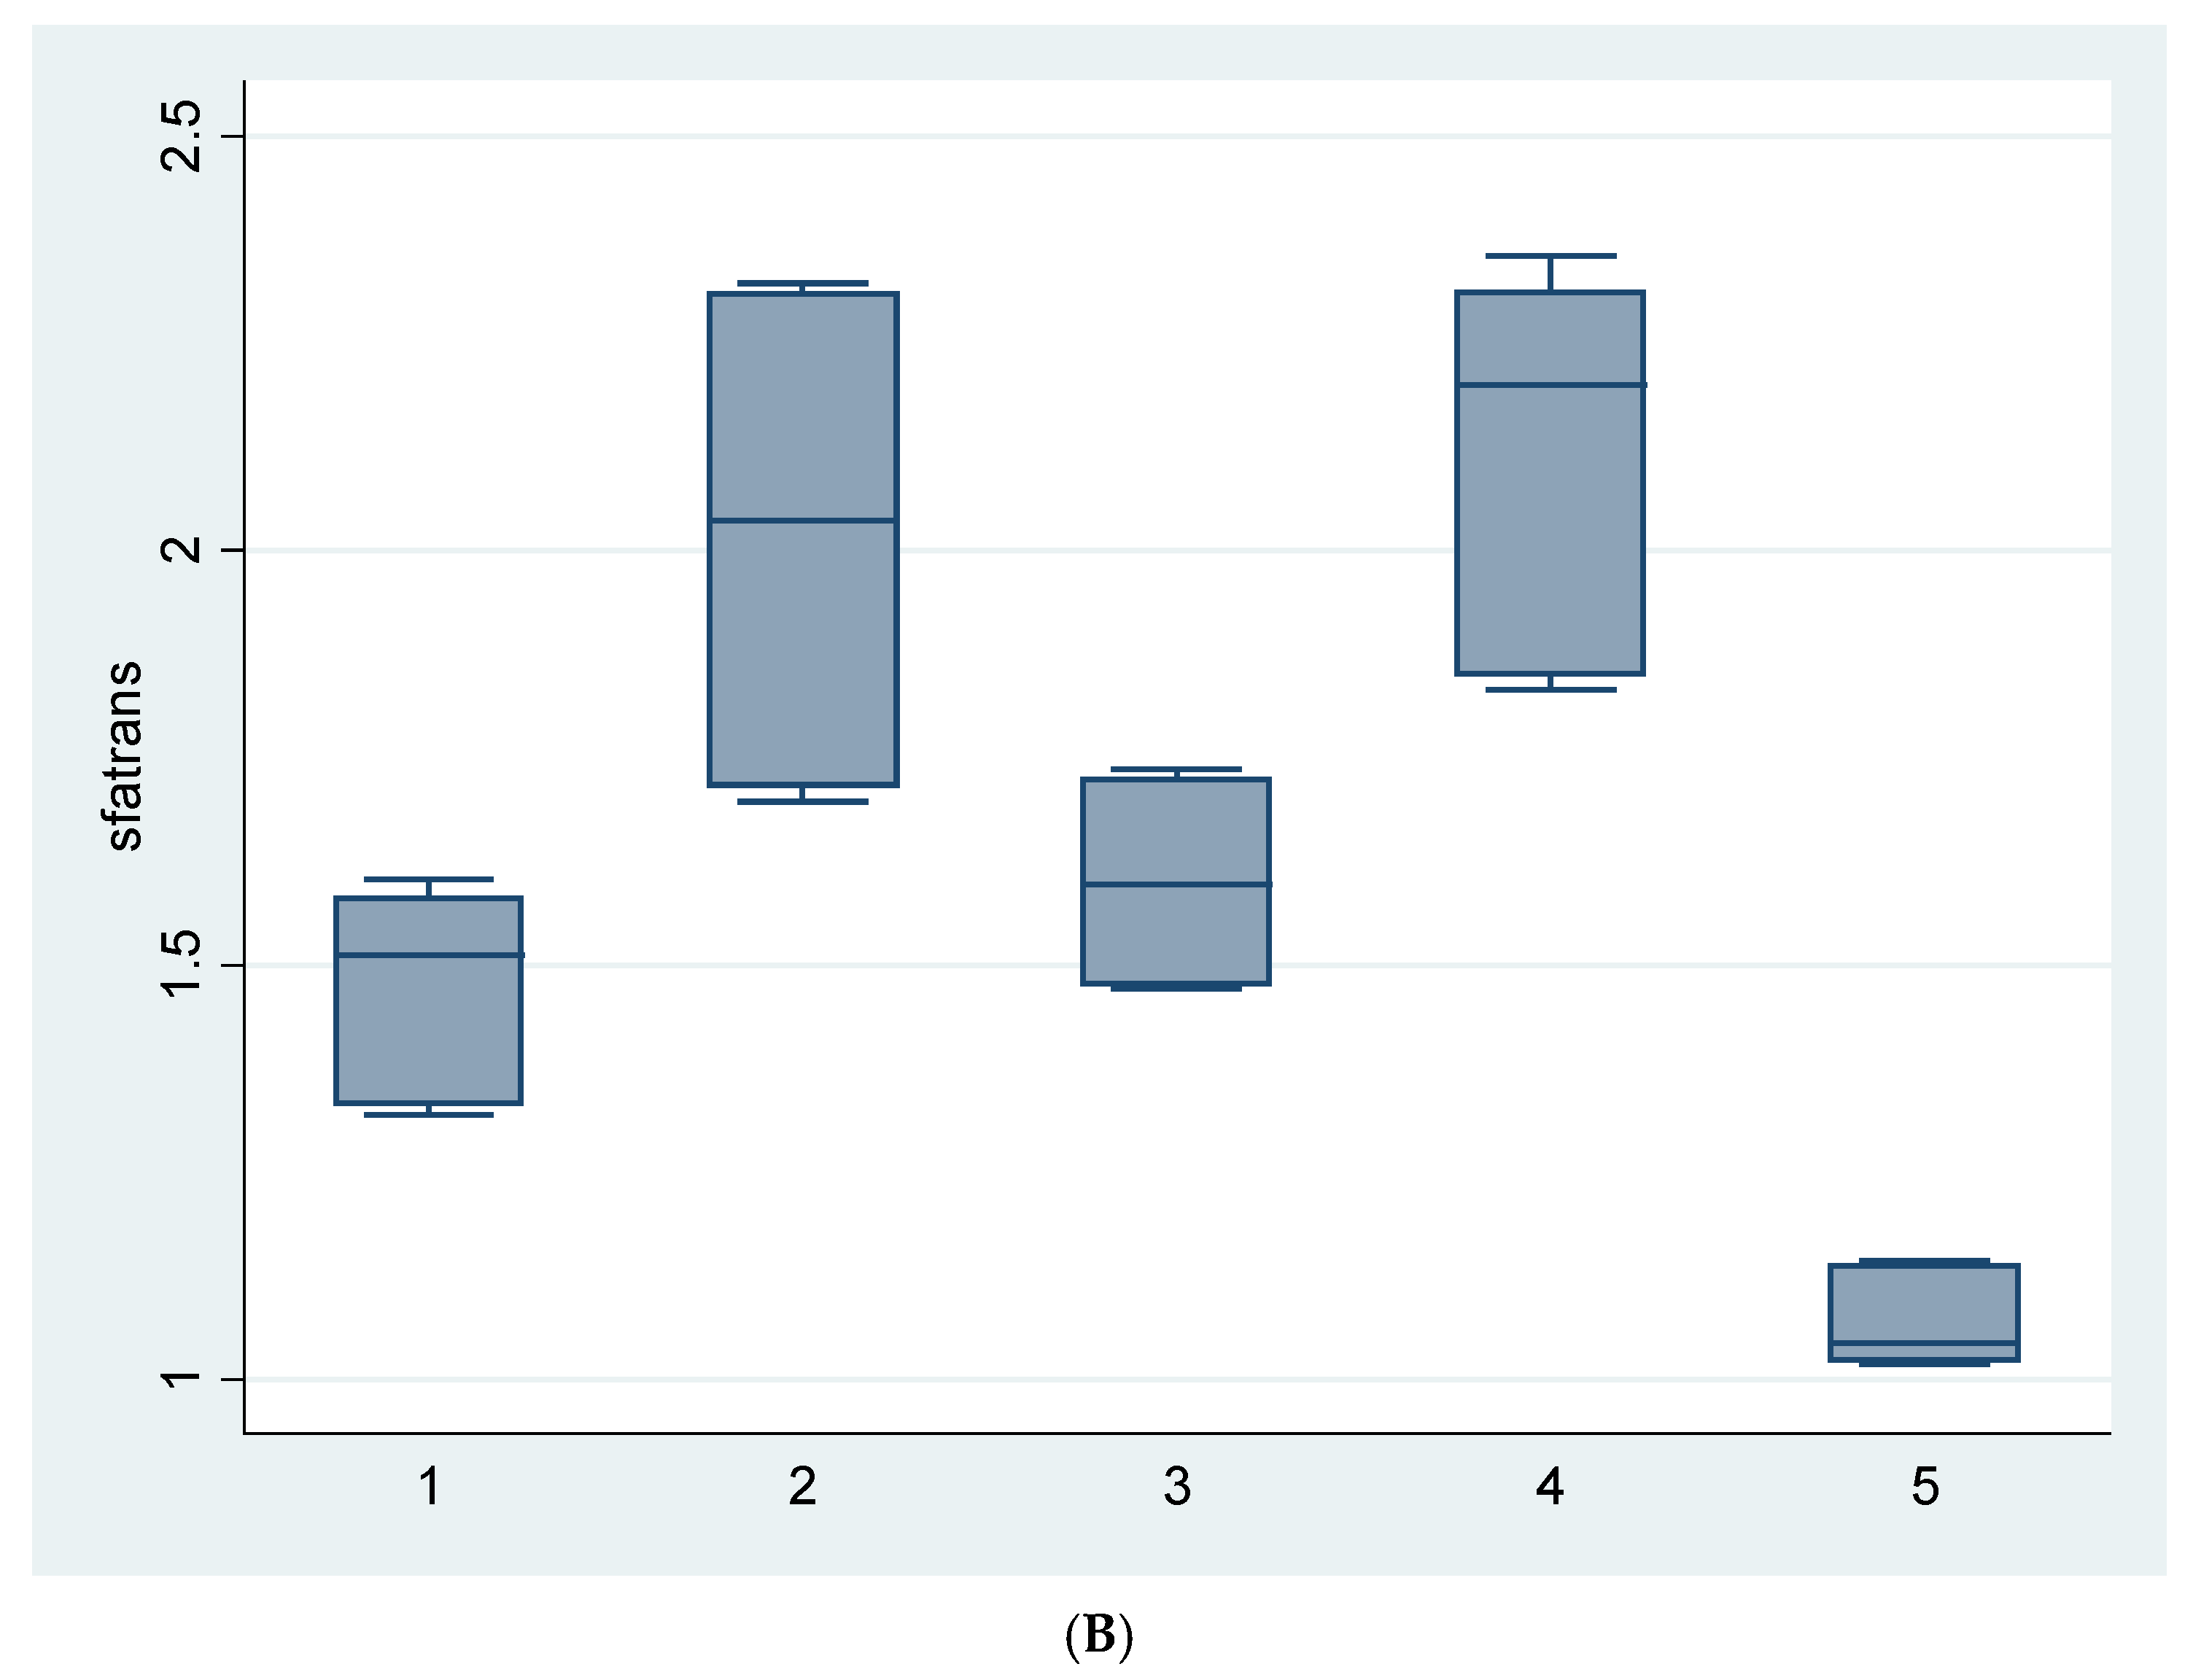
Considering the well-known implications of SFA and TFA on coronary heart disease, the optimal dietary intake of SFA is set at <10% of the total energy value (E), whereas the optimal intake for TFA is set at <0.5% E [1]. The sum of both types of fatty acids (g/100 g product) is presented in Figure 2. In the case of margarines, the premium brands showed lower total values compared to the store brands. In these samples, the sum of SFA plus TFA (9.8–17.2 g/100 g product) supplied between 22–29.5% of the total energy of the food. However, in the case of French fries, the contribution of SFA plus TFA (1.1–2.1 g/100 g product) to the total energy value was very low (4–7%). These data pointed out that the decrease in TFA content did not lead to a significant increase in SFA content and that the sum of both fractions resulted in much lower values than those found in the past. Nevertheless, the daily average intake of these two products should be taken into account to determine their contribution of these amounts to the total diet.
4.3. Conclusions
Food frequency questionnaires and food composition tables are two remarkable and useful tools in many epidemiological and interventional studies, the role of which is to provide accurate information and detect appropriate targets for public health nutrition campaigns. According to Brownell and Pomeranz [73], the government has the authority and responsibility to regulate the unhealthful aspects of the food supply, and this should be done while relying on accurate data. This paper reported data on Spanish margarines (premium and store brands) and fast-food French fries from five well-known international chains, showing the very low TFA contents of both types of products. In the case of margarines, the low TFA content was achieved using appropriate oil blends, and, in the case of French fries, the reduction was due to the combined effect of using better quality oils and applying frying methods that result in a lower total fat content in the product. Interestingly, the decrease in TFA was not linked to increments in the SFA content.
Supplementary Materials
The following are available online at www.mdpi.com/2072-6643/9/7/662/s1, Figure S1: Partial GC chromatogram showing a typical margarine FA profile, Figure S2: Partial GC chromatogram showing a typical French fries FA profile.
Acknowledgments
Gwenaelle Ceniceros is acknowledged for her contribution to the analysis of samples.
Author Contributions
Giulia Gatta and Elena Abella performed the analysis in the laboratory, and Diana Ansorena and Iciar Astiasarán designed the study and wrote the manuscript.
Conflicts of Interest
The authors declare no conflict of interest.
Abbreviations
| TFA | trans fatty acids |
| SFA | Saturated fatty acids |
| PUFA | Polyunsaturated fatty acids |
| MUFA | Monounsaturated fatty acids |
References
- Wang, Q.; Afshin, A.; Yakoob, M.Y.; Singh, G.M.; Rehm, C.D.; Khatibzadeh, S.; Micha, R.; Shi, P.; Mozaffarian, D.; Mozaffarian, D.; et al. Impact of Nonoptimal Intakes of Saturated, Polyunsaturated, and trans Fat on Global Burdens of Coronary Heart Disease. J. Am. Heart Assoc. 2016, 5, e002891. [Google Scholar] [CrossRef] [PubMed]
- Mozaffarian, D.; Aro, A.; Willett, W.C. Health effects of trans-fatty acids: Experimental and observational evidence. Eur. J. Clin. Nutr. 2009, 63, S5–S21. [Google Scholar] [CrossRef] [PubMed]
- Downs, S.M.; Thow, A.M.; Leeder, S.R. The effectiveness of policies for reducing dietary trans fat: A systematic review of the evidence. Bull. World Health Organ. 2013, 91, 262–269. [Google Scholar] [CrossRef] [PubMed]
- Menaa, F.; Menaa, A.; Menaa, B.; Treton, J. Trans-fatty acids, dangerous bonds for health? A background review paper of their use, consumption, health implications and regulation in France. Eur. J. Nutr. 2013, 52, 1289–1302. [Google Scholar] [CrossRef] [PubMed]
- WHO. Eliminating trans Fats in Europe: A Policy Brief. 2015. Available online: http://www.euro.who.int/en/health-topics/disease-prevention/nutrition/publications/2015/eliminating-trans-fats-in-europe-a-policy-brief-2015 (accessed on 27 June 2017).
- Ratnayake, W.M.N.; Swist, E.; Zoka, R.; Gagnon, C.; Lillycrop, W.; Pantazapoulos, P. Mandatory trans fat labeling regulations and nationwide product reformulations to reduce trans fatty acid content in foods contributed to lowered concentrations of trans fat in Canadian women’s breast milk samples collected in 2009–2011. Am. J. Clin. Nutr. 2014, 100, 1036–1040. [Google Scholar] [CrossRef] [PubMed]
- Schwenke, D.C.; Foreyt, J.P.; Miller, E.R.; Reeves, R.S.; Vitolins, M.Z. Oxidative Stress Subgroup of the Look AHEAD Research Group. Plasma concentrations of trans fatty acids in persons with type 2 diabetes between September 2002 and April 2004. Am. J. Clin. Nutr. 2013, 97, 862–871. [Google Scholar] [CrossRef] [PubMed]
- Von Schacky, C.; Passow, A.; Kiefl, R. Trans-fatty acid levels in erythrocytes in Europe. Eur. J. Nutr. 2017, 56, 1719. [Google Scholar] [CrossRef] [PubMed]
- Danish Food Authorities. Order on the content of TFA in Oils and Fats. 11 March 2003 Concerning Changes to Act nr 471 of 1 July 1998; Announcement nr 160; Danish Food Authorities: Copenhagen, Denmark, 2003; pp. 1–2. [Google Scholar]
- Restrepo, B.J.; Rieger, M. Denmark’s policy on artificial trans fat and cardiovascular disease. Am. J. Prev. Med. 2016, 50, 69–76. [Google Scholar] [CrossRef] [PubMed]
- Uauy, R.; Aro, A.; Clarke, R.; Ghafoorunissa, R.; L’Abbe, M.; L’Abbé, M.R.; Mozaffarian, D.; Skeaff, C.M.; Stender, S.; Tavella, M. WHO Scientific Update on trans fatty acids: Summary and conclusions. Eur. J. Clin. Nutr. 2009, 63, S68–S75. [Google Scholar] [CrossRef]
- Brouwer, I.A.; Wanders, A.J.; Katan, M.B. Trans fatty acids and cardiovascular health: Research completed? Eur. J. Clin. Nutr. 2013, 67, 541–547. [Google Scholar] [CrossRef] [PubMed]
- Skeaff, C.M. Feasibility of recommending certain replacement or alternative fats. Eur. J. Clin. Nutr. 2009, 63, S34–S49. [Google Scholar] [CrossRef] [PubMed]
- Wang, F.C.; Gravelle, A.J.; Blake, A.I.; Marangoni, A.G. Novel trans fat replacement strategies. Curr. Opin. Food Sci. 2016, 7, 27–34. [Google Scholar] [CrossRef]
- Menaa, F.; Menaa, A.; Tréton, J.; Menaa, B. Technological approaches to minimize industrial trans fatty acids in foods. J. Food Sci. 2013, 78, R377–R386. [Google Scholar] [CrossRef] [PubMed]
- Teixeira Santos, L.A.; Cruz, R.; Casal, S. Trans fatty acids in commercial cookies and biscuits: An update of Portuguese market. Food Control 2015, 47, 141–146. [Google Scholar] [CrossRef]
- Karim, Z.; Khan, K.M.; Ahmed, S.; Karim, A. Assessment of trans fatty acid level in French fries from various fast food outlets in Karachi, Pakistan. J. Am. Oil Chem. Soc. 2014, 91, 1831–1836. [Google Scholar] [CrossRef]
- Lima Dias, F.d.S.; Assis Passos, M.E.; Tavares do Carmo, M.d.G.; Mendes Lopes, M.L.; Valente Mesquita, V.L. Fatty acid profile of biscuits and salty snacks consumed by Brazilian college students. Food Chem. 2015, 171, 351–355. [Google Scholar] [CrossRef] [PubMed]
- Roe, M.; Pinchen, H.; Church, S.; Elahi, S.; Walker, M.; Farron-Wilson, M.; Buttriss, J.; Finglas, P. Trans fatty acids in a range of UK processed foods. Food Chem. 2013, 140, 427–431. [Google Scholar] [CrossRef] [PubMed]
- Wagner, K.; Plasser, E.; Proell, C.; Kanzler, S. Comprehensive studies on the trans fatty acid content of Austrian foods: Convenience products, fast food and fats. Food Chem. 2008, 108, 1054–1060. [Google Scholar] [CrossRef] [PubMed]
- Baylin, A.; Siles, X.; Donovan-Palmer, A.; Fernandez, X.; Campos, H. Fatty acid composition of Costa Rican foods including trans fatty acid content. J. Food Compos. Anal. 2007, 20, 182–192. [Google Scholar] [CrossRef]
- Meremaee, K.; Roasto, M.; Kuusik, S.; Ots, M.; Henno, M. Trans fatty acid contents in selected dietary fats in the Estonian market. J. Food Sci. 2012, 77, T163–T168. [Google Scholar] [CrossRef] [PubMed]
- Saunders, D.; Jones, S.; Devane, G.J.; Scholes, P.; Lake, R.J.; Paulin, S.M. Trans fatty acids in the New Zealand food supply. J. Food Compos. Anal. 2008, 21, 320–325. [Google Scholar] [CrossRef]
- Richter, E.K.; Shawish, K.A.; Scheeder, M.R.L.; Colombani, P.C. Trans fatty acid content of selected Swiss foods: The Trans Swiss Pilot study. J. Food Compos. Anal. 2009, 22, 479–484. [Google Scholar] [CrossRef]
- Vucic, V.; Arsic, A.; Petrovic, S.; Milanovic, S.; Gurinovic, M.; Glibetic, M. Trans fatty acid content in Serbian margarines: Urgent need for legislative changes and consumer information. Food Chem. 2015, 185, 437–440. [Google Scholar] [CrossRef] [PubMed]
- Saadeh, C.; Toufeili, I.; Habbal, M.Z.; Nasreddine, L. Fatty acid composition including trans-fatty acids in selected cereal-based baked snacks from Lebanon. J. Food Compos. Anal. 2015, 41, 81–85. [Google Scholar] [CrossRef]
- Ansorena, D.; Echarte, A.; Olle, R.; Astiasaran, I. 2012: No trans fatty acids in Spanish bakery products. Food Chem. 2013, 138, 422–429. [Google Scholar] [CrossRef] [PubMed]
- Astiasaran, I.; Ansorena, D.; Echarte, A.; Olle, R.; Pascual, M. Trans fatty acids in bakery products and snacks [Presencia de ácidos grasos trans en productos de bollería y de aperitivo]. An. Real Acad. Farm. 2013, 79, 646–657. [Google Scholar]
- Stender, S.; Dyerberg, J.; Bysted, A.; Leth, T.; Astrup, A. A trans world journey. Atheroscler. Suppl. 2006, 7, 47–52. [Google Scholar] [CrossRef] [PubMed]
- Katan, M.B. Regulation of trans fats: The gap, the Polder, and McDonald’s French fries. Atheroscler. Suppl. 2006, 7, 63–66. [Google Scholar] [CrossRef] [PubMed]
- Baylin, A. Secular trends in trans fatty acids: Decreased trans fatty acids in the food supply are reflected in decreased trans fatty acids in plasma. Am. J. Clin. Nutr. 2013, 97, 665–666. [Google Scholar] [CrossRef] [PubMed]
- Aldai, N.; de Renobales, M.; Barron, L.J.R.; Kramer, J.K.G. What are the trans fatty acids issues in foods after discontinuation of industrially produced trans fats? Ruminant products, vegetable oils, and synthetic supplements. Eur. J. Lipid Sci. Technol. 2013, 115, 1378–1401. [Google Scholar] [CrossRef]
- Riobo, P.; Breton, I. Intake of Trans Fats; Situation in Spain. Nutr. Hosp. 2014, 29, 704–711. [Google Scholar] [PubMed]
- FDA. Department of Health and Human Services (DHHS)/Food and Drug Administration (FDA). Talking about Trans Fats: What You Need to Know. Food Facts. 2014. Available online: http://marshallsportsmedicine.org/assets/Documents/Patient-Education/Food-Facts-Trans-Fat.pdf (accessed on 27 June 2017).
- No. 2991/94 of 5 December 1994 Laying Down Standards for Spreadable Fats; OJ L 176 of 9.12.1994. Available online: http://eur-lex.europa.eu/legal-content/EN/ALL/?uri=CELEX%3A31994R2991 (accessed on 27 June 2017).
- Association of Official Analytical Chemists. Official Method (2002a) Fat (Crude) or Ether Extract in Meat, 960.39. In Official Method of Analysis; Horwitz, W., Ed.; Association of Official Analytical Chemists: Gaithersburg, ML, USA, 2002; p. 2. [Google Scholar]
- Folch, J.; Lees, M.; Stanley, G.H.S. A simple method for the isolation and purification of total lipids from animal tissues. J. Biol. Chem. 1957, 226, 497–509. [Google Scholar] [PubMed]
- AOAC. Official Method (2002b) Fatty Acids in Oils and Fats, 969.33. In Official Method of Analysis; Horwitz, W., Ed.; Association of Official Analytical Chemists: Gaithersburg, ML, USA, 2002; p. 19. [Google Scholar]
- Bravo-Lamas, L.; Barron, L.J.R.; Kramer, J.K.G.; Etaio, I.; Aldai, N. Characterization of the fatty acid composition of lamb commercially available in northern Spain: Emphasis on the trans-18:1 and CLA content and profile. Meat Sci. 2016, 117, 108–116. [Google Scholar] [CrossRef] [PubMed]
- Tyburczy, C.; Delmonte, P.; Fardin-Kia, A.R.; Mossoba, M.M.; Kramer, J.K.G.; Rader, J.I. Profile of trans fatty acids (FAs) including trans polyunsaturated FAs in representative fast food samples. J. Agric. Food Chem. 2012, 60, 4567–4577. [Google Scholar] [CrossRef] [PubMed]
- Stender, S.; Astrup, A.; Dyerberg, J. A trans European Union difference in the decline in trans fatty acids in popular foods: A market basket investigation. BMJ Open 2012, 2, e000859. [Google Scholar] [CrossRef] [PubMed]
- Hendry, V.L.; Almiron-Roig, E.; Monsivais, P.; Jebb, S.A.; Neelon, S.E.B.; Griffin, S.J.; Ogilvie, D.B. Impact of regulatory interventions to reduce Intake of artificial trans-fatty acids: A systematic review. Am. J. Public Health 2015, 105, E32–E42. [Google Scholar] [CrossRef] [PubMed]
- Fernandez-San Juan, P. Trans fatty acids (tFA): Sources and intake levels, biological effects and content in commercial Spanish food. Nutr. Hosp. 2009, 24, 515–520. [Google Scholar] [PubMed]
- Alonso, L.; Fraga, M.J.; Juarez, M. Determination of trans fatty acids and fatty acid profiles in margarines marketed in Spain. J. Am. Oil Chem. Soc. 2000, 77, 131–136. [Google Scholar] [CrossRef]
- Galvin, S.; Guillen-Sans, R.; Galbis, J.A.; Guzman-Chozas, M. Trans fatty acids in two classes of reformulated “zero trans” Spanish margarines by use of second derivative ATR-FTIR spectroscopy. Lwt-Food Sci. Technol. 2016, 65, 1066–1071. [Google Scholar] [CrossRef]
- Lake, R.; Thomson, B.; Devane, G.; Scholes, P. Trans fatty acid content of selected New Zealand foods. J. Food Compo. Anal. 1996, 9, 365–374. [Google Scholar] [CrossRef]
- Ratnayake, W.; Pelletier, C.; Hollywood, R.; Bacler, S.; Leyte, D. Trans fatty acids in Canadian margarines: Recent trends. J. Am. Oil Chem. Soc. 1998, 75, 1587–1594. [Google Scholar] [CrossRef]
- Wagner, K.; Auer, E.; Elmadfa, I. Content of trans fatty acids in margarines, plant oils, fried products and chocolate spreads in Austria. Eur. Food Res. Technol. 2000, 210, 237–241. [Google Scholar] [CrossRef]
- Tavella, M.; Peterson, G.; Espeche, M.; Cavallero, E.; Cipolla, L.; Perego, L.; Caballero, B. Trans fatty acid content of a selection of foods in Argentina. Food Chem. 2000, 69, 209–213. [Google Scholar] [CrossRef]
- Tekin, A.; Cizmeci, M.; Karabacak, H.; Kayahan, M. Trans FA and solid fat contents of margarines marketed in Turkey. J. Am. Oil Chem. Soc. 2002, 79, 443–445. [Google Scholar] [CrossRef]
- Marekov, I.; Tarandjiiska, R.; Panayotova, S.; Nikolova, N. Comparison of fatty acid composition of domestic and imported margarines and frying fats in Bulgaria. Eur. J. Lipid Sci. Technol. 2002, 104, 410–418. [Google Scholar] [CrossRef]
- Karabulut, I.; Turan, S. Some properties of margarines and shortenings marketed in Turkey. J. Food Compos. Anal. 2006, 19, 55–58. [Google Scholar] [CrossRef]
- Ratnayake, W.M.N.; Gagnon, C.; Dumais, L.; Lillycrop, W.; Wong, L.; Meleta, M.; Calway, P. Trans fatty acid content of Canadian margarines prior to mandatory trans fat labelling. J. Am. Oil Chem. Soc. 2007, 84, 817–825. [Google Scholar] [CrossRef]
- McCarthy, J.; Barr, D.; Sinclair, A. Determination of trans fatty acid levels by FTIR in processed foods in Australia. Asia Pac. J. Clin. Nutr. 2008, 17, 391–396. [Google Scholar] [PubMed]
- Haytowitz, D.B.; Pehrsson, P.R.; Holden, J.M. The national food and nutrient analysis program: A decade of progress. J. Food Compos. Anal. 2008, 21, S94–S102. [Google Scholar] [CrossRef] [PubMed]
- Fu, H.; Yang, L.; Yuan, H.; Rao, P.; Lo, Y.M. Assessment of trans fatty acids content in popular Western-style products in China. J. Food Sci. 2008, 73, S383–S391. [Google Scholar] [CrossRef] [PubMed]
- Basol, B.; Tasan, M. Fatty acid compositions of Turkish shortenings with emphasis on trans fatty acids. J. Food Lipids 2008, 15, 240–250. [Google Scholar] [CrossRef]
- Albers, M.J.; Harnack, L.J.; Steffen, L.M.; Jacobs, D.R. 2006 marketplace survey of trans-fatty acid content of margarines and butters, cookies and snack cakes, and savory snacks. J. Am. Diet. Assoc. 2008, 108, 367–370. [Google Scholar] [CrossRef] [PubMed]
- Cavendish, T.A.; Lemos, P.B.; Yokota, R.T.; Vasconcelos, T.F.; Coelho, P.F.; Buzzi, M.; Ito, M.K. Fatty acid composition of hydrogenated or interesterified margarines. Cienc. Tecnol. Aliment. 2010, 30, 138–142. [Google Scholar] [CrossRef]
- Kuhnt, K.; Baehr, M.; Rohrer, C.; Jahreis, G. Trans fatty acid isomers and the trans-9/trans-11 index in fat containing foods. Eur. J. Lipid Sci. Technol. 2011, 113, 1281–1292. [Google Scholar] [CrossRef] [PubMed]
- Pajin, B.; Soronja-Simovic, D.; Seres, Z.; Gyura, J.; Radujko, I.; Sakac, M. Physicochemical and textural properties of puff pastry margarines. Eur. J. Lipid Sci. Technol. 2011, 113, 262–268. [Google Scholar] [CrossRef]
- Hernandez-Martinez, M.; Gallardo-Velazquez, T.; Osorio-Revilla, G. Fatty acid profile including trans fatty acid content of margarines marketed in Mexico. J. Am. Oil Chem. Soc. 2011, 88, 1485–1495. [Google Scholar] [CrossRef]
- Costa, N.; Cruz, R.; Graça, P.; Breda, J.; Casal, S. Trans fatty acids in the Portuguese food market. Food Control 2016, 64, 128–134. [Google Scholar] [CrossRef] [PubMed]
- Aro, A.; Amaral, E.; Kesteloot, H.; Rimestad, A.; Thamm, M.; van Poppel, G. Trans Fatty Acids in French Fries, Soups, and Snacks from 14 European Countries: The TRANSFAIR Study. J. Food Compos. Anal. 1998, 11, 170–177. [Google Scholar] [CrossRef]
- Stender, S.; Dyerberg, J.; Astrup, A. High levels of industrially produced trans fat in popular fast foods. N. Engl. J. Med. 2006, 354, 1650–1652. [Google Scholar] [CrossRef] [PubMed]
- Barrado, E.; Mayo, M.T.; Tesedo, A.; Romero, H.; de la Rosa, F. Fat composition of several “Fast Food”. Nutr. Hosp. 2008, 23, 148–158. [Google Scholar] [PubMed]
- Fritsche, J.; Petersen, K.D.; Jahreis, G. Trans octadecenoic fatty acid (TFA) isomers in German foods and bakery goods. Eur. J. Lipid Sci. Technol. 2010, 112, 1363–1368. [Google Scholar] [CrossRef]
- Chung, S.W.C.; Tong, S.K.; Lin, V.F.P.; Chen, M.Y.Y.; Ma, J.K.M.; Xiao, Y.; Ho, Y.Y. Trans fatty acids in the Hong Kong food supply. J. Chem. 2013. [Google Scholar] [CrossRef]
- Yildirim, E.; Toker, O.S.; Karaman, S.; Kayacier, A.; Dogan, M. Investigation of fatty acid composition and trans fatty acid formation in extracted oils from French-fried potatoes and classification of samples using chemometric approaches. Turk. J. Agric. For. 2015, 39, 80–90. [Google Scholar] [CrossRef]
- Regulation (EC) No 1924/2006 of the European Parliament and of the Council of 20 December 2006 on Nutrition and Health Claims Made on Foods. Available online: http://eur-lex.europa.eu/legal-content/en/ALL/?uri=CELEX%3A32006R1924 (accessed on 27 June 2017).
- Bruehl, L. Fatty acid alterations in oils and fats during heating and frying. Eur. J. Lipid Sci. Technol. 2014, 116, 707–715. [Google Scholar] [CrossRef]
- Poti, J.M.; Slining, M.M.; Popkin, B.M. Where are kids getting their empty calories? Sores, schools, and fast-food restaurants each played an important role in empty calorie intake among US children during 2009–2010. J. Acad. Nutr. Diet. 2014, 114, 908–917. [Google Scholar] [CrossRef] [PubMed]
- Brownell, K.D.; Pomeranz, J.L. The Trans-Fat ban-food regulation and long-term health. N. Engl. J. Med. 2014, 370, 1773–1775. [Google Scholar] [CrossRef] [PubMed]
Figure 1.
Evolution of the TFA content (g/100 g fat) in (a) margarines and (b) French fries in Spain. Between brackets, the reference of the paper is indicated.
Figure 1.
Evolution of the TFA content (g/100 g fat) in (a) margarines and (b) French fries in Spain. Between brackets, the reference of the paper is indicated.

Figure 2.
Boxplot for the sum of SFA plus trans fat (g/100 g product) for all samples analyzed. The median, 25th, and 75th quartiles and the maximum and minimum values are represented. SFA: sum of saturated fatty acids. (A) Margarines and (B) French fries.
Figure 2.
Boxplot for the sum of SFA plus trans fat (g/100 g product) for all samples analyzed. The median, 25th, and 75th quartiles and the maximum and minimum values are represented. SFA: sum of saturated fatty acids. (A) Margarines and (B) French fries.


Table 1.
Evolution of the trans fat content in margarines and French fries worldwide (references in chronological order).
Table 1.
Evolution of the trans fat content in margarines and French fries worldwide (references in chronological order).
| Authors and Country of the Work | Ref. | Notes | %Fat | g TFA/100 g Fat | g TFA/100 g Product | g TFA + SFA/100 g Fat |
|---|---|---|---|---|---|---|
| Margarines | ||||||
| Lake et al. (1996)–New Zealand | [46] | Margarines | 68.9 | 16.4 (12.6–19.7) | 11.3 (8.7–13.6) | |
| Table spreads | 37.38 | 15.7 (14.3–16.9) | 5.9 (5.3–6.3) | |||
| Butter/margarine blends | 64.42 | 9.6 (6.1–13.1) | 6.2 (3.9–8.4) | |||
| Ratnayake et al. (1998)–Canada | [47] | Tub margarines from non hydrogenated VO | - | 2.2 (0.9–5.0) | - | - |
| Tub margarines from partially hydrogenated VO | - | 21.4 (10.5–44.8) | - | - | ||
| Print margarines from partially hydrogenated VO | - | 34.3 (16.3–47.7) | - | - | ||
| Wagner et al. (2000)–Austria | [48] | Margarines | - | 1.6 (0.3–3.73) | - | - |
| Alonso et al. (2000)–Spain | [44] | Margarines | 63.5 | 8.87 (0.40–21.28) | 5.63 | 35.03 (27.4–45.27) |
| Tavella et al. (2000)–Argentina | [49] | Margarines | 82 | 25.38 | 20.81 | - |
| Margarines | 50 | 31.84 | 15.92 | - | ||
| Tekin et al. (2002)–Turkey | [50] | Margarines - Stick | - | 19 (0–37.8) | - | 56.3 |
| Marekov et al. (2002)–Bulgaria | [51] | Margarines | 80 | 1.6 | 1.28 | 28.5 |
| Karabulut & Turan (2006)–Turkey | [52] | Shortenings | - | 8.95 (2–16.5) | 50.8 | |
| Baylin et al. (2007)–Costa Rica | [21] | Stick regular | - | 13.25 | - | 50.47 |
| Ratnayake et al. (2007)–Canada | [53] | Tub margarines from non hydrogenated VO | - | 0.8 (0.5–1.7) | - | - |
| Tub margarines from partially hydrogenated VO | - | 20 (17.0–32.6) | - | - | ||
| Print margarines from partially hydrogenated VO | - | 39.3 (39.2–42.9) | - | - | ||
| McCarthy et al. (2008)–Australia | [54] | Hard margarines | 90.4 (80.5–100) | 3.2 (1.7–4.5) | 3.0 (1.7–4.5) | - |
| Soft margarines | 64.6 | 11.6 | 7.5 | - | ||
| Haytowitz et al. (2008)–USA | [55] | Margarines -Data 2002 | 80 | 19.69 | 13.3 | - |
| Margarines -Data 2006 | 80 | 14.7 (11.2–18.8) | 11.8 (9–15.04) | - | ||
| Wagner et al. (2008)–Austria | [20] | Household margarines | 80 | 1.45 ± 1.99 | 1.16 ± 1.57 | - |
| Industrial margarines | 79.3 | 7.83 ± 9.97 | 6.21 ± 7.84 | - | ||
| Fu et al. (2008)–China | [56] | Margarines | 77.29 (25.02–99.81) | 5.09 (0–13.21) | 3.9 (0–10.21) | - |
| Saunders et al. (2008)–New Zealand | [23] | Margarines and table spreads | 64.9 (58.9–72.1) | 5.3 (2.7–6.9) | 3.4 (1.7–4.5) | 32.8 |
| Basol & Tasan (2008)–Turkey | [57] | Shortenings | - | 12.6 (2.7–23.9) | - | 52.3 |
| Margarines | - | 11.24 (0–39.4) | - | 44.94 | ||
| Albers et al. (2008)–USA | [58] | Margarines | 56.4 | 6.6 ± 10.4 | 3.7 | 25.5 ± 11.1 |
| Fernández-San Juan (2009)–Spain | [43] | Margarines | 2.8 ± 1.7 | |||
| Richter et al. (2009)–Switzerland | [24] | Semi-solid fats | - | 3.86 (0.1–29.3) | - | - |
| Cavendish et al. (2010)–Brazil | [59] | Hydrogenated margarines | 50 | 15.8 | 7.91 ± 1.05 | 39.42 |
| Hydrogenated margarines | 20 | 12.3 | 2.46 ± 0.39 | 34.8 | ||
| Interesterified margarines | 65 | 1.98 | 1.29 ± 0.47 | 27.46 | ||
| Interesterified margarines | 30 | 2.17 | 0.65 ± 0.24 | 26.07 | ||
| Kuhnt et al. (2011)–Germany | [60] | Houlsehold margarines | 70.6 | 0.96 (0.11–4.28) | 0.7 (0.08–3.0) | 33.99 |
| Industrial margarines | 87.8 | 1.70 (0.05–14.38) | 1.5 (0.04–12.6) | 47.06 | ||
| Pajin et al. (2011)–Serbia | [61] | Puff pastry margarines | - | 7.7 (0.68–23.77) | - | 53.73 |
| Hernández-Martínez et al. (2011)–Mexico | [62] | Spreadable margarines | 95 | 5.35 (0–20.66) | 5.12 (0–19.68) | 29.35 |
| Stick margarines | 8.71 (0.25–23.87) | 8.34 (0.24–22.84) | 49.63 | |||
| Meremae et al. (2012)–Estonia | [22] | Margarines | 47.6 | 3.84 (0.04–34.96) | 1.83 | 31.38 |
| Shortenings | 70.62 | 6.11 (0.14–39.50) | 4.31 | 48.39 | ||
| Blended spreads | 65.7 | 2.97 (1.18–9.08) | 1.95 | 61.64 | ||
| Roe et al. (2013)–UK | [19] | Margarine hard block | 76.4 | 0.1 | 0.08 | - |
| Fat spread (41–62% fat) | 59.6 (59.1–60.6) | 0.22 (0.19–0.25) | 0.13 (0.11–0.15) | - | ||
| Fat spread (26–39% fat) | 38.3 (36.9–39.0) | 0.28 (0.15–0.38) | 0.10 (0.06–0.14) | - | ||
| Vucic et al. (2016)–Serbia | [25] | Hard margarines | 80 | 4.5–28.8 | 3.6–23.4 | 58.8 (57.03–63.84) |
| Soft margarines | 50 (25-60) | 2.28 (0.17–6.89) | 0.08–3.4 | 31.5 (23.33–42.36) | ||
| Costa et al. (2016)–Portugal | [63] | Margarines and shortenings | - | 0.83 (0.26–2.16) | 0.56 (0.16–1.57) | - |
| French Fries | ||||||
| Aro et al. (1998)–various countries | [64] | French fries | 14.3 (11–18) | 12–35 33.57 in Spain | 1.7 | - |
| Wagner et al. (2000)–Austria | [48] | French fries | 1.9–18 | 3 | ||
| Stender et al. (2006)–various countries | [65] | French fries | - | 1 (Germany, Denmark) 4–13 (Spain) 28 (South Africa) 42 (Poland) | - | - |
| Barrado et al. (2008)–Spain | [66] | French fries | 35.84 (over dry matter) | 2.5 | - | 31.4 |
| McCarthy et al. (2008)–Australia | [54] | French fries | 17.3 (11.7–21.4) | 2.1 (1.4–3.4) | 0.3 (0.3–0.4) | - |
| Wagner et al. (2008)–Austria | [20] | French fries | 1.72 ± 3.04 | 0.30 ± 0.55 (up to 1.6) | ||
| Fernández-San Juan (2009)–Spain | [43] | French fries | 20.4 | 20.9 ± 12.9 | 4.3 | 13.1 |
| Fritsche et al. (2010)–Germany | [67] | French fries | 22.5 | 0.2 (0.09–0.3) | 0.04 | |
| Tyburczy et al. (2012)–USA | [40] | French fries | 14.7 (12.14–17.50) | 6.6 (0.6–12.62) | 0.97 | 27.53 |
| Chung et al. (2013)–Hong Kong | [68] | Potato products (French fries, wedges, chips) | 26 (12–39) | 0.5 (0.13–1.46) | 0.13 (0.035–0.38) | 6.93 |
| Roe et al. (2013)–UK | [19] | Potato chips, takeaway (fish and chips shop) | 8.4 | 2.05 | 0.17 | - |
| Potato chips, fine cut, takeaway (fast food outlets) | 14.2 | 0.11 | 0.01 | - | ||
| Karim et al. (2014)–Pakistan | [17] | French fries | - | 0.11–24 | - | - |
| Yildirim et al. (2015)–Turkey | [69] | French fries | - | 1.24 (0–7.19) | - | 41.43 (24.41–49.33) |
In bold, values higher than 10 g trans fatty acids (TFA)/100 g fat are highlighted.
Table 2.
The fatty acid profile (g/100 g fat) for the ¾ fat margarines (brands 1, 2, and 3) and for the half-fat margarines (brands 4, 5, and 6) are analyzed (mean and standard deviation).
Table 2.
The fatty acid profile (g/100 g fat) for the ¾ fat margarines (brands 1, 2, and 3) and for the half-fat margarines (brands 4, 5, and 6) are analyzed (mean and standard deviation).
| Fatty Acid | Brand 1 | Brand 2 | Brand 3 | Brand 4 | Brand 5 | Brand 6 | ||||||
|---|---|---|---|---|---|---|---|---|---|---|---|---|
| Mean | SD | Mean | SD | Mean | SD | Mean | SD | Mean | SD | Mean | SD | |
| Caprylic 8:0 | 0.30 | 0.02 a | 0.47 | 0.0 c | 0.30 | 0.02 a | 0.31 | 0.03 a | 0.39 | 0.02 b | 0.32 | 0.02 a |
| Capric 10:0 | 0.30 | 0.03 a | 0.41 | 0.04 c | 0.29 | 0.02 a | 0.30 | 0.03 a | 0.37 | 0.02 b | 0.31 | 0.01 a |
| Lauric 12:0 | 2.76 | 0.06 c | 2.58 | 0.13 b | 2.70 | 0.09 b,c | 2.91 | 0.21 d | 2.73 | 0.03 c | 2.28 | 0.03 a |
| Myristic 14:0 | 1.28 | 0.06 d | 1.37 | 0.06 e | 1.13 | 0.06 b | 1.20 | 0.03 c | 1.16 | 0.01 b,c | 1.07 | 0.01 a |
| Palmitic 16:0 | 18.80 | 0.44 f | 18.52 | 0.13 e | 12.88 | 0.31 a | 15.71 | 0.10 c | 14.31 | 0.12 b | 18.04 | 0.23 d |
| t-Palmitoleic 9t-16:1 | 0.02 | 0.02 b | 0.01 | 0.01 a | 0.01 | 0.01 a | 0.00 | 0.00 a | 0.00 | 0.00 a | 0.00 | 0.00 a |
| Palmitoleic 9c-16:1 | 0.18 | 0.01 b | 0.12 | 0.01 a | 0.10 | 0.00 a | 0.25 | 0.05 c | 0.12 | 0.00 a | 0.28 | 0.01 d |
| Stearic 18:0 | 2.62 | 0.10 a | 3.63 | 0.16 c | 3.82 | 0.07 d | 3.71 | 0.05 c | 3.64 | 0.03 c | 3.38 | 0.04 b |
| Σ trans 18:1 | 0.37 | 0.06 e | 0.22 | 0.19 d | 0.10 | 0.01 b,c | 0.05 | 0.06 a | 0.06 | 0.01 a,b | 0.11 | 0.01 c |
| Oleic 9c-18:1 | 45.40 | 0.99 f | 29.60 | 0.79 c | 25.11 | 1.18 a | 35.28 | 0.81 d | 26.11 | 0.20 b | 39.84 | 0.86 e |
| 11c-18:1 | 2.26 | 0.18 c | 0.65 | 0.09 a | 0.70 | 0.11 a,b | 0.83 | 0.05 b | 0.60 | 0.04 a | 0.59 | 0.23 a |
| t-Linoleic 9t, 12t-18:2 | 0.00 | 0.01 a | 0.00 | 0.01 b | 0.01 | 0.01 b | 0.00 | 0.00 a | 0.02 | 0.00 b | 0.01 | 0.00 b |
| c-t Linoleic 9c, 12t-18:2 | 0.12 | 0.01 a | 0.26 | 0.00 e | 0.16 | 0.00 b | 0.13 | 0.00 a | 0.19 | 0.01 c | 0.23 | 0.01 d |
| t-c Linoleic 9t, 12c-18:2 | 0.12 | 0.01 a,b | 0.23 | 0.01 d | 0.13 | 0.01 b | 0.12 | 0.01 a | 0.18 | 0.01 c | 0.22 | 0.01 d |
| Linoleic 9c, 12c-18:2 | 17.30 | 1.74 a | 40.92 | 0.94 d | 46.11 | 1.12 d | 33.82 | 0.73 c | 40.69 | 0.11 d | 32.13 | 1.01 b |
| Arachidic 20:0 | 0.43 | 0.05 d | 0.17 | 0.06 b,c | 0.16 | 0.04 b | 0.21 | 0.03 c | 0.07 | 0.03 a | 0.20 | 0.02 b,c |
| γ-Linolenic 18:3n-6 | 0.38 | 0.07 c | 0.00 | 0.00 a | 0.17 | 0.04 b | 0.00 | 0.00 a | 0.20 | 0.06 b | 0.02 | 0.02 a |
| Eicosenoic 20:1 | 0.73 | 0.21 b | 0.13 | 0.01 a | 0.09 | 0.01 a | 0.12 | 0.02 a | 0.08 | 0.01 a | 0.15 | 0.02 a |
| α-Linolenic 18:3n-3 | 5.95 | 0.40 d | 0.19 | 0.06 a | 5.88 | 0.20 d | 4.76 | 0.14 c | 8.68 | 0.12 e | 0.59 | 0.09 b |
| Eicosadienoic 20:2 | ND | ND | ND | ND | ND | ND | ||||||
| Behenic 22:0 | 0.25 | 0.04 b | 0.44 | 0.23 c | 0.50 | 0.03 d | 0.41 | 0.10 c | 0.45 | 0.11 c | 0.02 | 0.0 a |
| Brassidic 13t-22:1 | ND | ND | ND | ND | ND | ND | ||||||
| Erucic 22:1 | ND | ND | ND | ND | ND | ND | ||||||
| Eicosatrienoic 20:3n-3 | ND | ND | ND | ND | ND | ND | ||||||
| Arachidonic 20:4n-6 | ND | ND | ND | ND | ND | ND | ||||||
| Eicosapentaenoic 20:5n-3 | ND | ND | ND | ND | ND | ND | ||||||
| Nervonic 24:1 | 0.09 | 0.01 b | 0.00 | 0.00 a | 0.00 | 0.00 a | 0.00 | 0.00 a | 0.00 | 0.00 a | 0.00 | 0.00 a |
| Docosatrienoic 22:3 | 0.07 | 0.00 b | 0.00 | 0.00 a | 0.00 | 0.00 a | 0.00 | 0.00 a | 0.00 | 0.00 a | 0.00 | 0.00 a |
| Docosapentaenoic 22:5n-6 | ND | ND | ND | ND | ND | ND | ||||||
| Lignoceric 24:0 | ND | ND | ND | ND | ND | ND | ||||||
| Docosapentaenoic 22:5n-3 | 0.00 | 0.00 a | 0.04 | 0.00 a,b | 0.00 | 0.00 a | 0.05 | 0.00 a | 0.06 | 0.00 a | 0.15 | 0.02 c |
| Docosahexaenoic 22:6n-3 | ND | ND | ND | ND | ND | ND | ||||||
| SFA | 26.73 | 0.64 e | 27.60 | 0.16 f | 21.79 | 0.47 a | 24.69 | 0.36 c | 23.06 | 0.11 b | 25.62 | 0.23 d |
| MUFA | 48.86 | 1.27 e | 30.52 | 0.86 b | 26.00 | 1.28 a | 36.38 | 0.82 c | 26.85 | 0.16 a | 40.90 | 1.05 d |
| PUFA | 23.77 | 1.42 a | 41.16 | 0.85 d | 52.17 | 1.32 f | 38.64 | 0.70 c | 49.63 | 0.14 e | 32.92 | 1.07 b |
| n-3 | 5.95 | 0.39 d | 0.23 | 0.11 a | 5.88 | 0.20 d | 4.82 | 0.18 c | 8.74 | 0.11 e | 0.76 | 0.10 b |
| n-6 | 17.69 | 1.67 a | 40.93 | 0.95 d | 46.28 | 1.13 e | 33.83 | 0.71 c | 40.90 | 0.12 d | 32.16 | 1.02 b |
| n-6/n-3 | 3.00 | 0.49 a | 226.96 | 119.21 b | 7.87 | 0.10 a | 7.04 | 0.31 a | 4.69 | 0.06 a | 42.71 | 4.52 a |
| PUFA + MUFA/SFA | 2.72 | 0.09 b | 2.60 | 0.02 a | 3.59 | 0.07 f | 3.04 | 0.08 d | 3.32 | 0.02 e | 2.88 | 0.03 c |
| TFA | 0.64 | 0.03 e | 0.72 | 0.02 f | 0.41 | 0.04 b | 0.29 | 0.04 a | 0.45 | 0.01 c | 0.57 | 0.02 d |
Different letters in the same row indicate significant differences (p < 0.05) among the mean values for the different brands. ND: Not detected; SFA: sum of all saturated fatty acids; MUFA: sum of all monounsaturated fatty acids; TFA: sum of all trans fatty acids.
Table 3.
Fatty acid profile (g/100 g product) and total fat content (g/100 g product) for the ¾ fat margarines (brands 1, 2, and 3) and for the half-fat margarines (brands 4, 5, and 6) analyzed (mean and standard deviation).
Table 3.
Fatty acid profile (g/100 g product) and total fat content (g/100 g product) for the ¾ fat margarines (brands 1, 2, and 3) and for the half-fat margarines (brands 4, 5, and 6) analyzed (mean and standard deviation).
| Fatty Acid | Brand 1 | Brand 2 | Brand 3 | Brand 4 | Brand 5 | Brand 6 | ||||||
|---|---|---|---|---|---|---|---|---|---|---|---|---|
| Mean | SD | Mean | SD | Mean | SD | Mean | SD | Mean | SD | Mean | SD | |
| Caprylic 8:0 | 0.18 | 0.01 b | 0.29 | 0.03 c | 0.18 | 0.01 b | 0.12 | 0.01 a | 0.16 | 0.01 b | 0.13 | 0.01 a |
| Capric 10:0 | 0.18 | 0.01 c | 0.25 | 0.02 d | 0.17 | 0.01 b | 0.12 | 0.01 a | 0.16 | 0.01 b | 0.12 | 0.00 a |
| Lauric 12:0 | 1.67 | 0.04 c | 1.56 | 0.08 c | 1.61 | 0.06 c | 1.18 | 0.09 b | 1.14 | 0.01 b | 0.90 | 0.03 a |
| Myristic 14:0 | 0.77 | 0.03 d | 0.83 | 0.04 e | 0.67 | 0.02 c | 0.49 | 0.02 b | 0.48 | 0.02 b | 0.42 | 0.01 a |
| Palmitic 16:0 | 11.39 | 0.37 e | 11.23 | 0.07 e | 7.69 | 0.22 d | 6.40 | 0.23 b | 8.98 | 0.05 a | 7.15 | 0.25 c |
| t-Palmitoleic 9t-16:1 | 0.01 | 0.01 b | 0.01 | 0.00 b | 0.01 | 0.00 b | 0.00 | 0.00 a | 0.00 | 0.00 a | 0.00 | 0.00 a |
| Palmitoleic 9c-16:1 | 0.11 | 0.02 d | 0.07 | 0.00 b | 0.05 | 0.01 a | 0.10 | 0.02 c | 0.05 | 0.00 a | 0.10 | 0.01 c |
| Stearic 18:0 | 1.58 | 0.05 b | 2.20 | 0.09 d | 2.28 | 0.05 c | 1.51 | 0.02 b | 1.52 | 0.01 b | 1.34 | 0.05 a |
| Σ trans 18:1 | 0.22 | 0.04 e | 0.13 | 0.01 d | 0.06 | 0.01 c | 0.02 | 0.02 a | 0.03 | 0.00 a,b | 0.04 | 0.00 b,c |
| Oleic 9c-18:1 | 27.52 | 0.96 e | 17.93 | 0.46 d | 14.99 | 0.81 b | 14.33 | 0.33 b | 10.92 | 0.08 a | 15.78 | 0.61 c |
| 11c-18:1 | 1.37 | 0.12 c | 0.39 | 0.05 b | 0.42 | 0.07 b | 0.34 | 0.02 b | 0.25 | 0.01 a | 0.23 | 0.09 a |
| t-Linoleic 9t, 12t-18:2 | 0.00 | 0.00 a | 0.00 | 0.00 a | 0.01 | 0.01 b | 0.00 | 0.00 a | 0.01 | 0.00 b | 0.01 | 0.00 a,b |
| c-t Linoleic 9c, 12t-18:2 | 0.07 | 0.00 c | 0.16 | 0.00 e | 0.09 | 0.00 d | 0.05 | 0.00 a | 0.08 | 0.00 b | 0.09 | 0.00 d |
| t-c Linoleic 9t, 12c-18:2 | 0.08 | 0.01 c | 0.14 | 0.00 d | 0.08 | 0.01 b | 0.05 | 0.01 a | 0.08 | 0.00 b | 0.09 | 0.00 c |
| Linoleic 9c, 12c-18:2 | 10.47 | 0.90 a | 24.80 | 0.60 e | 27.53 | 0.83 f | 13.78 | 0.29 c | 17.05 | 0.04 d | 12.70 | 0.42 b |
| Arachidic 20:0 | 0.26 | 0.30 c | 0.10 | 0.03 b | 0.10 | 0.03 b | 0.09 | 0.01 b | 0.03 | 0.01 a | 0.08 | 0.01 b |
| γ-Linolenic 18:3n-6 | 0.23 | 0.05 c | 0.00 | 0.00 a | 0.10 | 0.02 b | 0.00 | 0.00 a | 0.09 | 0.02 b | 0.01 | 0.01 a |
| Eicosenoic 20:1 | 0.48 | 0.04 d | 0.08 | 0.00 c | 0.05 | 0.01 b | 0.05 | 0.01 a,b | 0.03 | 0.00 a | 0.06 | 0.01 b,c |
| α-Linolenic 18:3n-3 | 3.61 | 0.29 c | 0.11 | 0.04 a | 3.51 | 0.15 c | 1.93 | 0.06 b | 3.63 | 0.05 c | 0.23 | 0.03 a |
| Eicosadienoic 20:2 | ND | ND | ND | ND | ND | ND | ||||||
| Behenic 22:0 | 0.15 | 0.02 b | 0.27 | 0.03 d | 0.30 | 0.02 e | 0.17 | 0.01 b,c | 0.19 | 0.00 c | 0.01 | 0.03 a |
| Brassidic 13t-22:1 | ND | ND | ND | ND | ND | ND | ||||||
| Erucic 22:1 | ND | ND | ND | ND | ND | ND | ||||||
| Eicosatrienoic 20:3n-3 | ND | ND | ND | ND | ND | ND | ||||||
| Arachidonic 20:4n-6 | ND | ND | ND | ND | ND | ND | ||||||
| Eicosapentaenoic 20:5n-3 | ND | ND | ND | ND | ND | ND | ||||||
| Nervonic 24:1 | 0.05 | 0.04 b | 0.00 | 0.00 a | 0.00 | 0.00 a | 0.00 | 0.00 a | 0.00 | 0.00 a | 0.00 | 0.00 a |
| Docosatrienoic 22:3 | 0.05 | 0.01 b | 0.00 | 0.00 a | 0.00 | 0.00 a | 0.00 | 0.00 a | 0.00 | 0.00 a | 0.00 | 0.00 a |
| Docosapentaenoic 22:5n-6 | ND | ND | ND | ND | ND | ND | ||||||
| Lignoceric 24:0 | ND | ND | ND | ND | ND | ND | ||||||
| Docosapentaenoic 22:5n-3 | 0.00 | 0.00 a | 0.02 | 0.00 b | 0.00 | 0.00 a | 0.02 | 0.00 b | 0.02 | 0.00 b | 0.06 | 0.00 c |
| Docosahexaenoic 22:6n-3 | ND | ND | ND | ND | ND | ND | ||||||
| SFA | 16.19 | 0.48 d | 16.72 | 0.10 e | 13.01 | 0.33 c | 10.05 | 0.15 b | 9.66 | 0.06 a | 10.15 | 0.33 b |
| MUFA | 29.65 | 1.14 e | 18.49 | 0.52 d | 15.53 | 0.87 b,c | 14.83 | 0.34 b | 11.25 | 0.08 a | 16.18 | 0.65 c |
| PUFA | 14.34 | 0.64 b | 24.95 | 0.54 e | 31.15 | 0.98 f | 15.73 | 0.29 c | 20.79 | 0.06 d | 13.01 | 0.42 a |
| n-3 | 3.64 | 0.24 d | 0.14 | 0.07 a | 3.51 | 0.15 d | 1.96 | 0.07 b,c | 3.66 | 0.05 d | 0.30 | 0.04 b |
| n-6 | 10.70 | 0.86 a | 24.80 | 0.60 e | 27.64 | 0.84 f | 13.78 | 0.27 c | 17.14 | 0.04 d | 12.71 | 0.42 b |
| TFA | 0.39 | 0.02 e | 0.44 | 0.01 f | 0.25 | 0.03 d | 0.12 | 0.02 a | 0.19 | 0.01 b | 0.22 | 0.01 c |
| Total fat content | 61.50 | 5.15 b | 60.60 | 1.37 b | 59.71 | 1.44 b | 40.74 | 1.69 a | 41.82 | 0.8 a | 40.29 | 3.29 a |
Different letters in the same row indicate significant differences (p < 0.05) among the mean values for the different brands. ND: Not detected; SFA: sum of all saturated fatty acids; MUFA: sum of all monounsaturated fatty acids; TFA: sum of all trans fatty acids.
Table 4.
Fatty acid profile of French fries (g/100 g fat) for the five fast food outlets analyzed (mean and standard deviation).
Table 4.
Fatty acid profile of French fries (g/100 g fat) for the five fast food outlets analyzed (mean and standard deviation).
| Fatty Acid | Brand 1 | Brand 2 | Brand 3 | Brand 4 | Brand 5 | |||||
|---|---|---|---|---|---|---|---|---|---|---|
| Mean | SD | Mean | SD | Mean | SD | Mean | SD | Mean | SD | |
| Caprylic 8:0 | 0.14 | 0.01 a | 0.16 | 0.02 a | 0.14 | 0.02 a | 0.23 | 0.11 b | 0.12 | 0.00 a |
| Capric 10:0 | 0.65 | 0.52 a | 0.10 | 0.02 a,b | 0.09 | 0.01 a | 0.14 | 0.07 b | 0.09 | 0.00 a,b |
| Lauric 12:0 | 0.04 | 0.01 a,b | 0.09 | 0.01 c | 0.07 | 0.01 c | 0.05 | 0.02 b | 0.02 | 0.00 a |
| Myristic 14:0 | 0.07 | 0.01 a | 0.31 | 0.04 c | 0.28 | 0.06 c | 0.19 | 0.05 b | 0.07 | 0.00 a |
| Palmitic 16:0 | 5.08 | 0.35 a | 15.48 | 1.73 d | 13.44 | 2.37 c | 10.81 | 0.10 b | 5.27 | 0.22 a |
| t-Palmitoleic 9t-16:1 | ND | ND | ND | ND | ND | |||||
| Palmitoleic 9c-16:1 | 0.11 | 0.00 a | 0.14 | 0.01 b | 0.14 | 0.01 b | 0.13 | 0.02 b | 0.14 | 0.02 b |
| Stearic 18:0 | 3.48 | 0.09 b | 4.01 | 0.01 c | 3.92 | 0.04 c | 4.31 | 0.06 d | 3.21 | 0.23 a |
| Σ trans 18:1 | 0.21 | 0.05 a,b | 0.30 | 0.05 b | 0.25 | 0.02 a,b | 0.28 | 0.20 a,b | 0.19 | 0.02 a |
| Oleic 9c-18:1 | 63.45 | 3.24 a | 63.59 | 0.74 a,b | 66.18 | 2.12 b | 30.08 | 3.04 c | 63.30 | 0.84 a |
| 11c-18:1 | 0.83 | 0.02 a | 0.81 | 0.02 a | 0.83 | 0.02 a | 0.78 | 0.06 a | 0.92 | 0.07 b |
| t-Linoleic 9t, 12t-18:2 | 0.01 | 0.01 a | 0.01 | 0.00 a | 0.01 | 0.00 a | 0.04 | 0.01 b | 0.01 | 0.00 a |
| c-t Linoleic 9c, 12t-18:2 | 0.14 | 0.01 b,c | 0.12 | 0.01 a,b | 0.11 | 0.00 a | 0.30 | 0.03 d | 0.16 | 0.02 c |
| t-c Linoleic 9t, 12c-18:2 | 0.14 | 0.00 b | 0.13 | 0.01 a,b | 0.11 | 0.00 a | 0.27 | 0.04 c | 0.15 | 0.02 b |
| Linoleic 9c,12c-18:2 | 24.79 | 2.52 b | 13.12 | 1.43 a | 12.70 | 0.51 a | 51.03 | 5.35 c | 24.66 | 0.83 b |
| Arachidic 20:0 | 0.19 | 0.03 a | 0.27 | 0.03 b | 0.28 | 0.01 b | 0.15 | 0.11 a | 0.18 | 0.02 a |
| γ-Linolenic 18:3n-6 | ND | ND | ND | ND | ND | |||||
| Eicosenoic 20:1 | 0.18 | 0.01 c | 0.16 | 0.01 b | 0.18 | 0.01 c | 0.12 | 0.01 a | 0.18 | 0.01 c |
| α-Linolenic 18:3n-3 | 0.19 | 0.01 a | 0.27 | 0.00 d | 0.24 | 0.03 b,c | 0.25 | 0.03 c,d | 0.22 | 0.00 b |
| Eicosadienoic 20:2 | ND | ND | ND | ND | ND | |||||
| Behenic 22:0 | 0.55 | 0.41 a | 0.64 | 0.06 a,b | 0.72 | 0.07 a,b | 0.61 | 0.11 a,b | 0.77 | 0.04 c |
| Brassidic 13t-22:1 | ND | ND | ND | ND | ND | |||||
| Erucic 22:1 | ND | ND | ND | ND | ND | |||||
| Eicosatrienoic 20:3n-3 | ND | ND | ND | ND | ND | |||||
| Arachidonic 20:4n-6 | ND | ND | ND | ND | ND | |||||
| Eicosapentaenoic 20:5n-3 | 0.30 | 0.03 c,d | 0.25 | 0.02 b | 0.27 | 0.02 b,c | 0.21 | 0.05 a | 0.33 | 0.01 d |
| Nervonic 24:1 | ND | ND | ND | ND | ND | |||||
| Docosatrienoic 22:3 | ND | ND | ND | ND | ND | |||||
| Docosapentaenoic 22:5n-6 | ND | ND | ND | ND | ND | |||||
| Lignoceric 24:0 | ND | ND | ND | ND | ND | |||||
| Docosapentaenoic 22:5n-3 | ND | ND | ND | ND | ND | |||||
| Docosahexaenoic 22:6n-3 | ND | ND | ND | ND | ND | |||||
| SFA | 9.62 | 0.78 a | 21.08 | 1.74 d | 18.96 | 2.43 c | 16.50 | 2.04 b | 9.74 | 0.06 a |
| MUFA | 64.58 | 3.27 b | 64.70 | 0.73 b,c | 67.33 | 2.11 c | 31.12 | 3.10 a | 64.54 | 0.85 b |
| PUFA | 25.29 | 2.54 b | 13.65 | 1.43 a | 13.21 | 0.50 a | 51.48 | 5.32 c | 25.20 | 0.83 b |
| n-3 | 0.49 | 0.04 a,b | 0.52 | 0.02 b,c | 0.51 | 0.02 b,c | 0.45 | 0.06 a | 0.55 | 0.02 c |
| n-6 | 24.79 | 2.52 b | 13.12 | 1.42 a | 12.71 | 0.51 a | 51.03 | 5.35 c | 24.65 | 0.83 b |
| n-6/n-3 | 50.63 | 4.93 b | 25.04 | 2.29 a | 25.07 | 1.81 a | 114.96 | 28.64 c | 45.00 | 2.43 b |
| PUFA + MUFA/SFA | 9.40 | 0.85 c | 3.75 | 0.39 a | 4.33 | 0.69 a | 5.10 | 0.83 b | 9.21 | 0.06 c |
| TFA | 0.51 | 0.06 a | 0.58 | 0.06 a | 0.49 | 0.02 a | 0.89 | 0.28 b | 0.51 | 0.05 a |
Different letters in the same row indicate significant differences (p < 0.05) among the mean values for the different brands; ND: Not detected; SFA: sum of all saturated fatty acids; MUFA: sum of all monounsaturated fatty acids; TFA: sum of all trans fatty acids.
Table 5.
Fatty acid profile (g/100 g product) and total fat content (g/100 g product) of French fries for the five brands analyzed (mean and standard deviation).
Table 5.
Fatty acid profile (g/100 g product) and total fat content (g/100 g product) of French fries for the five brands analyzed (mean and standard deviation).
| Fatty Acid | Brand 1 | Brand 2 | Brand 3 | Brand 4 | Brand 5 | |||||
|---|---|---|---|---|---|---|---|---|---|---|
| Mean | SD | Mean | SD | Mean | SD | Mean | SD | Mean | SD | |
| Caprylic 8:0 | 0.02 | 0.00 b | 0.01 | 0.00 a,b | 0.01 | 0.00 a | 0.03 | 0.01 c | 0.01 | 0.00 a |
| Capric 10:0 | 0.01 | 0.01 a | 0.01 | 0.00 a | 0.01 | 0.00 a | 0.02 | 0.01 b | 0.01 | 0.00 a |
| Lauric 12:0 | 0.00 | 0.00 a | 0.01 | 0.00 b | 0.01 | 0.00 b | 0.01 | 0.00 b | 0.00 | 0.00 a |
| Myristic 14:0 | 0.01 | 0.00 a | 0.03 | 0.00 c | 0.02 | 0.00 b | 0.02 | 0.01 b | 0.01 | 0.00 a |
| Palmitic 16:0 | 0.74 | 0.43 d | 1.45 | 0.23 b | 1.10 | 0.12 a | 1.32 | 0.20 b | 0.55 | 0.01 c |
| t-Palmitoleic 9t-16:1 | ND | ND | ND | ND | ND | |||||
| Palmitoleic 9c-16:1 | 0.02 | 0.00 c | 0.01 | 0.00 a,b | 0.01 | 0.00 a | 0.02 | 0.00 c | 0.01 | 0.00 b |
| Stearic 18:0 | 0.51 | 0.00 c | 0.37 | 0.02 b | 0.33 | 0.03 a | 0.53 | 0.03 c | 0.34 | 0.04 a |
| Σ trans 18:1 | 0.03 | 0.01 a,b | 0.03 | 0.00 a,b | 0.02 | 0.00 a,b | 0.03 | 0.02 b | 0.02 | 0.00 a |
| Oleic 9c-18:1 | 9.25 | 0.58 c | 5.91 | 0.27 b,c | 5.52 | 0.78 b | 3.68 | 0.25 a | 6.59 | 0.32 c |
| 11c-18:1 | 0.12 | 0.00 d | 0.07 | 0.00 b | 0.07 | 0.01 a | 0.09 | 0.00 c | 0.09 | 0.00 c |
| t-Linoleic 9t, 12t-18:2 | ND | ND | ND | ND | ND | |||||
| c-t Linoleic 9c, 12t-18:2 | 0.02 | 0.00 b | 0.01 | 0.00 a | 0.01 | 0.01 a | 0.04 | 0.00 c | 0.02 | 0.00 b |
| t-c Linoleic 9t, 12c-18:2 | 0.02 | 0.00 d | 0.01 | 0.00 b | 0.01 | 0.00 a | 0.03 | 0.00 e | 0.02 | 0.00 c |
| Linoleic 9c,12c-18:2 | 3.61 | 0.32 c | 1.21 | 0.08 a | 1.06 | 0.16 a | 6.28 | 0.89 d | 2.57 | 0.17 b |
| Arachidic 20:0 | 0.03 | 0.00 a,b | 0.02 | 0.00 a,b | 0.02 | 0.00 a,b | 0.02 | 0.01 a | 0.02 | 0.00 a |
| γ-Linolenic 18:3n-6 | ND | ND | ND | ND | ND | |||||
| Eicosenoic 20:1 | 0.03 | 0.00 c | 0.01 | 0.00 a | 0.01 | 0.00 a | 0.01 | 0.00 a | 0.02 | 0.00 b |
| α-linolenic 18:3n-3 | 0.03 | 0.00 c | 0.02 | 0.00 b | 0.02 | 0.00 a | 0.03 | 0.00 d | 0.02 | 0.00 b |
| Eicosadienoic 20:2 | ND | ND | ND | ND | ND | |||||
| Behenic 22:0 | 0.08 | 0.06 a | 0.06 | 0.00 a | 0.06 | 0.01 a | 0.07 | 0.01 a | 0.08 | 0.01 a |
| Brassidic 13t-22:1 | ND | ND | ND | ND | ND | |||||
| Erucic 22:1 | ND | ND | ND | ND | ND | |||||
| Eicosatrienoic 20:3n-3 | ND | ND | ND | ND | ND | |||||
| Arachidonic 20:4n-6 | ND | ND | ND | ND | ND | |||||
| Eicosapentaenoic 20:5n-3 | 0.04 | 0.00 c | 0.02 | 0.00 a | 0.02 | 0.00 a | 0.02 | 0.00 a | 0.03 | 0.00 b |
| Nervonic 24:1 | ND | ND | ND | ND | ND | |||||
| Docosatrienoic 22:3 | ND | ND | ND | ND | ND | |||||
| Docosapentaenoic 22:5n-6 | ND | ND | ND | ND | ND | |||||
| Lignoceric 24:0 | ND | ND | ND | ND | ND | |||||
| Docosapentaenoic 22:5n-3 | ND | ND | ND | ND | ND | |||||
| Docosahexaenoic 22:6n-3 | ND | ND | ND | ND | ND | |||||
| SFA | 1.40 | 0.11 b | 1.96 | 0.26 c,d | 1.56 | 0.11 b,c | 2.01 | 0.19 d | 1.01 | 0.06 a |
| MUFA | 9.42 | 0.59 d | 6.01 | 0.28 b | 5.61 | 0.78 b | 3.80 | 0.26 a | 6.72 | 0.31 c |
| PUFA | 3.68 | 0.32 c | 1.26 | 0.07 a | 1.10 | 0.17 a | 6.33 | 0.89 d | 2.63 | 0.17 b |
| n-3 | 0.07 | 0.00 d | 0.05 | 0.00 b | 0.04 | 0.00 a | 0.06 | 0.01 c | 0.06 | 0.00 c |
| n-6 | 3.61 | 0.32 c | 1.21 | 0.07 a | 1.06 | 0.16 a | 6.28 | 0.89 d | 2.57 | 0.17 b |
| TFA | 0.07 | 0.01 b | 0.05 | 0.00 a | 0.04 | 0.00 a | 0.11 | 0.03 c | 0.05 | 0.00 a |
| Total fat content | 14.58 | 0.28 e | 9.29 | 0.50 b | 8.32 | 1.04 a | 12.26 | 1.05 d | 10.42 | 0.70 c |
Different letters in the same row indicate significant differences (p < 0.05) among the mean values for the different brands; ND: Not detected; SFA: sum of all saturated fatty acids; MUFA: sum of all monounsaturated fatty acids; TFA: sum of all trans fatty acids.
© 2017 by the authors. Licensee MDPI, Basel, Switzerland. This article is an open access article distributed under the terms and conditions of the Creative Commons Attribution (CC BY) license (http://creativecommons.org/licenses/by/4.0/).
Share and Cite
MDPI and ACS Style
Astiasarán, I.; Abella, E.; Gatta, G.; Ansorena, D. Margarines and Fast-Food French Fries: Low Content of trans Fatty Acids. Nutrients 2017, 9, 662. https://doi.org/10.3390/nu9070662
AMA Style
Astiasarán I, Abella E, Gatta G, Ansorena D. Margarines and Fast-Food French Fries: Low Content of trans Fatty Acids. Nutrients. 2017; 9(7):662. https://doi.org/10.3390/nu9070662
Chicago/Turabian StyleAstiasarán, Iciar, Elena Abella, Giulia Gatta, and Diana Ansorena. 2017. "Margarines and Fast-Food French Fries: Low Content of trans Fatty Acids" Nutrients 9, no. 7: 662. https://doi.org/10.3390/nu9070662
Note that from the first issue of 2016, this journal uses article numbers instead of page numbers. See further details here.