Long-Term Dexamethasone Exposure Down-Regulates Hepatic TFR1 and Reduces Liver Iron Concentration in Rats

Key Laboratory of Animal Physiology and Biochemistry, College of Veterinary Medicine, Nanjing Agricultural University, Nanjing 210095, China
*
Author to whom correspondence should be addressed.
Nutrients 2017, 9(6), 617; https://doi.org/10.3390/nu9060617
Submission received: 12 April 2017
/
Revised: 7 June 2017
/
Accepted: 8 June 2017
/
Published: 17 June 2017
Abstract
:Exposure to stress is known to cause hepatic iron dysregulation, but the relationship between prolonged stress and liver iron metabolism is not yet fully understood. Thirty 13-week-old female Sprague–Dawley rats were randomly divided into two groups, as follows: the control group (saline-injection) and the dexamethasone group (Dexamethasone (Dex)-injection 0.1 mg/kg/day). After the 21-day stress trial, the results showed that chronic Dex administration not only impaired serum corticosterone (p = 0.00) and interleukin-6 (IL-6) (p = 0.01) levels, but also decreased white blood cell counts (p = 0.00), and reduced blood lymphocyte counts (p = 0.00). The daily Dex-injection also significantly reduced body weight (p < 0.01) by inhibiting food intake. Consecutive Dex administration resulted in decreased iron intake (p = 0.00), enhanced serum iron levels (p = 0.01), and increased the serum souble transferrin receptor (sTfR) content (p = 0.00) in rats. Meanwhile, long-term Dex exposure down-regulated duodenal cytochrome b (DCYTB) (p = 0.00) and the divalent metal transporter 1 (DMT1) (p = 0.04) protein expression, but up-regulated ferroportin (FPN) protein expression (p = 0.04). Chronic Dex administration reduced liver iron concentration (p = 0.02) in rats. Hepatic transferrin receptor 1 (TFR1) expression was lowered at the protein level (p = 0.03), yet with uncoupled mRNA abundance in Dex-treated rats. Enhanced iron-regulatory protein (IRP)/iron-responsive element (IRE) binding activity was observed, but did not line up with lowered hepatic TFR1 protein expression. This study indicates that long-term Dex exposure reduces liver iron content, which is closely associated with down-regulated hepatic TFR1 protein expression.
1. Introduction
Iron is an essential element in such vital functions as oxygen delivery, energy production, protein synthesis, DNA replication and cellular respiration. It has been proven that the alteration of iron homeostasis underlies a variety of pathological conditions in mammals [1]. Iron deficiency results in reduced oxygen transport, diminished activity of iron-dependent enzymes, poor growth development and cognitive skills [2,3]. Chronic iron overload could cause oxidative stress and increase the risk of liver cirrhosis, cancer, and neurodegenerative diseases [4]. Therefore, maintenance of systemic and cellular iron homeostasis is vital for normal physiological functions in mammals.
Iron homeostasis is maintained by two regulatory systems: hepcidin/ferroportin, and iron-regulatory protein (IRP)/iron-responsive element (IRE), to ensure appropriate supplies [5]. Systemic iron homeostasis is controlled by hepcidin, which acts as a negative regulator of iron release by degradation of the iron exporter ferroportin, from enterocytes, hepatocytes or macrophages [6,7,8]. Cellular iron homeostasis is primarily regulated by IRP1 and IRP2 in mammals. IRP1/2 binds to IREs in the 3′ or 5′ UTR of mRNAs encoding for important proteins of iron uptake (transferrin receptor 1 (Tfr1) and divalent metal transporter 1 (Dmt1), storage (ferritin) and export (ferroportin) to regulate cellular iron metabolism [9,10]. Balanced iron uptake, utilization, storage and export are strictly regulated at both systemic and cellular levels to keep iron homeostasis.
Exposure to uncontrollable and unpredictable stressors is a common daily occurrence in the lifestyle of modern society [11]. It is reported that dysregulation of iron metabolism and storage, could be caused by stress [12,13,14,15,16]. Recent advances in stress research have revealed that psychological stress decreases blood iron levels [12,13,14], and induces hepatic iron accumulation in vivo and in vitro [14,15,16]. However, the impact of stress is highly controlled by the types (psychological vs. physiological vs. physical), intensity, and duration of the stressors [17,18]. It is noted that chronic mild stress elevates interleukin-6 (IL-6) to stimulate hepcidin expression in rats [6,19]. Therefore, glucocorticoid exposure-induced immunosuppression associated with decreased IL-6, could play a role in iron metabolism, via inhibition of hepcidin synthesis [20]. To our knowledge, little is known about the effect of prolonged stress induced immunosuppression on iron metabolism.
The physiological stress responses to stressful stimuli induces the activation of the hypothalamic-pituitary-adrenal axis and releases the glucocorticoids (cortisol in humans; corticosterone in rodents) from the adrenal cortex [21,22]. Dexamethasone, a synthetic glucocorticoid with high-affinity, has been applied to induce stress response and immunosuppression [23,24,25]. Therefore, the aim of the present study is to examine the effect of prolonged stress (21-day dexamethasone (Dex) administration) on iron metabolism and explore the possible mechanism in rats.
2. Materials and Methods
2.1. Animals and Experimental Design
Thirty 13-week-old female Sprague–Dawley rats weighing 320–340 g were randomly divided into two groups of fifteen rats each, as follows: the control group (saline-injection, Con) and the dexamethasone group (Dex-injection, Dex). A once-daily injection of Dex (water-soluble dexamethasone; D4902, Sigma, San Francisco, CA, USA) was administered for 21 days at the dose of 0.1 mg/kg/day via intraperitoneal injection. The dexamethasone dose was selected according to the previous study of Jahng et al. (2008) [23]. Rats were housed individually in standard cages, in a room with controlled temperature (22 ± 2 °C) and humidity (55% ± 15%), on 12-h light/dark cycles. A standard AIN-93G diet and deionized water were provided ad libitum to each cage. All rats were obtained and raised in the Laboratory Animal Research Center of Jiangsu University, Zhenjiang, China. The experiment was carried out following the guidelines of the Animal Ethics Committee of Nanjing Agricultural University.
2.2. Data and Sample Collection
Both body weight and feed consumption were monitored at 2-day intervals for 21 days. All rats were deeply anesthetized by intraperitoneal injection of 7% chloral hydrate and killed humanely at the end of experiment. Blood samples were collected from the aorta abdominalis using EDTA-2K coated tubes for hematological tests. Serum samples were obtained from blood by centrifuging at 3000 g for 10 min, and stored at −80 °C for further use. The fresh tissues (duodenum and liver, spleen, kidney, dorsal muscles) were immediately removed and snap frozen in liquid nitrogen, and kept in a −80 °C freezer until analysis.
2.3. Histological Analysis of Liver
Briefly, liver specimens were first fixed in a 4% formaldehyde-buffered solution for 24 h and processed with paraffin. The blocks were subsequently sectioned at 5 µm on the longitudinal plane and stained using the Mallory method of Prussian blue staining [26].
2.4. Haematological Parameters and Serum Concentration of Corticosterone, IL-6 and Iron Parameters
Hemocytes were detected by Automated Hematology Analyzer (BC-2800, Mindray, Shenzhen, China). Serum corticosterone was assayed by a Corticosterone ELISA kit (12021511C, Enzo Life Sciences, New York, NY, USA). The IL-6 level in the serum was tested using the enzyme immunoassay (340354, R&D Systems, Minnesota, MN, USA). Ferritin (SEA518Ra, Cloud-clone Corp, Houston, TX, USA) and souble transferrin receptor (sTfR; F15186-A, Feiya Biological Technology Company, Nanjing, China) were quantified using the ELISA kits, respectively. Serum iron (6063-2012, Shino-Test Corporation, Tokyo, Japan), unsaturated iron-binding capacity (UIBC) (6062-2012, Shino-Test Corporation, Tokyo, Japan), and transferrin (0333-2012, LEADMAN, Beijing, China) were measured by an automatic analyzer (7020, Hitachi High-Tech Crop., Tokyo, Japan) with commercial kits. All kits were used following the manufacturers’ instructions. Total iron binding capacity (TIBC) is equivalent to the sum of UIBC and blood iron. Transferrin saturation (TS) is calculated by dividing serum iron by TIBC value.
2.5. Iron Measurement in Tissues
Digestion of samples was conducted using the electric heating method, according to previous study [27]. Exactly 0.5 g of liver, duodenum, spleen, kidney and dorsal muscles were weighed and digested with 10 mL HNO3:HClO4 (8:2 mL) acid mixture in a 50 mL glass flask. The digestion conditions in the microwave digestion system (EHD36 electrothermal hotblock digester, Labtech, Boston, MA, USA) followed the sequence of 30 min at 90 °C; 30 min at 120 °C; 120 min at 160 °C; and 180 °C, until about 2 mL residue was left; then cooled for 10 min. The resulting solutions were diluted to a final volume of 50 mL. Iron concentrations in the liver were determined by the Graphite Atomic Absorption Spectrometer (Z-2000, Hitachi High-Tech, Tokyo, Japan).
2.6. RNA Isolation and Quantitative Real-Time PCR
Total RNA was isolated from duodenum (60 mg) and liver samples (40 mg) with 1 mL TRIzol reagent (15596026, Invitrogen, Carlsbad, CA, USA), according to the manufacturer’s instructions. A total of 2 µg of RNA was treated with RNase-free DNase and reverse-transcribed to cDNA by PrimeScript® 1st Strand cDNA Synthesis Kit (D6110A, TaKaRa, Dalian, China). A total of 2 µL of diluted cDNA (1:25, vol/vol) was used as a template in PCR reactions on a real-time PCR system (Mx3000P, Stratagene, La Jolla, CA, USA). All the primers for real-time PCR were synthesized by Generay Biotech., China and listed in Table 1. The 2−ΔΔCt method was used to analyze real-time PCR data [28]. Acidic ribosomal phosphoprotein P0 (Arbp) was used as an internal control for normalizing.
2.7. Total Protein Extractions and Western Blotting Analysis
Briefly, the total protein was extracted from 60 mg of frozen duodenum and liver samples by RIPA buffer containing the protease inhibitor (04906837001, Roche Diagnostics, Mannheim, Germany). Protein concentration was measured with a Pierce BCA Protein Assay kit (23225, Thermo Scientific, Waltham, MA, USA). Liver hepcidin was assayed by a hepcidin ELISA kit (H252, Jiancheng Bioengineering Institute, Nanjing, China). Western blot was carried out according to the manufacturer’s instruction (Bio-Rad, Hercules, CA, USA). The following primary antibodies were used: DCYTB (SAB2700288, Sigma, Kawasaki-shi, Japan, 1:1000), DMT1 (ab55733, Abcam, Cambridge, UK, 1:500), FTH (BS6175, Bioworld, Visalia, CA, USA, 1:1000), FTL (ab69090, Abcam, Cambridge, UK, 1:1000), FPN (sc-49668, Santa Cruz, Dallas, TX, USA, 1:1000), STAT5 (BS2427, 1:1000, Bioworld, Visalia, CA, USA), TF (HPA001527, Sigma, Kawasaki-shi, Japan, 1:1000), TFR1 (10084-2-AP, Proteintech, Manchester, UK, 1:1000), TFR2 (SAB270078, Sigma, Kawasaki-shi, Japan, 1:1000), ZIP14 (ab123988, Abcam, Cambridge, UK, 1:500), IRP1(BS1761, Bioworld, Visalia, CA, USA, 1:1000), IRP2 (ab181153, Abcam, Cambridge, UK, 1:1000). The β-actin (AP0060, Bioworld, Visalia, CA, USA, 1:10,000) and tubulin-a (BS1966, Bioworld, Visalia, CA, USA, 1:10,000) were used as loading control. The area and density of protein bands were captured and imaged by VersaDoc 4000MP system (Bio-Rad, Hercules, CA, USA) and analyzed by Quantity One software (Bio-Rad, Hercules, CA, USA).
2.8. RNA Electrophoretic Mobility Shift Assay (REMSA)
The total protein was extracted from 40 mg liver samples by RIPA buffer containing the protease inhibitor. For the Electrophoretic Mobility Shift Assay (EMSA), 20 µL reactions contain: Nuclease-Free Water, 10 × REMSA Binding Buffer, 500 mM DTT, 50% glycerol, tRNA (20158, Thermo Scientific, Waltham, MA, USA), liver protein extracts, biotinylated Tfr1 probe and unlabeled Tfr1 probe. Biotinylated Tfr1 probe 5′-UAUUUAUCAGUGACAGAGUUCACUAUAAAUA-3′-Biotn and unlabeled Tfr1 probe 5′-UAUUUAUCAGUGACAGAGUUCACUAUAAAUA-3′ were synthesized by Genpharma Biotech., China. Biotinylated RNAs were always added last and the reactions were incubated for 20 min at room temperature. Afterward, the samples were carefully mixed with 5 μL of 5 × REMSA Loading Buffer, pre-electrophorese of the 4% polyacrylamide gel, for 60 min in 100 V at 4 °C, then 20 μL mixed reactions were loaded on a gel for 60 min, positively charged nylon membranes were conducted by tank blotting in 0.5 × TBE at 35 V for 40 min at 4 °C, and crosslinked at 120 mJ/cm2 at 254 nm for 4 min. The Chemiluminescent Nucleic Acid Detection Module (20158, Thermo Scientific, Waltham, MA, USA) was used for detecting RNA-binding activity according to the manufacturer’s instruction.
2.9. Statistical Analysis
All data are presented as means ± SEM. The data were tested for normal distribution, and statistical significance was performed using One-way ANOVA in SPSS 20.0 for windows. A value p < 0.05 was considered statistically significant.
3. Results
3.1. Serum Corticosterone, IL-6 and Blood Parameters
3.2. Body Weight, Food Intake and Iron Intake
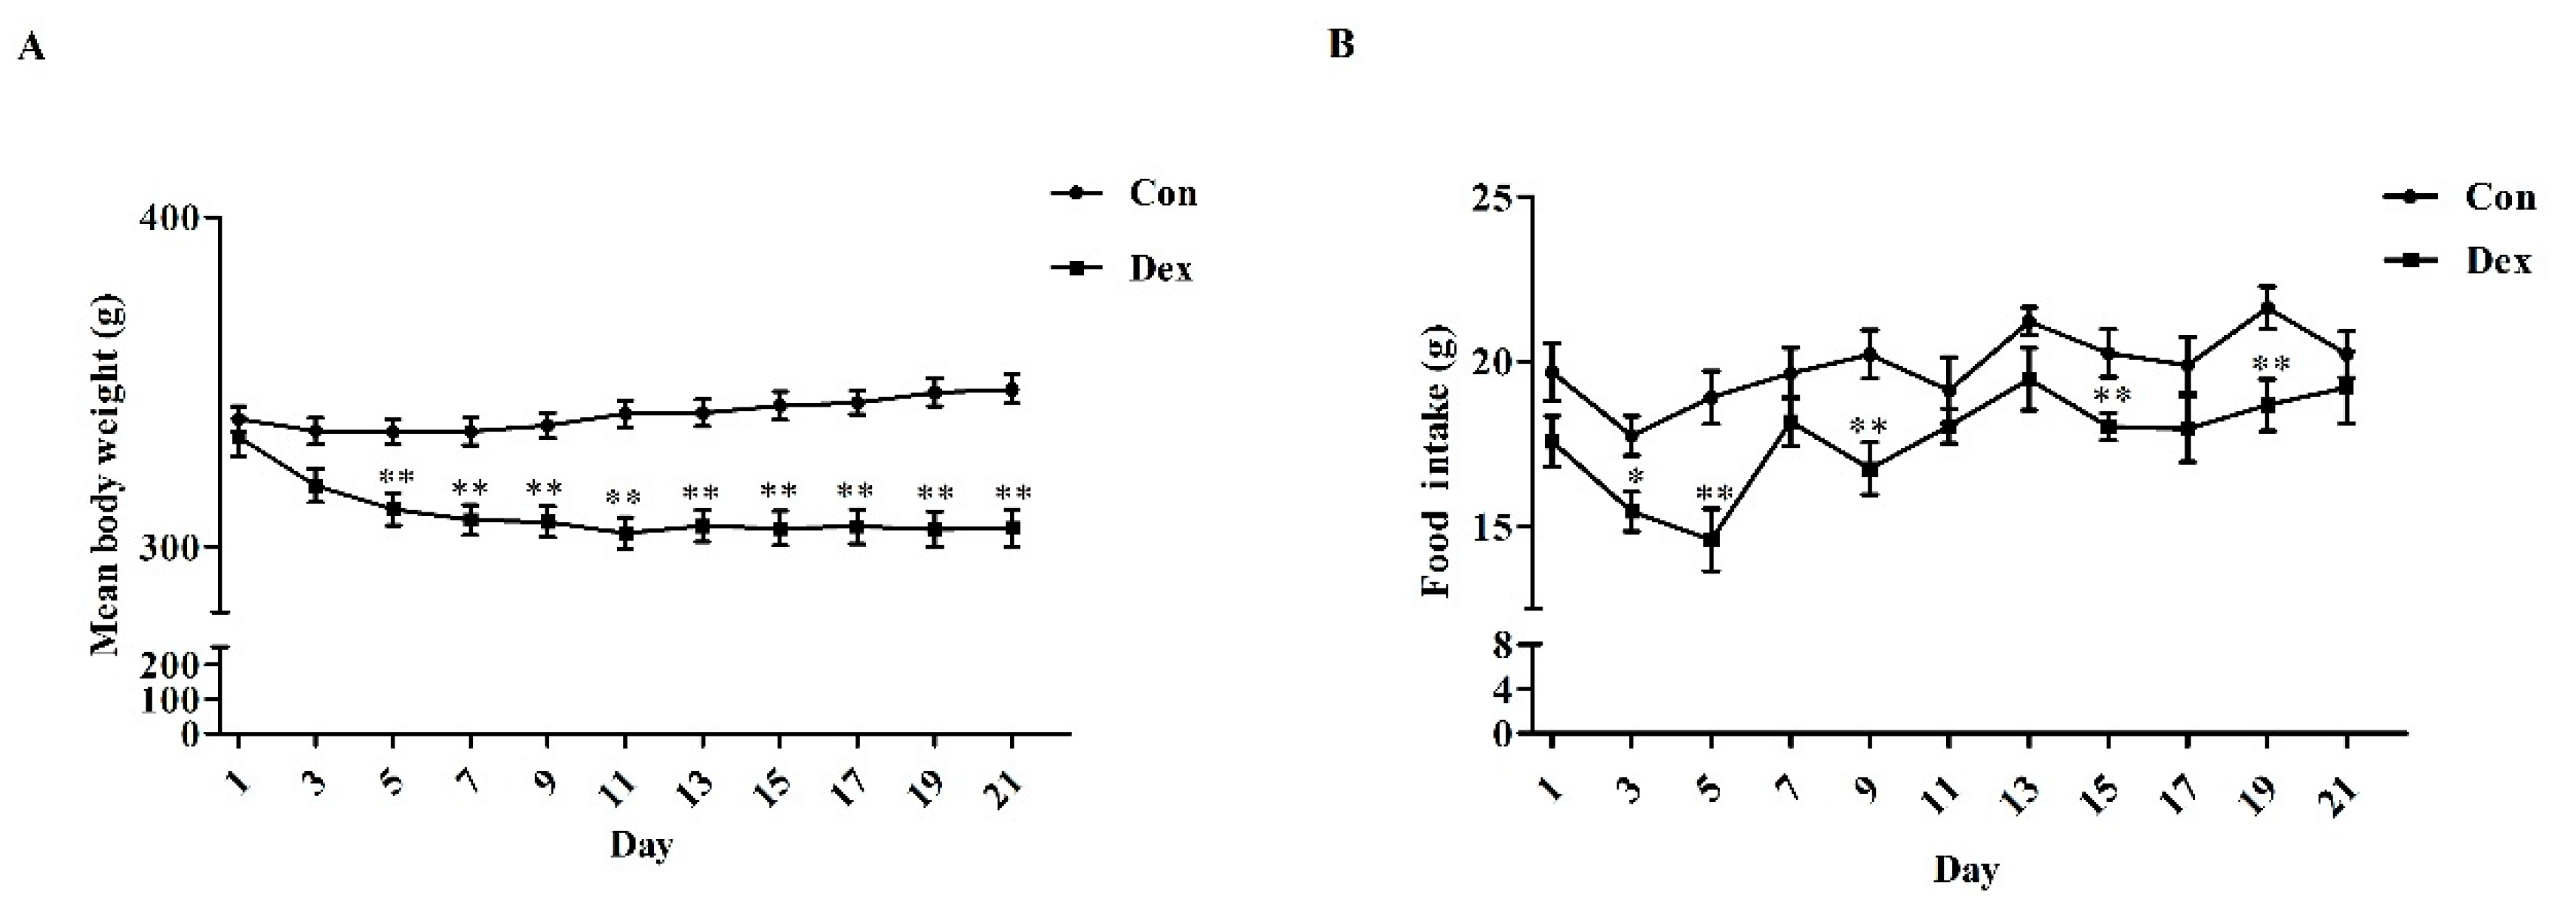
Daily Dex-injections significantly reduced body weight (Figure 2A), average food intake (p = 0.00, Figure 2C) and average iron intake (p = 0.00, Figure 2D). For body weight, the remarkable inhibition was noted from the fifth day to the end of the experiment. In addition, the analysis of food intake revealed a reduction over 21 days as opposed to the control group (Figure 2B, p = 0.01 on day 3; p < 0.01 on days 5, 9, 15, 19).
3.3. Serum Iron Parameters
Table 2 lists the effects of Dex administration on serum iron parameters in rats. Compared with the control group, the Dex-injection greatly elevated serum iron levels (p = 0.01) and serum soluble transferrin receptor (sTfR, p = 0.03), while having no obvious effect on TIBC, UIBC, transferrin, transferrin saturation and ferritin.
3.4. Duodenal Expression of Iron Metabolism-Related Genes
Figure 3 provides the effects of Dex administration on duodenal expression of iron metabolism-related genes in rats. No significant difference was found in duodenum iron content between the two groups (Figure 3A). The duodenal iron-metabolism genes including duodenal cytochrome b (Dcytb), ferritin light chain (Ftl) and ferroportin (Fpn) were significantly up-regulated on an mRNA level after consecutive injection with Dex (Figure 3B). As shown in Figure 3D,E, the duodenal DCYTB (p = 0.00) and divalent metal transporter 1 (DMT1) (p = 0.04) protein expression was significantly decreased, while FPN protein markedly increased (p = 0.04) in the Dex group.
3.5. Histological Characteristics, Hepatic Iron Content and Hepatic Iron-Metabolism Genes Expression
Perls’ Prussian Blue staining of liver sections showed that hepatic cells have least iron density in the Dex exposure group (Figure 4A). Dex administration markedly reduced the iron content in the liver (p = 0.02, Figure 4B). Dex injection did not affect hepatic Tfr1 mRNA abundance (Figure 4C), whereas it did significantly lower the TFR1 protein level (p = 0.03) and hepatic hepcidin content (p = 0.00) (Figure 4D–F). Reduced expression of both mRNA (p = 0.01, Figure 4C) and protein (p = 0.08, Figure 4D,E) levels of FTL was observed in rats treated with Dex. No significant changes were detected for these proteins including transferrin (TF), transferrin receptor 2 (TFR2), DMT1, ZRT/IRT-like protein 14 (ZIP14), ferritin heavy chain (FTH) and FPN in the liver of rats after exposure to Dex (Figure 4D,E). In addition, no significant difference was observed in the iron content of the spleen, kidney and dorsal muscles of rats treated with Dex injection over 21 days (data not provided).
3.6. Transcription and Post-Transcriptional Regulation of Hepatic Tfr1
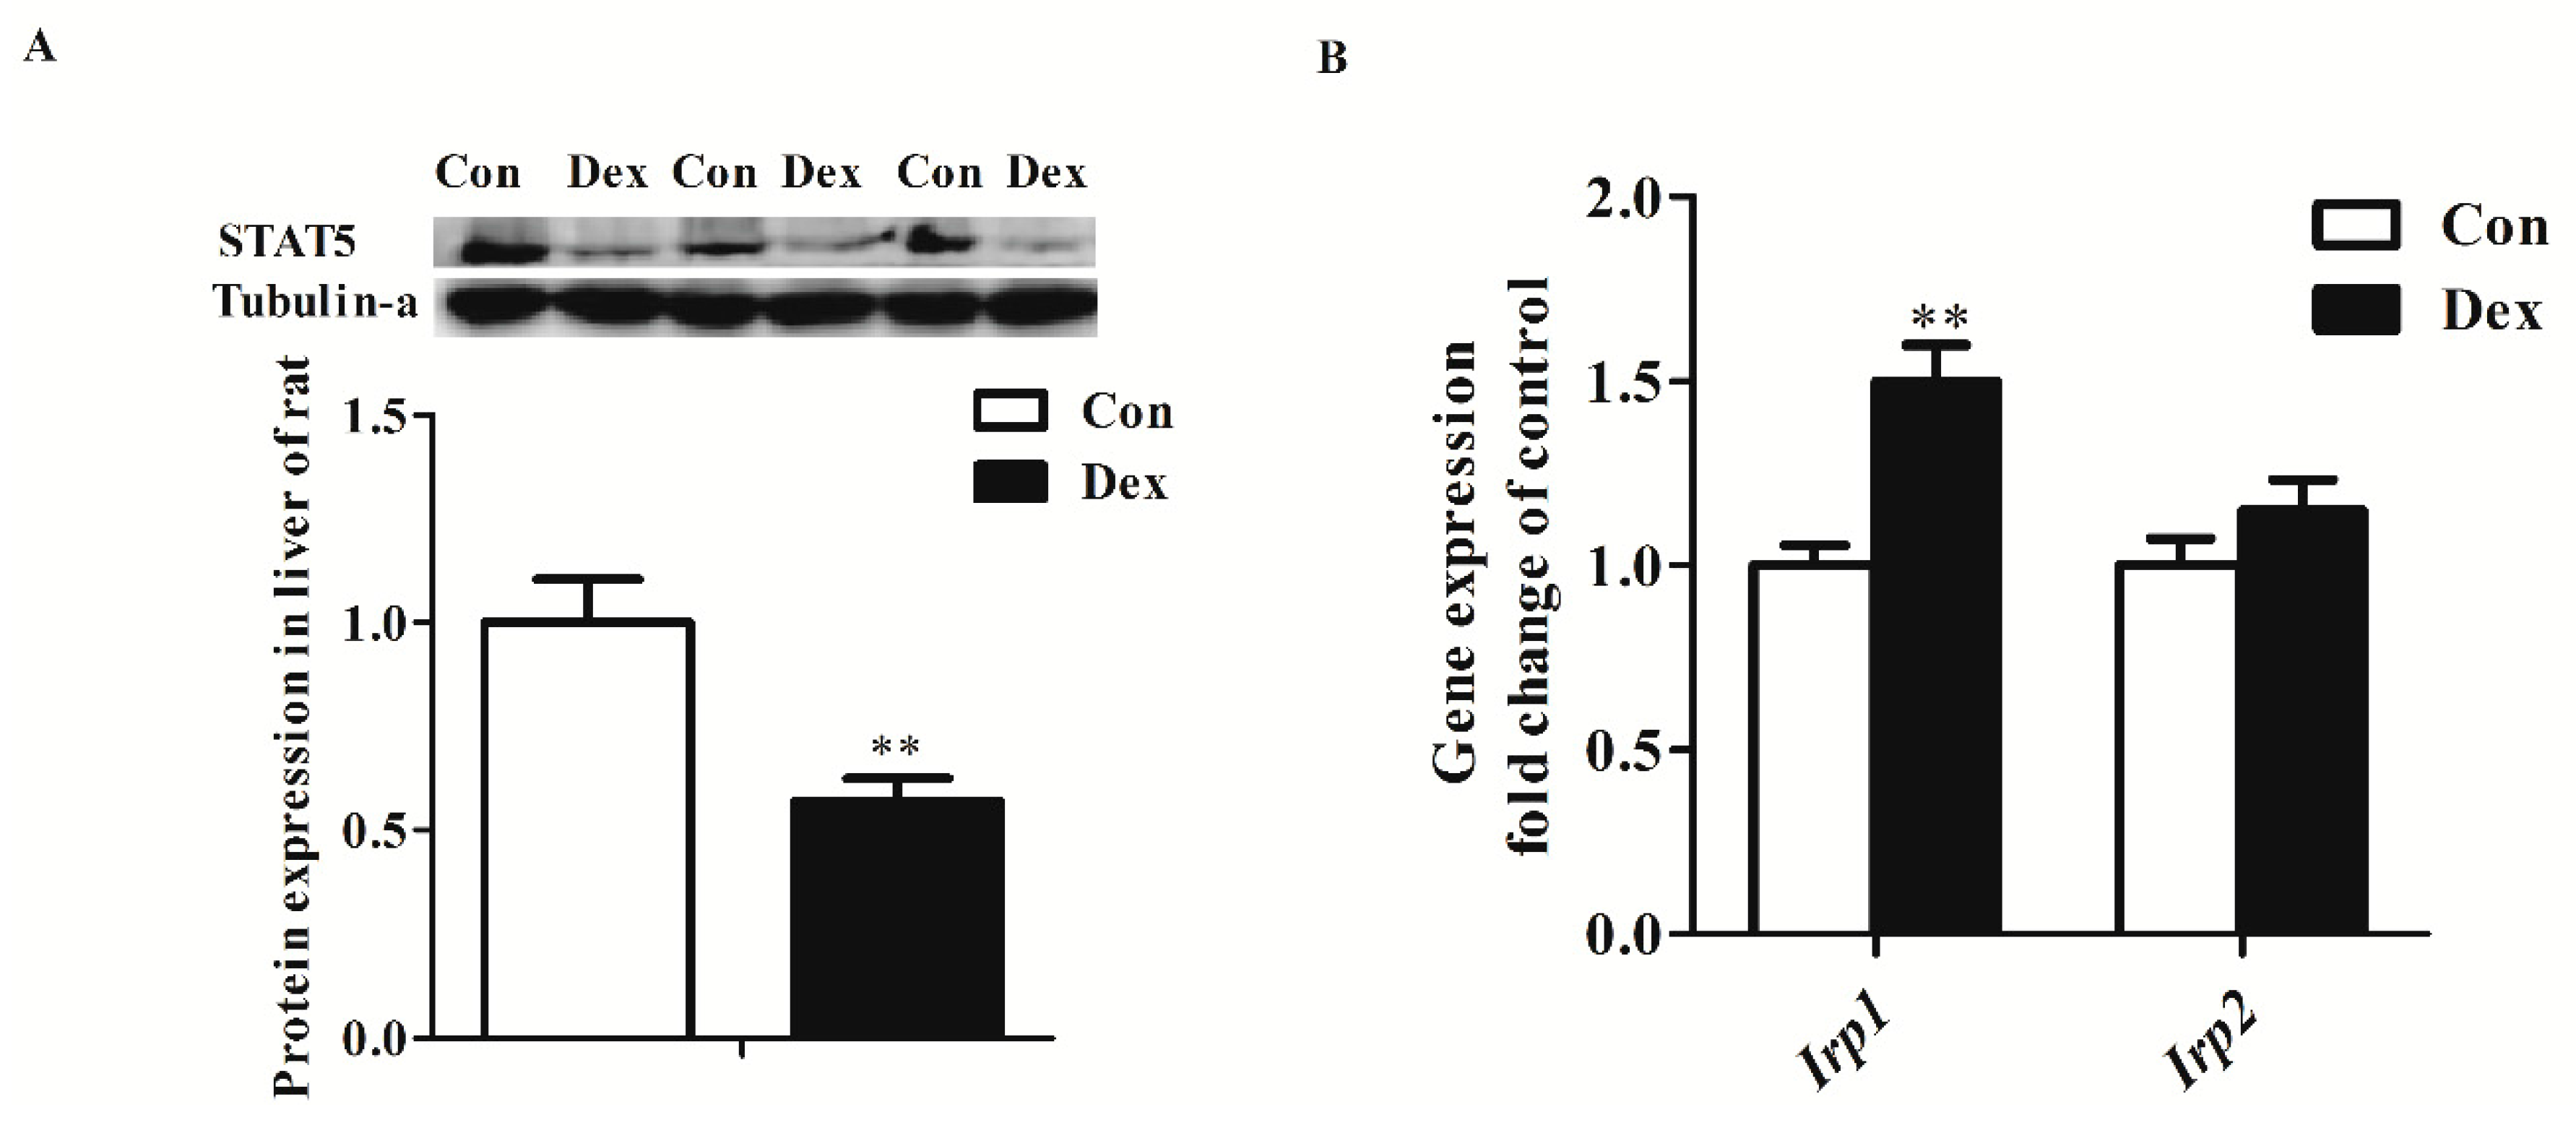
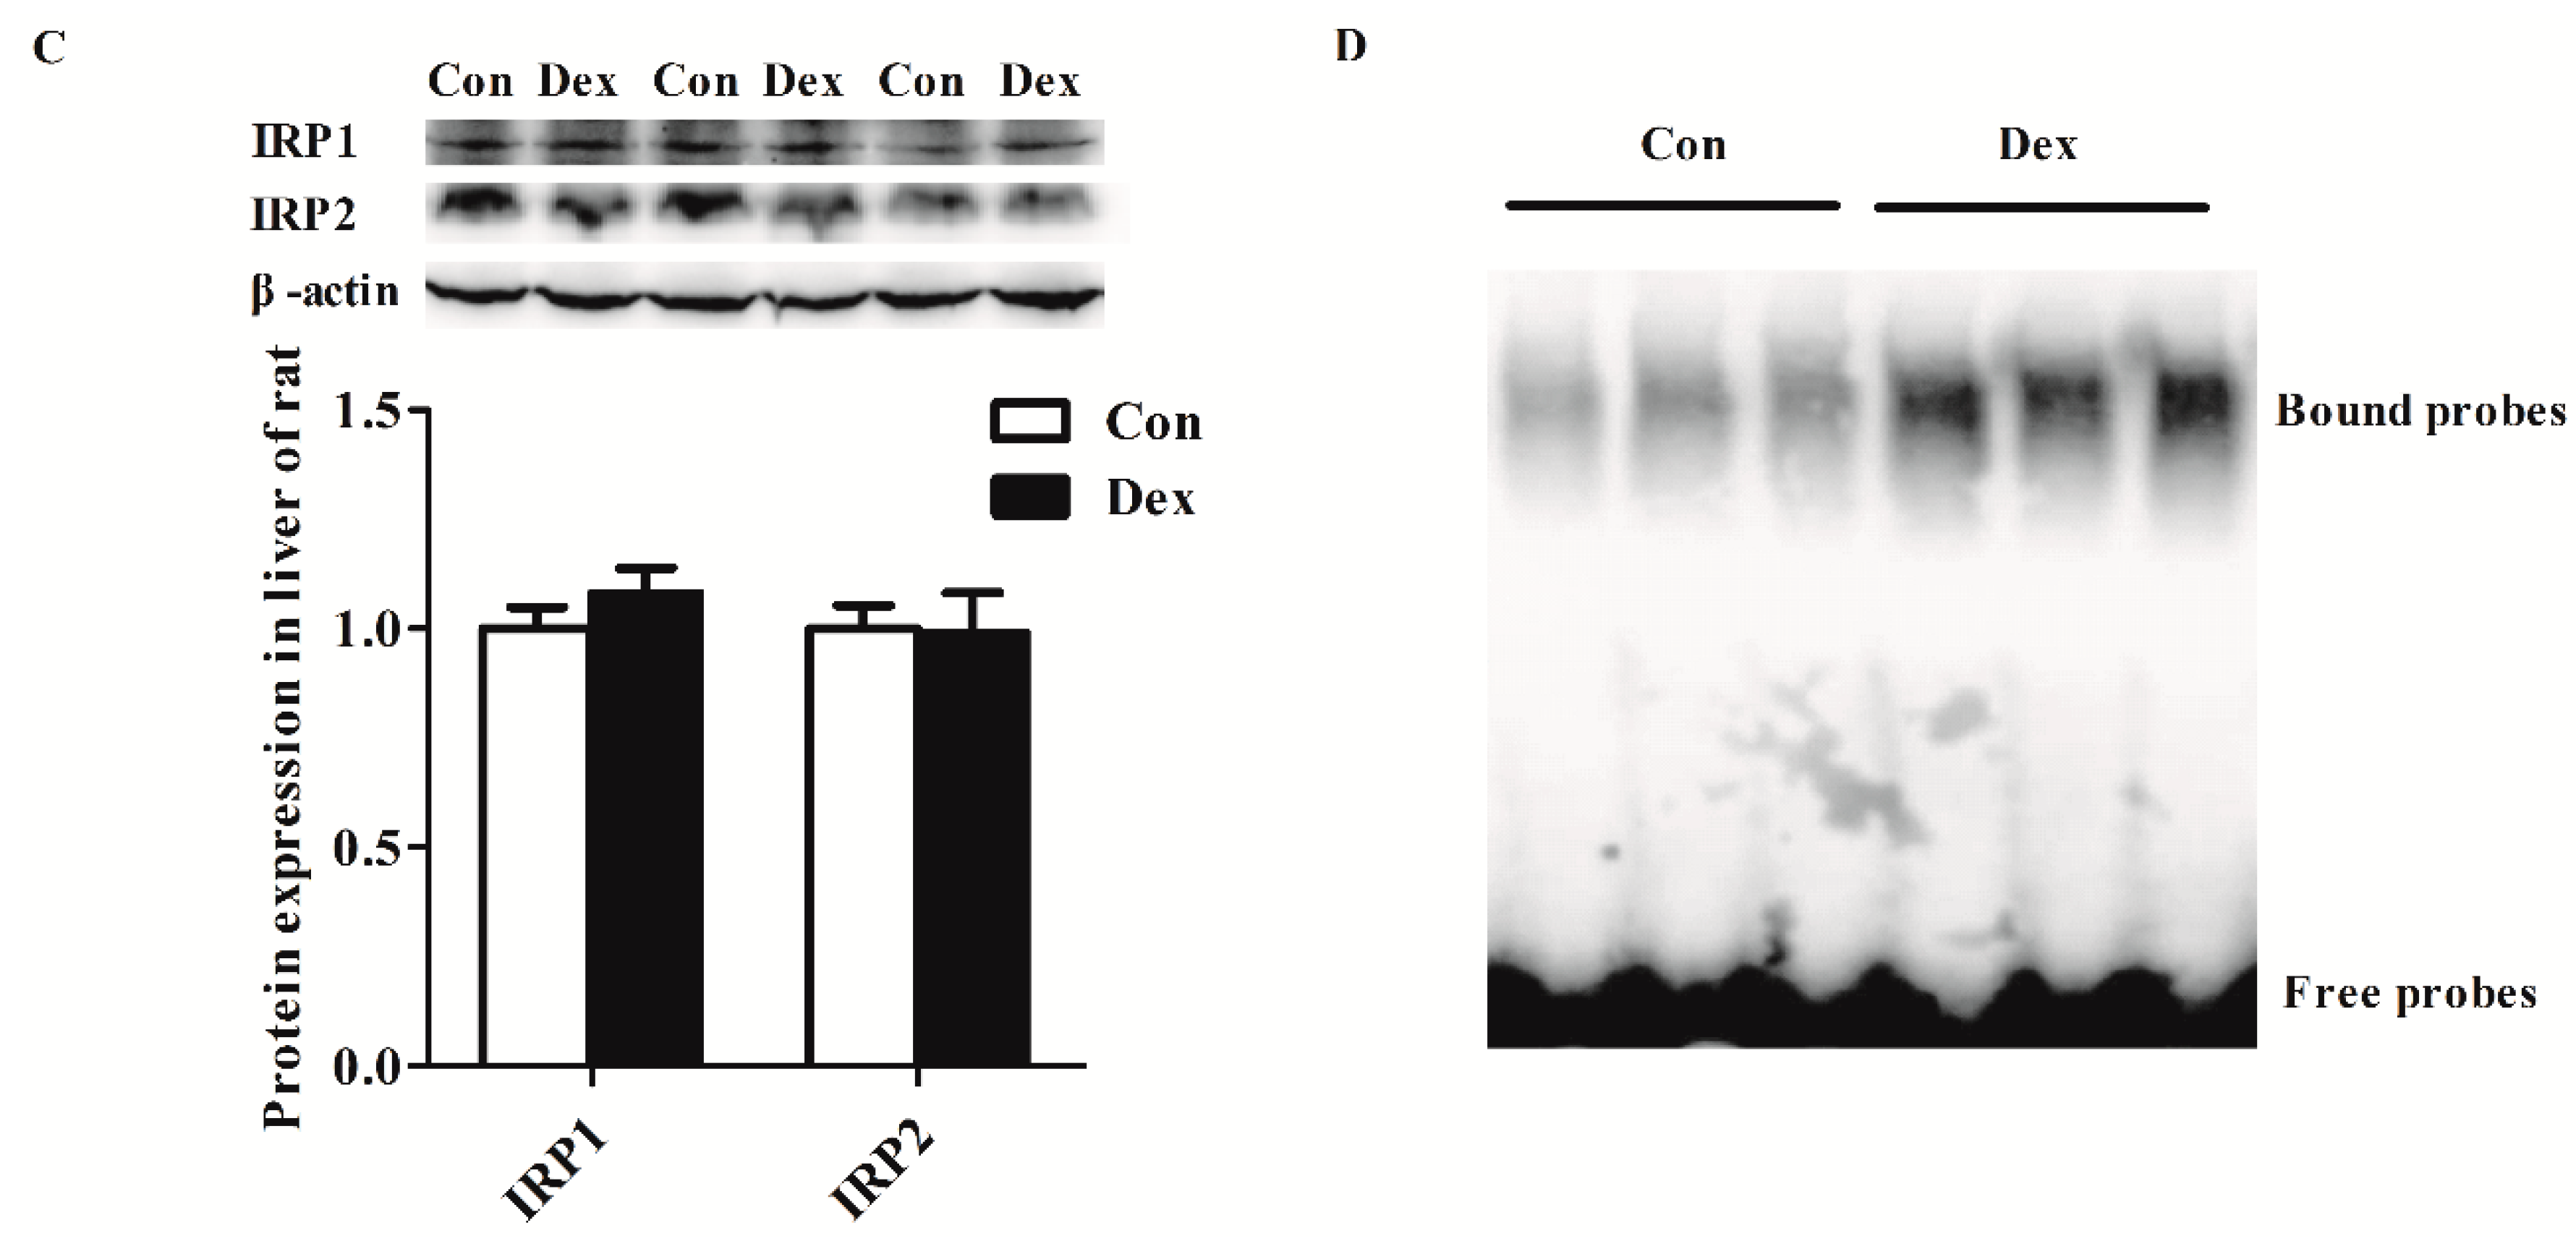
Dex administration significantly decreased the Tfr1 transcription factor for the signal transducers and activators of transcription 5 (STAT5) protein level (p = 0.00) (Figure 5A). The IRP/IRE regulatory network is the most common post-transcriptional regulation of Tfr1 expression. Dex administration markedly increased Irp1 mRNA expression (p = 0.00), but did not affect IRP1 and IRP2 protein levels (Figure 5B,C). Nevertheless, the activity of IRP1/2 binding to Tfr1 mRNA exhibited an obvious increase in Dex-treated rats (Figure 5D).
4. Discussion
Stress affects immune function and food intake in a bidirectional way, mainly depending on the intensity and duration of stressors [18,23,29]. Chronic or long-term stress induces suppression of immune function by decreasing immune cell numbers/function and increasing active immunosuppressive mechanisms [18]. In this study, long-term Dex administration reduced the white blood cell counts, lymphocyte counts, and serum IL-6 level, which are the characteristics of immunosuppression. In addition, similar hyper-suppression was observed that the lowered serum glucocorticoid (CORT) level was caused by the feedback inhibition of the HPA axis response to a lower dose of Dex exposure [30,31]. It is also a known fact that stress severity is directly related to reduced food intake and body weight in rodents [29]. Similar to previous studies [23,32,33,34], long-term Dex administration (0.1 mg/kg/day) could inhibit food intake and reduce body weight of female rats fed the less palatable diet in this study. However, the 7-day or 14-day psychological stress exposure induced by the communication box did not affect food intake and body weight [13,35,36]. Long-term and severe stress results in inhibition of growth and food intake, in part because the increasing release of leptin functions as feeding reductions and enhances energy output [23,37,38].
It is revealed that psychological stress reduces blood iron levels [12,13,14,39]. In contrast to the previous findings, our results showed that long-term Dex administration resulted in enhanced serum iron levels in rats. The difference could be induced by stress related to the intensity and duration. DCYTB is a ferric reductase that reduces ferric to ferrous iron [40], then ferrous iron is mainly transported from lumen into the enterocytes by DMT1 in the duodenum [41,42]. FPN is the only known mammalian iron exporter, and transports iron across the basolateral membrane into the circulation [6,43]. It is reported that psychological stress does not affect iron intake, but inhibits iron transport via decreased duodenal FPN expression [14,15]. However, long-term Dex exposure decreases the iron intake, which is closely associated with reduced duodenal DCYTB and DMT1 expression. FPN is down-regulated by hepcidin via proteasome internalization and degradation in enterocytes, macrophages, and hepatocytes [44]. In our results, lowered hepcidin plays a role in increased duodenal FPN expression.
The liver plays a vital role in maintaining systemic iron balance by acting as an exchangeable iron pool. Hepcidin is mainly produced and secreted by hepatocytes [45], which induces degradation of FPN to regulate systemic iron homeostasis. It is proved that hepcidin synthesis is up-regulated by IL-6 through STAT3 signaling pathway [46,47]. The psychological stress could up-regulate expressions of IL-6 and hepcidin [14]. Nevertheless, long-term Dex exposure down-regulated IL-6 level and resulted in reduced hepatic hepcidin content. Liver iron storage is controlled by regulating hepatic iron uptake and release. The mechanisms of iron uptake in the liver are through TFR-dependent pathways (TFR1 and TFR2) and TFR-independent (DMT1 and ZIP14) pathways, respectively [48,49]. Transferrin-bound iron is taken up through a TFR1/2-mediated endocytosis [50,51], whereas non-transferrin-bound iron is transported via DMT1 and ZIP14. FPN is the only known iron exporter, which releases iron from ferritin in animals [6]. Psychological stress increased hepcidin expression and led to hepatic FPN degradation, whereas it develops hepatic iron accumulation in rodents [14]. In this study, other proteins related to iron uptake (TFR2, DMT1, ZIP14) and iron exporter (FPN) expression did not differ in rats treated with Dex exposure. Therefore, reduced liver iron content is closely associated with impaired hepatic iron uptake via a TFR1-dependent pathway.
Tfr1 expression is regulated at transcriptional and post-transcriptional levels. It has been reported that the signal transducer and activator of transcription 5 (STAT5) is an important transcriptional regulator of Tfr1, and its mutation causes microcytic anemia associated with severe iron deficiency in mice [52]. Endogenous glucocorticoid exposure generally suppresses growth hormone (GH) release and impairs GH-dependent activation of the transcription factor STAT5 in the liver [52,53,54]. On the other hand, Tfr1 expression is mainly regulated post-transcriptionally by cellular iron levels through the IRP–IRE system [55]. When cellular iron is deficient, IRPs bind to IREs of Tfr1 mRNA 3′ UTR and decrease its mRNA turnover and degradation [56]. Previous studies have shown, that a certain degree of psychological stress or glucocorticoid exposure up-regulates Tfr1 expression, through increasing IRP1 and STAT5 levels to cause liver iron accumulation. In the present study, long-term Dex exposure had no impact on liver Tfr1 expression, but did supress the hepatic STAT5 protein level and enhanced the IRP–IRE activity of hepatic Tfr1 in rats. Impaired STAT5 protein expression and increased IRP–IRE activity of hepatic Tfr1 could be jointly responsible for the unchanged Tfr1 mRNA level.
It has been demonstrated that accelerated protein degradation is induced by glucocorticoids (dexamethasone or cortisol) in vitro [57,58] or in vivo [59]. In eukaryotic cells, ubiquitin–proteasome system and autophagy are the two major pathways that degrade most cellular proteins [60]. Mi et al. (2017) reported that the reduction in COL1A1 protein abundance induced by cortisol was associated with lysosome-mediated autophagic degradation of COL1A1 in fibroblasts [58]. In addition, the stimulatory glucocorticoid increases MyoD degradation via ubiquitin-proteasome-dependent proteolysis [59]. Therefore, the lysosome-mediated autophagic degradation and/or ubiquitin-dependent proteolysis may play a role in the down-regulation of hepatic TFR1 protein abundance at the post-translational level.
In summary, long-term Dex exposure disturbs iron homeostasis and mainly results in enhanced serum iron level, suppressed TFR1 protein expression and decreased hepatic iron content. The decreasing liver iron content is closely associated with the inhibition of hepatic iron uptake through a TFR1-mediated pathway.
Acknowledgments
This work was supported by grants from the National Natural Science Foundation of China (31302053), the Fundamental Research Funds for the Central Universities (KJQN201404), the Innovation Project of Jiangsu Province Postgraduate Education (2013CXLX13_292), the Priority Academic Program Development of Jiangsu Higher Education Institutions and the Jiangsu Collaborative Innovation Center of Meat Production and Processing, Quality and Safety Control.
Author Contributions
Ruqian Zhao and Wenqiang Ma conceived the project. Huifang Li performed most experiments. Shuxia Jiang assisted western blotting. Chun Yang performed tissue iron detection. Shu Yang and Bin He conducted animal experiment. Wenqiang Ma wrote the manuscript. All authors reviewed the results and agreed to the final version of the manuscript.
Conflicts of Interest
The authors declare no conflict of interest.
References
- Chifman, J.; Laubenbacher, R.; Torti, S.V. A systems biology approach to iron metabolism. Adv. Exp. Med. Biol. 2014, 844, 201–225. [Google Scholar] [PubMed]
- Andrews, N.C. Forging a field: The golden age of iron biology. Blood 2008, 112, 219–230. [Google Scholar] [CrossRef] [PubMed]
- Gozzelino, R.; Arosio, P. Iron homeostasis in health and disease. Int. J. Mol. Sci. 2016, 17. [Google Scholar] [CrossRef] [PubMed]
- Tandara, L.; Salamunic, I. Iron metabolism: Current facts and future directions. Biochem. Med. 2012, 22, 311–328. [Google Scholar] [CrossRef]
- Hentze, M.W.; Muckenthaler, M.U.; Galy, B.; Camaschella, C. Two to tango: Regulation of mammalian iron metabolism. Cell 2010, 142, 24–38. [Google Scholar] [CrossRef] [PubMed]
- Nemeth, E.; Tuttle, M.S.; Powelson, J.; Vaughn, M.B.; Donovan, A.; Ward, D.M.; Ganz, T.; Kaplan, J. Hepcidin regulates cellular iron efflux by binding to ferroportin and inducing its internalization. Science 2004, 306, 2090–2093. [Google Scholar] [CrossRef] [PubMed]
- Ward, D.M.; Kaplan, J. Ferroportin-mediated iron transport: Expression and regulation. Biochim. Biophys. Acta 2012, 9, 1426–1433. [Google Scholar] [CrossRef] [PubMed]
- Ganz, T. Systemic iron homeostasis. Physiol. Rev. 2013, 93, 1721–1741. [Google Scholar] [CrossRef] [PubMed]
- Anderson, C.P.; Shen, M.; Eisenstein, R.S.; Leibold, E.A. Mammalian iron metabolism and its control by iron regulatory proteins. Biochim. Biophys. Acta 2012, 1823, 1468–1483. [Google Scholar] [CrossRef] [PubMed]
- Wang, J.; Pantopoulos, K. Regulation of cellular iron metabolism. Biochem. J. 2011, 434, 365–381. [Google Scholar] [CrossRef] [PubMed]
- Bowers, S.L.; Bilbo, S.D.; Dhabhar, F.S.; Nelson, R.J. Stressor-specific alterations in corticosterone and immune responses in mice. Brain Behav. Immun. 2008, 22, 105–113. [Google Scholar] [CrossRef] [PubMed]
- Teng, W.F.; Sun, W.M.; Shi, L.F.; Hou, D.D.; Liu, H. Effects of restraint stress on iron, zinc, calcium, and magnesium whole blood levels in mice. Biol. Trace Elem. Res. 2008, 121, 243–248. [Google Scholar] [CrossRef] [PubMed]
- Wei, C.; Zhou, J.; Huang, X.; Li, M. Effects of psychological stress on serum iron and erythropoiesis. Int. J. Hematol. 2008, 88, 52–56. [Google Scholar] [CrossRef] [PubMed]
- Zhao, M.; Chen, J.; Wang, W.; Wang, L.; Ma, L.; Shen, H.; Li, M. Psychological stress induces hypoferremia through the il-6-hepcidin axis in rats. Biochem. Biophys. Res. Commun. 2008, 373, 90–93. [Google Scholar] [CrossRef] [PubMed]
- Chen, J.; Shen, H.; Chen, C.; Wang, W.; Yu, S.; Zhao, M.; Li, M. The effect of psychological stress on iron absorption in rats. BMC Gastroenterol. 2009, 9, 83. [Google Scholar] [CrossRef] [PubMed]
- He, F.; Ma, L.; Wang, H.; Shen, Z.; Li, M. Glucocorticoid causes iron accumulation in liver by up-regulating expression of iron regulatory protein 1 gene through gr and stat5. Cell Biochem. Biophys. 2011, 61, 65–71. [Google Scholar] [CrossRef] [PubMed]
- Koob, T.J.; Summers, A.P. Tendon—Bridging the gap. Comp. Biochem. Physiol. A Mol. Integr. Physiol. 2002, 133, 905–1192. [Google Scholar] [CrossRef]
- Dhabhar, F.S. Effects of stress on immune function: The good, the bad, and the beautiful. Immunol. Res. 2014, 58, 193–210. [Google Scholar] [CrossRef] [PubMed]
- Farajdokht, F.; Soleimani, M.; Mehrpouya, S.; Barati, M.; Nahavandi, A. The role of hepcidin in chronic mild stress-induced depression. Neurosci. Lett. 2015, 588, 120–124. [Google Scholar] [CrossRef] [PubMed]
- Sorrells, S.F.; Sapolsky, R.M. An inflammatory review of glucocorticoid actions in the cns. Brain Behav Immun. 2007, 21, 259–272. [Google Scholar] [CrossRef] [PubMed]
- Teague, C.R.; Dhabhar, F.S.; Barton, R.H.; Beckwith-Hall, B.; Powell, J.; Cobain, M.; Singer, B.; McEwen, B.S.; Lindon, J.C.; Nicholson, J.K.; et al. Metabonomic studies on the physiological effects of acute and chronic psychological stress in sprague-dawley rats. J. Proteome Res. 2007, 6, 2080–2093. [Google Scholar] [CrossRef] [PubMed]
- Papadimitriou, A.; Priftis, K.N. Regulation of the hypothalamic-pituitary-adrenal axis. Neuroimmunomodulation 2009, 16, 265–271. [Google Scholar] [CrossRef] [PubMed]
- Jahng, J.W.; Kim, N.Y.; Ryu, V.; Yoo, S.B.; Kim, B.T.; Kang, D.W.; Lee, J.H. Dexamethasone reduces food intake, weight gain and the hypothalamic 5-ht concentration and increases plasma leptin in rats. Eur. J. Pharmacol. 2008, 581, 64–70. [Google Scholar] [CrossRef] [PubMed]
- Li, Y.; Cai, H.Y.; Liu, G.H.; Dong, X.L.; Chang, W.H.; Zhang, S.; Zheng, A.J.; Chen, G.L. Effects of stress simulated by dexamethasone on jejunal glucose transport in broilers. Poult. Sci. 2009, 88, 330–337. [Google Scholar] [CrossRef] [PubMed]
- Thachil, A.J.; Shaw, D.P.; Nagaraja, K.V. Effects of dexamethasone immunosuppression on turkey clostridial dermatitis. Avian Dis. 2014, 58, 433–436. [Google Scholar] [CrossRef] [PubMed]
- LaVaute, T.; Smith, S.; Cooperman, S.; Iwai, K.; Land, W.; Meyron-Holtz, E.; Drake, S.K.; Miller, G.; Abu-Asab, M.; Tsokos, M.; et al. Targeted deletion of the gene encoding iron regulatory protein-2 causes misregulation of iron metabolism and neurodegenerative disease in mice. Nat. Genet. 2001, 27, 209–214. [Google Scholar] [CrossRef] [PubMed]
- Ma, W.; Gu, Y.; Lu, J.; Yuan, L.; Zhao, R. Effects of chromium propionate on egg production, egg quality, plasma biochemical parameters, and egg chromium deposition in late-phase laying hens. Biol. Trace Elem. Res. 2014, 157, 113–119. [Google Scholar] [CrossRef] [PubMed]
- Livak, K.J.; Schmittgen, T.D. Analysis of relative gene expression data using real-time quantitative pcr and the 2(-delta delta c(t)) method. Methods 2001, 25, 402–408. [Google Scholar] [CrossRef] [PubMed]
- Marti, O.; Marti, J.; Armario, A. Effects of chronic stress on food intake in rats: Influence of stressor intensity and duration of daily exposure. Physiol. Behav. 1994, 55, 747–753. [Google Scholar] [CrossRef]
- Cole, M.A.; Kim, P.J.; Kalman, B.A.; Spencer, R.L. Dexamethasone suppression of corticosteroid secretion: Evaluation of the site of action by receptor measures and functional studies. Psychoneuroendocrinology 2000, 25, 151–167. [Google Scholar] [CrossRef]
- Simoens, V.L.; Hebert, S. Cortisol suppression and hearing thresholds in tinnitus after low-dose dexamethasone challenge. BMC Ear Nose Throat Disord. 2012, 12, 4. [Google Scholar] [CrossRef] [PubMed]
- Rybkin, I.I.; Zhou, Y.; Volaufova, J.; Smagin, G.N.; Ryan, D.H.; Harris, R.B. Effect of restraint stress on food intake and body weight is determined by time of day. Am. J. Physiol. 1997, 273, R1612–R1622. [Google Scholar]
- Valles, A.; Marti, O.; Garcia, A.; Armario, A. Single exposure to stressors causes long-lasting, stress-dependent reduction of food intake in rats. Am. J. Physiol. Regul. Integr. Comp. Physiol. 2000, 279, R1138–R1144. [Google Scholar] [PubMed]
- Caldefie-Chezet, F.; Poulin, A.; Enreille-Leger, A.; Vasson, M.P. Troglitazone reduces leptinemia during experimental dexamethasone-induced stress. Horm. Metab. Res. 2005, 37, 164–171. [Google Scholar] [CrossRef] [PubMed]
- Tao, L.; Zheng, Y.; Shen, Z.; Li, Y.; Tian, X.; Dou, X.; Qian, J.; Shen, H. Psychological stress-induced lower serum zinc and zinc redistribution in rats. Biol. Trace Elem. Res. 2013, 155, 65–71. [Google Scholar] [CrossRef] [PubMed]
- Tian, X.; Zheng, Y.; Li, Y.; Shen, Z.; Tao, L.; Dou, X.; Qian, J.; Shen, H. Psychological stress induced zinc accumulation and up-regulation of zip14 and metallothionein in rat liver. BMC Gastroenterol. 2014, 14, 32. [Google Scholar] [CrossRef] [PubMed]
- Lee, M.J.; Wang, Y.; Ricci, M.R.; Sullivan, S.; Russell, C.D.; Fried, S.K. Acute and chronic regulation of leptin synthesis, storage, and secretion by insulin and dexamethasone in human adipose tissue. Am. J. Physiol. Endocrinol. Metab. 2007, 292, E858–E864. [Google Scholar] [CrossRef] [PubMed]
- Cartmill, J.A.; Thompson, D.L., Jr.; Storer, W.A.; Crowley, J.C.; Huff, N.K.; Waller, C.A. Effect of dexamethasone, feeding time, and insulin infusion on leptin concentrations in stallions. J. Anim. Sci. 2005, 83, 1875–1881. [Google Scholar] [CrossRef] [PubMed]
- Vignjevic, S.; Budec, M.; Markovic, D.; Dikic, D.; Mitrovic, O.; Mojsilovic, S.; Duric, S.V.; Koko, V.; Cokic, B.B.; Cokic, V.; et al. Chronic psychological stress activates bmp4-dependent extramedullary erythropoiesis. J. Cell. Mol. Med. 2014, 18, 91–103. [Google Scholar] [CrossRef] [PubMed]
- Latunde-Dada, G.O.; Simpson, R.J.; McKie, A.T. Duodenal cytochrome b expression stimulates iron uptake by human intestinal epithelial cells. J. Nutr. 2008, 138, 991–995. [Google Scholar] [PubMed]
- Gunshin, H.; Fujiwara, Y.; Custodio, A.O.; Direnzo, C.; Robine, S.; Andrews, N.C. Slc11a2 is required for intestinal iron absorption and erythropoiesis but dispensable in placenta and liver. J. Clin. Investig. 2005, 115, 1258–1266. [Google Scholar] [CrossRef] [PubMed]
- Shawki, A.; Anthony, S.R.; Nose, Y.; Engevik, M.A.; Niespodzany, E.J.; Barrientos, T.; Ohrvik, H.; Worrell, R.T.; Thiele, D.J.; Mackenzie, B. Intestinal dmt1 is critical for iron absorption in the mouse but is not required for the absorption of copper or manganese. Am. J. Physiol. Gastrointest. Liver Physiol. 2015, 309, G635–G647. [Google Scholar] [CrossRef] [PubMed]
- Donovan, A.; Lima, C.A.; Pinkus, J.L.; Pinkus, G.S.; Zon, L.I.; Robine, S.; Andrews, N.C. The iron exporter ferroportin/slc40a1 is essential for iron homeostasis. Cell Metab. 2005, 1, 191–200. [Google Scholar] [CrossRef] [PubMed]
- Qiao, B.; Sugianto, P.; Fung, E.; Del-Castillo-Rueda, A.; Moran-Jimenez, M.J.; Ganz, T.; Nemeth, E. Hepcidin-induced endocytosis of ferroportin is dependent on ferroportin ubiquitination. Cell Metab. 2012, 15, 918–924. [Google Scholar] [CrossRef] [PubMed]
- Sangkhae, V.; Nemeth, E. Regulation of the iron homeostatic hormone hepcidin. Adv. Nutr. 2017, 8, 126–136. [Google Scholar] [CrossRef] [PubMed]
- Wrighting, D.M.; Andrews, N.C. Interleukin-6 induces hepcidin expression through stat3. Blood 2006, 108, 3204–3209. [Google Scholar] [CrossRef] [PubMed]
- Pasricha, S.R.; McHugh, K.; Drakesmith, H. Regulation of hepcidin by erythropoiesis: The story so far. Annu. Rev. Nutr. 2016, 36, 417–434. [Google Scholar] [CrossRef] [PubMed]
- Graham, R.M.; Chua, A.C.; Herbison, C.E.; Olynyk, J.K.; Trinder, D. Liver iron transport. World J. Gastroenterol. 2007, 13, 4725–4736. [Google Scholar] [CrossRef] [PubMed]
- Anderson, E.R.; Shah, Y.M. Iron homeostasis in the liver. Compr. Physiol. 2013, 3, 315–330. [Google Scholar] [PubMed]
- Graham, R.M.; Reutens, G.M.; Herbison, C.E.; Delima, R.D.; Chua, A.C.; Olynyk, J.K.; Trinder, D. Transferrin receptor 2 mediates uptake of transferrin-bound and non-transferrin-bound iron. J. Hepatol. 2008, 48, 327–334. [Google Scholar] [CrossRef] [PubMed]
- Pantopoulos, K.; Porwal, S.K.; Tartakoff, A.; Devireddy, L. Mechanisms of mammalian iron homeostasis. Biochemistry 2012, 51, 5705–5724. [Google Scholar] [CrossRef] [PubMed]
- Kerenyi, M.A.; Grebien, F.; Gehart, H.; Schifrer, M.; Artaker, M.; Kovacic, B.; Beug, H.; Moriggl, R.; Mullner, E.W. Stat5 regulates cellular iron uptake of erythroid cells via irp-2 and tfr-1. Blood 2008, 112, 3878–3888. [Google Scholar] [CrossRef] [PubMed]
- Miell, J.P.; Corder, R.; Pralong, F.P.; Gaillard, R.C. Effects of dexamethasone on growth hormone (gh)-releasing hormone, arginine- and dopaminergic stimulated gh secretion, and total plasma insulin-like growth factor-i concentrations in normal male volunteers. J. Clin. Endocrinol. Metab. 1991, 72, 675–681. [Google Scholar] [CrossRef] [PubMed]
- Jux, C.; Leiber, K.; Hugel, U.; Blum, W.; Ohlsson, C.; Klaus, G.; Mehls, O. Dexamethasone impairs growth hormone (gh)-stimulated growth by suppression of local insulin-like growth factor (igf)-i production and expression of gh- and igf-i-receptor in cultured rat chondrocytes. Endocrinology 1998, 139, 3296–3305. [Google Scholar] [CrossRef] [PubMed]
- Bonnah, R.A.; Muckenthaler, M.U.; Carlson, H.; Minana, B.; Enns, C.A.; Hentze, M.W.; So, M. Expression of epithelial cell iron-related genes upon infection by neisseria meningitidis. Cell. Microbiol. 2004, 6, 473–484. [Google Scholar] [CrossRef] [PubMed]
- Binder, R.; Horowitz, J.A.; Basilion, J.P.; Koeller, D.M.; Klausner, R.D.; Harford, J.B. Evidence that the pathway of transferrin receptor mrna degradation involves an endonucleolytic cleavage within the 3′ utr and does not involve poly(a) tail shortening. EMBO J. 1994, 13, 1969–1980. [Google Scholar] [PubMed]
- Hopgood, M.F.; Clark, M.G.; Ballard, F.J. Stimulation by glucocorticoids of protein degradation in hepatocyte monolayers. Biochem. J. 1981, 196, 33–40. [Google Scholar] [CrossRef] [PubMed]
- Mi, Y.; Wang, W.; Zhang, C.; Liu, C.; Lu, J.; Li, W.; Zuo, R.; Myatt, L.; Sun, K. Autophagic degradation of collagen 1a1 by cortisol in human amnion fibroblasts. Endocrinology 2017, 158, 1005–1014. [Google Scholar] [CrossRef] [PubMed]
- Sun, L.; Trausch-Azar, J.S.; Muglia, L.J.; Schwartz, A.L. Glucocorticoids differentially regulate degradation of myod and id1 by n-terminal ubiquitination to promote muscle protein catabolism. PNAS 2008, 105, 3339–3344. [Google Scholar] [CrossRef] [PubMed]
- Lilienbaum, A. Relationship between the proteasomal system and autophagy. Int. J. Biochem. Mol. Biol. 2013, 4, 1–26. [Google Scholar] [PubMed]
Figure 1.
Effects of dexamethasone (Dex) administration on serum CORT, IL-6 levels and hemocytes in rats. (A) Dex administration lowers serum CORT level. Lowered CORT level is caused by the feedback inhibition of the HPA axis response to long-term Dex exposure; (B) Long-term Dex exposure reduces serum IL-6 level; (C) Dex administration decreases blood WBC counts; (D) Long-term Dex exposure declines Lymph counts. Definitions: CORT, corticosterone; IL-6, interleukin-6; WBC, white blood cell; Lymph, lymphocyte. Values are expressed as Mean ± SEM, n = 10, different from control, * p < 0.05 and ** p < 0.01.
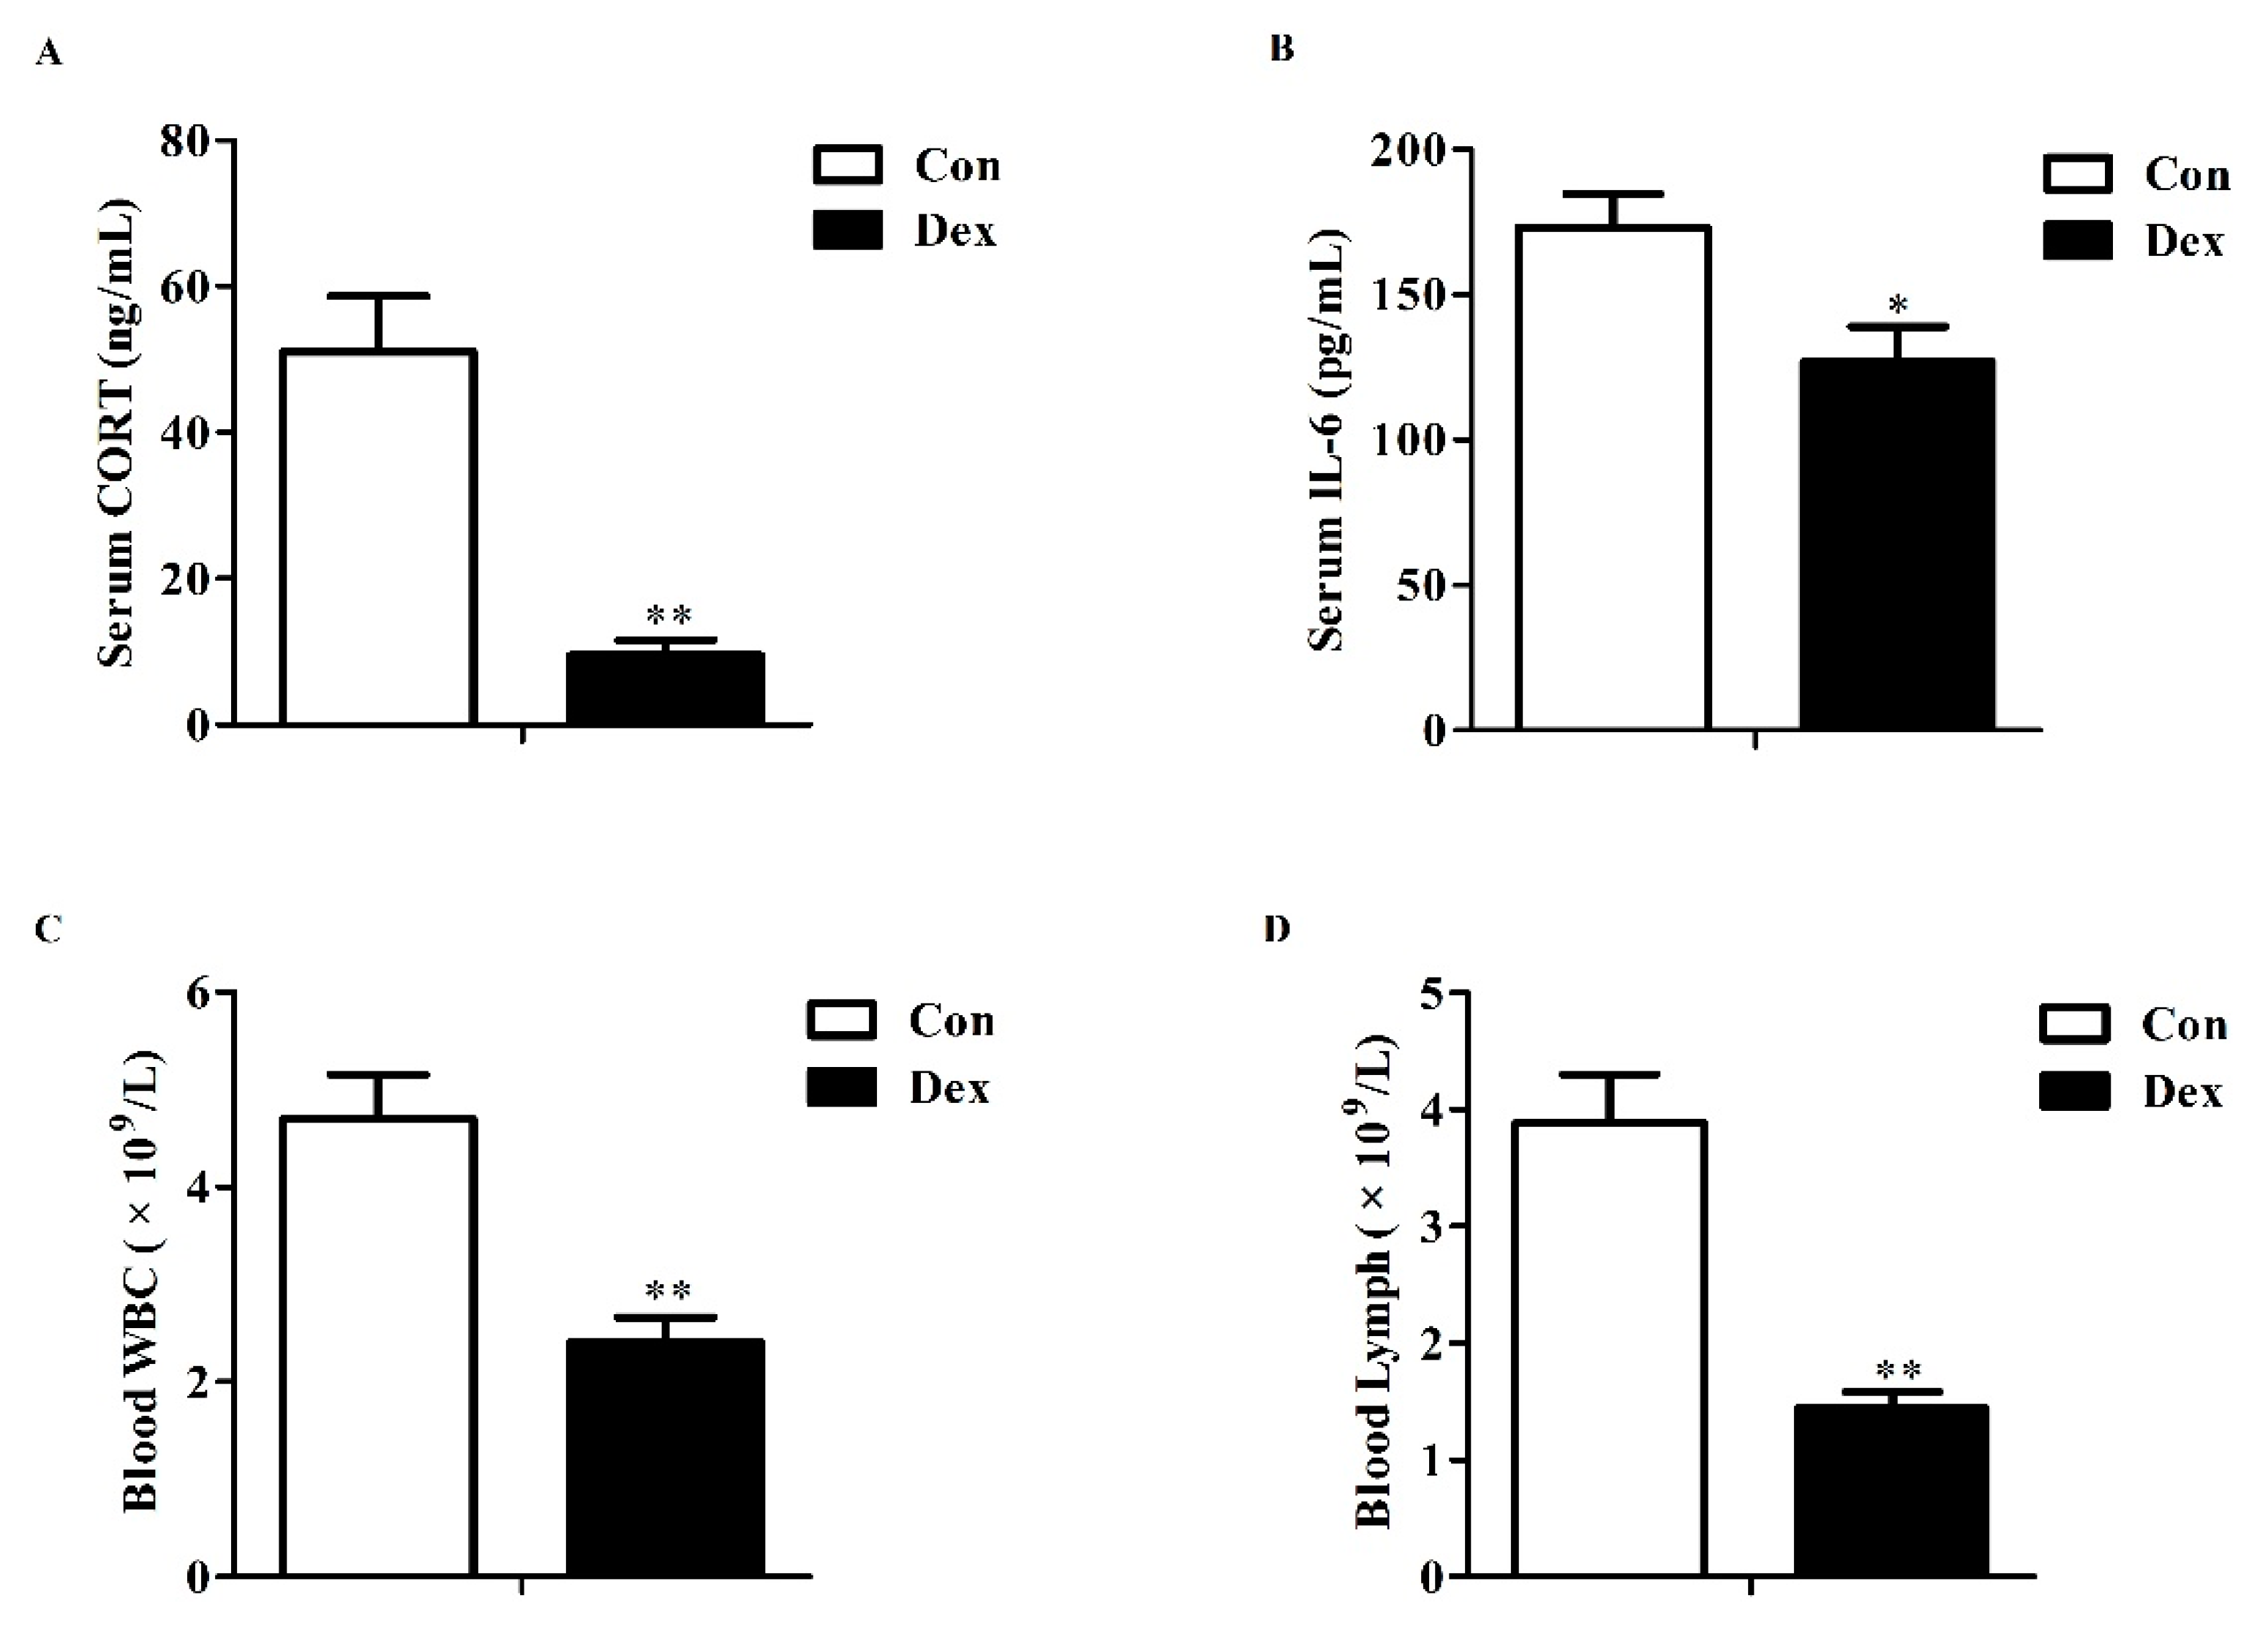
Figure 2.
Dex administration inhibits growth, food intake and iron intake in rats. (A) Effect of long-term Dex exposure on growth rate; (B) Effect of Dex administration on food intake; (C) Average food intake in 21 days; (D) Average iron intake in 21 days. Body weight and food intake were monitored every two days. Average iron intake was calculated on the basis of average food intake and iron content of food. Definitions: Con, control; Dex, dexamethasone. Values are means ± SEM, n = 15, different from control, * p < 0.05 and ** p < 0.01.

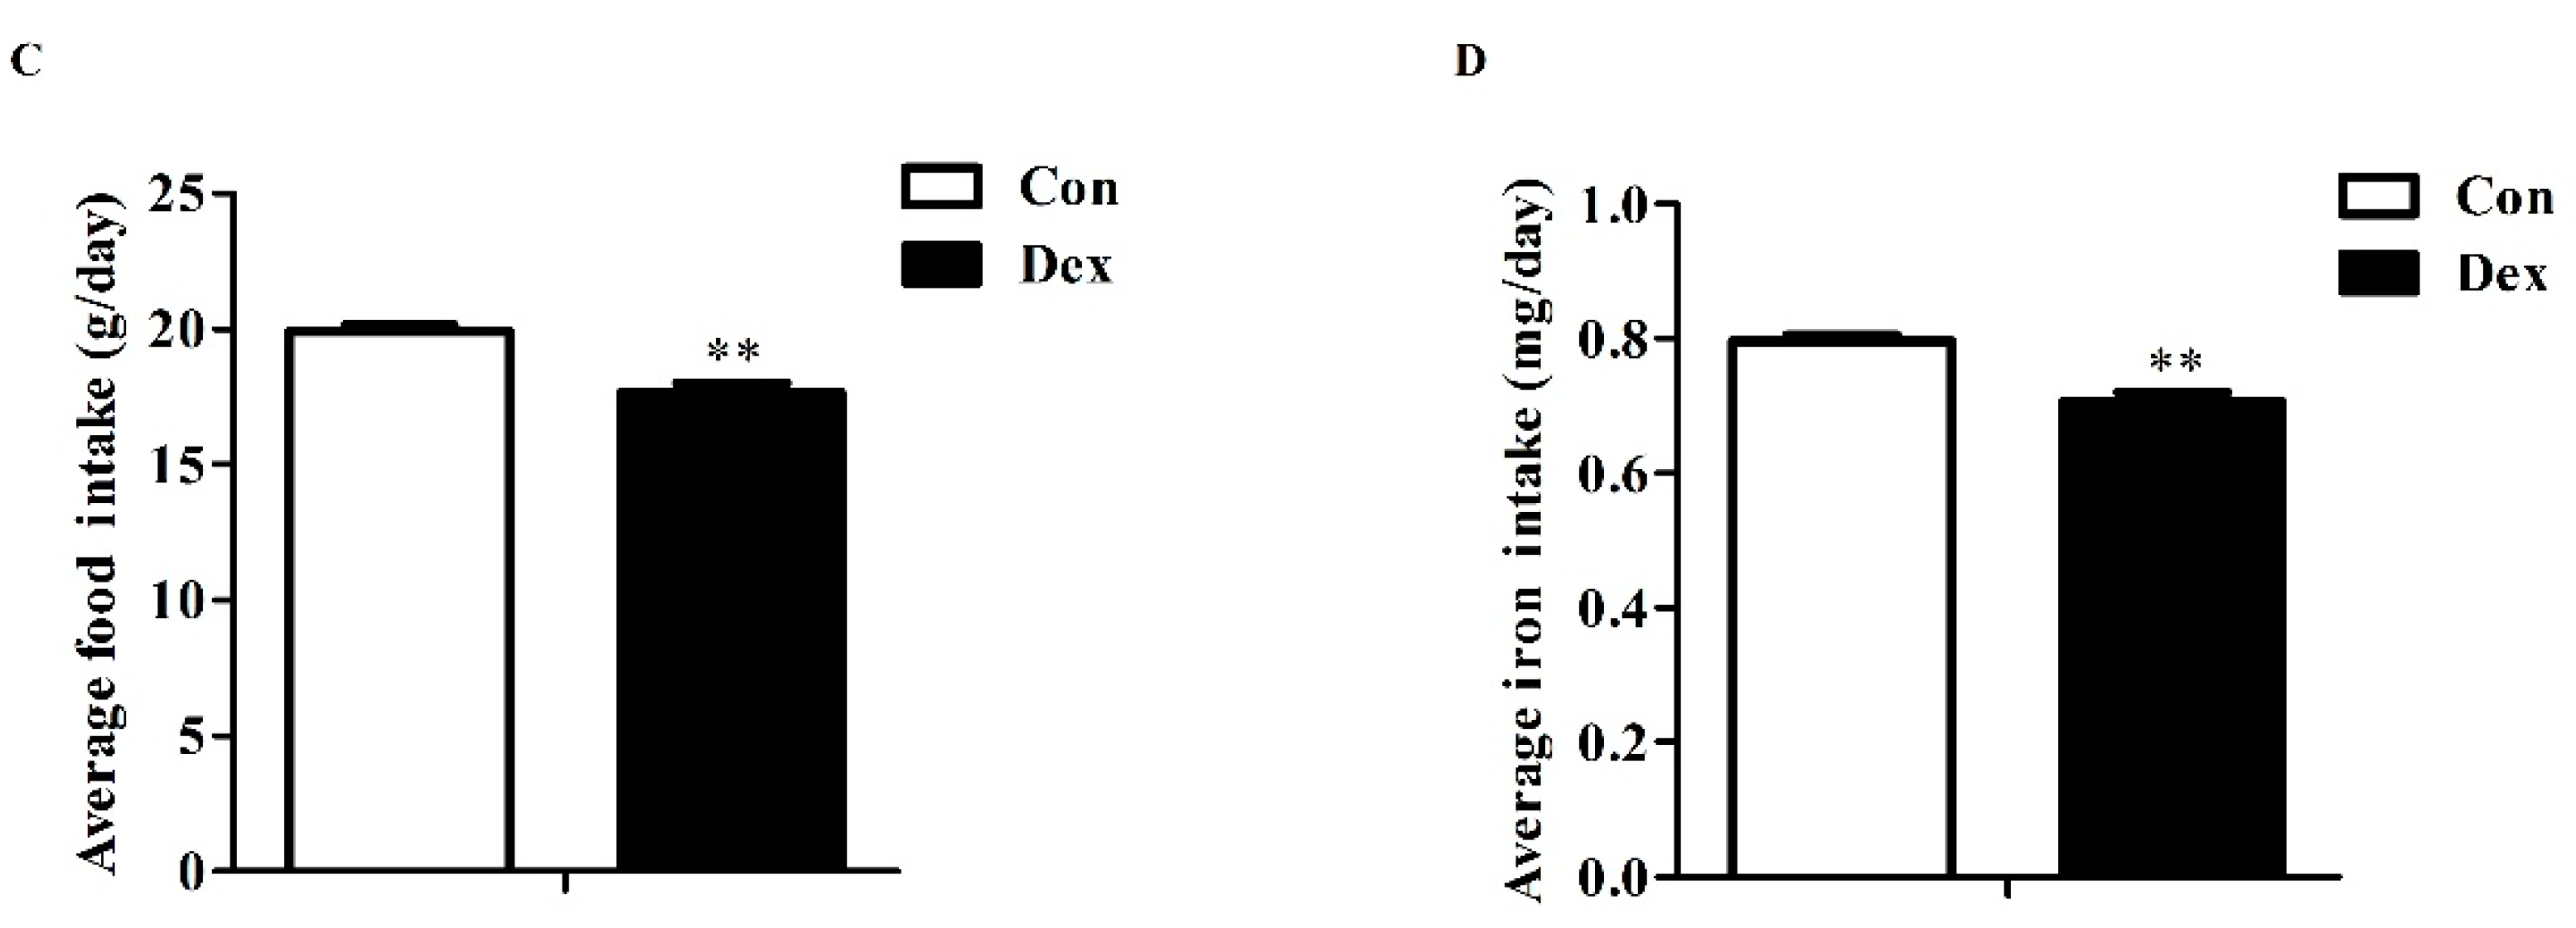
Figure 3.
Dex administration alters the duodenal expression of genes for iron metabolism in rats. (A) Duodenum iron content in the two groups; (B) Comparisons of iron metabolism genes expression in the duodenum between the two groups; (C) Coomassie brilliant blue (CBB) staining confirms equal protein loading of duodenal samples; (D) Western blot bands of duodenal iron-metabolism genes; (E) Duodenal protein expression of iron metabolism-related genes. Definitions: DCYTB, duodenal cytochrome b; DMT1, divalent metal transporter 1; FTH, ferritin heavy chain; FTL, ferritin light chain; FPN, ferroportin. Data are expressed as mean ± SEM, n = 6, different from control, * p < 0.05 and ** p < 0.01.
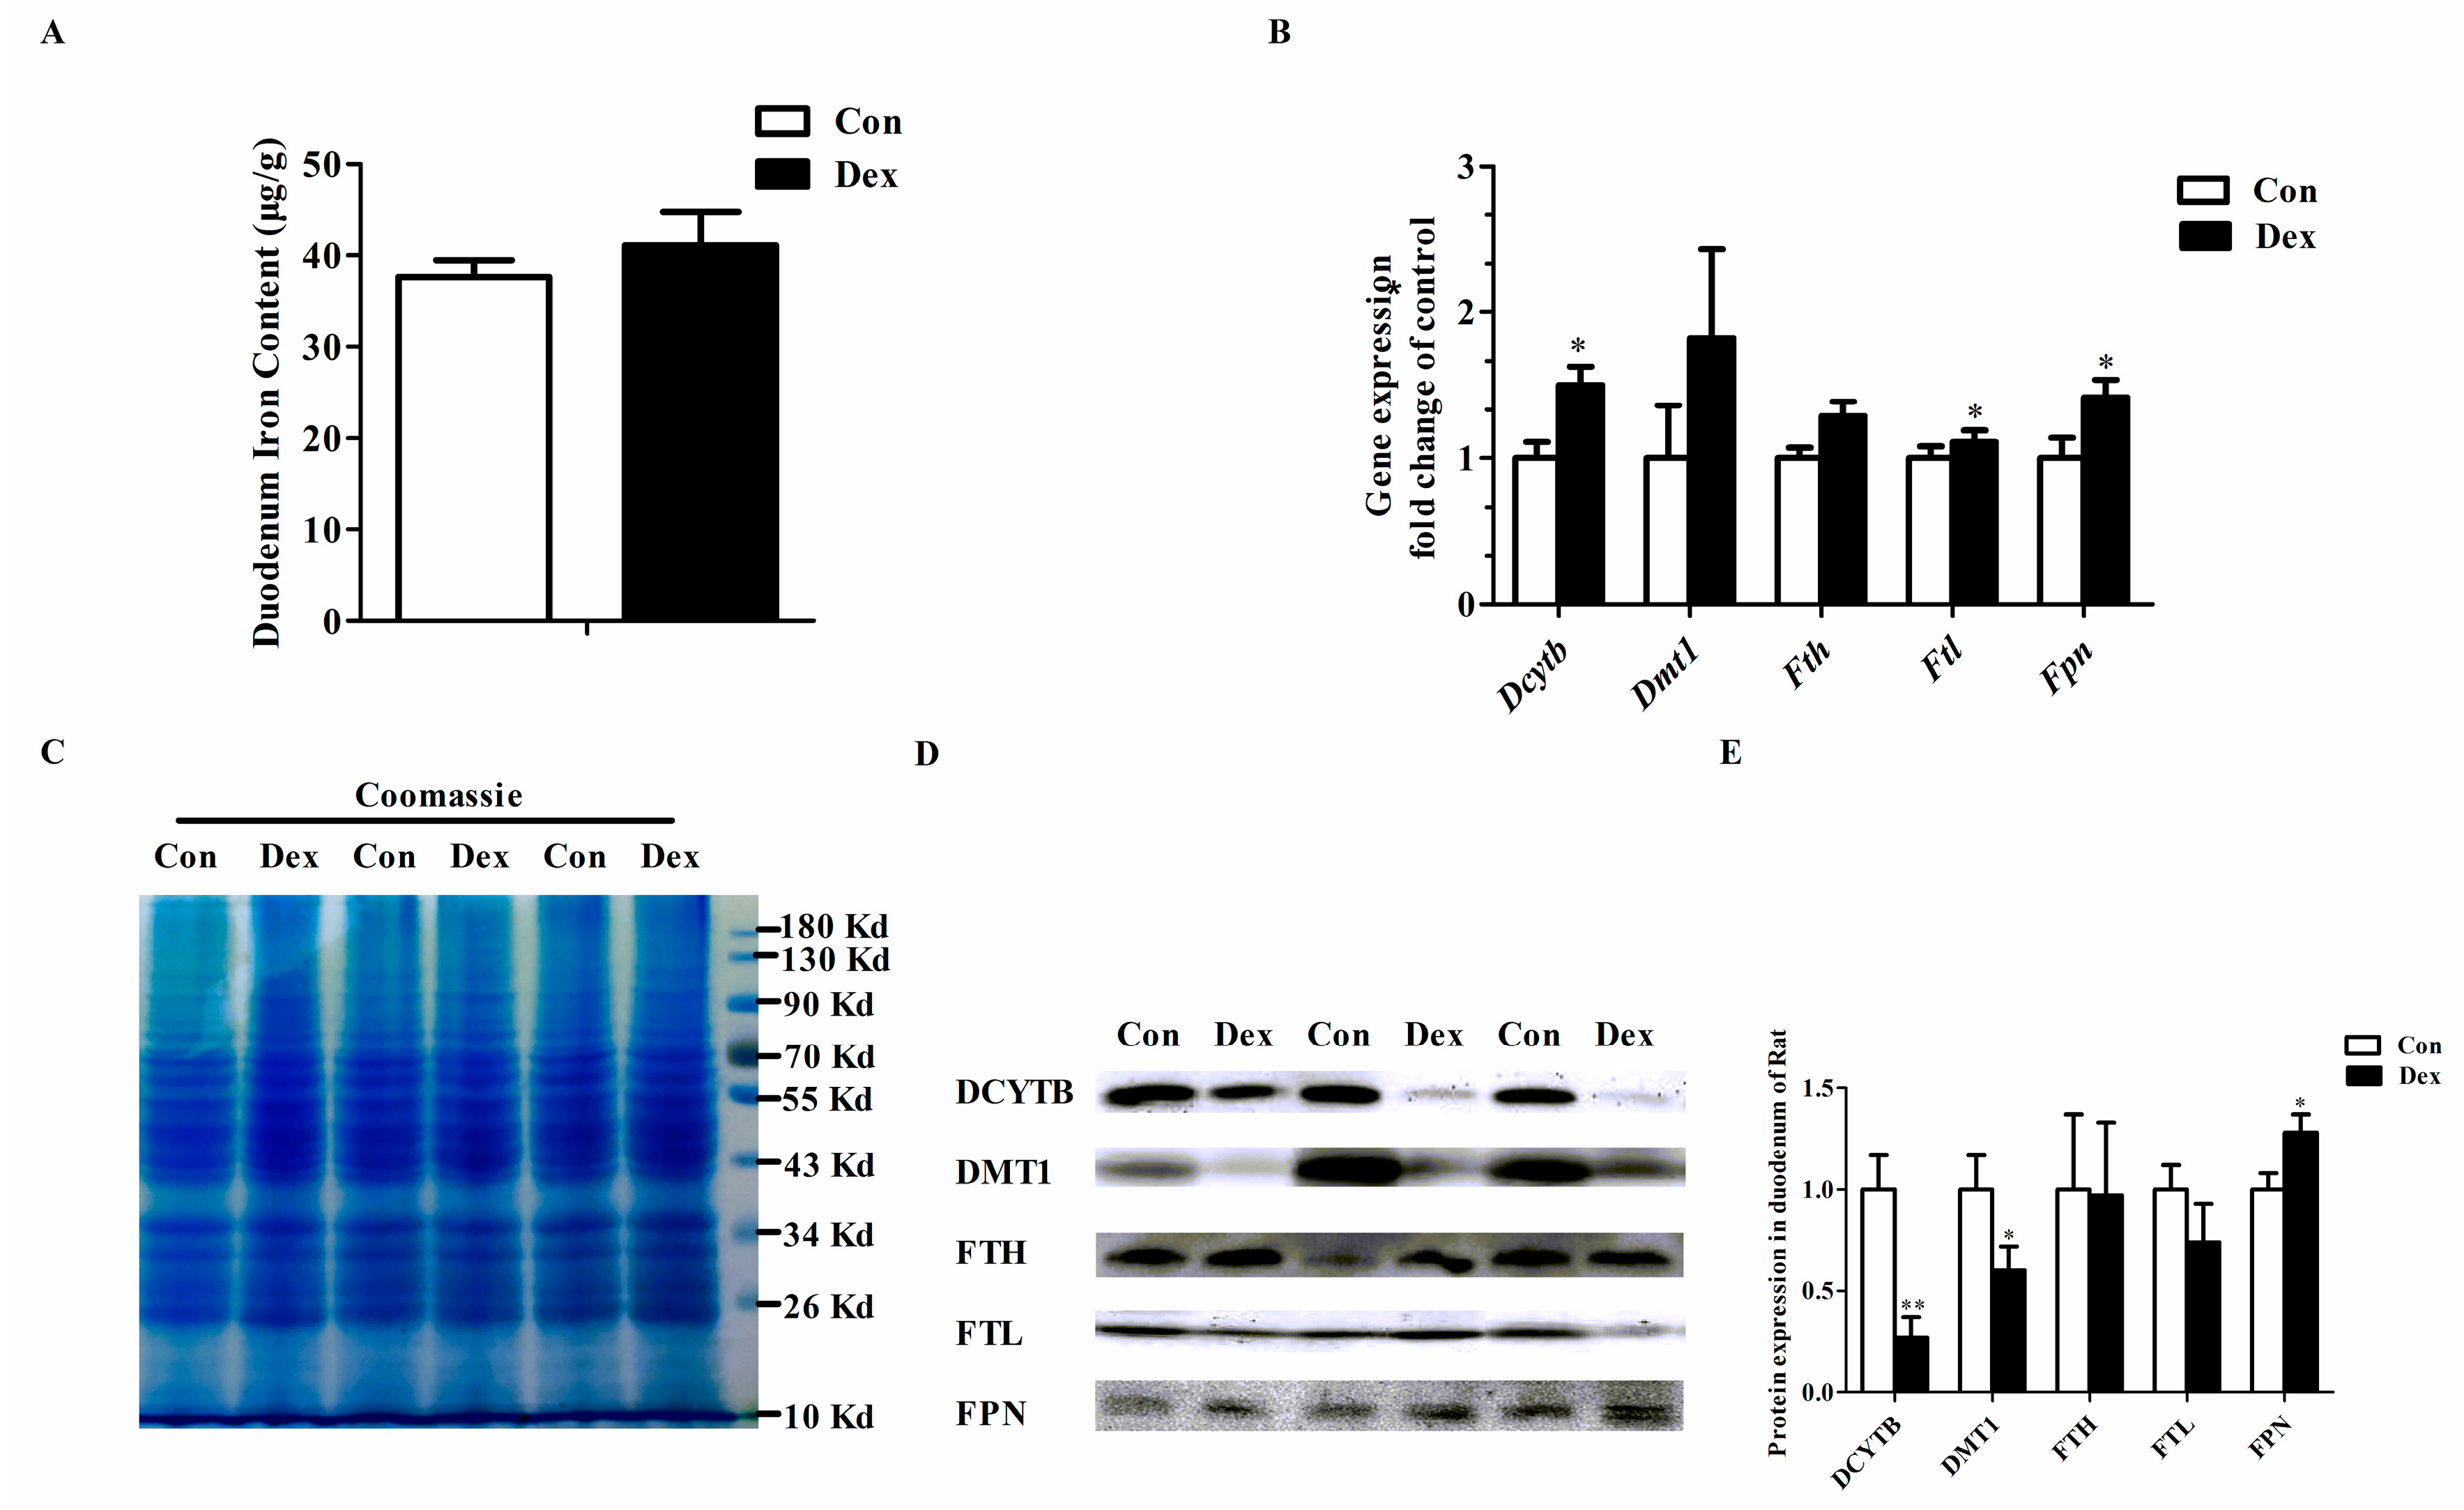
Figure 4.
Effects of Dex administration on iron content and iron metabolism genes expression of the liver in rats. (A) Hepatic iron detection using the Prussian Blue staining. More iron (blue) was revealed in the rat of the control group. Nuclei are stained with fast red, and cytoplasm are stained pale pink; (B) Dex administration reduces hepatic iron content; (C) Effect of long-term Dex exposure on hepatic iron-metabolism genes expression; (D) Western blot bands of hepatic iron-metabolism genes; (E) Hepatic protein expression of iron metabolism-related genes; (F) Dex administration decreases liver hepcidin level. Definitions: TF, transferrin; TFR1, transferrin receptor 1; TFR2, transferrin receptor 2; ZIP14, ZRT/IRT-like protein 14. Data are expressed as mean ± SEM, n = 6, different from control, * p < 0.05, ** p < 0.01 and # p = 0.08.
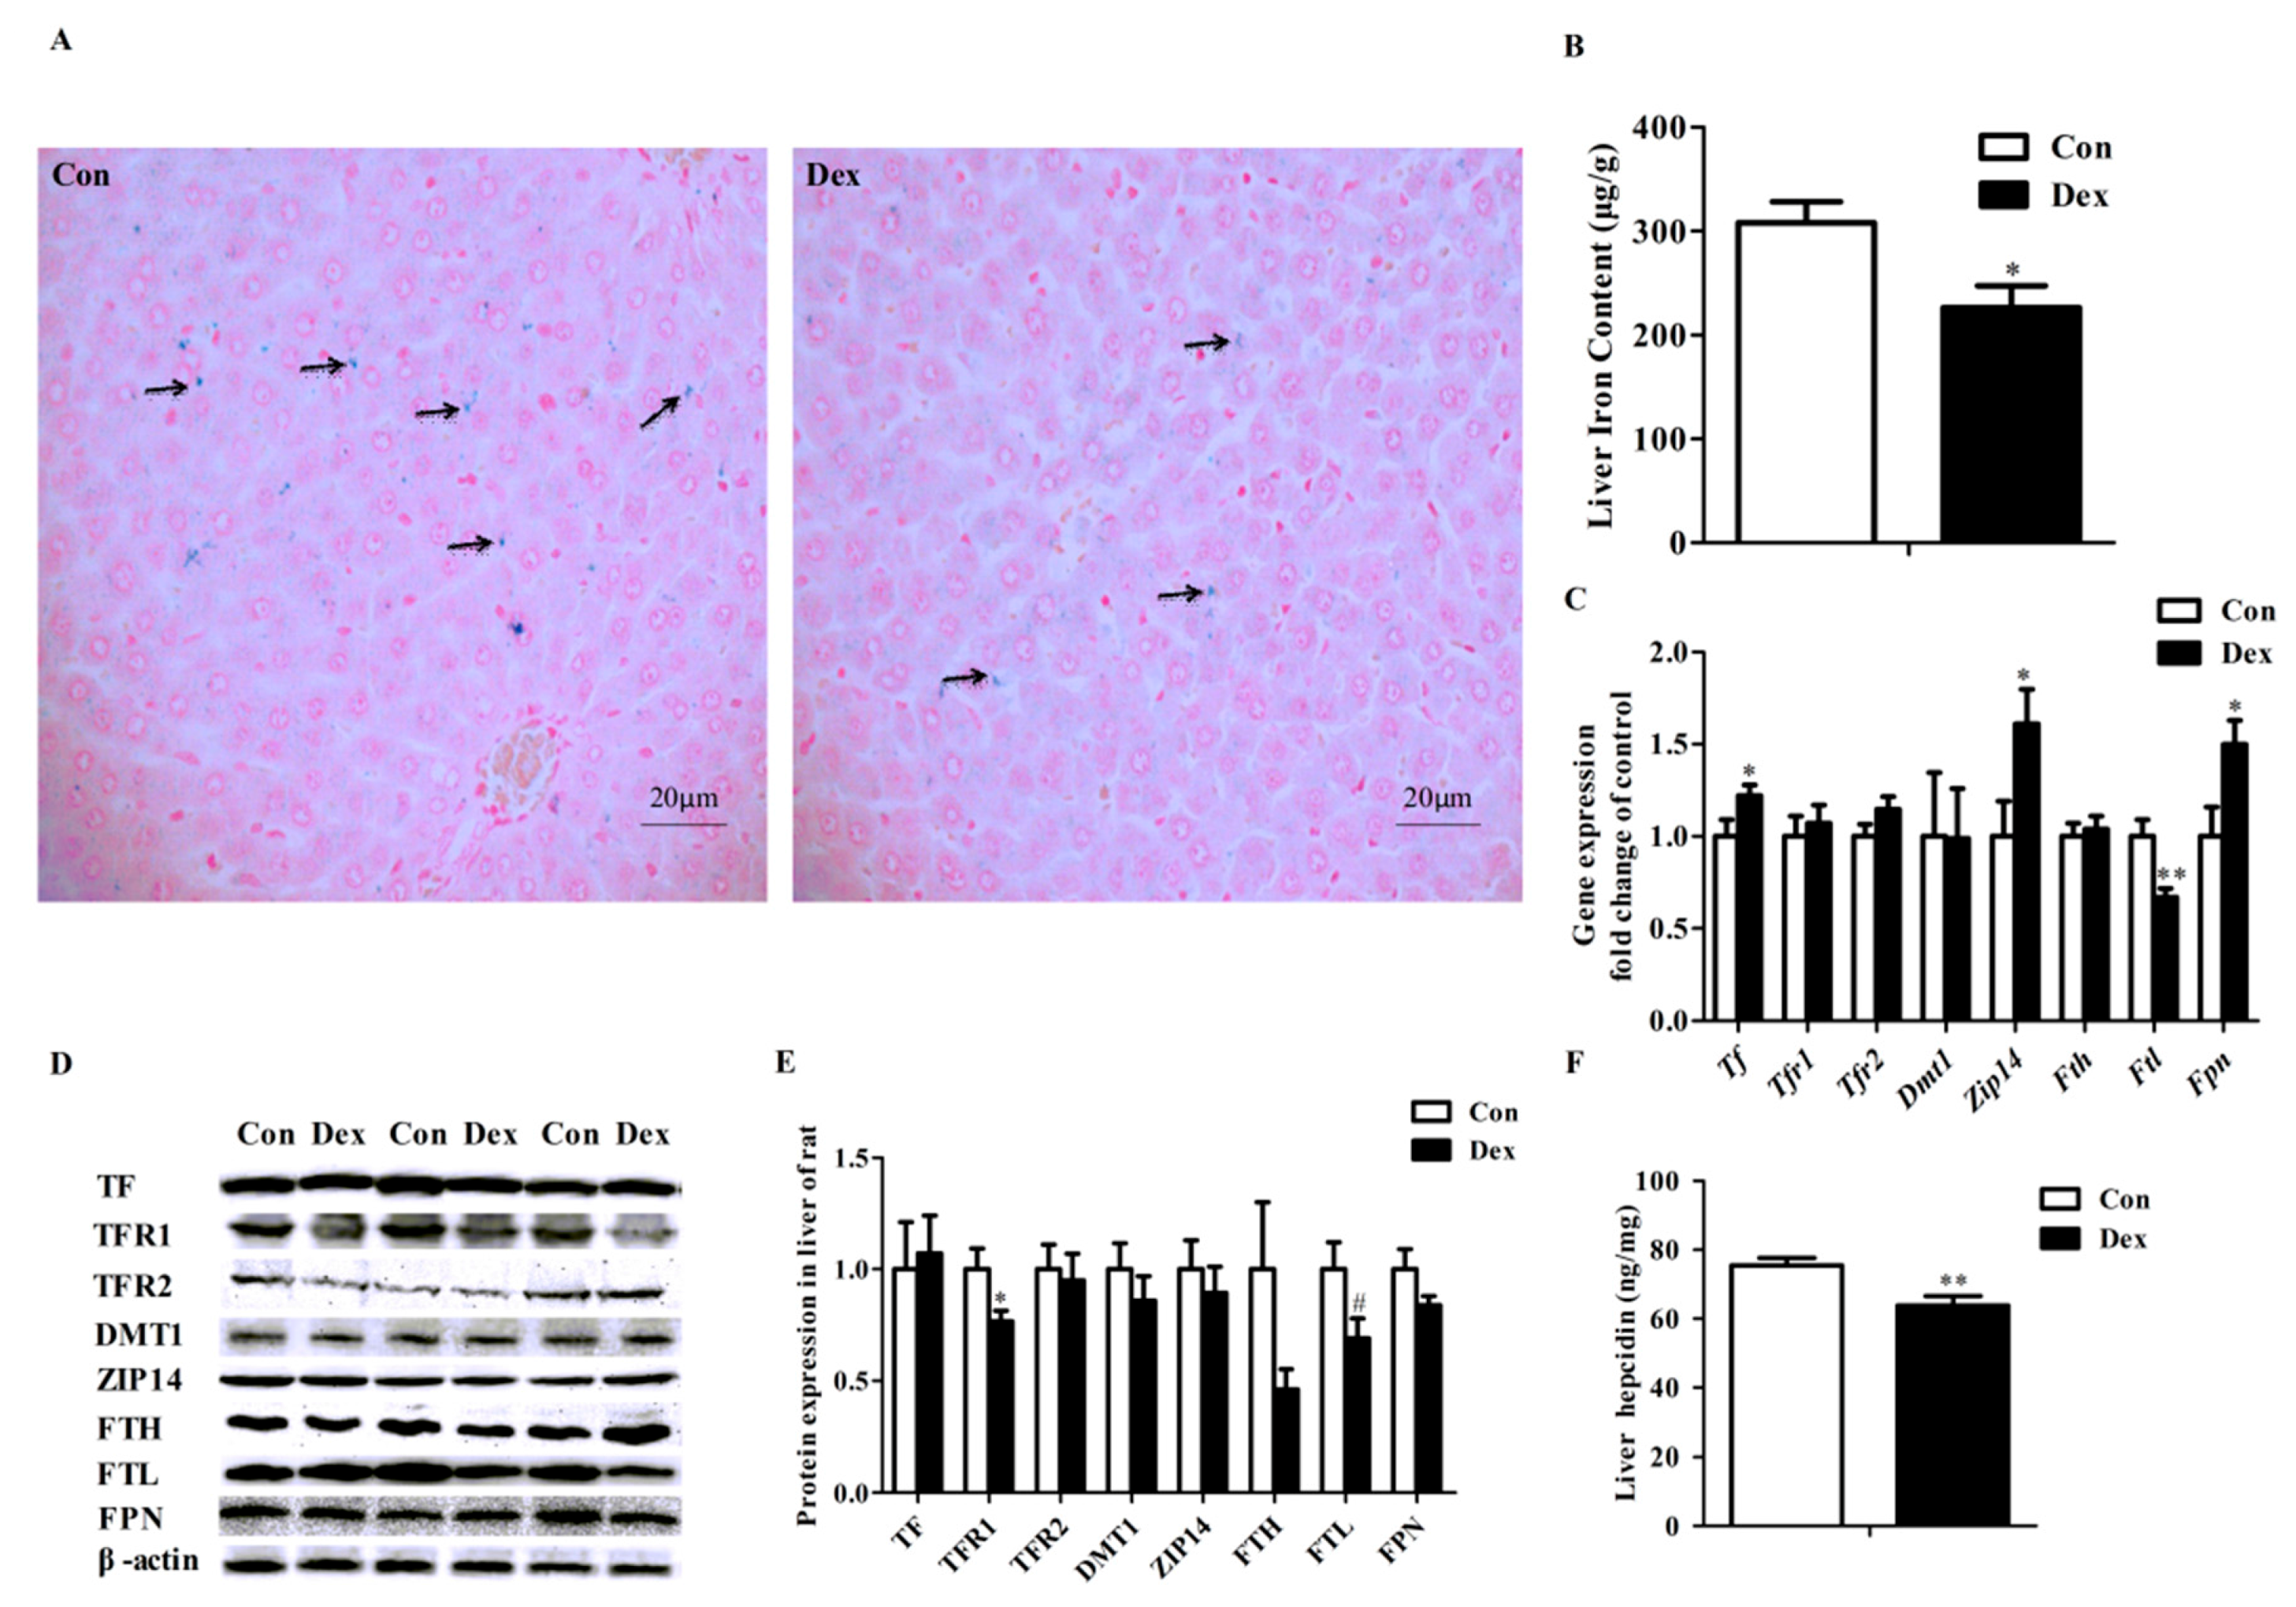
Figure 5.
Effects of Dex administration on IRP1/2 expression and IRP–IRE binding activity of Tfr1 in the liver of rats. (A) Western blot bands and protein expression for STAT5; (B) Hepatic mRNA abundance of Irp1 and Irp2; (C) Western blot bands and protein expression for IRP1 and IRP2; (D) Dex administration increases IRP–IRE binding activity of Tfr1 in the liver of rats. The existence of IRP–IRE binding activity of Tfr1 was observed through RNA electrophoretic mobility shift assay (REMSA). Definitions: IRP1, iron-regulatory protein 1; IRP2, iron-regulatory protein 2; STAT5, Signal transducers and activators of transcription 5. Data are expressed by means ± SEM, n = 6, different from control, ** p < 0.01.

Table 1.
Nucleotide sequences of specific primers.
| Target Genes | Sequences (5′ to 3′) | Products | GenBank No. | |
|---|---|---|---|---|
| Dcytb | F:agacttggacgaggatact | R:ggcagaccaggatatgtg | 104 bp | NM_001011954.1 |
| Dmt1 | F:tcacttggtcctcgttct | R:tcactaacagcctccttatag | 139 bp | NM_013173.2 |
| Fth | F:gtcactactggaacttcaca | R:ttcaggtaatgcgtctcaat | 216 bp | NM_012848.2 |
| Ftl | F:gcagaagccatctcaaga | R:ttccaagaagtcacagagg | 197 bp | NM_022500.4 |
| Fpn | F:aggaaggatgctgtggat | R:tgtcaagaggaggctgtt | 115 bp | NM_133315.2 |
| Tf | F:atcagactccagcatcaac | R:ccaatacacaggtcacaga | 198 bp | NM_001013110.1 |
| Tfr1 | F:cacttacggtcagcactt | R:cacaactcactggacttaga | 114 bp | NM_022712.1 |
| Tfr2 | F:gttggtggttggtgaaga | R:acatagtgcgtgtcagtc | 240 bp | NM_001105916.1 |
| Zip14 | F:ttggaagaagcactgagag | R:ttggaagaagcactgagag | 149 bp | NM_001107275.1 |
| Irp1 | F:cgatgctgtgaagaagttg | R:aatgaacctggatggaatga | 92 bp | NM_017321.1 |
| Irp2 | F:ggcacagattctcatataacc | R:tcacatccaaccacctct | 131 bp | NM_022863.2 |
| Arbp | F:tagagggtgtccgcaatgtg | R:cagtgggaaggtgtagtcagtc | 217 bp | NM_022402.2 |
Note: Dcytb, duodenal cytochrome b; Dmt1, divalent metal transporter 1; Fth, ferritin heavy chain; Ftl, ferritin light chain; Fpn, ferroportin; Tf, transferrin; Tfr1, transferrin receptor 1; Tfr2, transferrin receptor 2; Zip14, ZRT/IRT-like protein 14; Irp1, iron regulatory protein 1; Irp2, iron regulatory protein 2; Arbp, acidic ribosomal phosphoprotein P0.
Table 2.
Administration of Dex on serum iron parameters in rats.
| Parameters | Con | Dex | P-Value |
|---|---|---|---|
| Serum iron (µmol/L) | 45.29 ± 2.12 | 55.09 ± 2.80 | 0.01 |
| UIBC (µmol/L) | 37.19 ± 2.02 | 37.24 ± 4.10 | 0.20 |
| TIBC (µmol/L) | 82.48 ± 2.06 | 92.33 ± 3.44 | 0.20 |
| Transferrin (µg/dL) | 131.40 ± 2.64 | 135.20 ± 3.21 | 0.37 |
| TS (%) | 52.59 ± 2.82 | 60.28 ± 3.53 | 0.11 |
| Ferritin (ng/mL) | 6.85 ± 0.34 | 7.34 ± 0.80 | 0.60 |
| sTfR (nmol/L) | 32.29 ± 8.10 | 135.42 ± 38.96 | 0.03 |
Note: sTfR, souble transferrin receptor; Tf, transferrin; TS, transferrin saturation; TIBC, total iron binding capacity; UIBC, unsaturated iron binding capacity. Data are expressed as mean ± SEM, n = 10.
© 2017 by the authors. Licensee MDPI, Basel, Switzerland. This article is an open access article distributed under the terms and conditions of the Creative Commons Attribution (CC BY) license (http://creativecommons.org/licenses/by/4.0/).
Share and Cite
MDPI and ACS Style
Li, H.; Jiang, S.; Yang, C.; Yang, S.; He, B.; Ma, W.; Zhao, R. Long-Term Dexamethasone Exposure Down-Regulates Hepatic TFR1 and Reduces Liver Iron Concentration in Rats. Nutrients 2017, 9, 617. https://doi.org/10.3390/nu9060617
AMA Style
Li H, Jiang S, Yang C, Yang S, He B, Ma W, Zhao R. Long-Term Dexamethasone Exposure Down-Regulates Hepatic TFR1 and Reduces Liver Iron Concentration in Rats. Nutrients. 2017; 9(6):617. https://doi.org/10.3390/nu9060617
Chicago/Turabian StyleLi, Huifang, Shuxia Jiang, Chun Yang, Shu Yang, Bin He, Wenqiang Ma, and Ruqian Zhao. 2017. "Long-Term Dexamethasone Exposure Down-Regulates Hepatic TFR1 and Reduces Liver Iron Concentration in Rats" Nutrients 9, no. 6: 617. https://doi.org/10.3390/nu9060617
Note that from the first issue of 2016, this journal uses article numbers instead of page numbers. See further details here.