Snacking Quality Is Associated with Secondary School Academic Achievement and the Intention to Enroll in Higher Education: A Cross-Sectional Study in Adolescents from Santiago, Chile

 ,
, 
Abstract
:1. Introduction
2. Materials and Methods
2.1. Study Design and Population
2.2. Nutritional Quality of Snacking at Age 16
2.3. Academic Outcomes
2.4. Weight Status at Age 16
2.5. Physical Activity at Age 16
2.6. Other Covariates Collected in Previous Waves
2.7. Statistical Analysis
3. Results
4. Discussion
4.1. Main Findings
4.2. Implications for Practice
4.3. Limitations and Strengths
5. Conclusions
Acknowledgments
Author Contributions
Conflicts of Interest
References
- Fraser, B. Latin American countries crack down on junk food. Lancet 2013, 382, 385–386. [Google Scholar] [CrossRef]
- Braithwaite, I.; Stewart, A.; Hancox, R.; Beasley, R.; Murphy, R.; Mitchell, E.A. Fast-food consumption and body mass index in children and adolescents: An international cross-sectional study. BMJ Open 2014, 4, e005813. [Google Scholar] [CrossRef] [PubMed]
- Ministerio de Salud. Global School-Based Health Survey (Chile). Available online: http://www.who.int/chp/gshs/2013_Chile_GSHS_fact_sheet.pdf (accessed on 10 October 2016).
- Currie, C.; Zanotti, C.; Morgan, A.; Barnekow, V. Social Determinants of Health and Well-Being among Young People. Health Behaviour in School-Aged Children (HBSC) Study: International Report from the 2009/2010 Survey. WHO Regional Office for Europe: Copenhagen. Available online: http://www.euro.who.int/__data/assets/pdf_file/0003/163857/Social-determinants-of-health-and-well-being-among-young-people.pdf (accessed on 2 November 2016).
- Benton, D. The influence of children’s diet on their cognition and behavior. Eur. J. Nutr. 2008, 47, 25–37. [Google Scholar] [CrossRef] [PubMed]
- Nyaradi, A.; Li, J.; Hickling, S.; Foster, J.; Oddy, W. The role of nutrition in children’s neurocognitive development, from pregnancy through infancy. Front. Hum. Neurosci. 2013, 7, 97. [Google Scholar] [CrossRef] [PubMed]
- Boitard, C.; Cavaroc, A.; Sauvant, J.; Aubert, A.; Castanon, N.; Layé, S.; Ferreira, G. Impairment of hippocampal-dependent memory induced by juvenile high-fat diet intake is associated with enhanced hippocampal inflammation in rats. Brain Behav. Immun. 2014, 40, 9–17. [Google Scholar] [CrossRef] [PubMed]
- Valladolid-Acebes, I.; Fole, A.; Martín, M.; Morales, L.; Cano, M.; Ruiz-Gayo, M.; Del Olmo, N. Spatial memory impairment and changes in hippocampal morphology are triggered by high-fat diets in adolescent mice. Is there a role of leptin? Neurobiol. Learn. Mem. 2013, 106, 18–25. [Google Scholar] [CrossRef] [PubMed]
- Lynch, M. Long-term potentiation and memory. Physiol. Rev. 2004, 84, 87–136. [Google Scholar] [CrossRef] [PubMed]
- Kanoski, S.; Davidson, T. Western diet consumption and cognitive impairment: Links to hippocampal dysfunction and obesity. Physiol. Behav. 2011, 103, 59–68. [Google Scholar] [CrossRef] [PubMed]
- Beilharz, J.; Maniam, J.; Morris, M. Diet-induced cognitive deficits: The role of fat and sugar, potential mechanisms and nutritional interventions. Nutrients 2015, 7, 6719–6738. [Google Scholar] [CrossRef] [PubMed]
- Blankenship, T.; O’Neill, M.; Ross, A.; Bell, M. Working memory and recollection contribute to academic achievement. Learn. Individ. Differ. 2015, 43, 164–169. [Google Scholar] [CrossRef] [PubMed]
- Sigfúsdóttir, I.; Krisjánsson, A.; Allegrante, J. Health behaviours and academic achievement in Icelandic school children. Health Educ. Res. 2007, 22, 70–80. [Google Scholar] [CrossRef] [PubMed]
- Kristjánsson, A.; Sigfúsdóttir, I.; Allegrante, J. Health behavior and academic achievement among adolescents: The relative contribution of dietary habits, physical activity, body mass index, and self-esteem. Health Educ. Behav. 2010, 37, 51–64. [Google Scholar] [CrossRef] [PubMed]
- Øverby, N.; Lüdemann, E.; Høigaard, R. Self-reported learning difficulties and dietary intake in Norwegian adolescents. Scand. J. Public Health 2013, 41, 754–760. [Google Scholar] [CrossRef] [PubMed]
- Feinstein, L.; Sabates, R.; Sorhaindo, A.; Emmett, P. Dietary patterns related to attainment in school: The importance of early eating patterns. J. Epidemiol. Commun. Health 2008, 62, 734–739. [Google Scholar] [CrossRef] [PubMed]
- Correa-Burrows, P.; Burrows, R.; Orellana, Y.; Ivanovic, D. The relationship between unhealthy snacking at school and academic outcomes: A population study in Chilean schoolchildren. Public Health Nutr. 2015, 18, 2022–2030. [Google Scholar] [CrossRef] [PubMed]
- Correa-Burrows, P.; Burrows, R.; Blanco, E.; Reyes, M.; Gahagan, S. Nutritional quality of diet and academic performance in Chilean students. Bull. World Health Org. 2016, 94, 185–192. [Google Scholar] [CrossRef] [PubMed]
- Burrows, T.; Goldman, S.; Pursey, K.; Lim, R. Is there an association between dietary intake and academic achievement? A systematic review. J. Hum. Nutr. Diet. 2016, 30, 117–140. [Google Scholar] [CrossRef] [PubMed]
- Lozoff, B.; Castillo, M.; Clark, K.; Smith, J.; Sturza, J. Iron supplementation in infancy contributes to more adaptive behavior at 10 years of age. J. Nutr. 2014, 144, 838–845. [Google Scholar] [CrossRef] [PubMed]
- Burrows, R.; Díaz, E.; Schiaraffia, V.; Gattas, V.; Montoya, A.; Lera, L. Dietary intake and physical activity in school age children. Rev. Med. Chile 2008, 136, 53–63. [Google Scholar]
- Gattas, V.; Burrows, R.; Burgueño, M. Validity Assessment of A Food Frequency Questionnaire in Chilean School-Age Children. In Proceedings of the XVI Congress of the Latin-American Society of Pediatric Research and the XXII Pan-American Meeting of Pediatrics, Santiago, Chile, 25–30 April 2007. [Google Scholar]
- Ministerio de Salud. Tablas Chilenas de Composición Química de los Alimentos; Ministerio de Salud: Santiago, Chile, 2010.
- Departamento de Evaluación, Medición y Registro Educacional (DEMRE). Prueba de Selección Universitaria. Informe Técnico. Volumen IV. Proceso de Admisión 2016. Unidad de Desarrollo y Análisis. Universidad de Chile. Available online: http://psu.demre.cl/estadisticas/documentos/informes/2016-vol-4-informe-tecnico-admision-2016.pdf (accessed on 19 September 2016).
- De Onis, M.; Onyango, A.; Borghi, E.; Siyam, A.; Nishida, C.; Siekmann, J. Development of a WHO growth reference for school-aged children and adolescents. Bull. World Health Org. 2007, 85, 660–667. [Google Scholar] [CrossRef] [PubMed]
- Correa-Burrows, P.; Burrows, R.; Orellana, Y.; Ivanovic, D. Achievement in mathematics and language is linked to regular physical activity: A population study in Chilean youth. J. Sports Sci. 2014, 32, 1631–1638. [Google Scholar] [CrossRef] [PubMed]
- Burrows, R.; Correa-Burrows, P.; Orellana, Y.; Almagiá, A.; Lizana, P.; Ivanovic, D. Scheduled physical activity is associated with better academic performance in Chilean school-age children. J. Phys. Act. Health 2014, 11, 1600–1606. [Google Scholar] [CrossRef] [PubMed]
- Godard, C.; Rodríguez, M.; Díaz, N.; Lera, L.; Salazar, G.; Burrows, R. Value of a clinical test for assessing physical activity in children. Rev. Med. Chile 2008, 136, 1155–1162. [Google Scholar]
- Dobow, E.; Boxer, P.; Huesmann, L. Long-term effects of parents’ education on children’s educational and occupational success: Mediation by family interactions, child aggression, and teenage aspirations. Merrill Palmer Q. 2009, 55, 224–249. [Google Scholar] [CrossRef] [PubMed]
- United Nations Educational, Scientific and Cultural Organization (UNESCO). International Standard Classification of Education. ISCED 2011. Available online: http://www.uis.unesco.org/Education/Documents/isced-2011-en.pdf (accessed on 19 September 2016).
- Braveman, P.; Cubbin, C.; Egerter, S.; Chideya, S.; Marchi, K.S.; Metzler, M.; Posner, S. Socioeconomic status in health research: One size does not fit all. JAMA 2005, 294, 2879–2888. [Google Scholar] [CrossRef] [PubMed]
- Ginther, D.; Pollak, R. Family structure and children’s educational outcomes: Blended families, stylized facts, and descriptive regressions. Demography 2004, 41, 671–696. [Google Scholar] [CrossRef] [PubMed]
- Hedges, L.; Hedberg, E. Intraclass correlation values for planning group-randomized trials in education. Educ. Eval. Policy Anal. 2007, 29, 60–87. [Google Scholar] [CrossRef]
- Stea, T.; Tortsveit, M. Association of lifestyle habits and academic achievement in Norwegian adolescents: A cross-sectional study. BMC Public Health 2014, 14, 829. [Google Scholar] [CrossRef] [PubMed]
- Fu, M.; Cheng, L.; Tu, S.; Pan, W. Association between unhealthful eating patterns and unfavorable overall school performance in children. J. Am. Diet Assoc. 2007, 107, 1935–1943. [Google Scholar] [CrossRef] [PubMed]
- Øverby, N.; Høigaard, R. Diet and behavioral problems at school in Norwegian adolescents. Food Nutr. Res. 2012, 56. [Google Scholar] [CrossRef] [PubMed]
- Lien, L.; Lien, N.; Heyerdahl, S.; Thoresen, M.; Bjertness, E. Consumption of soft drinks and hyperactivity, mental distress, and conduct problems among adolescents in Oslo, Norway. Am. J. Public Health 2006, 96, 1815–1820. [Google Scholar] [CrossRef] [PubMed]
- Polderman, T.; Boomsma, D.; Bartels, M.; Verhulst, F.; Huizink, A. A systematic review of prospective studies on attention problems and academic achievement. Acta Psychiatr. Scand. 2010, 122, 271–284. [Google Scholar] [CrossRef] [PubMed]
- Boitard, C.; Etchamendy, N.; Sauvant, J.; Ferreira, G. Juvenile but not adult exposure to high fat diet impairs relational memory and hippocampal neurogenesis in mice. Hippocampus 2012, 22, 2095–2100. [Google Scholar] [CrossRef] [PubMed]
- Mellendijk, L.; Wiesmann, M.; Kiliaan, A. Impact of nutrition on cerebral circulation and cognition in the metabolic syndrome. Nutrients 2015, 7, 9416–9439. [Google Scholar] [CrossRef] [PubMed]
- Stranahan, A.; Norman, E.; Lee, K.; Mattson, M. Diet-induced insulin resistance impairs hippocampal synaptic plasticity and cognition in middle-aged rats. Hippocampus 2008, 18, 1085–1088. [Google Scholar] [CrossRef] [PubMed]
- Irving, A.; Harvey, J. Leptin regulation of hippocampal synaptic function in health and disease. Philos. Trans. R. Soc. B Biol. Sci. 2013, 369. [Google Scholar] [CrossRef] [PubMed]
- Lee, S.; Zabolotny, J.; Huang, H.; Lee, H.; Kim, Y. Insulin in the nervous system and the mind: Functions in metabolism, memory, and mood. Mol. Metab. 2016, 5, 589–601. [Google Scholar] [CrossRef] [PubMed]
- Murray, A.; Knight, N.; Cochlin, L.; McAleese, S.; Deacon, R.; Rawlins, J.; Clarke, K. Deterioration of physical performance and cognitive function in rats with short-term high-fat feeding. FASEB J. 2009, 23, 4353–4360. [Google Scholar] [CrossRef] [PubMed]
- Beilharz, J.E.; Maniam, J.; Morris, M.J. Short exposure to a diet rich in both fat and sugar or sugar alone impairs place, but not object recognition memory in rats. Brain Behav. Immun. 2014, 37, 134–141. [Google Scholar] [CrossRef] [PubMed]
- Edwards, L.; Murray, A.; Holloway, C.; Clarke, K. Short-term consumption of a high-fat diet impairs whole-body efficiency and cognitive function in sedentary men. FASEB J. 2011, 25, 1088–1096. [Google Scholar] [CrossRef] [PubMed]
- Attuquayefio, T.; Stevenson, R.; Oaten, M.; Francis, H. A four-day Western-style dietary intervention causes reductions in hippocampal-dependent learning and memory and interoceptive sensitivity. PLoS ONE 2017, 12, e0172645. [Google Scholar] [CrossRef] [PubMed]
- Attuquayefio, T.; Stevenson, R. A systematic review of longer-term dietary interventions on human cognitive function: Emerging patterns and future directions. Appetite 2015, 95, 554–570. [Google Scholar] [CrossRef] [PubMed]
- Nilsson, A.; Tovar, J.; Johansson, M.; Radeborg, K.; Björck, I. A diet based on multiple functional concepts improves cognitive performance in healthy subjects. Nutr. Metab. 2013, 10, 49. [Google Scholar] [CrossRef] [PubMed]
- Smithers, L.; Golley, R.; Mittinty, M.; Lynch, J. Do dietary trajectories between infancy and toddlerhood influence IQ in childhood and adolescence? Results from a prospective birth cohort study. PLoS ONE 2013, 8, e58904. [Google Scholar] [CrossRef] [PubMed]
- Theodore, R.; Thompson, J.; Waldie, K.; Mitchell, E. Dietary patterns and intelligence in early and middle childhood. Intelligence 2009, 37, 506–513. [Google Scholar] [CrossRef]
- Nyaradi, A.; Li, J.; Hickling, S.; Whitehouse, A.; Foster, J.; Oddy, W. Diet in the early years of life influences cognitive outcomes at 10 years: A prospective cohort study. Acta Paediatr. 2013, 102, 1165–1173. [Google Scholar] [CrossRef] [PubMed]
- Ministerio de Salud. Encuesta Nacional de Consumo Alimentario. Informe Final de Resultados. Subsecretaría de Salud Pública; Ministerio de Salud: Santiago de Chile. Available online: web.minsal.cl/sites/default/files/ENCA-INFORME_FINAL.pdf (accessed on 27 January 2017).
- Currie, C.; Van der Sluijs, W.; Whitehead, R.; Currie, D.; Rhodes, G.; Neville, F.; Inchley, J. HBSC 2014 Survey in Scotland National Report. Child and Adolescent Health Research Unit (CAHRU). University of St Andrews: Fife. Available online: www.hbsc.org/news/index.aspx?ni=3272 (accessed on 27 January 2017).
- Kann, L.; Kinchen, S.; Shankil, S.; Zaza, S. Youth risk behavior surveillance. United Sates 2013. MMWR CDC Surveill. Summ. 2014, 63, 29–35. [Google Scholar]
- Spoth, R.; Rohrbach, L.; Greenberg, M.; Hawkins, J. Addressing core challenges for the next generation of type 2 translation research and systems: The translation science to population impact (TSci impact) framework. Prev. Sci. 2013, 14, 319–351. [Google Scholar] [CrossRef] [PubMed]
- Biglan, A. The ultimate goal of prevention and the larger context for translation. Prev. Sci. 2016. [Google Scholar] [CrossRef] [PubMed]
- Bradley, B.; Greene, A. Do health and education agencies in the United States share responsibility for academic achievement and health? A review of 25 years of evidence about the relationship of adolescents’ academic achievement and health behaviors. J. Adolesc. Health 2013, 52, 523–532. [Google Scholar] [PubMed]
- Baker, D.; Leon, J.; Smith-Greenaway, E.; Collins, J.; Movit, M. The education effect on population health: A reassessment. Popul. Dev. Rev. 2011, 37, 307–332. [Google Scholar] [CrossRef] [PubMed]
- Just, D.; Mancino, L.; Wansink, B. Could Behavioral Economics Help Improve Diet Quality for Nutrition Assistance Program Participants? US Department of Agriculture: Washington, DC, USA.
- Kersting, M.; Sichert-Hellert, W.; Vereecken, C.; Sette, S. Food and nutrient intake, nutritional knowledge and diet-related attitudes in European adolescents. Int. J. Obes. 2008, 32, 35–41. [Google Scholar] [CrossRef] [PubMed]
- Centers for Disease Control and Prevention, National Center for Chronic Disease Prevention and Health Promotion. Health and Academic Achievement. Available online: http://www.cdc.gov/healthyschools/health_and_academics/pdf/health-academic-achievement.pdf (accessed on 2 November 2016).
- Organization for Economic Cooperation and Development, Program for International Students Assessment. Programme for International Students Assessment 2012 Results in Focus. What 15-Year-Old Know and What They Can Do with What They Know. Available online: http://www.oecd.org/pisa/keyfindings/pisa-2012-results.htm (accessed on 7 December 2016).
- Casey, B.; Jones, R.; Hare, T. The adolescent brain. Ann. N. Y. Acad. Sci. 2008, 1124, 111–126. [Google Scholar] [CrossRef] [PubMed]
- Pedersen, S.; Grønhøj, A.; Thøgersen, J. Following family or friends. Social norms in adolescent healthy eating. Appetite 2015, 86, 54–60. [Google Scholar] [CrossRef] [PubMed]
- Hakkarainen, A.; Holopainen, L.; Savolainen, H. Mathematical and reading difficulties as predictors of school achievement and transition to secondary education. Scand. J. Educ. Res. 2013, 57, 488–506. [Google Scholar] [CrossRef]
- Ministerio de Educación. Informe de resultados Estudio Nacional Educación Física 2013. Agencia de Calidad de la Educación. Available online: http://archivos.agenciaeducacion.cl/biblioteca_digital_historica/resultados/2013/result8b_edfisica_2013.pdf (accessed on 2 November 2016).


| Variables | Mean or n | SD or Percentage |
|---|---|---|
| Chronological age | ||
| Age (years) | 16.8 | 0.3 |
| In-home snacking | ||
| Healthy | 180 | 26.55 |
| Unhealthy-to-fair | 337 | 49.71 |
| Unhealthy | 161 | 23.74 |
| At-school snacking | ||
| Healthy | 183 | 26.99 |
| Unhealthy-to-fair | 302 | 44.54 |
| Unhealthy | 193 | 28.47 |
| Academic outcomes | ||
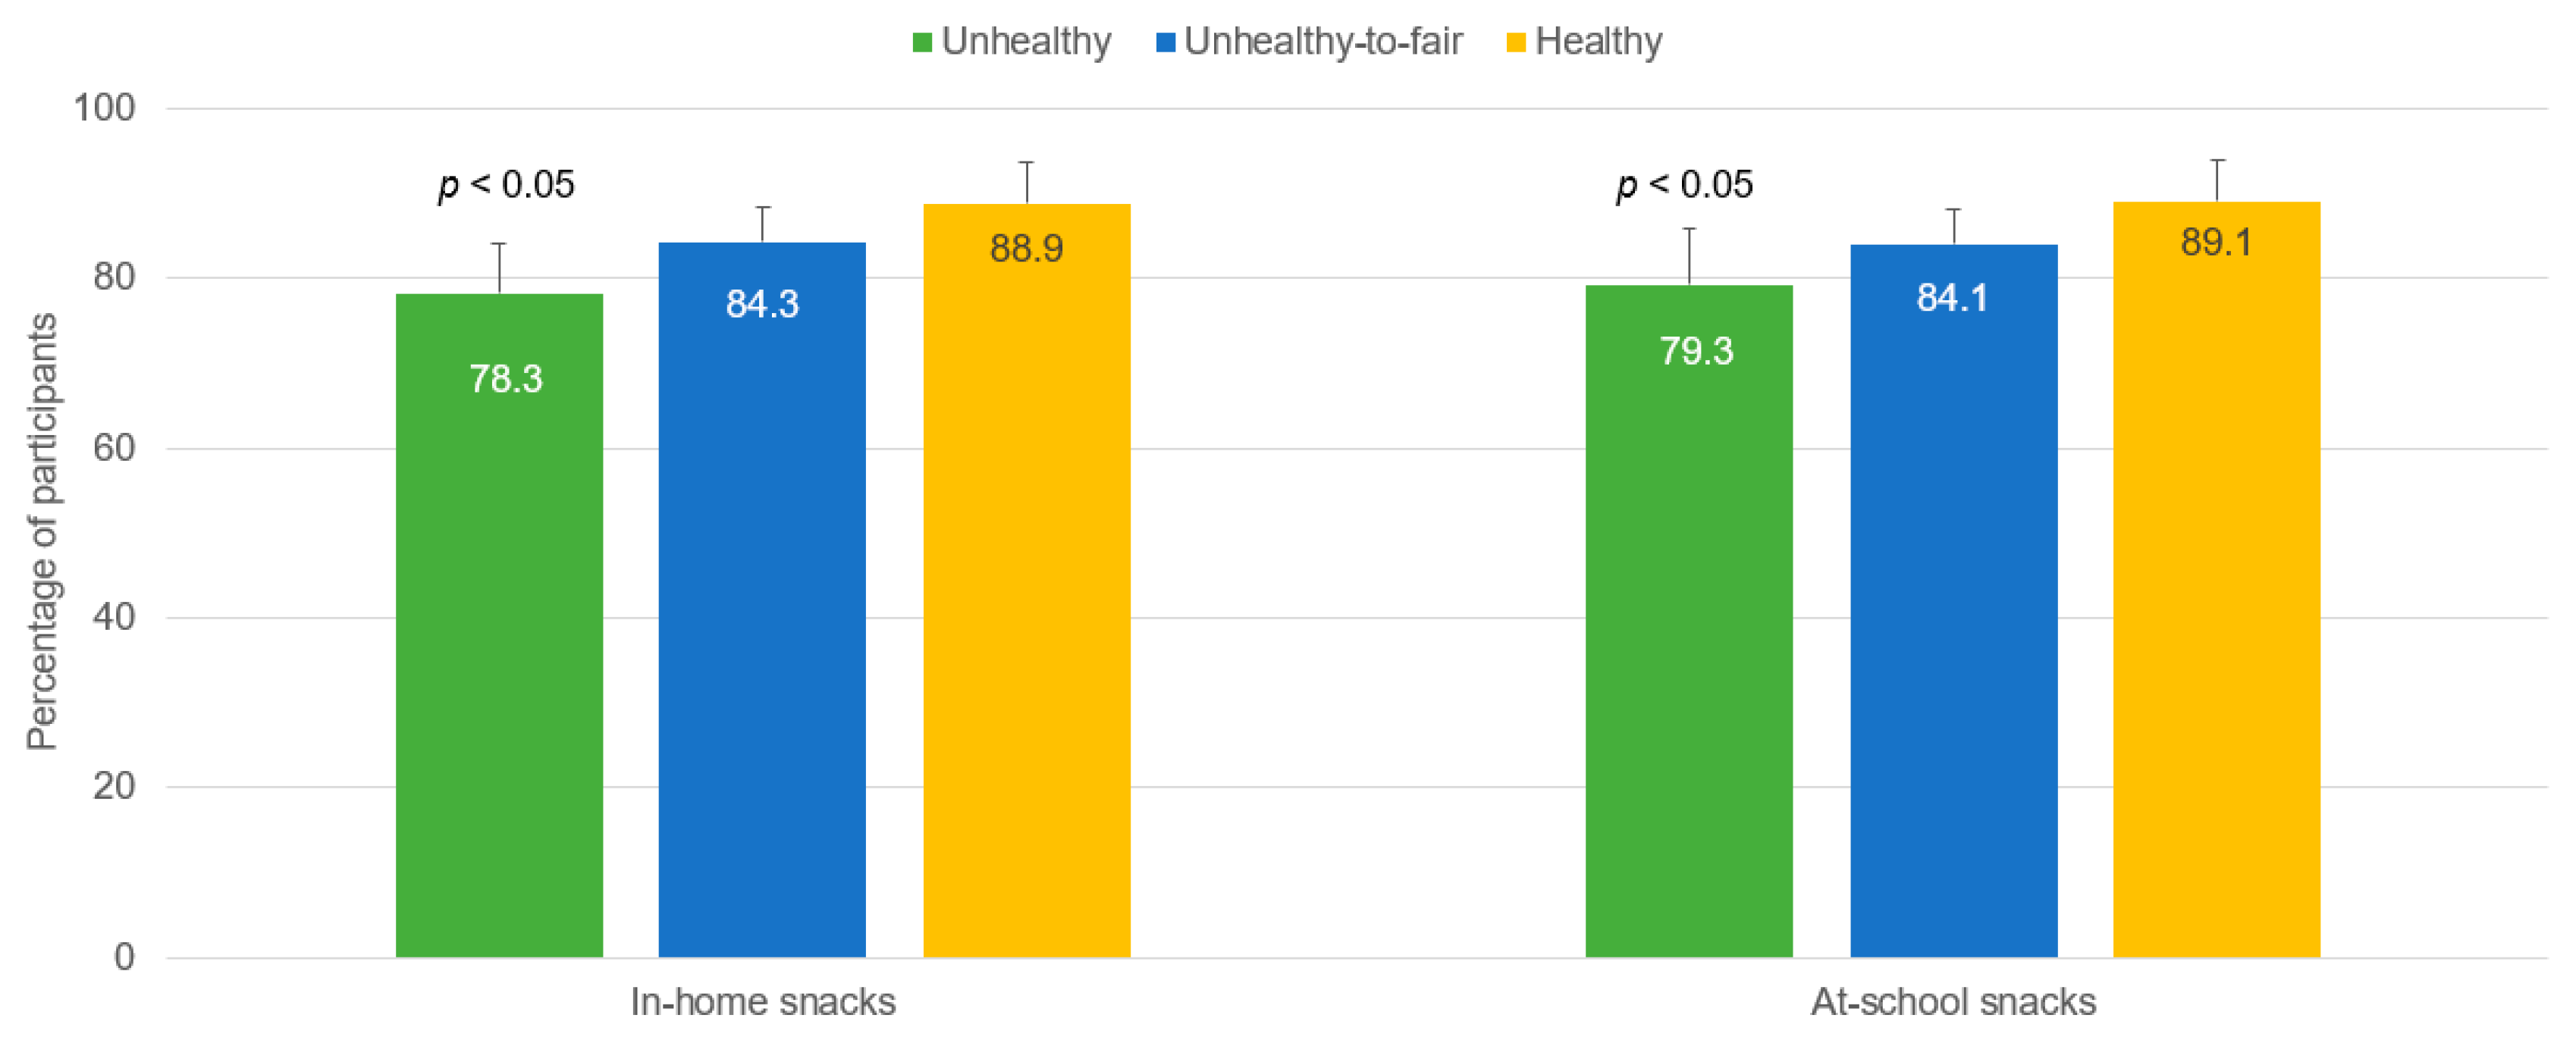
| Graduated high school | 571 | 84.09 |
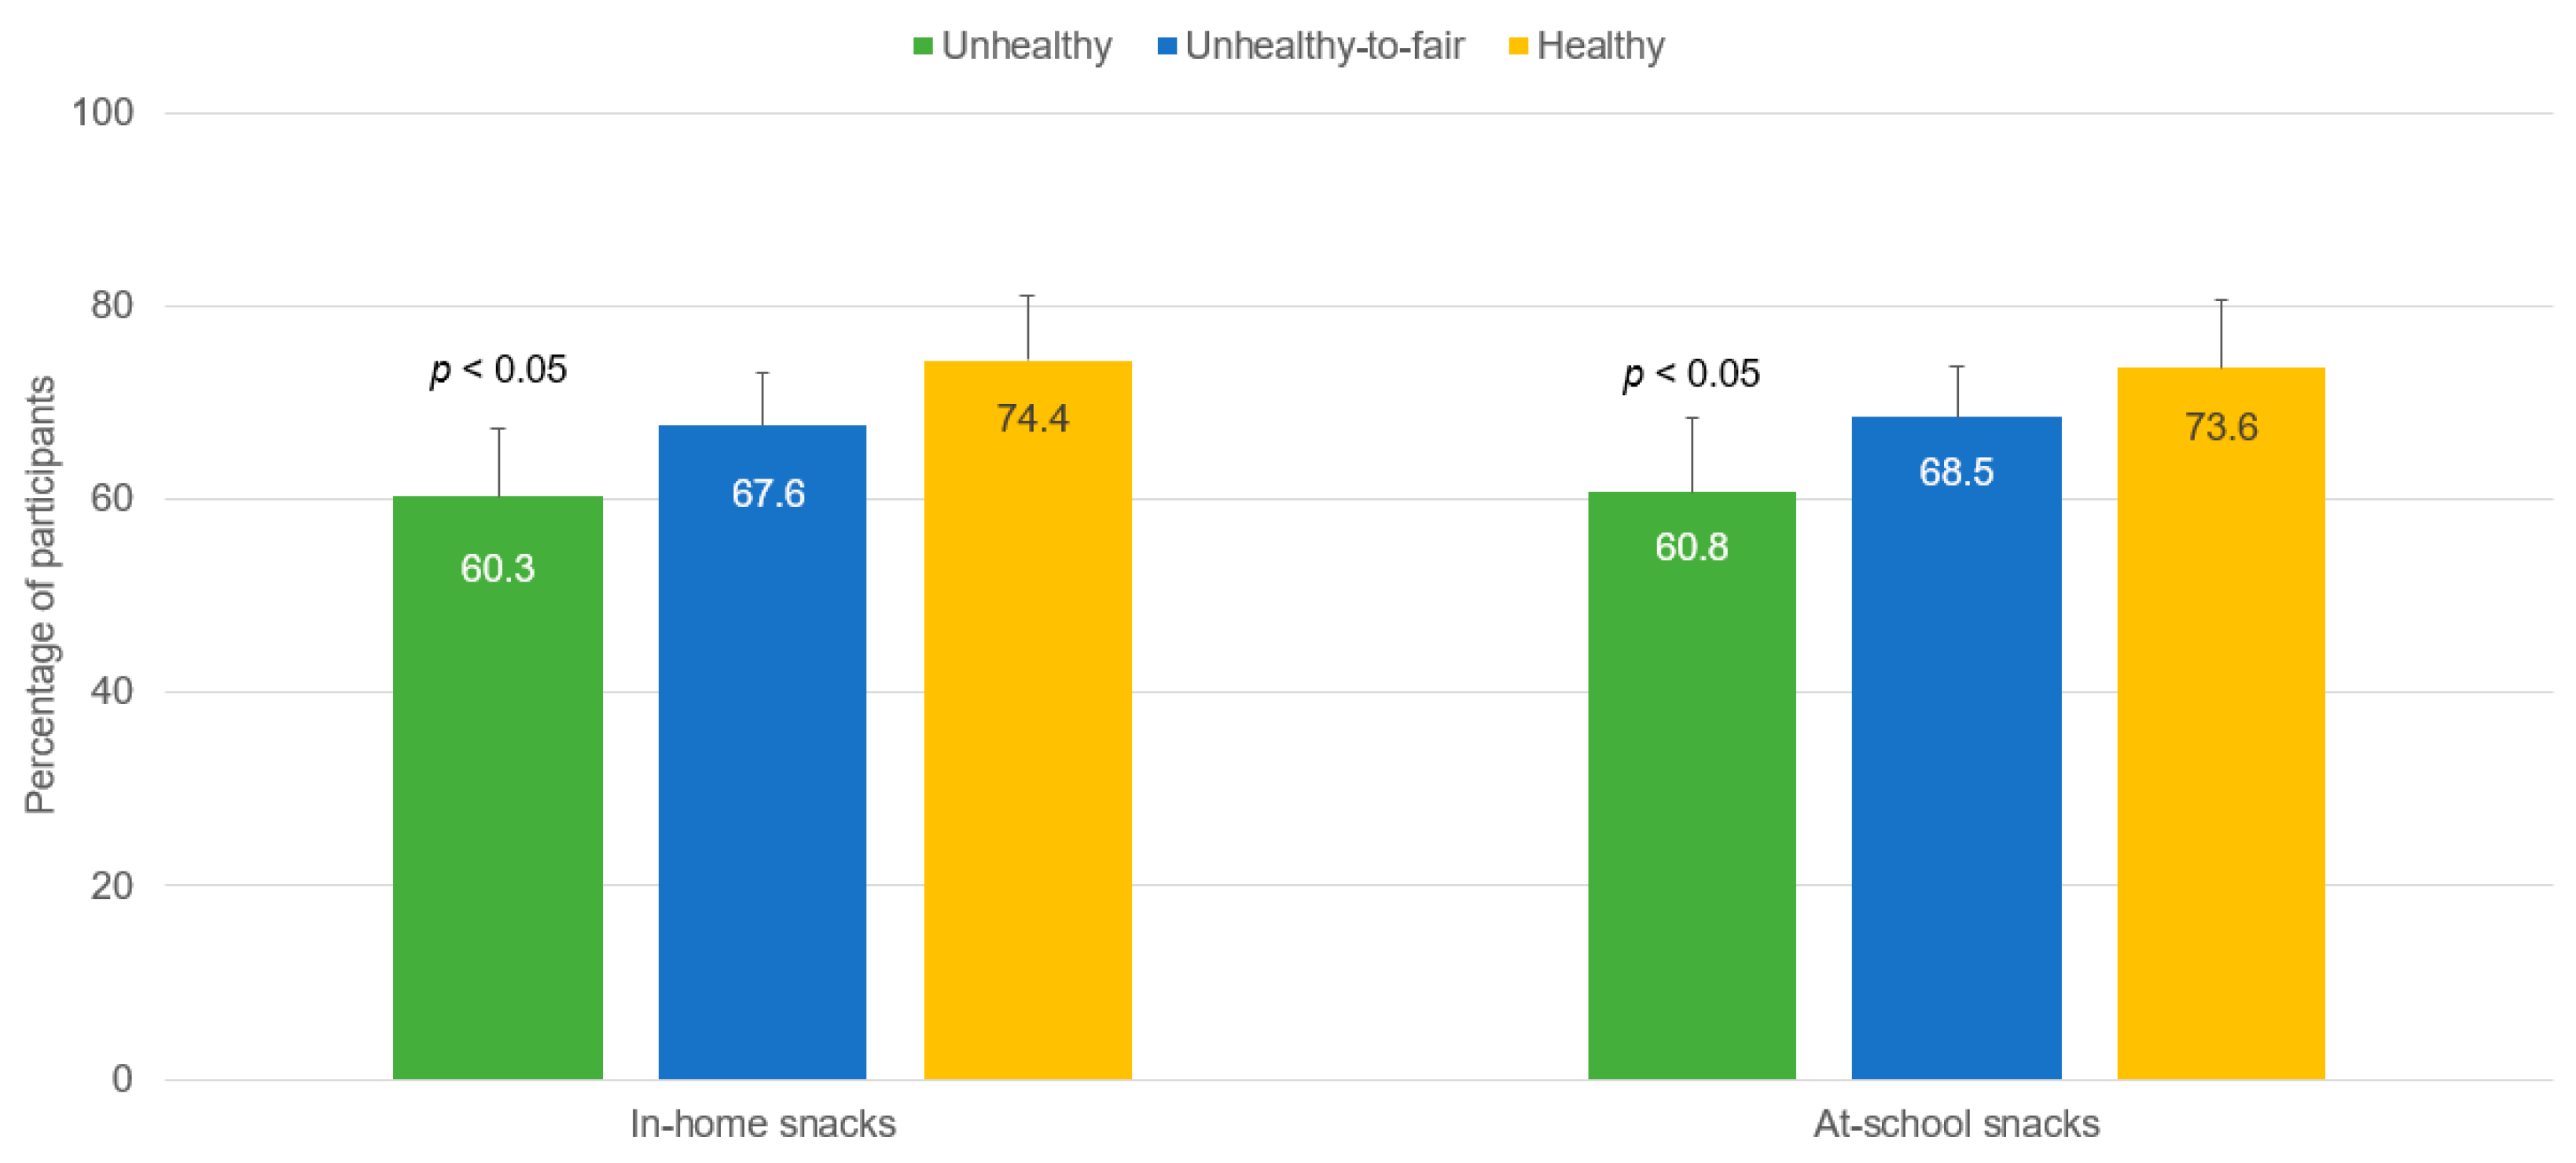
| Took college admission exams * (n = 571) | 387 | 67.76 |
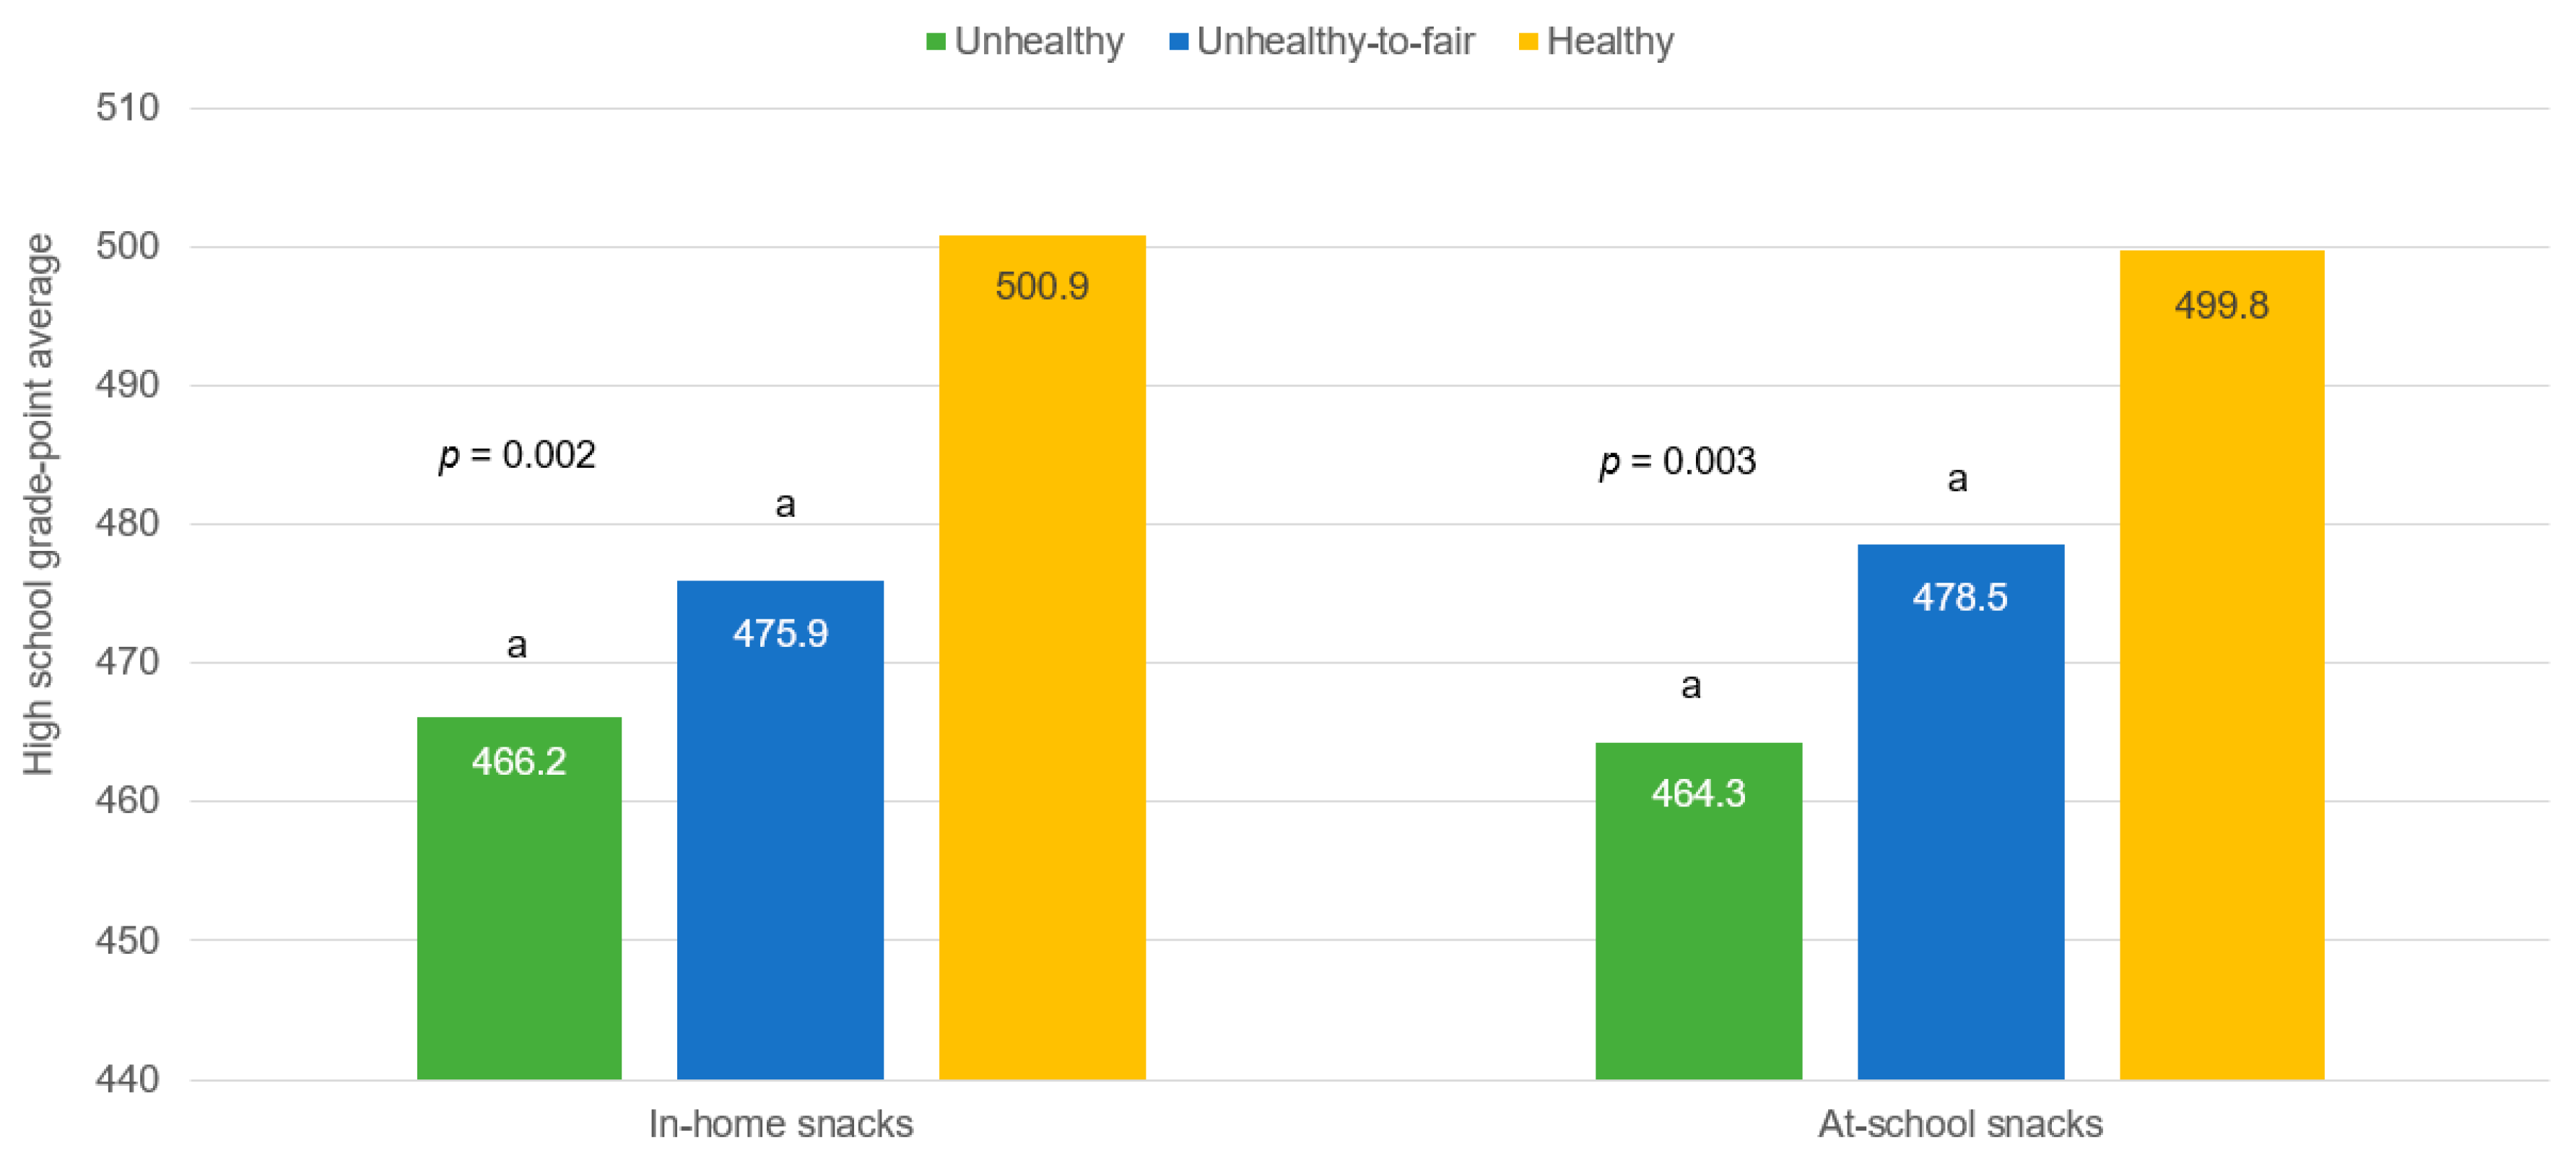
| High school GPA (score) (n = 571) | 481.1 | 92.3 |
| Sex | ||
| Male | 357 | 52.58 |
| Anthropometrics | ||
| BMI (z-score) | 0.65 | 1.2 |
| Weight status | ||
| Normal | 417 | 61.42 |
| Overweight | 167 | 24.59 |
| Obesity | 95 | 14.99 |
| Physical activity | ||
| Weekly scheduled PA ≤ 90 min | 403 | 59.35 |
| Parental education | ||
| Maternal education: incomplete secondary | 240 | 35.40 |
| Paternal education: incomplete secondary | 192 | 28.32 |
| Family structure | ||
| Fatherless family | 274 | 40.4 |
| Iron supplementation in infancy | ||
| No added Fe (6–12 months) | 286 | 42.18 |
| In-Home Snacking | At-School Snacking | |||||||
|---|---|---|---|---|---|---|---|---|
| OR | 95% CI | aOR | 95% CI | OR | 95% CI | aOR | 95% CI | |
| Unhealthy | 0.44 ** | 0.25–0.82 | 0.47 * | 0.25–0.88 | 0.47 * | 0.26–0.83 | 0.49 * | 0.27–0.89 |
| Unhealthy-to-fair | 0.67 | 0.39–1.16 | 0.70 | 0.39–1.24 | 0.65 | 0.37–1.13 | 0.67 | 0.37–1.20 |
| Male | (…) | - | 0.42 *** | 0.27–0.67 | (…) | - | 0.43 *** | 0.27–0.68 |
| Overweight | (…) | - | 0.88 | 0.52–1.46 | (…) | - | 0.89 | 0.53–1.48 |
| Obesity | (…) | - | 0.81 | 0.44–1.49 | (…) | - | 0.81 | 0.44–1.49 |
| Physically inactive | (…) | - | 0.37 *** | 0.22–0.61 | (…) | - | 0.37 *** | 0.22–0.63 |
| Maternal education | (…) | - | 0.66 | 0.42–1.02 | (…) | - | 0.66 | 0.42–1.02 |
| Paternal education | (…) | - | 0.91 | 0.55–1.47 | (…) | - | 0.91 | 0.56–1.48 |
| Fatherless family | (…) | - | 0.77 | 0.51–1.20 | (…) | - | 0.77 | 0.50–1.19 |
| No added Fe | (…) | - | 0.89 | 0.57–1.37 | (…) | - | 0.89 | 0.58–1.38 |
| In-Home Snacking | At-School Snacking | |||||||
|---|---|---|---|---|---|---|---|---|
| OR | 95% CI | aOR | 95% CI | OR | 95% CI | aOR | 95% CI | |
| Unhealthy | 0.46 ** | 0.29–0.71 | 0.53 * | 0.31–0.88 | 0.49 *** | 0.32–0.74 | 0.57 * | 0.35–0.90 |
| Unhealthy-to-fair | 0.68 * | 0.47–0.98 | 0.75 | 0.48–1.15 | 0.71 | 0.49–1.04 | 0.81 | 0.51–1.27 |
| Male | (…) | - | 0.66 * | 0.45–0.96 | (…) | - | 0.66 * | 0.45–0.97 |
| Overweight | (…) | - | 0.99 | 0.64–1.52 | (…) | - | 0.99 | 0.65–1.55 |
| Obesity | (…) | - | 0.97 | 0.56–1.66 | (…) | - | 0.97 | 0.57–1.67 |
| Physically inactive | (…) | - | 0.85 | 0.57–1.25 | (…) | - | 0.84 | 0.57–1.24 |
| Maternal education | (…) | - | 0.63 * | 0.42–0.92 | (…) | - | 0.63 * | 0.42–0.92 |
| Paternal education | (…) | - | 0.75 | 0.49–1.13 | (…) | - | 0.76 | 0.50–1.15 |
| Fatherless family | (…) | - | 0.68 * | 0.48–0.99 | (…) | - | 0.68 * | 0.47–0.98 |
| No added Fe | (…) | - | 0.84 | 0.59–1.21 | (…) | - | 0.84 | 0.58–1.21 |
| In-Home Snacking | At-School Snacking | |||||
|---|---|---|---|---|---|---|
| Mean GPA | Mean | Mean | Mean | SD | ||
| Unhealthy (1) | 490.0 | 473.2 | 473.2 | 90.2 | ||
| Unhealthy-to-fair (2) | 502.2 | 486.8 | 486.8 | 89.3 | ||
| Healthy (3) | 530.1 | 512.4 | 512.4 | 93.6 | ||
| Comparison of mean GPA § | Mean diff. | 95% CI | d ǂ | Mean diff. | 95% CI | d ǂ |
| (1) vs. (2) | −12.2 | −32.7; 4.6 | 0.09 | −13.6 | −33.2; 2.4 | 0.15 |
| (1) vs. (3) | −40.1 *** | −59.2; −16.9 | 0.41 | −39.2 *** | −57.0; −17.1 | 0.44 |
| (2) vs. (3) | −27.9 *** | −43.5; −8.2 | 0.30 | −25.6 * | −40.6; −4.9 | 0.31 |
© 2017 by the authors. Licensee MDPI, Basel, Switzerland. This article is an open access article distributed under the terms and conditions of the Creative Commons Attribution (CC BY) license (http://creativecommons.org/licenses/by/4.0/).
Share and Cite
Correa-Burrows, P.; Rodríguez, Y.; Blanco, E.; Gahagan, S.; Burrows, R. Snacking Quality Is Associated with Secondary School Academic Achievement and the Intention to Enroll in Higher Education: A Cross-Sectional Study in Adolescents from Santiago, Chile. Nutrients 2017, 9, 433. https://doi.org/10.3390/nu9050433
Correa-Burrows P, Rodríguez Y, Blanco E, Gahagan S, Burrows R. Snacking Quality Is Associated with Secondary School Academic Achievement and the Intention to Enroll in Higher Education: A Cross-Sectional Study in Adolescents from Santiago, Chile. Nutrients. 2017; 9(5):433. https://doi.org/10.3390/nu9050433
Chicago/Turabian StyleCorrea-Burrows, Paulina, Yanina Rodríguez, Estela Blanco, Sheila Gahagan, and Raquel Burrows. 2017. "Snacking Quality Is Associated with Secondary School Academic Achievement and the Intention to Enroll in Higher Education: A Cross-Sectional Study in Adolescents from Santiago, Chile" Nutrients 9, no. 5: 433. https://doi.org/10.3390/nu9050433