Nutrient Status of Vitamin D among Chinese Children
by
Shuojia Wang
1, 
Guosong Shen
2,
Shuying Jiang
1,
Hongwei Xu
1,
Minchao Li
1,
Zhaopin Wang
1,
Su Zhang
2 and
Yunxian Yu
1,* 1
Department of Epidemiology & Health Statistics, School of Public Health, School of Medicine, Zhejiang University, 866 Yu-Hang-Tang Road, Xihu District, Hang Zhou 310058, Zhejiang, China
2
Prenatal Diagnostic Center, Huzhou Maternal & Child Care Hospital, Huzhou 313000, Zhejiang, China
*
Author to whom correspondence should be addressed.
Nutrients 2017, 9(4), 319; https://doi.org/10.3390/nu9040319
Submission received: 13 February 2017
/
Revised: 17 March 2017
/
Accepted: 20 March 2017
/
Published: 23 March 2017
Abstract
:Background: Vitamin D deficiency is considered to be a public health problem. However, the nutrient status of vitamin D in Chinese children is unclear. The aim of this study was to describe the vitamin D status among children aged under 18 years in southeast China. Methods: Children who visited the Huzhou Maternal and Child Care Hospital from January 2012 to August 2015 were included in this large cross-sectional study. Serum 25-hydroxyvitamin D (25(OH)D) concentrations were measured by electrochemiluminescence immunoassay. Vitamin D status was defined as deficiency (25(OH)D < 20 ng/mL), insufficiency (25(OH)D: 20–29 ng/mL) and sufficiency (25(OH)D ≥ 30 ng/mL). The association between relevant variables and vitamin D status was analyzed by a using generalized estimated equation model and a multivariate regression model. Results: 13,997 children aged under 18 years were included. Of these, 23.3% children suffered from low vitamin D status (deficiency and insufficiency), while 76.7% had a sufficient vitamin D status. The prevalence of low vitamin D status was 29.7% in winter and 23.4% in spring, which was higher than that in summer (21.4%) and autumn (19.9%). Clinical visiting children (32.1%) suffered more from low vitamin D than health examination children (17.6%). Additionally, age and season were independently and significantly associated with 25(OH)D concentrations, respectively. Conclusions: The deficiency and insufficiency status of vitamin D was very common among newborns and children aged one to 17 years. This indicates that more sunshine and vitamin D–fortified foods are necessary among Chinese children.
1. Introduction
There is growing concern about vitamin D status (serum 25-hydroxyvitamin D (25(OH)D) concentration). Vitamin D deficiency is becoming a public health problem in both developed and developing countries [1,2,3]. It is estimated that more than one billion people have suffered from insufficient vitamin D [4]. Vitamin D deficiency is related to numerous adverse health issues, besides skeletal effects, and various chronic diseases, such as common infections, cancer, autoimmune and cardiovascular diseases, are also related to serum 25(OH)D concentrations. It has been reported that vitamin D deficiency in infancy is suspected to lead to type 1 diabetes in adults [5], and there is a strong association between nutritional rickets and pneumonia [6]. Simultaneously, the prevalence of vitamin D deficiency is associated with metabolic syndromes in children [7]. Therefore, greater attention has been paid to vitamin D status during childhood.
The high prevalence of vitamin D deficiency was reported in northern or southern regions, among adults and children. A recent study in Nepal found over 90% children aged one to five years have vitamin D deficiency (<20 ng/mL) between September and November [8]. A study in the UK suggested that up to 70% of adolescents aged 14.7 to 16.6 years were vitamin D deficient (<12 ng/mL) in May [9]. In the Netherlands, 6.2% of the children aged six years were severely vitamin D deficient (<10 ng/mL), 23.6% were deficient (10–20 ng/mL), and among these children, the prevalence of vitamin D deficiency was higher in African, Asian, Turkish and Moroccan children than that in those of a western ethnic background. The prevalence of vitamin D deficiency was higher in winter (51.3%) than in summer (10.3%) [10]. Nevertheless, vitamin D deficiency is not limited to countries with less sunshine; in countries with plenty of sunshine, such as Greece, 47% of children aged 15–18 years and 14% aged 3–14 years also suffered from vitamin D deficiency (<10 ng/mL) [11]. In China, a large-scale cross-sectional survey in Beijing (40° N Latitude) showed that 45.2% of adolescent girls had plasma 25-hydroxycholecalciferol values less than 5 ng/mL in winter and 6.7% in summer [12]. Another study in Shanghai (31° N latitude) showed that almost one-third newborns had 25-hydroxyvitamin D (25(OH)D) less than 20 ng/mL [13]. Serum 25(OH)D < 20 ng/mL and 25(OH)D < 10 ng/mL occurred in 10.5% and in 1.3% of healthy children under 10 years of age in Nanjing (32° N) from December to March [14]. A study in southeast China found that vitamin D deficiency (<20 ng/mL) and insufficiency (20–29 ng/mL) were prevalent among infants, preschool children, school children and adolescents in Wenzhou [15].
Previous studies have evaluated vitamin D status in young children and adolescents, but most of them focused only on several age groups of children with small sample sizes [13,14,16]. Children's vitamin D status in this region of China has not been studied at the population level. Therefore, the purpose of this study with a large sample size was to describe the vitamin D status among children aged from one day to 17 years in southeast China.
2. Participants and Methods
2.1. Study Population
Huzhou is situated in southeastern China at latitude of 30.86° N and characterized by a subtropical monsoon climate. It has abundant precipitation and plenty of sunshine (1871.73 h/year). According to the Sixth National Population Census, the resident population in Huzhou was 2.89 million; where 11.67% people aged 0 to 14 years old and 72.12% people aged 15 to 59 years old. The economic level of Huzhou is higher than the national average.
The study was a large hospital based cross-sectional study. Children aged less than 18 years visited in Huzhou Maternal and Child Care Hospital from January 2012 to August 2015 were included in this study. From the decoded dataset of the hospital, we extracted the information including age, gender, visiting date, visiting type (defined as ‘health examination’ or ‘clinical visiting’), and concentration of 25(OH)D. The children who went to hospital for health examination or seeking clinical service were defined as health examination and clinical visiting, respectively. The study protocol was approved by the Medical Ethical Committee of Zhejiang University School of Medicine.
2.2. 25-Hydroxyvitamin D Measurement
The 25-hydroxyvitamin D measurement is a routine examination in children’s health examination. First, 2 mL venous blood samples were collected after 8 h fasting. The blood samples were then centrifuged at 3600× g for 3 min. The serum was separated and stored at −80 °C before analysis. Serum 25(OH)D concentrations were measured with Roche Elecsys modular analytics Cobas using an electrochemiluminescence immunoassay (Roche Diagnostics GmbH, Mannheim, Germany). Precision testing showed within-run coefficient of variations (CVs) of ≤7%, within-laboratory CVs of <9.5%, between-laboratory precision CVs of ≤10.1% [17]. Quality Control materials were analyzed every day to test if the measuring value was within analytical measuring range. Standard control was used for adjustment of measuring curve when the batch of reagent was changed.
2.3. Assessment of Vitamin D Status
Circulating 25(OH)D concentration was used for evaluating an individual’s vitamin D status [18]. Vitamin D status, defined as deficiency (25(OH)D < 20 ng/mL), insufficiency (25(OH)D: 20–29 ng/mL) and sufficiency (25(OH)D ≥ 30 ng/mL) respectively, according to the Endocrine Society clinical practice guidelines [19].
2.4. Statistical Analyses
The age variable was categorized into seven groups (zero to three months, four to six months, seven to 12 months, one to three years, four to six years, seven to 10 years, 11–17 years).
The sampling season was defined as: spring (March to May), summer (June to August), autumn (September to November) and winter (December to February).
Mean and standard deviations (mean ± SD) were used to express continuous variables. Frequencies and percentages (%) were reported for the categorical variables. Chi Square test was used to compare the difference in prevalence of vitamin D status (categorical variable) in various groups. Continuous variables were compared using analysis of variance (ANOVA). Meanwhile, generalized estimated equation modeling was used to detect the association of gender, season, age and visiting type with serum 25(OH)D concentrations considering repeated measurements. Multinomial logistic regression analysis was performed for those variables with vitamin D status (sufficient (>30 ng/mL), insufficient (20–30 ng/mL) and deficient (<20 ng/mL)). In order to compare the difference in vitamin D status between children of health examination and clinical visiting, and also to compare their results with the overall population, we repeated multiple regression models after stratifying by visiting type. Considering the effects of gender, season, age and visiting type on vitamin D status, all four variables included in the same models. Additionally, the figures were generated using the 25(OH)D concentration/percentage of low vitamin D respectively, for age groups stratified by gender, visiting type and season. All statistical analyses were performed by using the program package SAS version 9.4 (Institute, Inc., Cary, NC, USA). The p less than 0.05 was considered as statistically significant difference.
3. Results
A total of 13,997 children aged one day to 17 years were included in this study, including 7739 boys and 6258 girls. Of them, 8499 went to the hospital for a health examination, while 5498 for were there for a clinical visit. Overall, 23.28% children suffered from low vitamin D status (<30 ng/mL), while 6.43% had vitamin D deficiency (<20 ng/mL). When children were greater than one year old, the prevalence of vitamin D insufficiency and deficiency increased sharply with age.
3.1. Age and Serum Vitamin D Status
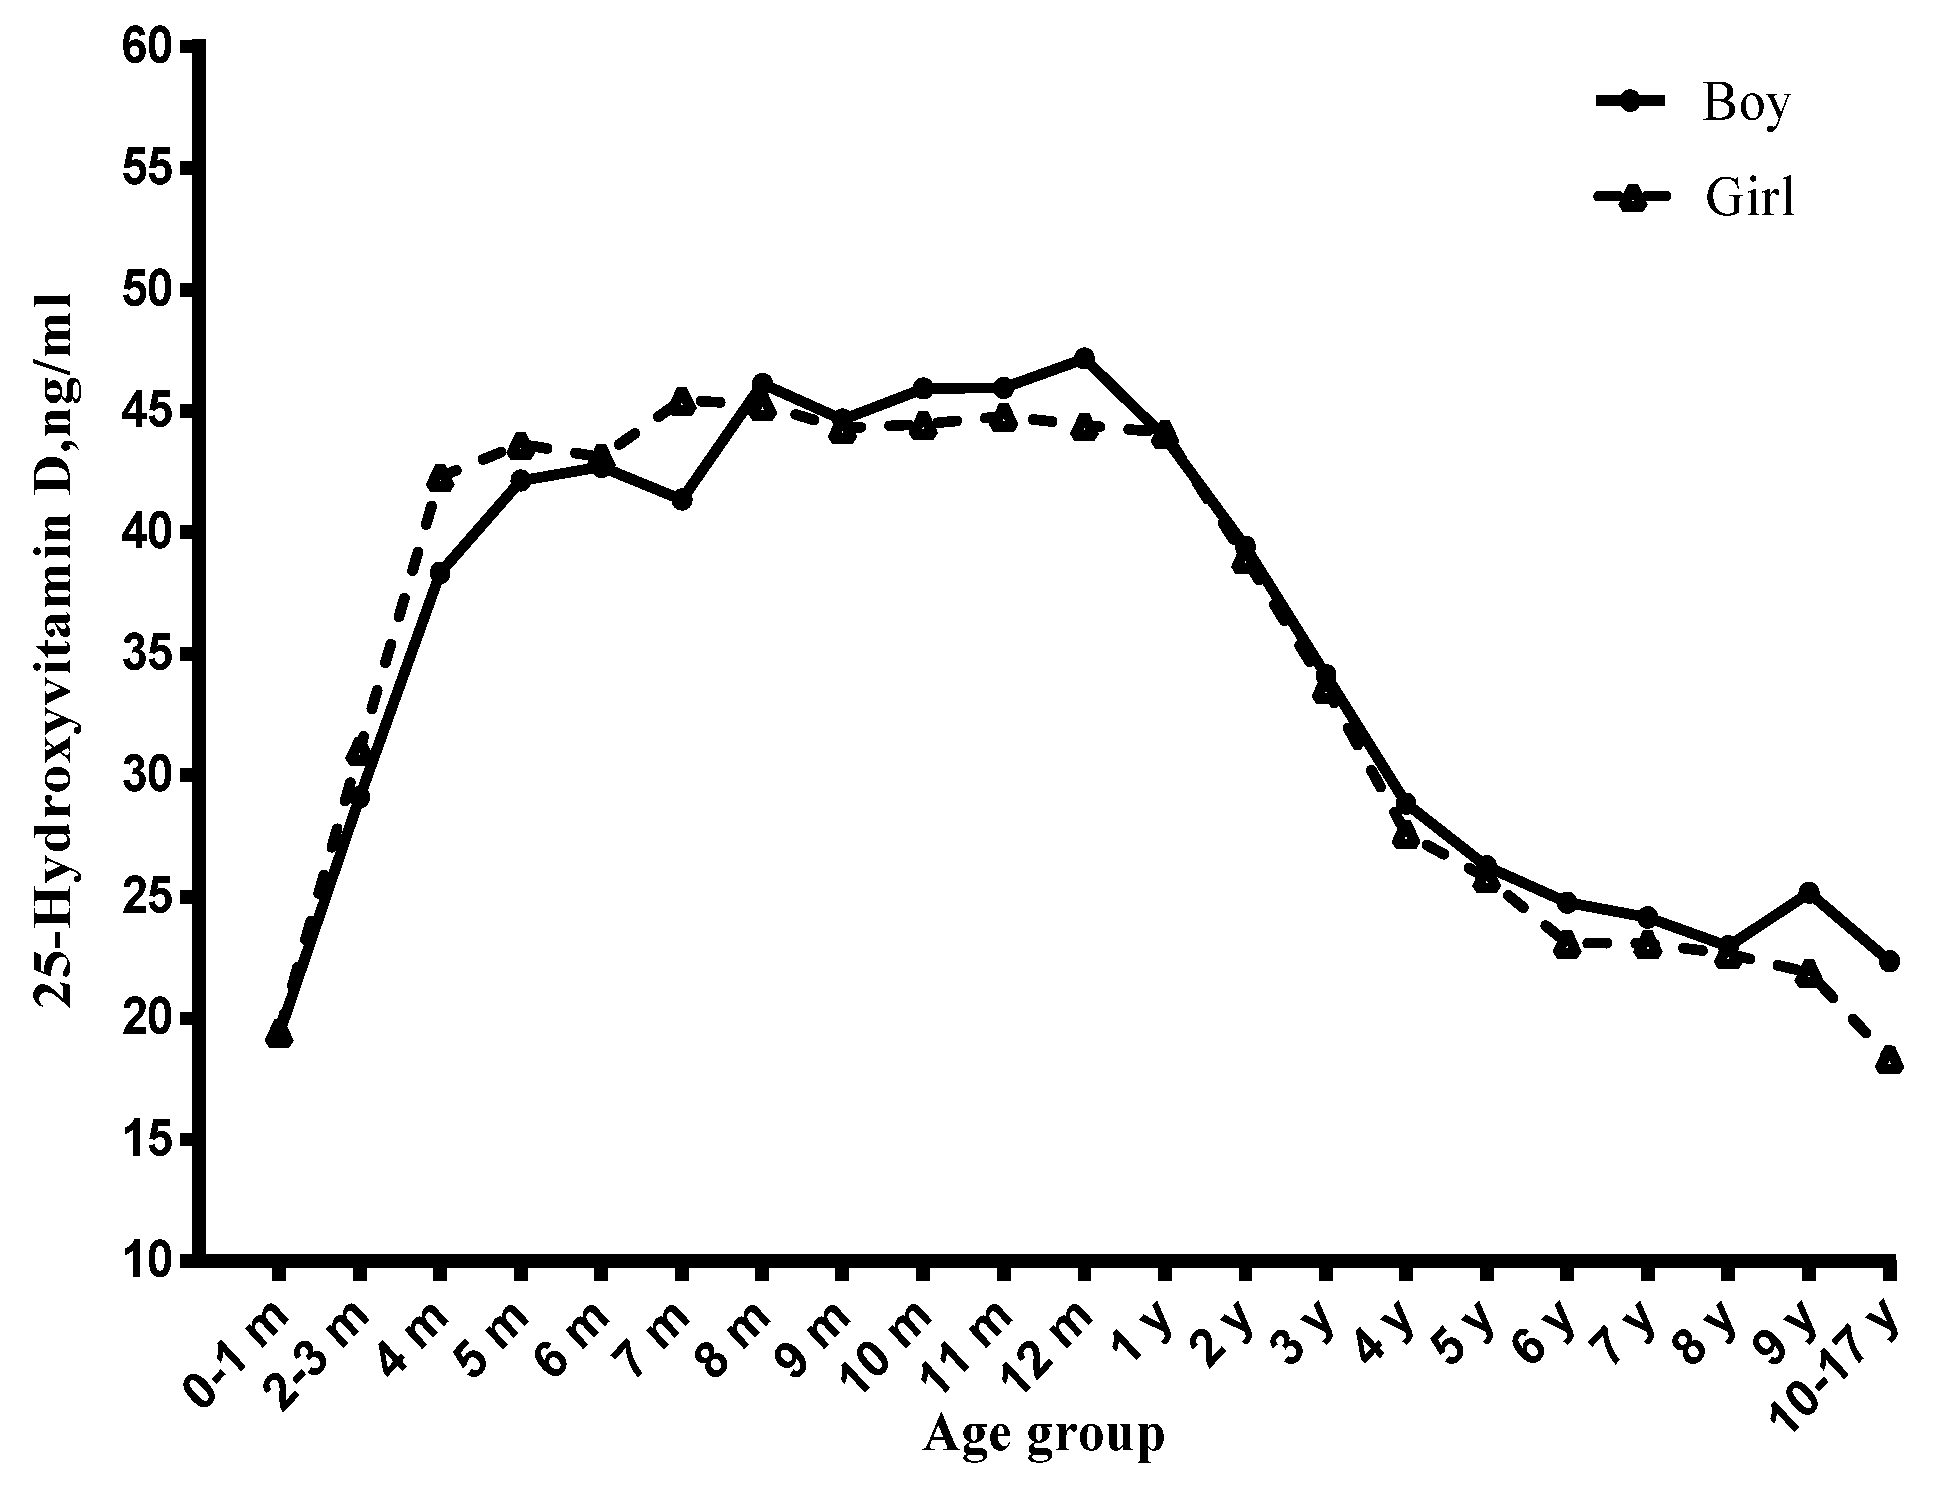
Among children, the vitamin D status significantly varied with age (Figure 1, Figure 2 and Figure 3). Before six months, serum 25(OH)D concentrations significantly increased with the age month, and reached a peak at six months. From six to 12 months, the serum 25(OH)D concentrations stayed at the peak level. However, from one year to 17 years, it decreased continuously and significantly with age. Compared with newborn children, children aged four to six years, seven to 10 years and 11~17 years had lower serum 25(OH)D concentrations and had a higher risk of vitamin D deficiency (Table 1), especially in the 11–17 years group (OR = 14.61, 95% CI: 6.41–33.27) (Table 2).
3.2. Season and Serum Vitamin D Status
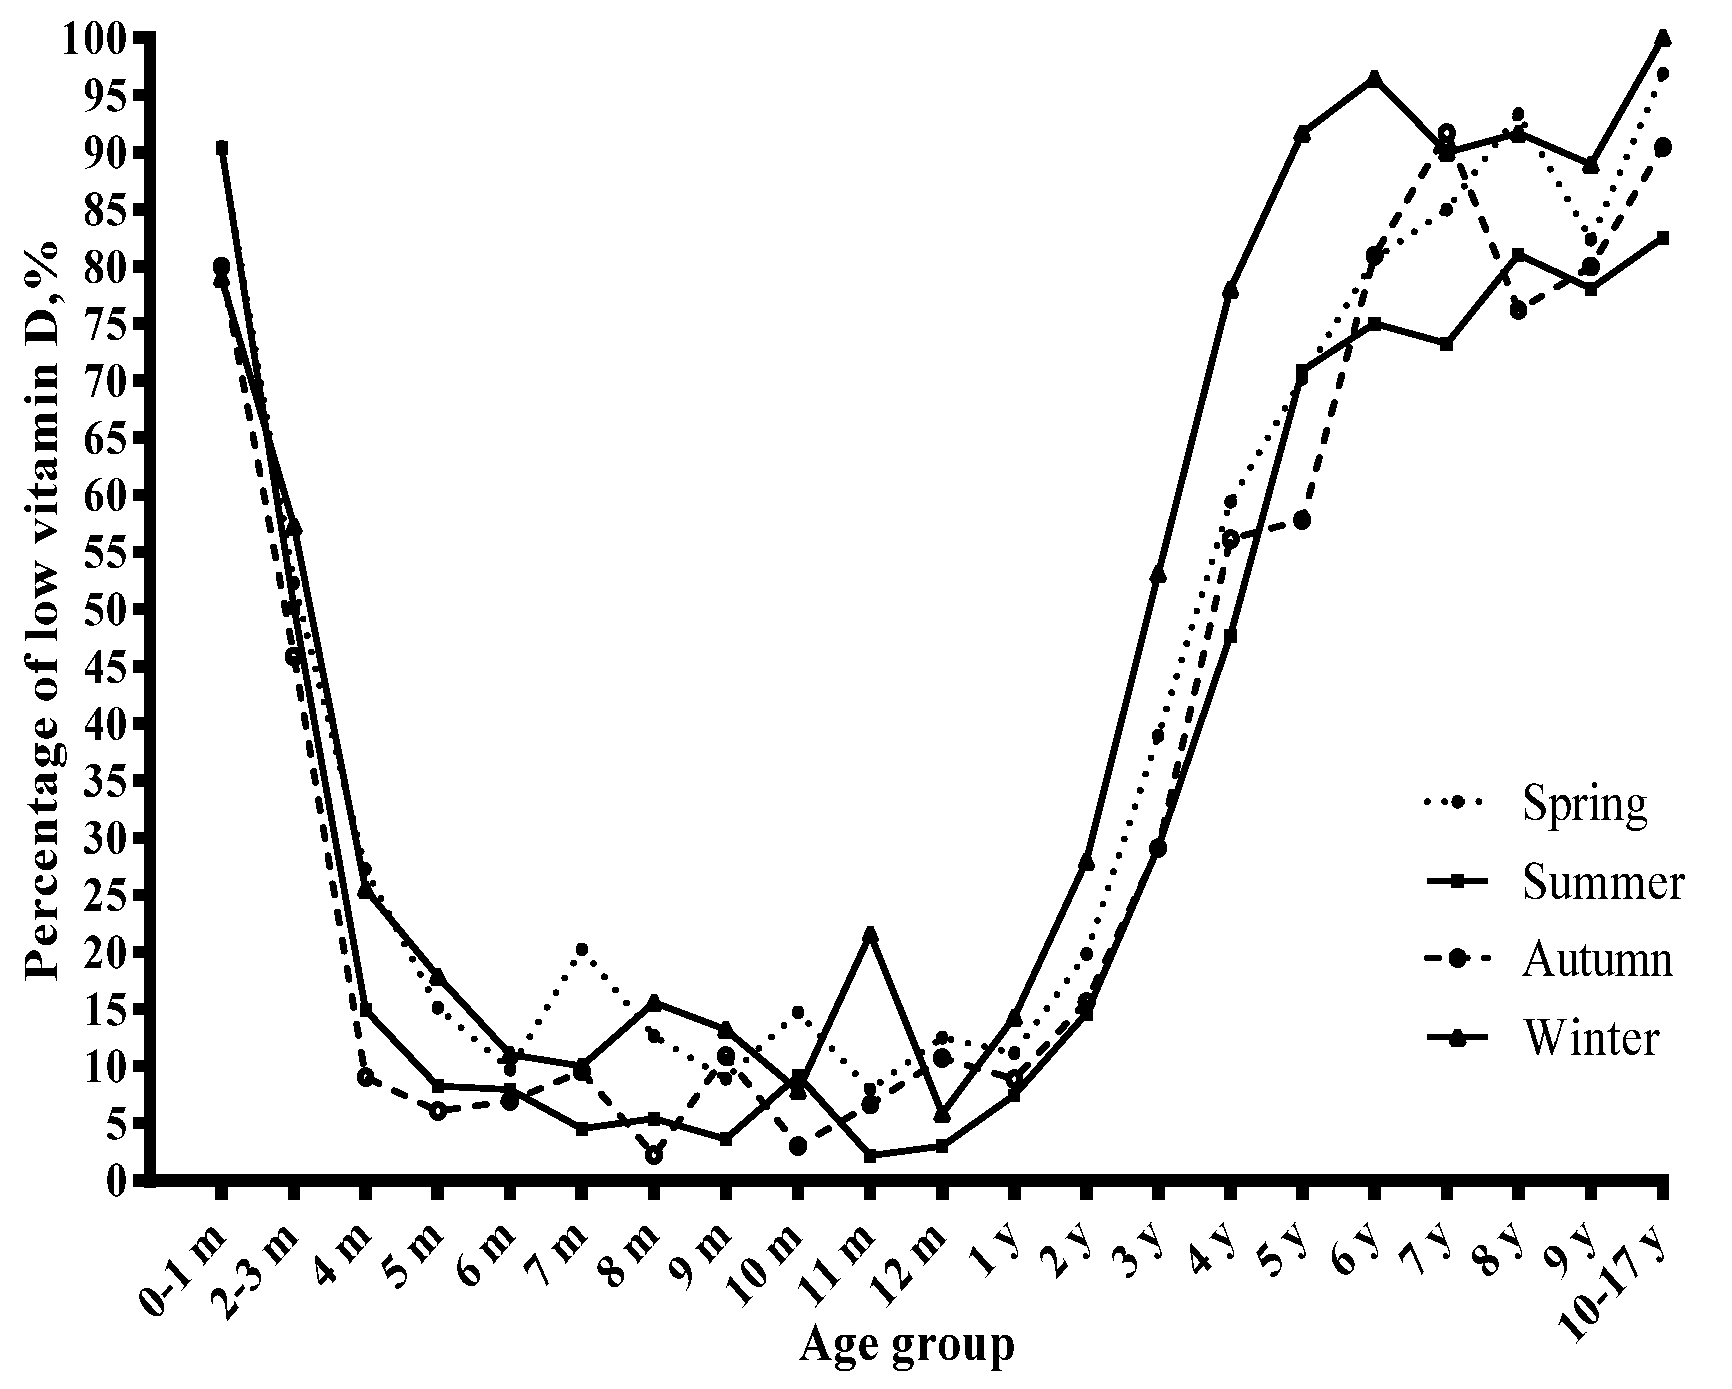
The concentrations of serum 25(OH)D varied with season (Figure 3), and the prevalence of vitamin D insufficiency and deficiency showed the opposite trend (Figure 4). The prevalence of vitamin D deficiency was higher in winter and spring (9.3 and 7.1%, respectively) than in summer and autumn (5.2% and 4.7%, respectively) (Table 3). Winter was related to lower serum 25(OH)D concentrations and a higher risk of vitamin D deficiency than the corresponding reference group (Table 1 and Table 2).
3.3. Visiting Type and Serum Vitamin D Status
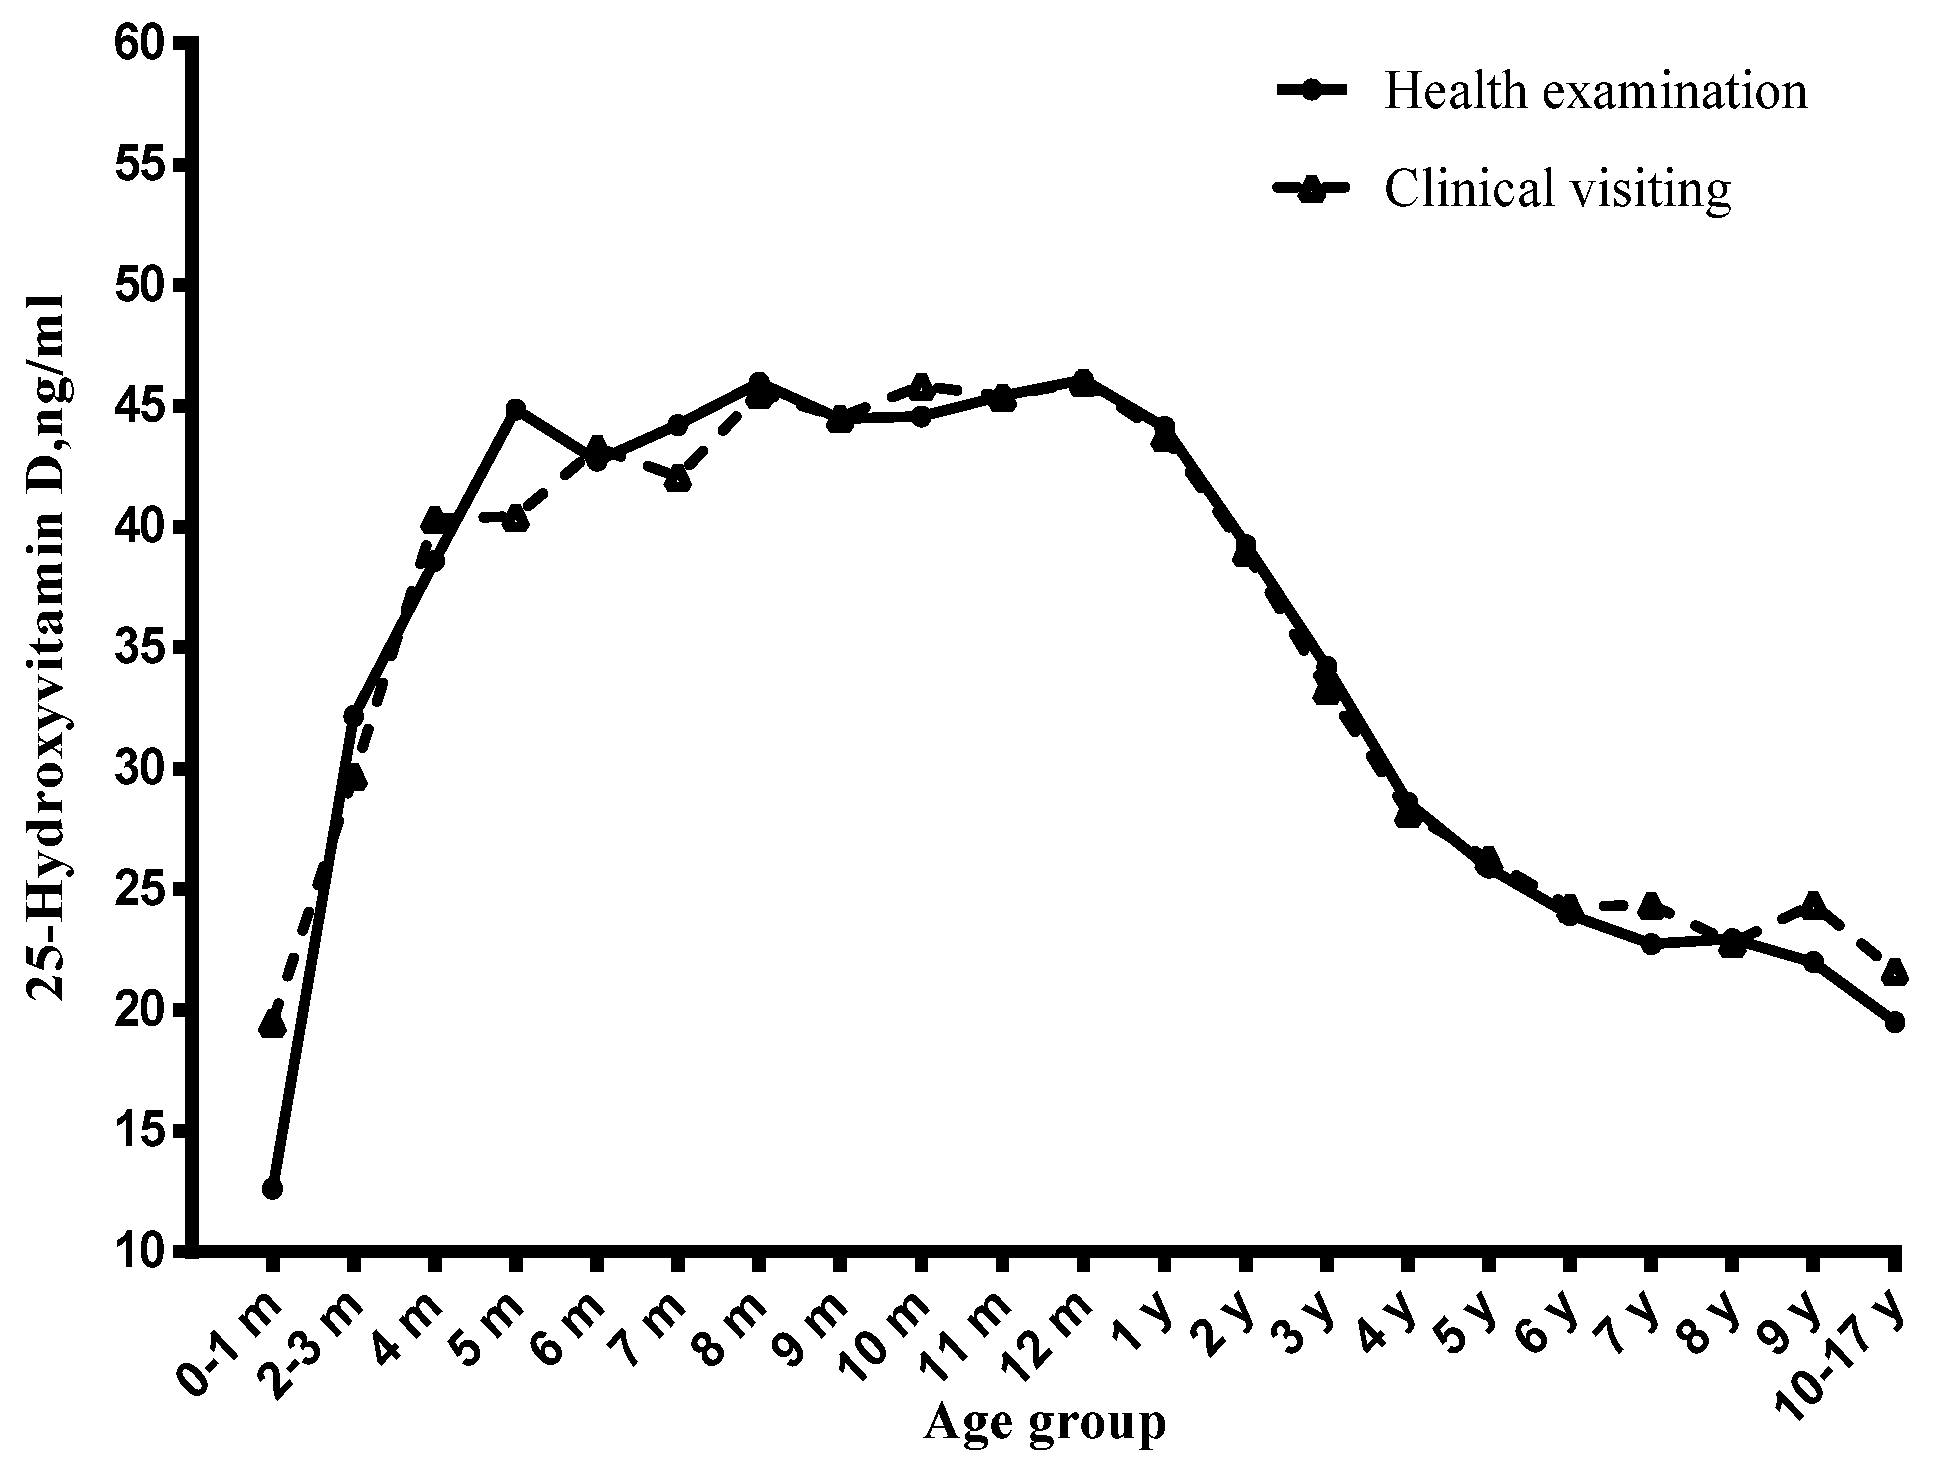
Vitamin D insufficiency occurred in 13.8% of the health examination children and in 21.6% of the clinical visiting children, and deficiency occurred in 3.8% of the health examination children compared to 10.5% of the clinical visiting children (Table 3). The health examination children had higher serum 25(OH)D concentrations than the clinical visiting children (41 ± 11 ng/mL vs. 37 ± 13 ng/mL) (Table 1). The risk of vitamin D deficiency and insufficiency was higher in clinical visiting children than the corresponding reference group. The results in the health examination children and clinical visiting children were similar to those in the whole sample (Tables S1–S3).
3.4. Gender and Serum Vitamin D Status
The mean serum 25(OH)D concentrations were 40 ± 12 ng/mL in girls while they were 39 ± 12 ng/mL in boys. Girls had a higher vitamin D–sufficient status than boys (77.7% vs. 75.9%, p = 0.02) (Table 3). However, a significant difference between genders was not observed after adjustment for other variables (Table 1 and Table 2).
4. Discussion
Our results showed that 6.43% and 16.85% of children had a deficient and insufficient vitamin D status, respectively, and these problems were common in infants and children aged up to 17 years. Serum 25(OH)D was significantly associated with age, season, and visiting type.
Children’s metabolism is fast and needs extra energy to grow. A general diet may not meet the daily vitamin D requirement [4]. Vitamin D status has a profound effect on children’s growth and development. So we mainly focused on children’s vitamin D nutrient status . Both forms of vitamin D2 (ergocalciferol) and vitamin D3 (cholecalciferol) are finally transferred into the biologically active form—1,25-dihydroxyvitamin D (1,25(OH)2D). The form 1,25(OH) 2D is the most potent vitamin D metabolite. Because circulating serum 1,25(OH)2D is tightly regulated, concentrations of the 25(OH)D are the best measure of vitamin D nutritional status [20], and this is the major circulating form of vitamin D.
The 25(OH)D concentration varies in different latitudes according to the duration of sunlight exposure. According to a study in Beijing, the prevalence of subclinical vitamin D deficiency (<5 ng/mL) was 45.2% in winter [16]. In Shanxi, vitamin D deficiency (<12.5 ng/mL) in the spring was found in 65.3% among children [21]. However, the prevalence of vitamin D deficiency is low in southern China. A survey in Hangzhou revealed that serum 25(OH)D concentrations less than 30 ng/mL and 20 ng/mL were seen in 33.6% and 5.4%, respectively, of infants as well as in 89.6% and 46.4%, respectively, of adolescents [22]. In Wuxi, 16.1% of the children aged one to three years were found to have a deficient vitamin D status (<20 ng/mL) [4]. In our study, 6.43% and 16.85% of the subjects had a deficient (<20 ng/mL) and insufficient (20–30 ng/mL) status. Overall, the prevalence of vitamin D deficiency and insufficiency in children was lower in Huzhou than those in other areas of China, but the present study included children aged under one year, who were supplemented with vitamin D from milk and infant formulas; it partly resulted in the low prevalence of deficient and insufficient vitamin D status. At the same time, Huzhou is located on a plain with abundant sunlight and its latitude is lower than many northern countries, which may contribute to the vitamin D status. Furthermore, the selected cut-off points to define deficiency and sufficiency vary with different prevalence [23]. The cut-offs in the present manuscript based on the Endocrine Society clinical practice guidelines were widely used in many studies. A review showed that the most advantageous serum concentrations of 25(OH)D begin at 30 ng/mL [24], which was consistent with our cut-off points.
The results of studies about serum 25(OH)D concentrations in boys and girls are inconsistent. As with most previous studies in children [8,10], we did not reveal any significant difference between gender. This could be explained by the fact that young children are more likely to play outside and have less academic pressure, as well as similar clothing practices and living habits when they start school. The prevalence of vitamin D inadequacy varies not only across countries but also with age groups. Our findings were consistent with the findings from a study among a 0–16 years age group by Andiran et al. [1], which showed that a lower vitamin D deficiency rate was found in the younger age group in Turkey. Our study was also consistent with the finding from a study in southern Iran of children nine to 18 years old, which found that children’s age was inversely related to serum 25(OH)D concentrations [25]. A study among mother-infant dyads showed that the breastfeeding infant median 25(OH)D was 8 ng/mL [26]. Another global exploration showed that added formula feeding predicted a higher infant vitamin D status [27]. Our results also showed that infants had a lower vitamin D status, while the concentration maintained a high level when children were six months to one year old, which might be due the fact that, in addition to breastfeeding, children began to feed on formula milk and complementary food after six months. However, when children grew to one year, the concentrations of vitamin D began to decline. It might because they stop the daily supplements of vitamin D from formula milk. According to the findings, we recommend that children should be reinforced with outdoor activities after the age of one year. Although the Chinese Medical Association also recommends that all children must receive 400 IU/day of vitamin D until the age of two years [28], children older than two years also need to supplement vitamin D. Additionally, when children grew to six years, we still found there was a large proportion of children with vitamin D deficiency. It might result from low exposure to sunshine during the school year. The group aged 11–17 years had the highest prevalence of low vitamin D, a marked difference between young children and adolescents could be explained by the difference in feeding, behavioral habits and lifestyle.
The sampling seasons were also associated with children’s vitamin D status. Our study revealed that the prevalence of vitamin D deficiency and insufficiency was highest in winter. Previous studies have also reported that the serum 25(OH)D concentration is lower in winter than in summer [29,30], which might because people are lack of enough sunlight expose and spent less time on outdoor exercise in a cold weather, and vitamin D supplementation is not available [31].
In the present study, the serum 25(OH)D concentration in clinical visiting children was significantly lower than that in health examination children (p < 0.05). Similar to the study in Nanjing, vitamin D deficiency occurred in 1.3% of healthy children and in 16.7% of sick children aged one to 10 years [14]. This phenomenon may be ascribed to vitamin D reinforcing immunomodulation [32] through its complicated effects on macrophages and lymphocytes [33], as 25(OH)D is a negative acute-phase reactant of disease. Children with diseases, such as infection, are more likely to have low concentrations [32]. Meanwhile, sick children have relatively reduced intake of food and less outdoor activity. This phenomenon suggests that vitamin D supplements may be necessary for children presenting when suffering from diseases.
There were several strengths in our study. Firstly, this study represents a large sample size that covered health examination children and clinical visiting children. Secondly, the present study first evaluated vitamin D status in the whole age range of the pediatric population. However, there are still some limitations. One of the limitations in this study was the lack of children’s sociodemographic characteristics and lifestyle factors, such as dietary habits and outdoor activity time, which have effects on the serum 25(OH)D concentrations. Another limitation was that the diagnostic criteria we used to assess vitamin D status was the Endocrine Society clinical practice guidelines, and different results may be derived if different guidelines are adopted. Furthermore, children’s regular health check-ups are required by the Chinese childrens’ health policy. Though this was a hospital-based survey, the study included 8499 children who went to the hospital for routine health examinations. Therefore, the participants of the health examination were representative of the children in south China.
5. Conclusions
This study found that there is a high prevalence of vitamin D deficiency and insufficiency status in newborns and children aged one to 17 years in the south of China. The condition was more severe in winter, in sick children and in older children. It indicates that more sunshine and vitamin D–fortified foods are necessary among Chinese children.
Supplementary Materials
The following are available online at https://www.mdpi.com/2072-6643/9/4/319/s1, Table S1: The association of variables and vitamin D (continuous variable) stratified by visiting type, Table S2: The association of variables and vitamin D (categorical variable) in clinical visiting children (N = 5498), Table S3: The association of variables and vitamin D (categorical variable) in health examination children (N = 8499).
Acknowledgments
We acknowledge the assistance and cooperation of the faculty and staff of the Huzhou Maternal & Child Care Hospital. We also thank Wenjie Dong from Hangzhou Xuejun High School and Yumeng Cai from Ulink College of Shanghai who helped us manage data. This work was supported by the National Key Research and Developement Programme of CHINA (2016YFC1305301) and the Natural Science Foundation of Zhejiang Province in China (Grant No.: LY14H260003).
Author Contributions
S.W.: drafted the manuscript; G.S., S.J., H.X., M.L., Z.W., S.Z. and Y.Y.: designed and conducted the vitamin D study; G.S., H.X. and S.Z.: were responsible for the laboratory analysis; S.W., S.J., M.L., Z.W. and Y.Y.: analyzed data; Y.Y.: primary responsibility for the final content of the manuscript; and all authors reviewed and approved the manuscript.
Conflicts of Interest
The authors declare no conflict of interest.
References
- Andiran, N.; Celik, N.; Akca, H.; Dogan, G. Vitamin D deficiency in children and adolescents. J. Clin. Res. Pediatr. Endocrinol. 2012, 4, 25–29. [Google Scholar] [CrossRef] [PubMed]
- Khor, G.L.; Chee, W.S.; Shariff, Z.M.; Poh, B.K.; Arumugam, M.; Rahman, J.A.; Theobald, H.E. High prevalence of vitamin D insufficiency and its association with BMI-for-age among primary school children in Kuala Lumpur, Malaysia. BMC Public Health 2011, 11, 95. [Google Scholar] [CrossRef] [PubMed]
- Ritu, G.; Gupta, A. Vitamin D deficiency in India: Prevalence, causalities and interventions. Nutrients 2014, 6, 729–775. [Google Scholar]
- Zhao, X.; Xiao, J.; Liao, X.; Cai, L.; Xu, F.; Chen, D.; Xiang, J.; Fang, R. Vitamin D Status among Young Children Aged 1–3 Years: A Cross-Sectional Study in Wuxi, China. PLoS ONE 2015, 10, e0141595. [Google Scholar] [CrossRef] [PubMed]
- Hypponen, E.; Laara, E.; Reunanen, A.; Jarvelin, M.R.; Virtanen, S.M. Intake of vitamin D and risk of type 1 diabetes: A birth-cohort study. Lancet 2001, 358, 1500–1503. [Google Scholar] [CrossRef]
- Muhe, L.; Lulseged, S.; Mason, K.E.; Simoes, E.A. Case-control study of the role of nutritional rickets in the risk of developing pneumonia in Ethiopian children. Lancet 1997, 349, 1801–1804. [Google Scholar] [CrossRef]
- Mellati, A.A.; Sharifi, F.; Faghihzade, S.; Mousaviviri, S.A.; Chiti, H.; Kazemi, S.A. Vitamin D status and its associations with components of metabolic syndrome in healthy children. J. Pediatr. Endocrinol. Metab. 2015, 28, 641–648. [Google Scholar] [CrossRef] [PubMed]
- Avagyan, D.; Neupane, S.P.; Gundersen, T.E.; Madar, A.A. Vitamin D status in pre-school children in rural Nepal. Public Health Nutr. 2016, 19, 470–476. [Google Scholar] [CrossRef] [PubMed]
- Das, G.; Crocombe, S.; McGrath, M.; Berry, J.L.; Mughal, M.Z. Hypovitaminosis D among healthy adolescent girls attending an inner city school. Arch. Dis. Child. 2006, 91, 569–572. [Google Scholar] [CrossRef] [PubMed]
- Voortman, T.; van den Hooven, E.H.; Heijboer, A.C.; Hofman, A.; Jaddoe, V.W.; Franco, O.H. Vitamin D deficiency in school-age children is associated with sociodemographic and lifestyle factors. J. Nutr. 2015, 145, 791–798. [Google Scholar] [CrossRef] [PubMed]
- Lapatsanis, D.; Moulas, A.; Cholevas, V.; Soukakos, P.; Papadopoulou, Z.L.; Challa, A. Vitamin D: A necessity for children and adolescents in Greece. Calcif. Tissue Int. 2005, 77, 348–355. [Google Scholar] [CrossRef] [PubMed]
- Fraser, D.R. Vitamin D-deficiency in Asia. J. Steroid Biochem. Mol. Biol. 2004, 89–90, 491–495. [Google Scholar] [CrossRef] [PubMed]
- Yu, X.; Wang, W.; Wei, Z.; Ouyang, F.; Huang, L.; Wang, X.; Zhao, Y.; Zhang, H.; Zhang, J. Vitamin D status and related factors in newborns in Shanghai, China. Nutrients 2014, 6, 5600–5610. [Google Scholar] [CrossRef] [PubMed]
- Liang, G.Y.; Qin, R.; Li, J.; Liang, G.X.; Guan, Y.J.; Gao, Z.H. Optimal level of 25-(OH)D in children in Nanjing (32 degrees N Lat) during winter. Pediatr. Int. 2011, 53, 541–545. [Google Scholar] [CrossRef] [PubMed]
- Wang, L.L.; Wang, H.Y.; Wen, H.K.; Tao, H.Q.; Zhao, X.W. Vitamin D status among infants, children, and adolescents in southeastern China. J. Zhejiang Univ. Sci. B 2016, 17, 545–552. [Google Scholar] [PubMed]
- Du, X.; Greenfield, H.; Fraser, D.R.; Ge, K.; Trube, A.; Wang, Y. Vitamin D deficiency and associated factors in adolescent girls in Beijing. Am. J. Clin. Nutr. 2001, 74, 494–500. [Google Scholar] [PubMed]
- Wielders, J.P.; Carter, G.F.; Eberl, H.; Morris, G.; Roth, H.J.; Vogl, C. Automated Competitive Protein-Binding Assay for Total 25-OH Vitamin D, Multicenter Evaluation and Practical Performance. J. Clin. Lab. Anal. 2015, 29, 451–461. [Google Scholar] [CrossRef] [PubMed]
- Holick, M.F. Sunlight and vitamin D for bone health and prevention of autoimmune diseases, cancers, and cardiovascular disease. Am. J. Clin. Nutr. 2004, 80, 1678S–1688S. [Google Scholar] [PubMed]
- Holick, M.F.; Binkley, N.C.; Bischoff-Ferrari, H.A.; Gordon, C.M.; Hanley, D.A.; Heaney, R.P.; Murad, M.H.; Weaver, C.M. Evaluation, treatment, and prevention of vitamin D deficiency: An Endocrine Society clinical practice guideline. J. Clin. Endocrinol. Metab. 2011, 96, 1911–1930. [Google Scholar] [CrossRef] [PubMed]
- Marwaha, R.K.; Tandon, N.; Reddy, D.R.; Aggarwal, R.; Singh, R.; Sawhney, R.C.; Saluja, B.; Ganie, M.A.; Singh, S. Vitamin D and bone mineral density status of healthy schoolchildren in northern India. Am. J. Clin. Nutr. 2005, 82, 477–482. [Google Scholar] [PubMed]
- Strand, M.A.; Perry, J.; Jin, M.; Tracer, D.P.; Fischer, P.R.; Zhang, P.; Xi, W.; Li, S. Diagnosis of rickets and reassessment of prevalence among rural children in northern China. Pediatr. Int. 2007, 49, 202–209. [Google Scholar] [CrossRef] [PubMed]
- Zhu, Z.; Zhan, J.; Shao, J.; Chen, W.; Chen, L.; Li, W.; Ji, C.; Zhao, Z. High prevalence of vitamin D deficiency among children aged 1 month to 16 years in Hangzhou, China. BMC Public Health 2012, 12, 126. [Google Scholar] [CrossRef] [PubMed]
- Manson, J.E.; Brannon, P.M.; Rosen, C.J.; Taylor, C.L. Vitamin D Deficiency—Is There Really a Pandemic? N. Engl. J. Med. 2016, 375, 1817–1820. [Google Scholar] [CrossRef] [PubMed]
- Bischoff-Ferrari, H.A.; Giovannucci, E.; Willett, W.C.; Dietrich, T.; Dawson-Hughes, B. Estimation of optimal serum concentrations of 25-hydroxyvitamin D for multiple health outcomes. Am. J. Clin. Nutr. 2006, 84, 18–28. [Google Scholar] [PubMed]
- Saki, F.; Dabbaghmanesh, M.H.; Omrani, G.R.; Bakhshayeshkaram, M. Vitamin D deficiency and its associated risk factors in children and adolescents in southern Iran. Public Health Nutr. 2015. [CrossRef] [PubMed]
- Salameh, K.; Al-Janahi, N.S.; Reedy, A.M.; Dawodu, A. Prevalence and risk factors for low vitamin D status among breastfeeding mother-infant dyads in an environment with abundant sunshine. Int. J. Womens Health 2016, 8, 529–535. [Google Scholar] [PubMed]
- Dawodu, A.; Davidson, B.; Woo, J.G.; Peng, Y.M.; Ruiz-Palacios, G.M.; De Lourdes Guerrero, M.; Morrow, A.L. Sun exposure and vitamin D supplementation in relation to vitamin D status of breastfeeding mothers and infants in the global exploration of human milk study. Nutrients 2015, 7, 1081–1093. [Google Scholar] [CrossRef] [PubMed]
- Chinese Journal of Pediatrics. Recommendation for prevention and treatment of rickets of vitamin D deficiency in childhood. Chin. J. Pediatr. 2008, 46, 190–191. [Google Scholar]
- Valtuena, J.; Gonzalez-Gross, M.; Huybrechts, I.; Breidenassel, C.; Ferrari, M.; Mouratidou, T.; Gottrand, F.; Dallongeville, J.; Azzini, E.; Sioen, I.; et al. Factors associated with vitamin D deficiency in European adolescents: The HELENA study. J. Nutr. Sci. Vitaminol. (Tokyo) 2013, 59, 161–171. [Google Scholar] [PubMed]
- Carpenter, T.O.; Herreros, F.; Zhang, J.H.; Ellis, B.K.; Simpson, C.; Torrealba-Fox, E.; Kim, G.J.; Savoye, M.; Held, N.A.; Cole, D.E. Demographic, dietary, and biochemical determinants of vitamin D status in inner-city children. Am. J. Clin. Nutr. 2012, 95, 137–146. [Google Scholar] [CrossRef] [PubMed]
- Tuffaha, M.; El Bcheraoui, C.; Daoud, F.; Al Hussaini, H.A.; Alamri, F.; Al Saeedi, M.; Basulaiman, M.; Memish, Z.A.; AlMazroa, M.A.; Al Rabeeah, A.A.; et al. Deficiencies Under Plenty of Sun: Vitamin D Status among Adults in the Kingdom of Saudi Arabia, 2013. N. Am. J. Med. Sci. 2015, 7, 467–475. [Google Scholar] [PubMed]
- Dusso, A.S.; Brown, A.J.; Slatopolsky, E. Vitamin, D. Am. J. Physiol. Renal Physiol. 2005, 289, F8–F28. [Google Scholar] [CrossRef] [PubMed]
- Lips, P. Vitamin D physiology. Prog. Biophys. Mol. Biol. 2006, 92, 4–8. [Google Scholar] [CrossRef] [PubMed]
Figure 1.
Distribution of serum 25-hydroxyvitamin D concentration by age, stratified by gender.

Figure 2.
Distribution of serum 25-hydroxyvitamin D concentration by age, stratified by visiting type.
Figure 2.
Distribution of serum 25-hydroxyvitamin D concentration by age, stratified by visiting type.

Figure 3.
Distribution of serum 25-hydroxyvitamin D concentration by age, stratified by season.

Figure 4.
The percentage of low vitamin D (vitamin D deficiency and insufficiency) stratified by season.
Figure 4.
The percentage of low vitamin D (vitamin D deficiency and insufficiency) stratified by season.


Table 1.
The association of variables with 25(OH)D concentration (continuous value) * (N = 13997).
| Variables | N (%) | Serum 25(OH)D | ||
|---|---|---|---|---|
| Mean ± SD | β (se) | p Value | ||
| Gender | ||||
| Boys | 7739 (55.3) | 39 ± 12 | REF | |
| Girls | 6258 (44.7) | 40 ± 12 | 0.13(0.19) | 0.50 |
| Age | ||||
| 0–3 months | 1288 (9.2) | 29 ± 11 | REF | |
| 4–6 months | 2162 (15.5) | 43 ± 11 | 13.27(0.42) | <0.01 |
| 7–12 months | 1577 (11.3) | 45 ± 11 | 15.29(0.44) | <0.01 |
| 1–3 years | 7703 (55.0) | 41 ± 11 | 11.27(0.39) | <0.01 |
| 4–6 years | 786 (5.6) | 27 ± 8 | −3.25(0.45) | <0.01 |
| 7–10 years | 395 (2.8) | 23 ± 7 | −6.79(0.50) | <0.01 |
| 11–17 years | 86 (0.6) | 21 ± 8 | −8.97(0.87) | <0.01 |
| Season | ||||
| Spring | 3919 (28.0) | 39 ± 12 | REF | |
| Summer | 4914 (35.1) | 40 ± 12. | 1.62(0.23) | <0.01 |
| Autumn | 2451 (17.5) | 40 ± 12 | 1.13(0.27) | <0.01 |
| Winter | 2713 (19.4) | 36 ± 12 | −2.56(0.27) | <0.01 |
| Visiting Type | ||||
| Health Examination | 8499 (60.7) | 41 ± 11 | REF | |
| Clinical Visiting | 5498 (39.3) | 37 ± 13 | −0.45(0.21) | 0.03 |
* The generalized estimated equation model includes all variables in this table.
Table 2.
The association * of variables with 25(OH)D concentration (categorical variable) (N = 13997).
Table 2.
The association * of variables with 25(OH)D concentration (categorical variable) (N = 13997).
| Variables | Sufficiency | Insufficiency | Deficiency | ||||
|---|---|---|---|---|---|---|---|
| N (%) | N (%) | OR (95%CI) | p Value | N (%) | OR(95%CI) | p Value | |
| Gender | |||||||
| Boys | 5874 (54.7) | 1364 (57.9) | REF | 501 (55.7) | REF | ||
| Girls | 4865 (45.3) | 994 (42.2) | 0.96 (0.87-1.05) | 0.35 | 399 (44.3) | 1.14 (0.98-1.33) | 0.10 |
| Age | |||||||
| 0–3 months | 570 (5.3) | 424 (18.0) | REF | 294 (32.7) | REF | ||
| 4–6 months | 1926 (17.9) | 179 (7.6) | 0.14 (0.11–0.17) | <0.01 | 57 (6.3) | 0.06 (0.05–0.09) | <0.01 |
| 7–12 months | 1436 (13.4) | 114 (4.8) | 0.12 (0.10–0.15) | <0.01 | 27 (3.0) | 0.04 (0.03–0.06) | <0.01 |
| 1–3 years | 6466 (60.2) | 1064 (45.1) | 0.26 (0.22–0.31) | <0.01 | 173 (19.2) | 0.06 (0.05–0.08) | <0.01 |
| 4–6 years | 264 (2.5) | 352 (14.9) | 2.14 (1.74–2.64) | <0.01 | 170 (18.9) | 1.66 (1.29–2.14) | <0.01 |
| 7–10 years | 70 (0.6) | 187 (7.9) | 4.32 (3.18–5.87) | <0.01 | 138 (15.3) | 5.31 (3.81–7.41) | <0.01 |
| 11–17 years | 7 (0.1) | 38 (1.6) | 8.57 (3.78–19.44) | <0.01 | 41 (4.6) | 14.61 (6.41–33.27) | <0.01 |
| Season | |||||||
| Spring | 3004 (28.0) | 638 (27.0) | REF | 277 (30.8) | REF | ||
| Summer | 3864 (36.0) | 796 (33.8) | 0.78 (0.69–0.89) | <0.01 | 254 (28.2) | 0.49 (0.41–0.60) | <0.01 |
| Autumn | 1964 (18.3) | 371 (15.7) | 0.80 (0.69–0.93) | <0.01 | 116 (12.9) | 0.53 (0.42–0.68) | <0.01 |
| Winter | 1907 (17.7) | 553 (23.5) | 1.37 (1.20–1.58) | <0.01 | 253 (28.1) | 1.33 (1.09–1.63) | 0.01 |
| Visiting Type | |||||||
| Health Examination | 7005 (65.2) | 1170 (49.6) | REF | 324 (36.0) | REF | ||
| Clinical Visiting | 3734 (34.8) | 1188 (50.4) | 1.19 (1.07–1.33) | <0.01 | 576 (64.0) | 1.23 (1.03–1.47) | 0.03 |
* The multiple logistic regression model includes all variables in this table.
Table 3.
The distribution of relevant variables with different levels of serum 25(OH)D (N = 13997).
| Variables | Distribution of Serum 25(OH)D | p Value | ||
|---|---|---|---|---|
| Sufficiency (n = 10,739) | Insufficiency (n = 2358) | Deficiency (n = 900) | ||
| N (%) | ||||
| Gender a | ||||
| Boys | 5874 (75.9) | 1364 (17.6) | 501 (6.5) | 0.02 |
| Girls | 4865 (77.7) | 994 (15.9) | 399 (6.4) | |
| Season a | ||||
| Spring | 3004 (76.6) | 638 (16.3) | 277 (7.1) | <0.01 |
| Summer | 3864 (78.6) | 796 (16.2) | 254 (5.2) | |
| Autumn | 1964 (80.2) | 371 (15.1) | 116 (4.7) | |
| Winter | 1907 (70.3) | 553 (20.4) | 253 (9.3) | |
| Visiting Type a | ||||
| Health Examination | 7005 (82.4) | 1170 (13.8) | 324 (3.8) | <0.01 |
| Clinical Visiting | 3734 (67.9) | 1188 (21.6) | 576 (10.5) | |
| Mean ± SD | ||||
| Age, years b | 3 ± 4 | 3 ± 3 | 1 ± 1 | <0.01 |
| 25(OH)D, ng/mL b | 44 ± 9 | 26 ± 3 | 1 ± 4 | <0.01 |
a Values were compared using Chi Square(χ2) test for the categorical variables; b Values were compared using analysis of variance (ANOVA) for the continuous variables.
© 2017 by the authors. Licensee MDPI, Basel, Switzerland. This article is an open access article distributed under the terms and conditions of the Creative Commons Attribution (CC BY) license (http://creativecommons.org/licenses/by/4.0/).
Share and Cite
MDPI and ACS Style
Wang, S.; Shen, G.; Jiang, S.; Xu, H.; Li, M.; Wang, Z.; Zhang, S.; Yu, Y. Nutrient Status of Vitamin D among Chinese Children. Nutrients 2017, 9, 319. https://doi.org/10.3390/nu9040319
AMA Style
Wang S, Shen G, Jiang S, Xu H, Li M, Wang Z, Zhang S, Yu Y. Nutrient Status of Vitamin D among Chinese Children. Nutrients. 2017; 9(4):319. https://doi.org/10.3390/nu9040319
Chicago/Turabian StyleWang, Shuojia, Guosong Shen, Shuying Jiang, Hongwei Xu, Minchao Li, Zhaopin Wang, Su Zhang, and Yunxian Yu. 2017. "Nutrient Status of Vitamin D among Chinese Children" Nutrients 9, no. 4: 319. https://doi.org/10.3390/nu9040319
Note that from the first issue of 2016, this journal uses article numbers instead of page numbers. See further details here.