1. Introduction
Monitoring patient’s food intake during hospitalisation through the use of simple methods that require minimal training has been identified as an ongoing problem [
1]. These food intake data underpin clinical practice since they are used to estimate the nutritional intake of patients for the development of nutrition interventions [
2]. However, this process can be difficult and resource-intensive [
1]. Nutritional intake may be estimated through the direct analysis of consumed foods or through the use of food composition tables and nutrient databases. While direct analysis methods are considered to be the most accurate, they are often expensive and time consuming [
3]. Consequently, a simple and reliable method, such as a ready reckoner, may be preferential [
1,
4].
Ready reckoners have been defined as “a summary tool that provided average energy and protein contents for each grouped menu item” [
2] (p. 762). They are developed across food groups through the averaging of known food compositions. For example, several dessert items may be averaged to produce a single energy and protein value for a single “dessert” item. These averages can then be used to quickly calculate an individual’s intake and have been used in previous nutrition research [
1,
2,
5]. There are conflicting reports as to their accuracy. Researchers have suggested that ready reckoners used in conjunction with food record charts were more likely to have poorer accuracy when estimating energy and protein intake [
2]. In contrast, others report that a ready reckoner attached to a visual representation of plate waste allowed for greater accuracy [
1].
In order to determine whether a measurement tool, such as a ready reckoner, is accurate, it must be compared to measurements determined by other dietary assessment techniques [
4], such as computerised dietary analysis. Computerised dietary analysis is often viewed as the gold-standard for the calculation of nutrient intake with reference databases used as the foundation for analysis. Many computerised dietary assessment programs are in use with food database size varying from 70 to over 23,000 items [
6].
The use of ready reckoners during trials may be a cost- and time-effective alternative to the “gold-standard” of computerised dietary analysis. Only one known previous report [
2] has explored the level of agreement between these two methods of analysis, which is important within the clinical and research context. This research aimed to investigate the level of agreement between ready reckoner analysis and computerised dietary analysis.
2. Materials and Methods
2.1. Study Design
This was a secondary analysis of data obtained from a clinical trial undertaken in three subacute wards in one large metropolitan Melbourne healthcare network. The clinical trial was registered with the Australian New Zealand Clinical Trials Registry (ANZCTR: 12614001316695); the full trial protocol has previously been published [
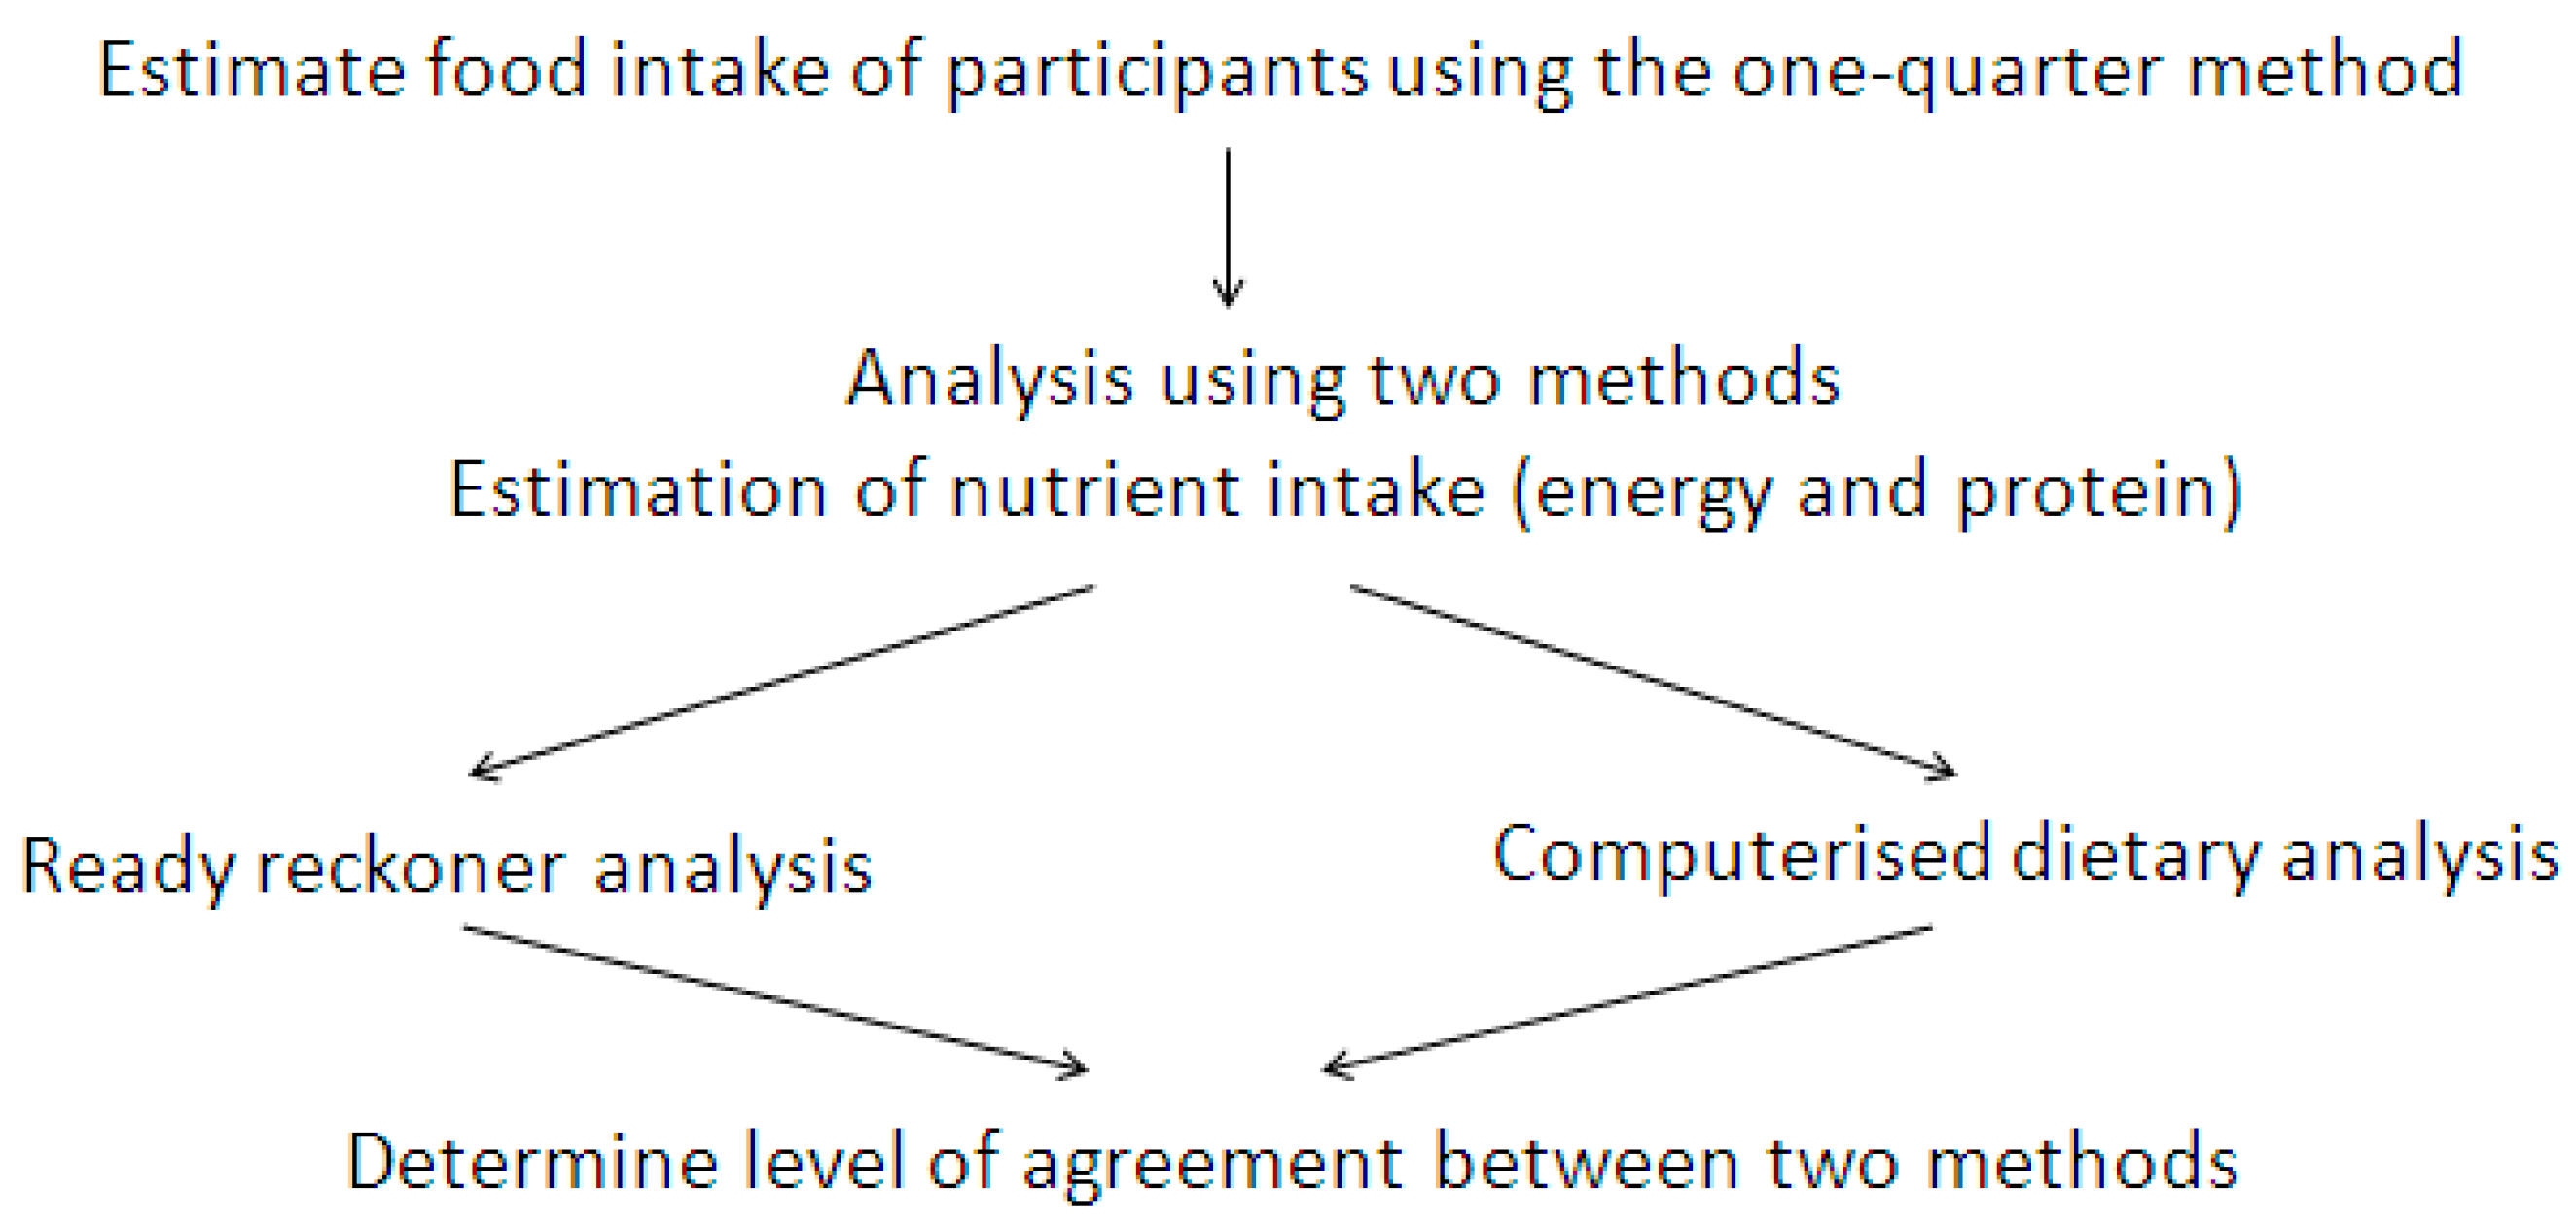
7]. The flow of methods used to determine level of agreement in this study is illustrated in
Figure 1.
The clinical trial from which these data were obtained was conducted under a waiver of consent. As such, patients did not individually provide informed consent. The study was conducted in accordance with the Declaration of Helsinki, and the protocol was approved by the ethics committee of the participating health network (LR69-2014) and the relevant university ethics committee (CF15/414–2015000202).
2.2. Estimation of Dietary Intake
Food intake observation of randomly selected participants occurred at main meals (breakfast, lunch and dinner) and mid-meals (morning and afternoon tea). Each main and mid-meal was sighted by observers upon delivery to participants. Food consumption was estimated using the validated one-quarter portion method [
8,
9]. Intake was estimated using a 5-point visual scale (0, ¼, ½, ¾, all) for each meal component (e.g., cereal, main (meat or vegetarian), starch, vegetables, dessert, drinks, oral nutrition supplement). All observers (3rd year Bachelor of Nutrition and Dietetics students) received intensive training in the use of this technique. Participant self reports were obtained for foods eaten outside the hospital environment.
2.3. Ready Reckoner Analysis
The ready reckoner was developed and used by dietitians at the healthcare network hosting the clinical trial. It was designed for use in the clinical setting to estimate a patient’s nutrient intake as part of the nutrition therapy process and had been updated seven months prior to the commencement of the clinical trial when menu changes were made. The ready reckoner included mean values of energy and protein for menu items (e.g., breakfast cereal, soup, meat, meat (wet dishes)). In its development, the nutritional content of items within each meal category were averaged then rounded to the nearest 10kJ energy and 1g protein for each serve size. Values were derived either from product nutrition information panels or from known nutrient composition of each meal as provided by the external production kitchen (unpublished data available at
http://www.monashhealth.org/page/nutritional_information), where the majority of meals included in the hospital menu were produced.
Estimates of 24-h food intake of study participants were converted into energy (kJ/day) and protein (g/day) using the ready reckoner. At completion, energy intake was rounded to the nearest 100 kJ and protein intake was rounded to the nearest 1 g.
2.4. Computerised Dietary Analysis
A database containing the nutritional analysis from the commercial production kitchen was integrated into Foodworks (v7.0, Xyris Software ©2012, NUTTAB 2010 database). All other foods consumed were selected directly from the NUTTAB 2010 database. At the completion of the clinical trial, a single research assistant conducted computerised dietary analysis on each 24-h food record using this database. Again, energy intakes were rounded to the nearest 100 kJ and daily protein rounded to the nearest 1 g.
Analysis time for each method was estimated by trained observers for the ready reckoner analysis, and the research assistant who completed the computerised analysis.
2.5. Statistical Analysis
Statistical analysis was undertaken using Microsoft Excel 2016 (©2016 Microsoft Corporation). Three participants consumed no food or fluids during the observation period and their records were removed from this analysis. Data were analysed as a whole and within quartiles based on the computerised dietary analysis. Energy and protein intakes were described as mean ± standard deviation and comparisons between analysis methods were made using paired samples t-test and Pearson’s correlation. The Bland-Altman method was used to determine the level of agreement between the two methods. This method calculates the mean difference between two methods of measurement (the “bias”) and 95% limits of agreement as the mean difference (1.96 standard deviation). It is expected that the 95% limits include 95% of the differences between the measurement methods. Bland-Altman plots were used to reveal any relationship between the differences and the magnitude of measurements to look for any systematic bias and to identify possible outliers [
10]. The methods were considered to be in agreement if the difference between them was small enough to be considered interchangeable [
11]. Authors did not define an a priori limit of variance between methods but rather considered the clinical and research implications of variance where it occurred. Additionally, comparisons of the agreement, under- and over-estimation of the ready reckoner analysis compared with computerised dietary analysis were made.
3. Results
The characteristics of study participants who consumed food during the 24-h observation period are shown in
Table 1. Due to the nature of the stepped wedge study design, the intake of some participants was recorded on more than one occasion; for the purposes of this analysis all observations have been included. Details regarding unique study participants have been reported elsewhere [
12].
Energy intake ranged from 0.2 to 14.8 MJ determined by computerised dietary analysis while a range of 0.3–15.0 MJ was determined by ready reckoner analysis. Protein intake ranged from 3 to 126 g (computerised analysis) and 2 to 139 g (ready reckoner analysis). For both energy and protein intake, the ready reckoner tended to underestimate intake compared to the computerised dietary analysis, with the exception of the first quartile of energy intake where both methods had comparable means and standard deviations (
Table 2).
Compared with computerised dietary analysis, the ready reckoner under-estimated 290 (70.2%), over-estimated 103 (25.0%) and obtained agreement for 20 (4.8%) energy intake data pairs. Of the protein intake analyses, the ready reckoner under-estimated 276 (66.8%), over-estimated 135 (32.7%) and obtained agreement for two (0.5%) data pairs.
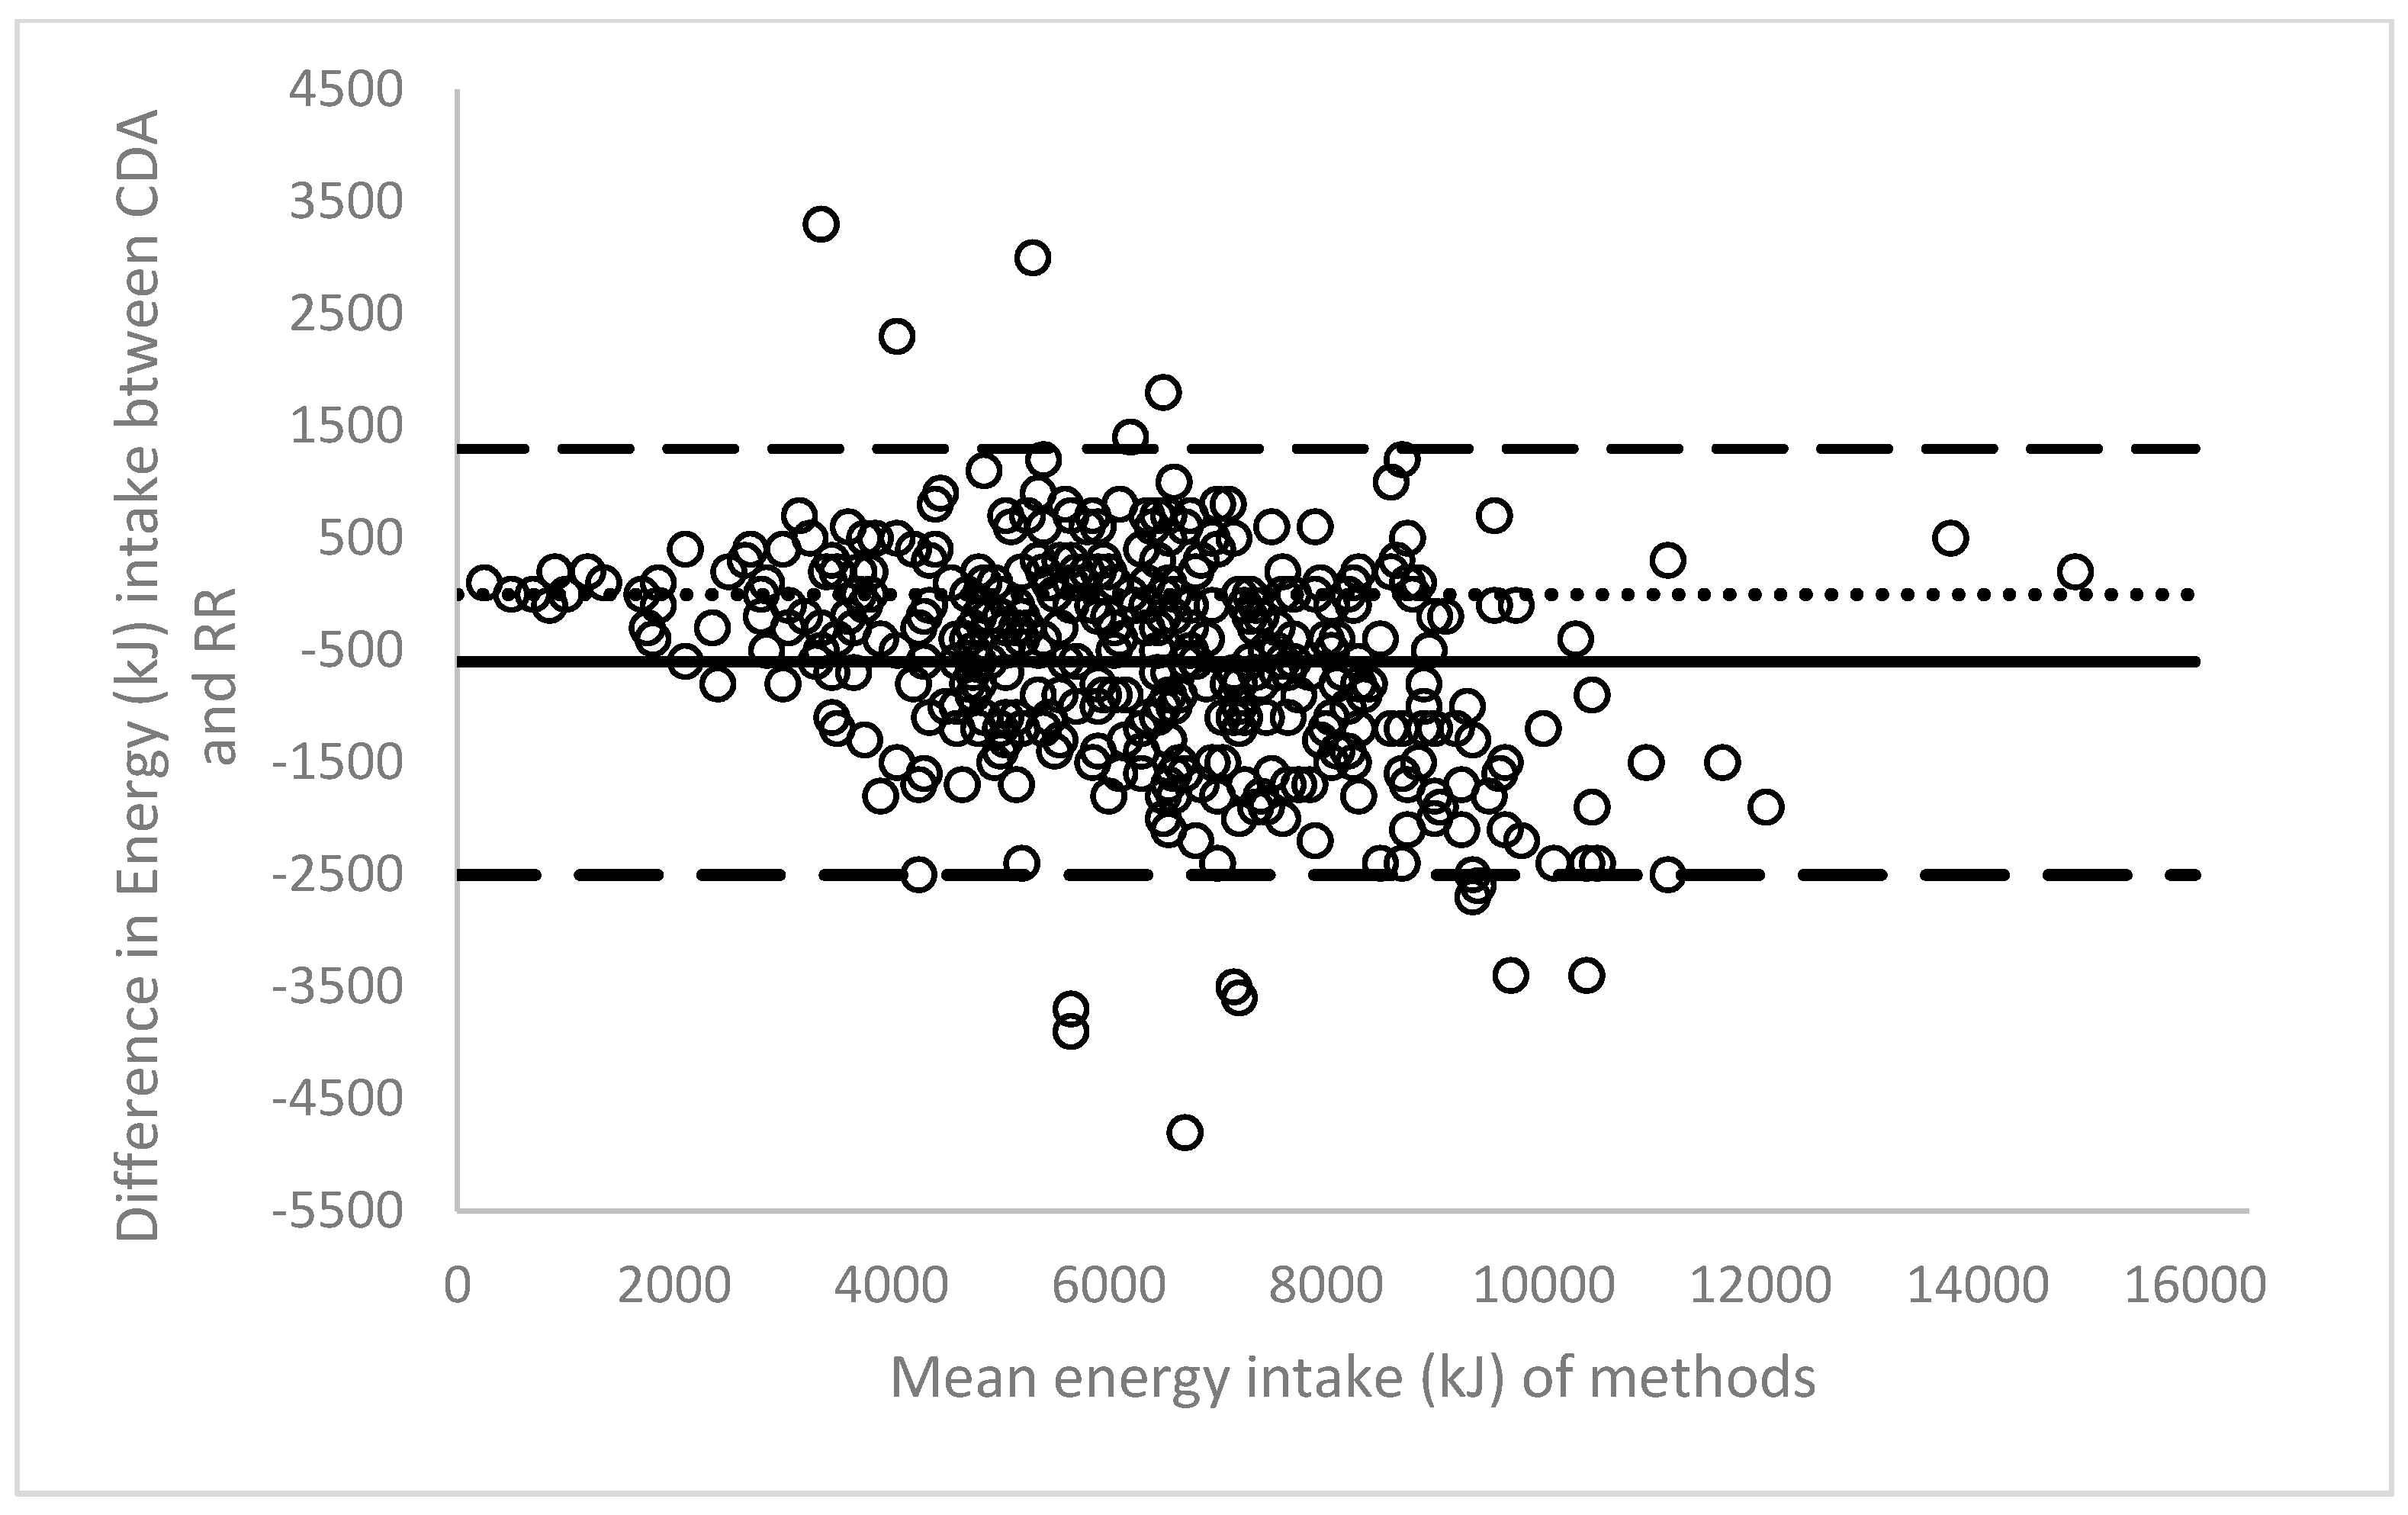
The line of bias within the Bland-Altman plot indicates an underestimation of 600kJ by ready reckoner analysis across the energy intake dataset (
Figure 2). A wide limit of agreement was observed, from −2500 kJ to 1300 kJ.
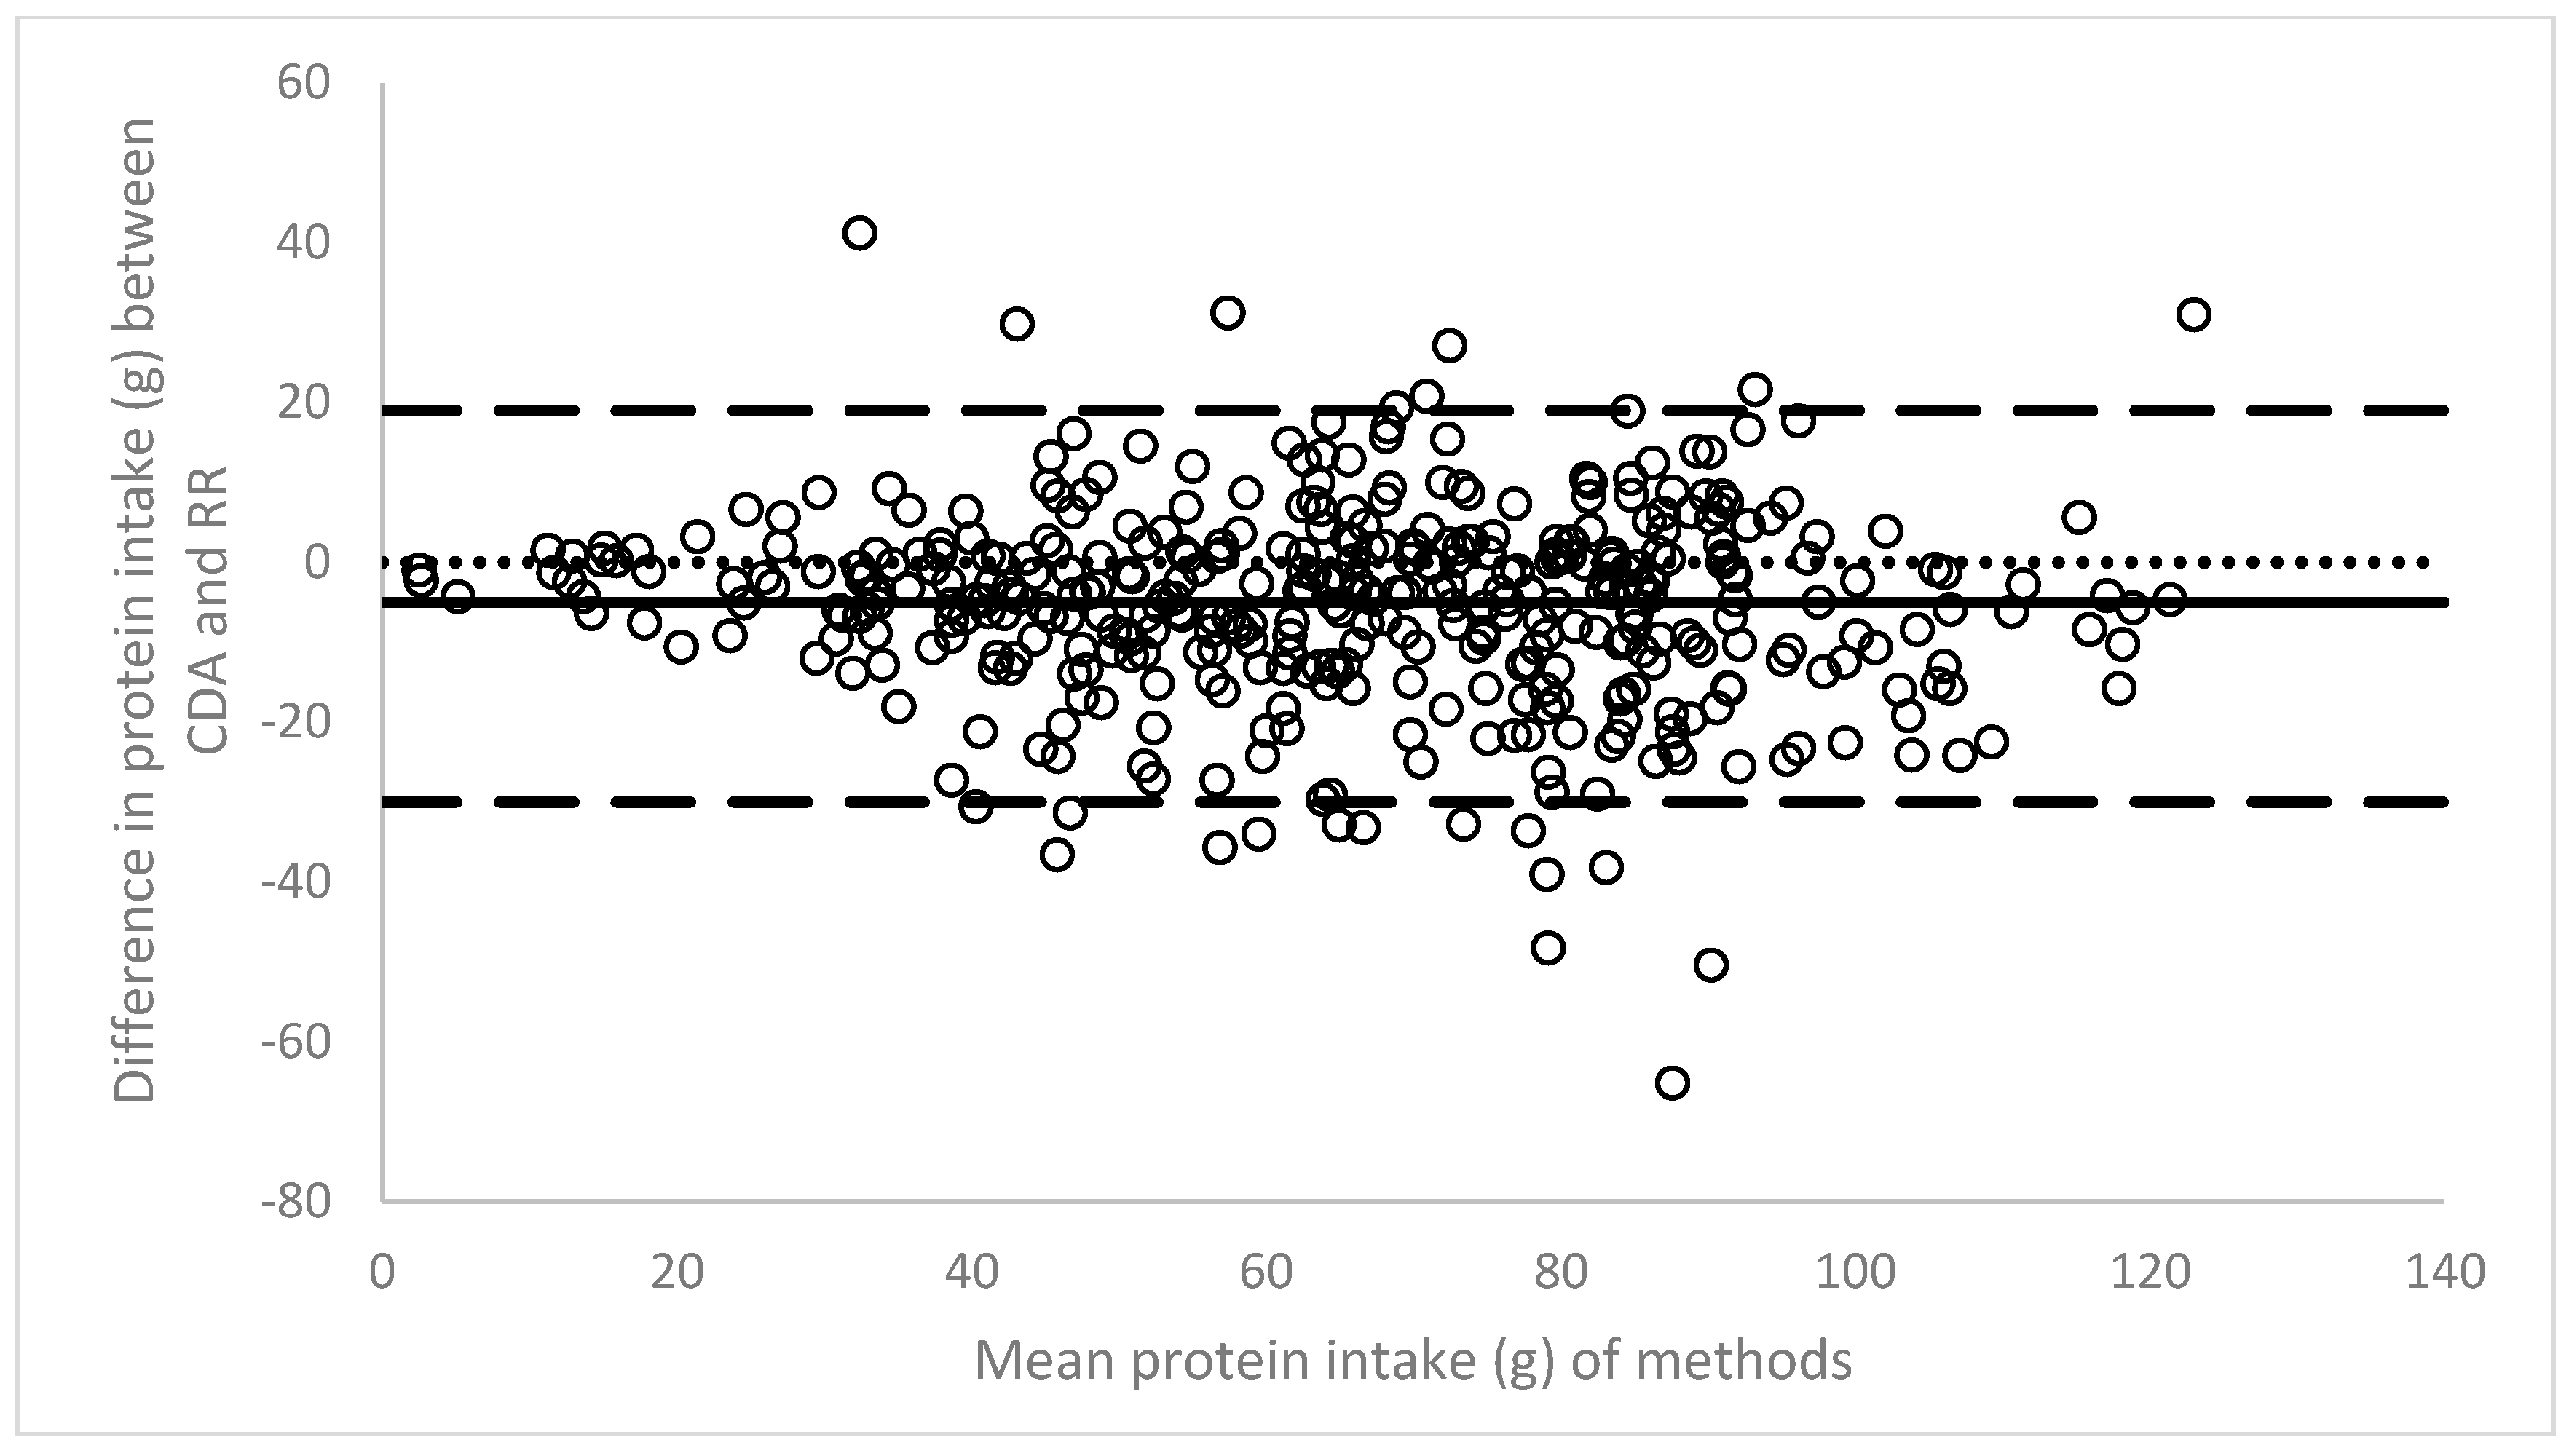
The line of bias revealed a gap of 5 g between the two methods, again with an underestimation by the ready reckoner method (
Figure 3). A trend towards closer agreement was identified towards the lower end of the first protein intake quartile. Overall limits of agreement were wide (−30 g to 19 g).
Trained observers estimated that ready reckoner analysis took 8–10 min per intake record. The research assistant conducting the computerised dietary analysis took 9.8 min to analyse each record.
4. Discussion
This study compared ready reckoner and computerised dietary analysis methods of a singular data set, extending the evidence base for practitioners in clinical practice and researchers. Although no time advantages were observed between the techniques, in practice where access to computerised dietary analysis may be a considerable cost or distance, ready reckoner analysis evidently has merits. Equally, however, in the research setting where dietitians and nutrition scientists are conducting clinical trials to inform the development of clinical guidelines and food policy, the underestimation by ready reckoner analysis that we have identified may have implications for reporting and interpretation of results.
The energy and protein intakes reported in this clinical trial were higher than those reported in the only other study of Protected Mealtimes where 24-h intakes were estimated [
14]. In the previous research, intakes of (mean ± S.D.) 5011 ± 1774 kJ in the usual care group and 4957 ± 2237 kJ in intervention group were reported. Protein intakes were also lower, with 47 ± 19 g (usual care) and 43 ± 21 g (intervention) reported [
14].
In the present analysis a trend of closer agreement was observed within the first quartiles for both energy and protein. This supports a previous report that a ready reckoner was more likely to accurately calculate at smaller intakes and at mid-meals [
2]. It is likely that at mid-meals, estimation of consumption is easier to standardise due to smaller intakes and the use of branded goods (such as pre-packaged biscuits). Unlike the study of Palmer et al. [
2] reporting generally poor agreement between the two methods tested, this study found wide levels of agreement but high correlation between the two analysis methods. This difference in findings can be attributed to multiple factors, including variation in the interventions being tested and inter-rater reliability.
Measurement error has been defined as “a deviation from true value” [
15]. Errors inevitably occur in the determination of food composition and subsequently nutrient intake [
16]. It has been suggested that errors in completing intake analysis correctly may result in inaccuracies, most commonly overestimations of greater than 15% [
17,
18]. The Bland-Altman method allows for the comparison of two methods to determine their level of agreement and takes into account the random error associated with both methods [
19]. It acknowledges that the reference method is not infallible and therefore is not truly the “gold standard” [
19]. The Bland-Altman analysis does not define whether these limits are clinically acceptable [
20], nor does it determine statistical significance.
We suggest that the main cause of difference occurred not from the estimation of food intake (since both were analysed from identical records), but rather from inaccuracies in the development of the ready reckoner itself. It is therefore important to consider the context in which the ready reckoner may be used. This underestimation by the ready reckoner may limit the observation of clinically and statistically significant results when used for research. However, if it is known that a ready reckoner consistently under or over estimates elements of intake, appropriate adjustments may be made at the practitioner level. Therefore, it may be a useful tool to allow for rapid calculation of nutrient intake, particularly in clinical practice.
An advantage of ready reckoners is that they may be utilised rapidly with minimal training [
1]. A disadvantage is the averaging of nutrients from multiple samples or recipes during their creation, allowing for the potential accumulation of intrinsic error to occur [
4]. Although this was not a validation study whereby authors planned to validate a ready reckoner against computerised dietary analysis, subsequent to this analysis modifications should be made to the ready reckoner to increase the level of agreement between the two methods. Such changes could include more discretion within each descriptor of the menu category—for example specifying “cream-based soup” or “tomato-based soup” rather than “soup”.
There are several limitations within this analysis that should be highlighted. Firstly, the use of the one-quarter method may introduce systematic error in the estimation of food intake. We anticipate that this has not affected the results of either analysis presented here since they were both analysed from the identical dataset. Furthermore, the inter-rater reliability of observers in the use of the ready reckoner was not formally measured although all observers received one full day of training in the study protocol (including estimation of food intake and use of the ready reckoner) prior to the commencement of data collection. This study has only compared the ready reckoner of one health network to computerised dietary analysis and therefore the findings presented may not be representative of all ready reckoners.


