Dietary Magnesium May Be Protective for Aging of Bone and Skeletal Muscle in Middle and Younger Older Age Men and Women: Cross-Sectional Findings from the UK Biobank Cohort


Abstract
:1. Introduction
2. Materials and Methods
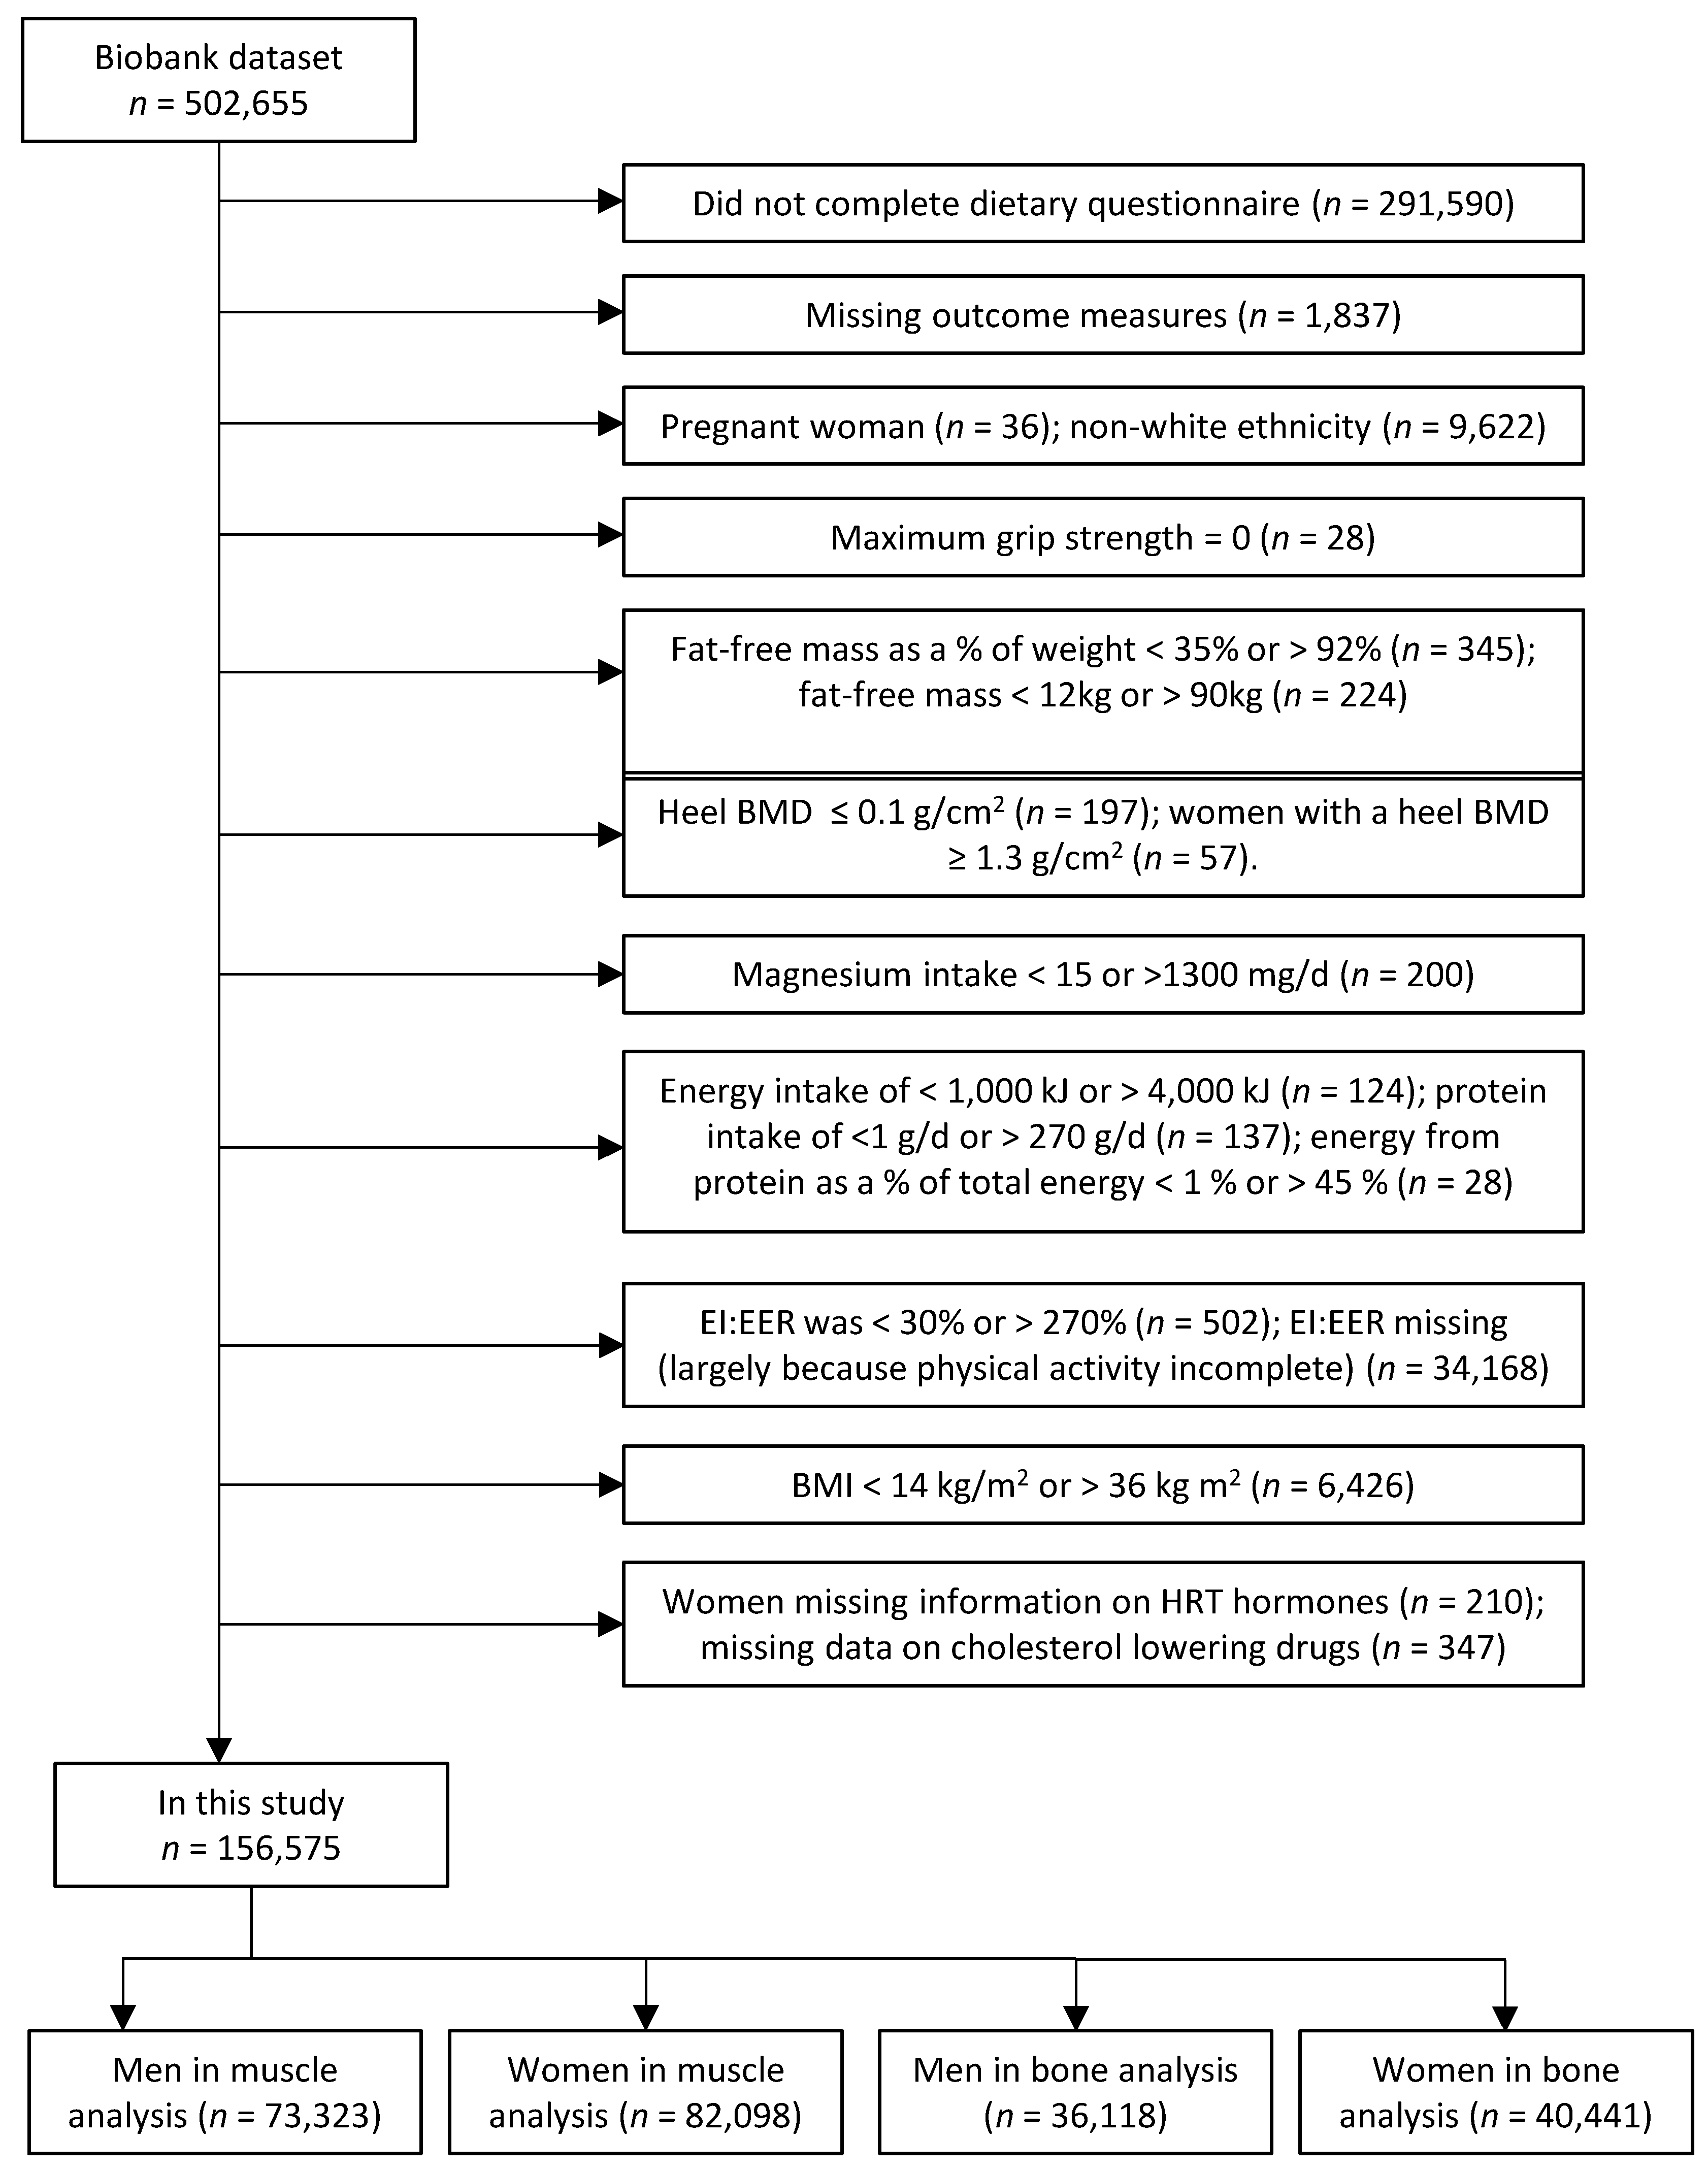
2.1. Study Population
2.2. Measurements of Body Composition Skeletal Muscle Mass, Grip Strength and Bone Density (Outcome Measures)
2.3. Measurement of Magnesium Intake
2.4. Measurement of Confounding Variables
2.5. Study Participants
2.6. Statistical Analysis
3. Results
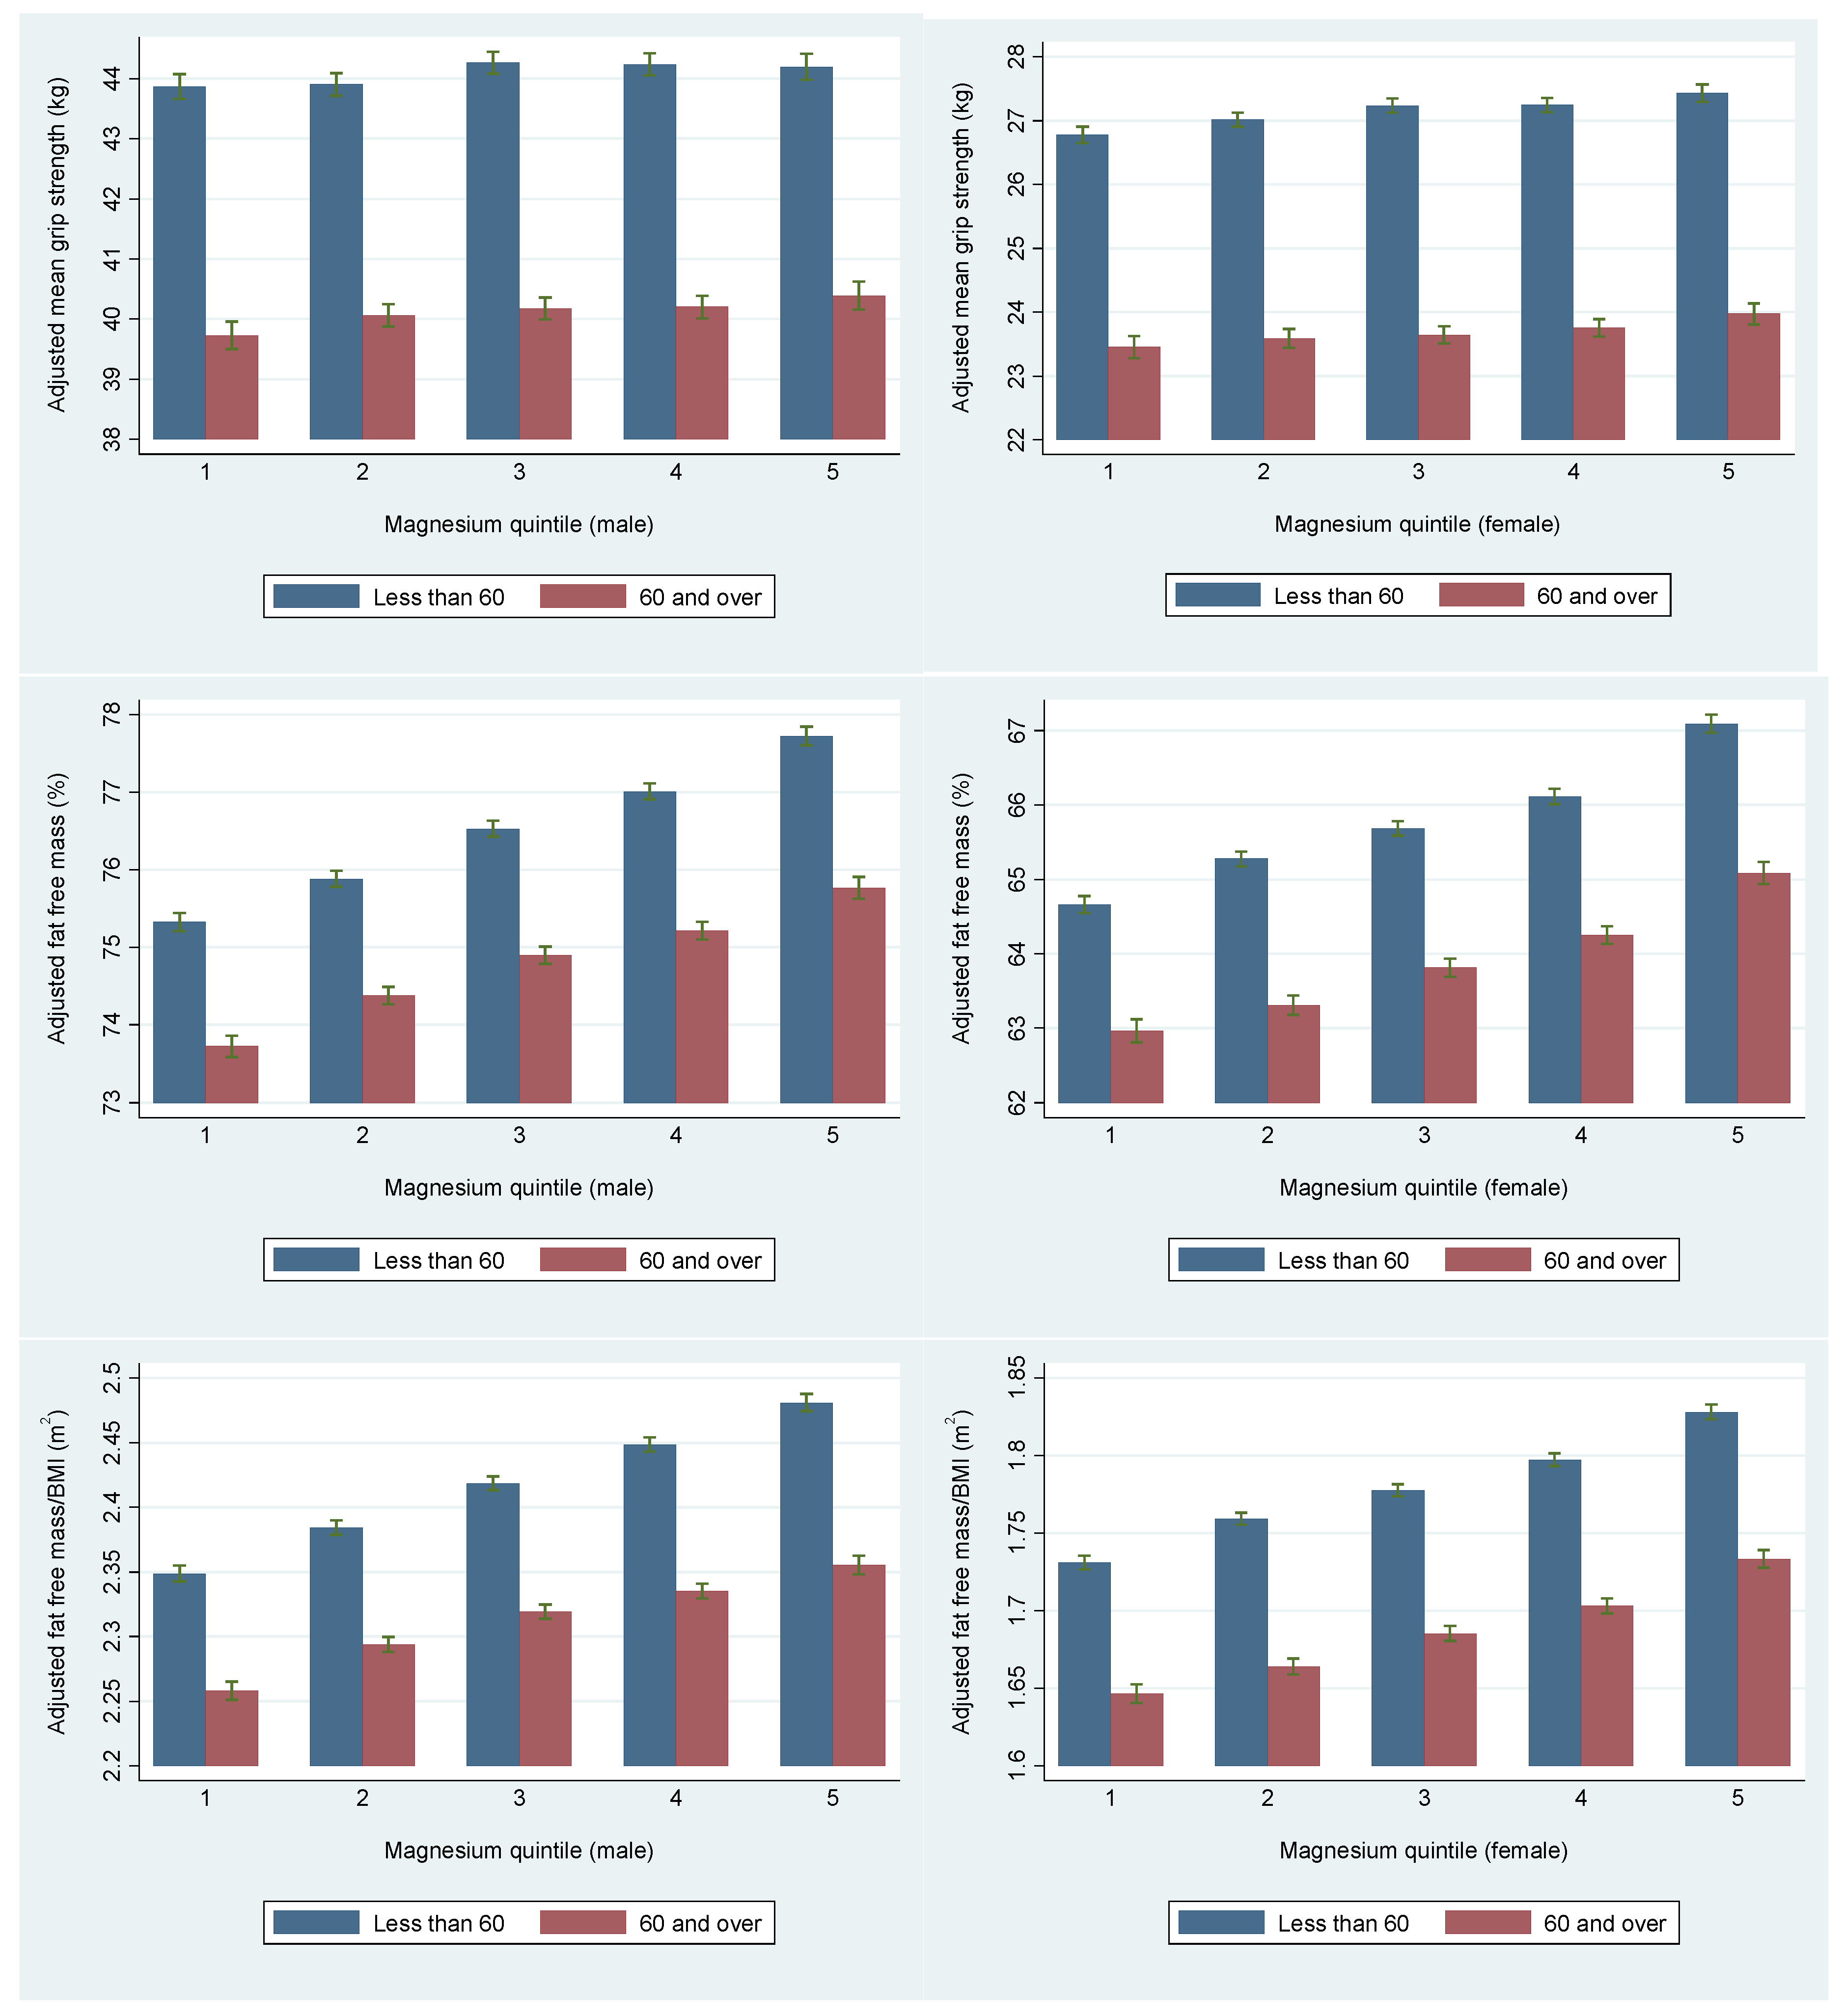
3.1. Grip Strength
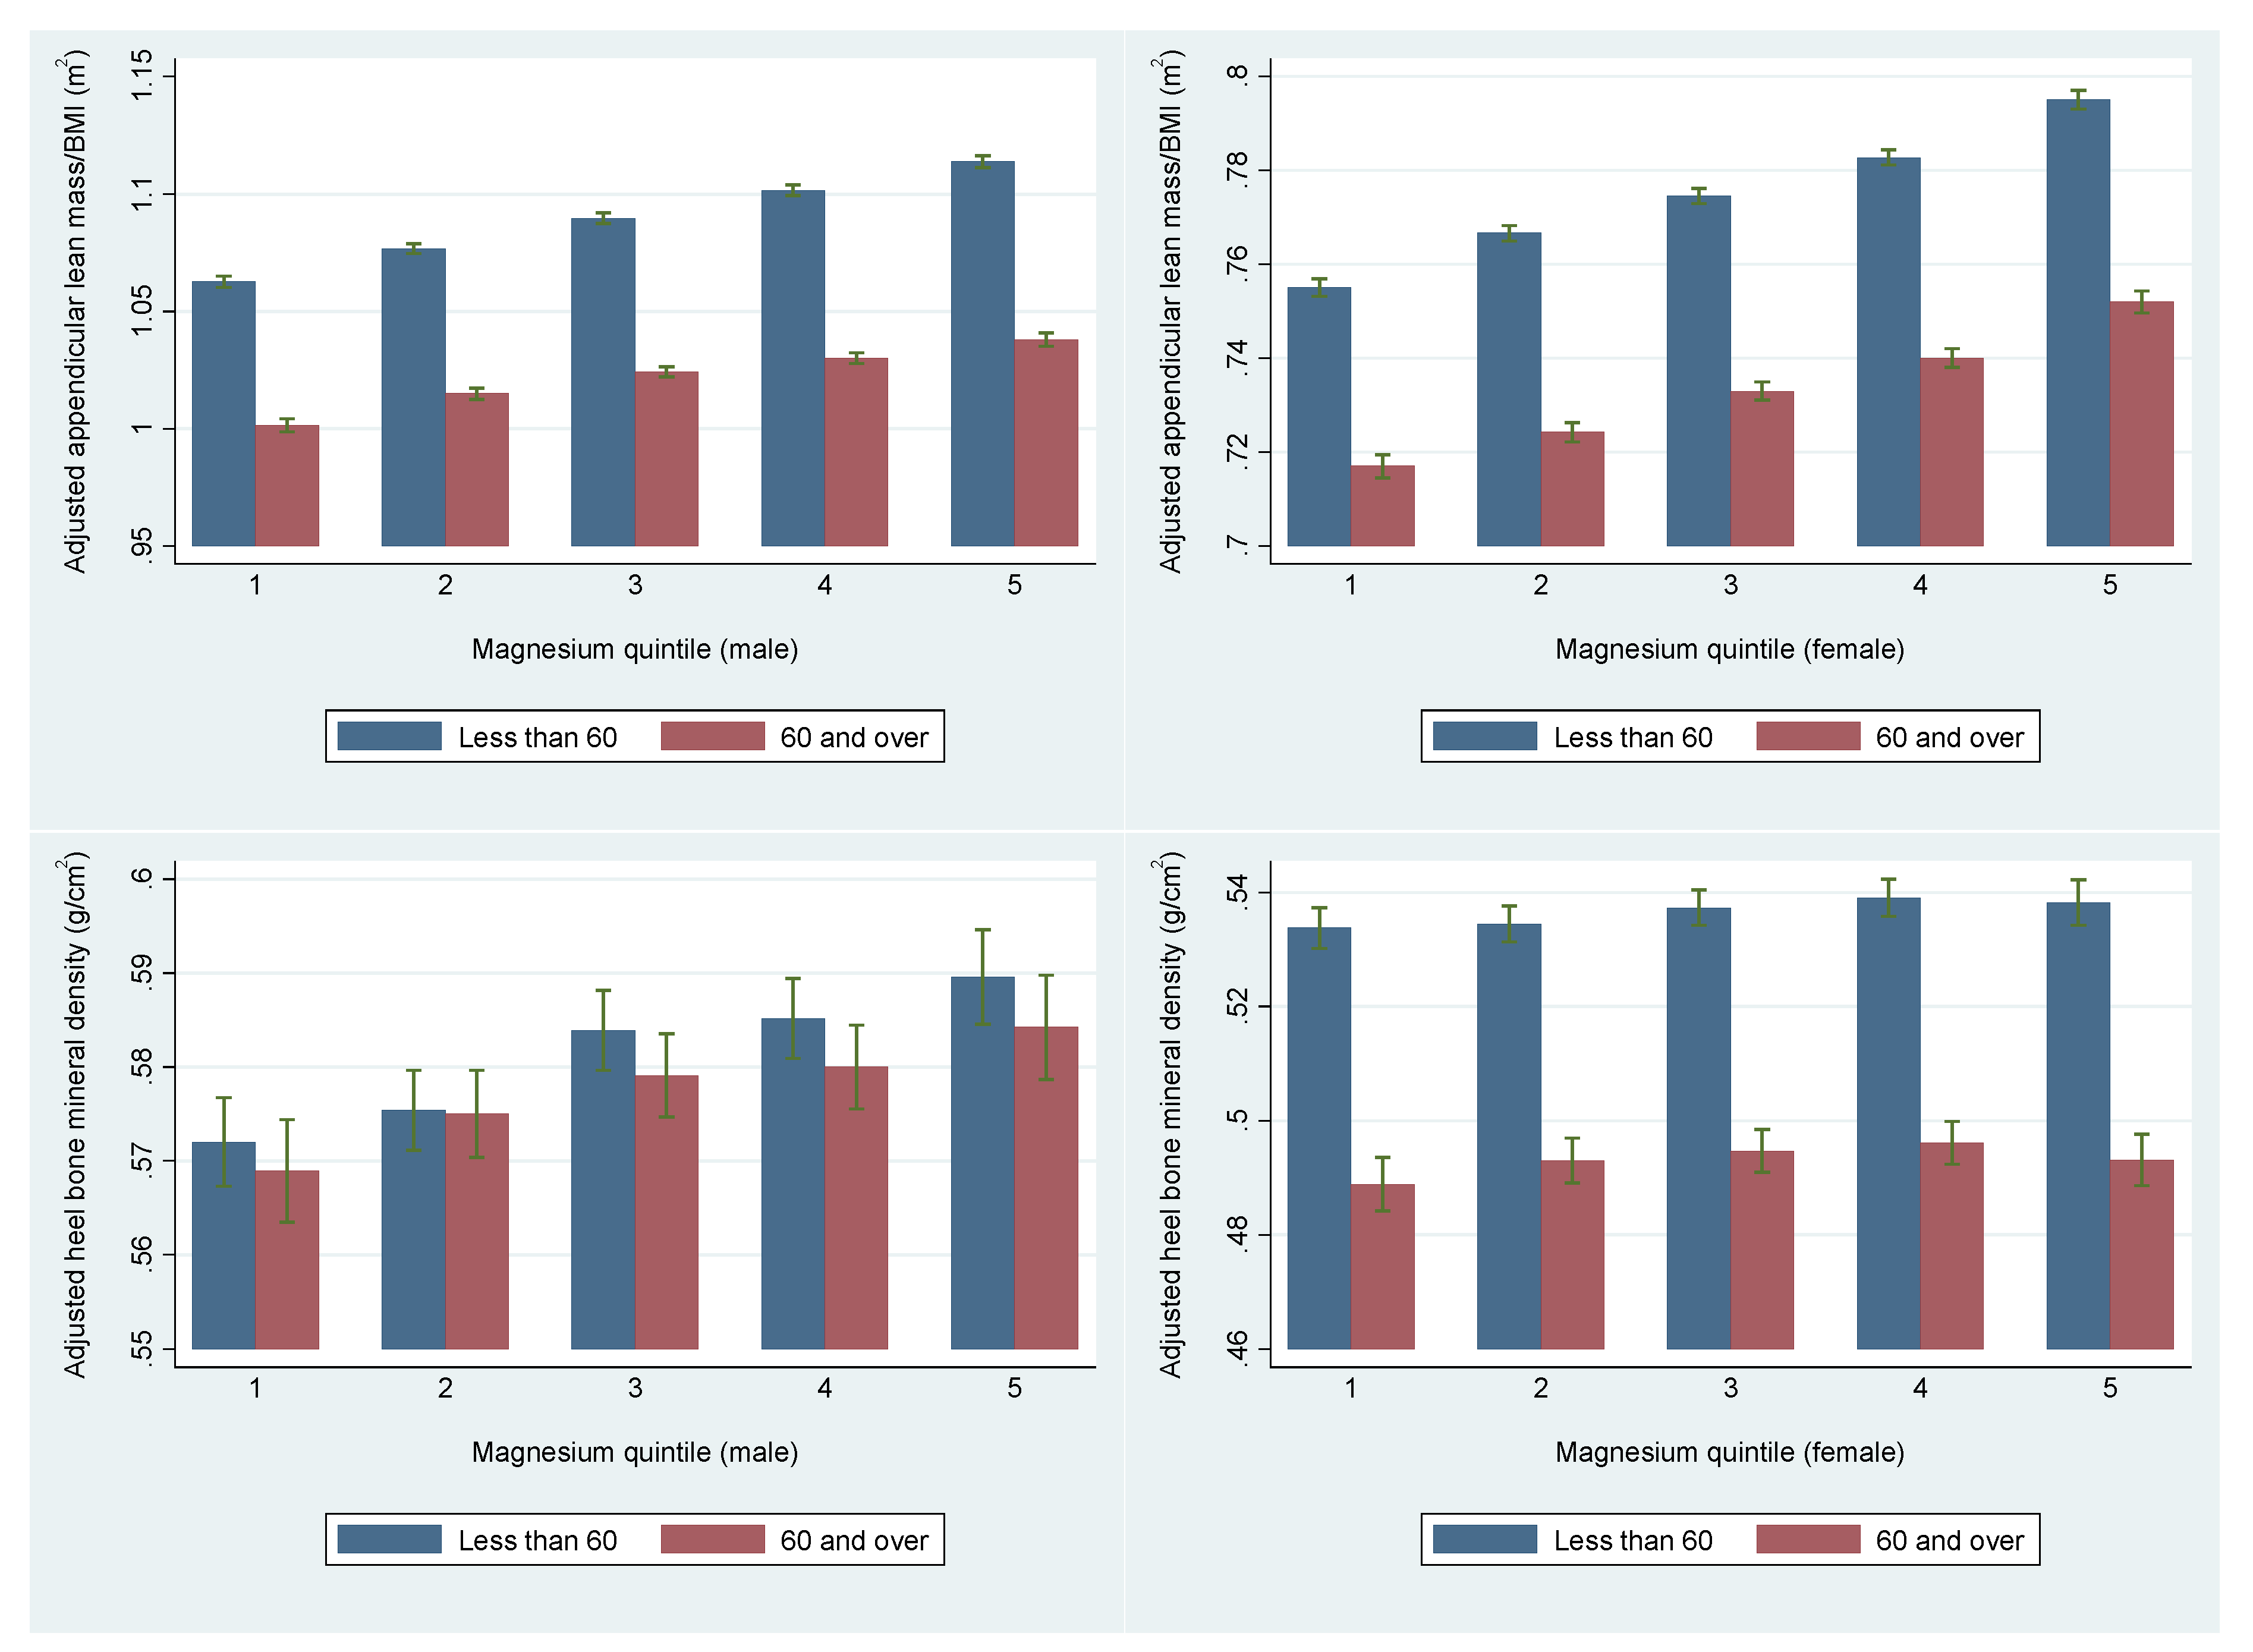
3.2. Indices of Skeletal Muscle Mass
3.3. Bone Mineral Density
3.4. Sensitivity Analysis
4. Discussion
5. Conclusions
Acknowledgments
Author Contributions
Conflicts of Interest
References
- Hernlund, E.; Svedbom, A.; Ivergård, M.; Compston, J.; Cooper, C.; Stenmark, J.; McCloskey, E.V.; Jönsson, B.; Kanis, J.A. Osteoporosis in the European Union: Medical management, epidemiology and economic burden. A report prepared in collaboration with the International Osteoporosis Foundation (IOF) and the European Federation of Pharmaceutical Industry Associations (EFPIA). Arch. Osteoporos. 2013, 8, 136. [Google Scholar] [CrossRef] [PubMed]
- International Osteoporosis Foundation. 2010. Available online: https://www.iofbonehealth.org/facts-statistics#category-14 (accessed on 1 October 2017).
- Kilsby, A.J.; Sayer, A.A.; Witham, M.D. Selecting potential pharmacological interventions in sarcopenia. Drugs Aging 2017, 34, 233–240. [Google Scholar] [CrossRef] [PubMed]
- Cederholm, T.; Cruz-Jentoft, A.J.; Maggi, S. Sarcopenia and fragility fractures. Eur. J. Phys. Rehabil. Med. 2013, 49, 111–117. [Google Scholar] [PubMed]
- Kim, B.J.; Ahn, S.H.; Kim, H.M.; Lee, S.H.; Koh, J.M. Low skeletal muscle mass associates with low femoral neck strength, especially in older Korean women: The Fourth Korea National Health and Nutrition Examination Survey (KNHANES IV). Osteoporos. Int. 2014, 26, 737–747. [Google Scholar] [CrossRef] [PubMed]
- Szulc, P.; Feyt, C.; Chapurlat, R. High risk of fall, poor physical function, and low grip strength in men with fracture-the STRAMBO study. J. Cachexia Sarcopenia Muscle 2016, 7, 299–311. [Google Scholar] [CrossRef] [PubMed]
- Ho, A.W.; Lee, M.M.; Chan, E.W.; Ng, H.M.; Lee, C.W.; Ng, W.S.; Wong, S.H. Prevalence of pre-sarcopenia and sarcopenia in Hong Kong Chinese geriatric patients with hip fracture and its correlation with different factors. Hong Kong Med. J. 2016, 22, 23–29. [Google Scholar] [PubMed]
- Kojima, G. Frailty as a predictor of fractures among community-dwelling older people: A systematic review and meta-analysis. Bone 2016, 90, 116–122. [Google Scholar] [CrossRef] [PubMed]
- Tagliaferri, C.; Wittrant, Y.; Davicco, M.J.; Walrand, S.; Coxam, V. Muscle and bone, two interconnected tissues. Ageing Res. Rev. 2015, 21, 55–70. [Google Scholar] [CrossRef] [PubMed]
- Welch, A.A. Nutritional influences on age-related skeletal muscle loss. Proc. Nutr. Soc. 2014, 73, 16–33. [Google Scholar] [CrossRef] [PubMed]
- Curtis, E.; Litwic, A.; Cooper, C.; Dennison, E. Determinants of Muscle and Bone Aging. J. Cell. Physiol. 2015, 230, 2618–2625. [Google Scholar] [CrossRef] [PubMed]
- Wright, N.C.; Looker, A.C.; Saag, K.G.; Curtis, J.R.; Delzell, E.S.; Randall, S.; Dawson-Hughes, B. The recent prevalence of osteoporosis and low bone mass in the United States based on bone mineral density at the femoral neck or lumbar spine. J. Bone Miner. Res. 2014, 29, 2520–2526. [Google Scholar] [CrossRef] [PubMed]
- Cruz-Jentoft, A.J.; Landi, F.; Schneider, S.M.; Zúñiga, C.; Arai, H.; Boirie, Y.; Chen, L.K.; Fielding, R.A.; Martin, F.C.; Michel, J.P.; et al. Prevalence of and interventions for sarcopenia in ageing adults: A systematic review. Report of the International Sarcopenia Initiative (EWGSOP and IWGS). Age Ageing 2014, 43, 748–759. [Google Scholar] [CrossRef] [PubMed]
- Ethgen, O.; Beaudart, C.; Buckinx, F.; Bruyère, O.; Reginster, J.Y. The future prevalence of sarcopenia in Europe: A claim for public health action. Calcif. Tissue Int. 2017, 100, 229–234. [Google Scholar] [CrossRef] [PubMed]
- Cruz-Jentoft, A.J.; Baeyens, J.P.; Bauer, J.M.; Boirie, Y.; Cederholm, T.; Landi, F.; Martin, F.C.; Michel, J.P.; Rolland, Y.; Schneider, S.M.; et al. Sarcopenia: European consensus on definition and diagnosis: Report of the European working group on sarcopenia in older people. Age Ageing 2010, 39, 412–423. [Google Scholar] [CrossRef] [PubMed]
- Patel, H.P.; Syddall, H.E.; Jameson, K.; Robinson, S.; Denison, H.; Roberts, H.C.; Edwards, M.; Dennison, E.; Cooper, C.; Aihie Sayer, A. Prevalence of sarcopenia in community-dwelling older people in the UK using the European Working Group on Sarcopenia in Older People (EWGSOP) definition: Findings from the Hertfordshire Cohort Study (HCS). Age Ageing 2013, 42, 378–384. [Google Scholar] [CrossRef] [PubMed]
- Mitchell, W.K.; Williams, J.; Atherton, P.; Larvin, M.; Lund, J.; Narici, M. Sarcopenia, dynapenia, and the impact of advancing age on human skeletal muscle size and strength; A quantitative review. Front. Physiol. 2012, 3, 260. [Google Scholar] [CrossRef] [PubMed]
- Skelton, D.A.; Greig, C.A.; Davies, J.M.; Young, A. Strength, power and related functional ability of healthy people aged 65–89 years. Age Ageing 1994, 23, 371–377. [Google Scholar] [CrossRef] [PubMed]
- Malafarina, V.; Uriz-Otano, F.; Iniesta, R.; Gil-Guerrero, L. Effectiveness of nutritional supplementation on muscle mass in treatment of sarcopenia in old age: A systematic review. J. Am. Med. Dir. Assoc. 2013, 14, 10–17. [Google Scholar] [CrossRef] [PubMed]
- Scott, D.; Blizzard, L.; Fell, J.; Giles, G.; Jones, G. Associations between dietary nutrient intake and muscle mass and strength in community-dwelling older adults: The Tasmanian older adult cohort study. J. Am. Geriatr. Soc. 2010, 58, 2129–2134. [Google Scholar] [CrossRef] [PubMed]
- Welch, A.A.; Kelaiditi, E.; Jennings, A.; Steves, C.J.; Spector, T.D.; MacGregor, A. Dietary magnesium is positively associated with skeletal muscle power and indices of muscle mass and may attenuate the association between circulating c-reactive protein and muscle mass in women. J. Bone Miner. Res. 2016, 31, 317–325. [Google Scholar] [CrossRef] [PubMed] [Green Version]
- Robinson, S.M.; Jameson, K.A.; Batelaan, S.F.; Martin, H.J.; Syddall, H.E.; Dennison, E.M.; Cooper, C.; Sayer, A.A. Hertfordshire Cohort Study Group. Diet and its relationship with grip strength in community-dwelling older men and women: The hertfordshire cohort study. J. Am. Geriatr. Soc. 2008, 56, 84–90. [Google Scholar] [CrossRef] [PubMed]
- McLean, R.R.; Mangano, K.M.; Hannan, M.T.; Kiel, D.P.; Sahni, S. dietary protein intake is protective against loss of grip strength among older adults in the framingham offspring cohort. J. Gerontol. A Biol. Sci. Med. Sci. 2016, 71, 356–361. [Google Scholar] [CrossRef] [PubMed]
- Castiglioni, S.; Cazzaniga, A.; Albisetti, W.; Maier, J.A. Magnesium and osteoporosis: Current state of knowledge and future research directions. Nutrients 2013, 5, 3022–3033. [Google Scholar] [CrossRef] [PubMed]
- Hayhoe, R.P.; Lentjes, M.A.; Luben, R.N.; Khaw, K.-T.; Welch, A.A. Dietary magnesium and potassium intakes and circulating magnesium are associated with heel bone ultrasound attenuation and osteoporotic fracture risk in the EPIC-Norfolk cohort study. Am. J. Clin. Nutr. 2015, 102, 376–384. [Google Scholar] [CrossRef] [PubMed] [Green Version]
- Dorup, I.; Clausen, T. Effects of magnesium and zinc deficiencies on growth and protein synthesis in skeletal muscle and the heart. Br. J. Nutr 1991, 66, 493–504. [Google Scholar] [CrossRef] [PubMed]
- Dominguez, L.J.; Barbagallo, M.; Lauretani, F.; Bandinelli, S.; Bos, A.; Corsi, A.M.; Simonsick, E.M.; Ferrucci, L. Magnesium and muscle performance in older persons: The InCHIANTI study. Am. J. Clin. Nutr. 2006, 84, 419–426. [Google Scholar] [PubMed]
- De Baaij, J.H.; Hoenderop, J.G.; Bindels, R.J. Magnesium in man: Implications for health and disease. Physiol. Rev. 2015, 95, 1–46. [Google Scholar] [CrossRef] [PubMed]
- Moslehi, N.; Vafa, M.; Sarrafzadeh, J.; Rahimi-Foroushani, A. Does magnesium supplementation improve body composition and muscle strength in middle-aged overweight women? A double-blind, placebo-controlled, randomized clinical trial. Biol. Trace Elem. Res. 2013, 153, 111–118. [Google Scholar] [CrossRef] [PubMed]
- Veronese, N.; Berton, L.; Carraro, S.; Bolzetta, F.; de Rui, M.; Perissinotto, E.; Toffanello, E.D.; Bano, G.; Pizzato, S.; Miotto, F.; et al. Effect of oral magnesium supplementation on physical performance in healthy elderly women involved in a weekly exercise program: A randomized controlled trial. Am. J. Clin. Nutr. 2014, 100, 974–981. [Google Scholar] [CrossRef] [PubMed]
- Orchard, T.S.; Larson, J.C.; Alghothani, N.; Bout-Tabaku, S.; Cauley, J.A.; Chen, Z.; LaCroix, A.Z.; Wactawski-Wende, J.; Jackson, R.D. Magnesium intake, bone mineral density, and fractures: Results from the women’s health initiative observational study. Am. J. Clin. Nutr. 2014, 99, 926–933. [Google Scholar] [CrossRef] [PubMed]
- Tucker, K.L.; Hannan, M.T.; Chen, H.; Cupples, L.A.; Wilson, P.W.; Kiel, D.P. Potassium, magnesium, and fruit and vegetable intakes are associated with greater bone mineral density in elderly men and women. Am. J. Clin. Nutr. 1999, 69, 727–736. [Google Scholar] [PubMed]
- Kaptoge, S.; Welch, A.; McTaggart, A.; Mulligan, A.; Dalzell, N.; Day, N.E.; Bingham, S.; Khaw, K.T.; Reeve, J. Effects of dietary nutrients and food groups on bone loss from the proximal femur in men and women in the 7th and 8th decades of age. Osteoporos. Int. 2003, 14, 418–428. [Google Scholar] [PubMed]
- Farsinejad-Marj, M.; Saneei, P.; Esmaillzadeh, A. Dietary magnesium intake, bone mineral density and risk of fracture: A systematic review and meta-analysis. Osteoporos. Int. 2016, 27, 1389–1399. [Google Scholar] [CrossRef] [PubMed]
- Fry, A.; Littlejohns, T.J.; Sudlow, C.; Doherty, N.; Adamska, L.; Sprosen, T.; Collins, R.; Allen, N.E. Comparison of sociodemographic and health-related characteristics of UK biobank participants with the general population. Am. J. Epidemiol. 2017. [Google Scholar] [CrossRef] [PubMed]
- Biobank, U.K. Grip Strength Measurement Version 1.0 15th April 2011. 2017 [cited 2017 12/2/17].
- Spruit, M.A.; Sillen, M.J.; Groenen, M.T.; Wouters, E.F.; Franssen, F.M. New normative values for handgrip strength: results from the UK Biobank. J. Am. Med. Dir. Assoc. 2013, 14, 775.e5–775.e11. [Google Scholar] [CrossRef] [PubMed]
- Franssen, F.M.; Rutten, E.P.; Groenen, M.T.; Vanfleteren, L.E.; Wouters, E.F.; Spruit, M.A. New reference values for body composition by bioelectrical impedance analysis in the general population: Results from the UK biobank. J. Am. Med. Dir. Assoc. 2014, 15, 448.e1–448.e6. [Google Scholar] [CrossRef] [PubMed]
- Kyle, U.G.; Schutz, Y.; Dupertuis, Y.M.; Pichard, C. Body composition interpretation: Contributions of the fat-free mass index and the body fat mass index. Nutrition 2003, 19, 597–604. [Google Scholar] [CrossRef]
- Studenski, S.A.; Peters, K.W.; Alley, D.E.; Cawthon, P.M.; McLean, R.R.; Harris, T.B.; Ferrucci, L.; Guralnik, J.M.; Fragala, M.S.; Kenny, A.M.; et al. The FNIH sarcopenia project: Rationale, study description, conference recommendations, and final estimates. J. Gerontol. Ser. A Biol. Sci. Med. Sci. 2014, 69, 547–558. [Google Scholar] [CrossRef] [PubMed]
- Biobank, U.K. Bone Densitometry, the UK Biobank. 2011. Available online: https://biobank.ctsu.ox.ac.uk/crystal/docs/Ultrasoundbonedensitometry.pdf (accessed on 31 March 2017).
- Galante, J.; Adamska, L.; Young, A.; Young, H.; Littlejohns, T.J.; Gallacher, J.; Allen, N. The acceptability of repeat Internet-based hybrid diet assessment of previous 24-h dietary intake: Administration of the Oxford WebQ in UK Biobank. Br. J. Nutr. 2016, 115, 681–686. [Google Scholar] [CrossRef] [PubMed]
- Liu, B.; Young, H.; Crowe, F.L.; Benson, V.S.; Spencer, E.A.; Key, T.J.; Appleby, P.N.; Beral, V. Development and evaluation of the Oxford WebQ, a low-cost, web-based method for assessment of previous 24 h dietary intakes in large-scale prospective studies. Public Health Nutr. 2011, 14, 1998–2005. [Google Scholar] [CrossRef] [PubMed]
- Guo, W.; Bradbury, K.E.; Reeves, G.K.; Key, T.J. Physical activity in relation to body size and composition in women in UK Biobank. Ann. Epidemiol. 2015, 25, 406–413. [Google Scholar] [CrossRef] [PubMed]
- Institute of Medecine. Dietary Reference Values for Energy, Carbohydrate, Fiber, Fat, Fatty Acids, Cholesterol, Protein and Amino Acids: Food and Nutrition Board; National Academy Press: Washington, DC, USA, 2002. [Google Scholar]
- Chaston, T.B.; Dixon, J.B.; O’Brien, P.E. Changes in fat-free mass during significant weight loss: A systematic review. Int. J. Obes. 2007, 31, 743–750. [Google Scholar] [CrossRef] [PubMed]
- Rochester, D.F.; Esau, S.A. Malnutrition and the respiratory system. Chest 1984, 85, 411–415. [Google Scholar] [CrossRef] [PubMed]
- Lucchesi, A.; Ardini, M.; Donadio, E.; Rizzo, G.; Donadio, C. Nutritional status in renal transplant recipients, evaluated by means of body composition analysis. Transpl. Proc. 2001, 33, 3398–3399. [Google Scholar] [CrossRef]
- Committee on Medical Aspects of Food Policy. Panel on Dietary Reference, V. and H. Great Britain. Dept. of, Dietary reference values for food energy and nutrients for the United Kingdom . In Report of the Panel on Dietary Reference Values of the Committee on Medical Aspects of Food Policy. Report on Health and Social Subjects; HMSO: London, UK, 1991. [Google Scholar]
- EFSA. Scientific Opinion on Dietary Reference Values for magnesium. EFSA J. 2015, 13, 63. [Google Scholar]
- England, P.H. The National Diet and Nutrition Survey Years 5 & 6 Combined. Available online: https://www.gov.uk/government/collections/national-diet-and-nutrition-survey (accessed on 24 April 2017).
- Welch, A.A.; Fransen, H.; Jenab, M.; Boutron-Ruault, M.C.; Tumino, R.; Agnoli, C.; Ericson, U.; Johansson, I.; Ferrari, P.; Engeset, D.; et al. Variation in intakes of calcium, phosphorus, magnesium, iron and potassium in 10 countries in the European prospective investigation into cancer and nutrition study. Eur. J. Clin. Nutr. 2009, 63, S101–S121. [Google Scholar] [CrossRef] [PubMed]
- Dey, D.K.; Bosaeus, I.; Lissner, L.; Steen, B. Changes in body composition and its relation to muscle strength in 75-year-old men and women: A 5-year prospective follow-up study of the NORA cohort in Goteborg, Sweden. Nutrition 2009, 25, 613–619. [Google Scholar] [CrossRef] [PubMed]
- Koster, A.; Ding, J.; Stenholm, S.; Caserotti, P.; Houston, D.K.; Nicklas, B.J.; You, T.; Lee, J.S.; Visser, M.; Newman, A.B.; et al. Does the amount of fat mass predict age-related loss of lean mass, muscle strength, and muscle quality in older adults? J. Gerontol. Ser. A Biol. Sci. Med. Sci. 2011, 66, 888–895. [Google Scholar] [CrossRef] [PubMed]
- Ayuk, J.; Gittoes, N.J. Contemporary view of the clinical relevance of magnesium homeostasis. Ann. Clin. Biochem. 2014, 51, 179–188. [Google Scholar] [CrossRef] [PubMed]
- Cawthon, P.M. Assessment of lean mass and physical performance in sarcopenia. J. Clin. Densitom. 2015, 18, 467–471. [Google Scholar] [CrossRef] [PubMed]
- England, P.H. The Eatwell Guide. Available online: https://www.gov.uk/government/publications/the-eatwell-guide (accessed on 31 March 2016).
- Bingham, S.A.; Welch, A.A.; McTaggart, A.; Mulligan, A.A.; Runswick, S.A.; Luben, R.; Oakes, S.; Khaw, K.T.; Wareham, N.; Day, N.E. Nutritional methods in the European prospective investigation of cancer in Norfolk. Public Health Nutr. 2001, 4, 847–858. [Google Scholar] [CrossRef] [PubMed]
- De Vries, J.H.; de Groot, L.C.; van Staveren, W.A. Dietary assessment in elderly people: experiences gained from studies in the Netherlands. Eur. J. Clin. Nutr. 2009, 63, S69–S74. [Google Scholar] [CrossRef] [PubMed]
- Ramel, A.; Geirsdottir, O.G.; Arnarson, A.; Thorsdottir, I. Regional and total body bioelectrical impedance analysis compared with DXA in Icelandic elderly. Eur. J. Clin. Nutr. 2011, 65, 978–983. [Google Scholar] [CrossRef] [PubMed] [Green Version]
- Yamada, Y.; Buehring, B.; Krueger, D.; Anderson, R.M.; Schoeller, D.A.; Binkley, N. Electrical properties assessed by bioelectrical impedance spectroscopy as biomarkers of age-related loss of skeletal muscle quantity and quality. J. Gerontol. A Biol. Sci. Med. Sci. 2017, 72, 1180–1186. [Google Scholar] [CrossRef] [PubMed]
- Khaw, K.T.; Reeve, J.; Luben, R.; Bingham, S.; Welch, A.; Wareham, N.; Oakes, S.; Day, N. Prediction of total and hip fracture risk in men and women by quantitative ultrasound of the calcaneus: EPIC-Norfolk prospective population study. Lancet 2004, 363, 197–202. [Google Scholar] [CrossRef]
- Welch, A.; Camus, J.; Dalzell, N.; Oakes, S.; Reeve, J.; Khaw, K.T. Broadband ultrasound attenuation (BUA) of the heel bone and its correlates in men and women in the EPIC-Norfolk cohort: A cross-sectional population-based study. Osteoporos. Int. 2004, 15, 217–225. [Google Scholar] [CrossRef] [PubMed]
- Wareham, N.J.; Jakes, R.W.; Rennie, K.L.; Schuit, J.; Mitchell, J.; Hennings, S.; Day, N.E. Validity and repeatability of a simple index derived from the short physical activity questionnaire used in the European Prospective Investigation into Cancer and Nutrition (EPIC) study. Public Health Nutr. 2003, 6, 407–413. [Google Scholar] [CrossRef] [PubMed] [Green Version]


| Characteristics | Men | Women | ||
|---|---|---|---|---|
| Muscle Measures Group (n = 73,323) | BMD Group (n = 36,118) | Muscle Measures Group (n = 82,098) | BMD Group (n = 40,441) | |
| Age (years) | 56.7 (8.0) | 57.0 (8.1) | 55.5 (7.8) | 56.0 (8.0) |
| BMI (kg/m2) | 27.0 (3.4) | 27.1 (3.4) | 25.7 (3.8) | 25.8 (3.8) |
| Weight (kg) | 84.4 (11.9) | 84.7 (12.0) | 68.7 (10.9) | 68.9 (10.9) |
| Height (cm) | 176.7 (6.6) | 176.7 (6.6) | 163.6 (6.1) | 163.6 (6.1) |
| Hand-grip strength (kg) | 42.3 (8.6) | 41.3 (8.5) | 25.9 (6.2) | 25.1 (6.1) |
| Fat-free mass (FFM%) | 75.7 (5.3) | 75.5 (5.3) | 65.1 (6.4) | 64.7 (6.3) |
| FFMBMI | 2.37 (0.26) | 2.36 (0.26) | 1.74 (0.21) | 1.73 (0.21) |
| ALMBMI | 1.06 (0.11) | 1.06 (0.11) | 0.76 (0.09) | 0.76 (0.09) |
| Heel bone density (g/cm2) | 0.580 (0.131) | 0.579 (0.132) | 0.519 (0.114) | 0.519 (0.114) |
| Magnesium (mg/day) | 371 (109) | 371 (111) | 335 (95) | 334 (97) |
| Energy intake (kcal/day) | 2301 (637) | 2307 (651) | 1967 (530) | 1960 (538) |
| Protein (g/day) | 87.3 (25.9) | 87.4 (26.5) | 78.3 (22.1) | 78.0 (22.5) |
| Protein % energy | 15.7 (3.4) | 15.6 (3.5) | 16.5 (3.7) | 16.5 (3.7) |
| Misreporting (EI:EER, %) | 89.8 (25.9) | 89.7 (26.3) | 103.6 (29.0) | 103.0 (29.2) |
| No. of food recalls used | 2.19 (1.18) | 2.18 (1.27) | 2.24 (1.19) | 2.25 (1.29) |
| Physical activity | ||||
| low % (n) | 24.1 (17,637) | 23.0 (8292) | 23.1 (18,943) | 21.5 (8690) |
| moderate % (n) | 54.5 (39,978) | 53.6 (19,350) | 56.8 (46,662) | 56.3 (22,747) |
| high % (n) | 21.4 (15,708) | 23.5 (8476) | 20.1 (16,493) | 22.3 (9004) |
| Smoking status | ||||
| never % (n) | 51.9 (38,024) | 51.0 (18,404) | 60.0 (49,258) | 59.2 (23,931) |
| previous % (n) | 39.3 (28,788) | 39.6 (14,318) | 33.4 (27,422) | 33.8 (13,673) |
| current % (n) | 8.9 (6511) | 9.4 (3396) | 6.6 (5418) | 7.0 (2837) |
| Cholesterol-lowering drug % (n) | 20.5 (14,994) | 22.3 (8037) | 8.8 (7183) | 9.8 (3961) |
| Hormone-replacement therapy % (n) | 7.7 (6340) | 7.6 (3065) | ||
| Menopause % (n) | 69.4 (56,956) | 71.2 (28,782) | ||
| MEN | Model | Q1 (n = 14,645) | Q2 (n = 14,683) | Q3 (n = 14,667) | Q4 (n = 14,672) | Q5 (n = 14,656) | Diff Q5-Q1 | Q5-Q1/Q1 % | p-trend |
| Magnesium intake (mg/day) | 238 ± 37 | 311 ± 15 | 359 ± 14 | 413 ± 18 | 532 ± 87 | 294 | 124 | ||
| Grip strength (kg) | 1 | 41.9 ± 8.7 | 42.0 ± 8.4 | 42.3 ± 8.4 | 42.5 ± 8.5 | 42.9 ± 8.6 | 1.0 | 2.31 | <0.001 |
| 2 | 42.0 ± 0.08 | 42.2 ± 0.07 | 42.4 ± 0.07 | 42.4 ± 0.07 | 42.5 ± 0.08 | 0.5 | 1.09 | <0.001 | |
| Fat free mass (%) | 1 | 74.7 ± 5.2 | 75.3 ± 5.1 | 75.9 ± 5.2 | 76.2 ± 5.3 | 76.7 ± 5.5 | 2.0 | 2.69 | <0.001 |
| 2 | 74.6 ± 0.05 | 75.2 ± 0.04 | 75.8 ± 0.04 | 76.2 ± 0.04 | 76.9 ± 0.05 | 2.2 | 3.01 | <0.001 | |
| Fat free massBMI | 1 | 2.31 ± 0.24 | 2.34 ± 0.25 | 2.37 ± 0.25 | 2.40 ± 0.26 | 2.43 ± 0.26 | 0.1 | 5.23 | <0.001 |
| 2 | 2.31 ± 0.002 | 2.34 ± 0.002 | 2.37 ± 0.002 | 2.40 ± 0.002 | 2.43 ± 0.002 | 0.1 | 5.10 | <0.001 | |
| Appendicular lean massBMI | 1 | 1.04 ± 0.10 | 1.05 ± 0.10 | 1.06 ± 0.11 | 1.07 ± 0.11 | 1.08 ± 0.11 | 0.05 | 4.50 | <0.001 |
| 2 | 1.04 ± 0.001 | 1.05 ± 0.001 | 1.06 ± 0.001 | 1.07 ± 0.001 | 1.08 ± 0.001 | 0.05 | 4.37 | <0.001 | |
| Q1 (n = 7426) | Q2 (n = 7112) | Q3 (n = 7000) | Q4 (n = 7194) | Q5 (n = 7386) | |||||
| Heel bone mineral density (g/cm2) | 1 | 0.574 ± 0.133 | 0.577 ± 0.129 | 0.581 ± 0.132 | 0.582 ± 0.133 | 0.584 ± 0.131 | 0.01 | 1.61 | <0.001 |
| 2 | 0.570 ± 0.002 | 0.575 ± 0.002 | 0.582 ± 0.002 | 0.583 ± 0.002 | 0.587 ± 0.002 | 0.02 | 2.94 | <0.001 | |
| WOMEN | Model | Q1 (n = 16,434) | Q2 (n = 16,389) | Q3 (n = 16,429) | Q4 (n = 16,424) | Q5 (n = 16,422) | Diff Q5-Q1 | Q5-Q1/Q1 % | p-trend |
| Magnesium intake (mg/day) | 217 ± 34 | 283 ± 13 | 326 ± 12 | 373 ± 16 | 476 ± 75 | 259 | 119 | ||
| Grip strength (kg) | 1 | 25.6 ± 6.2 | 25.7 ± 6.1 | 25.9 ± 6.1 | 26.0 ± 6.2 | 26.1 ± 6.2 | 0.6 | 2.25 | <0.001 |
| 2 | 25.5 ± 0.05 | 25.7 ± 0.05 | 25.9 ± 0.04 | 26.0 ± 0.04 | 26.2 ± 0.05 | 0.6 | 2.40 | <0.001 | |
| Fat free mass (%) | 1 | 64.4 ± 6.3 | 64.7 ± 6.2 | 65.1 ± 6.3 | 65.3 ± 6.3 | 65.9 ± 6.6 | 1.5 | 2.39 | <0.001 |
| 2 | 64.0 ± 0.05 | 64.6 ± 0.04 | 65.0 ± 0.04 | 65.4 ± 0.04 | 66.3 ± 0.05 | 2.3 | 3.62 | <0.001 | |
| Fat free massBMI | 1 | 1.71 ± 0.21 | 1.73 ± 0.21 | 1.74 ± 0.21 | 1.76 ± 0.21 | 1.78 ± 0.22 | 0.1 | 4.46 | <0.001 |
| 2 | 1.70 ± 0.002 | 1.72 ± 0.002 | 1.74 ± 0.002 | 1.76 ± 0.002 | 1.79 ± 0.002 | 0.1 | 5.52 | <0.001 | |
| Appendicular Lean MassBMI | 1 | 0.74 ± 0.09 | 0.75 ± 0.09 | 0.76 ± 0.09 | 0.77 ± 0.09 | 0.78 ± 0.09 | 0.03 | 4.20 | <0.001 |
| 2 | 0.74 ± 0.001 | 0.75 ± 0.001 | 0.76 ± 0.001 | 0.77 ± 0.001 | 0.78 ± 0.001 | 0.04 | 5.18 | <0.001 | |
| Q1 (n = 8302) | Q2 (n = 8092) | Q3 (n = 8046) | Q4 (n = 7941) | Q5 (n = 8060) | |||||
| Heel bone mineral density (g/cm2) | 1 | 0.519 ± 0.113 | 0.519 ± 0.114 | 0.520 ± 0.112 | 0.520 ± 0.115 | 0.517 ± 0.115 | 0.00 | −0.56 | 0.189 |
| 2 | 0.516 ± 0.001 | 0.518 ± 0.001 | 0.520 ± 0.001 | 0.522 ± 0.001 | 0.520 ± 0.002 | 0.00 | 0.85 | 0.031 |
| MEN | Subjects Age < 60 Age ≥ 60 | Q1 (n = 8597) (n = 6048) | Q2 (n = 8063) (n = 6620) | Q3 (n = 7841) (n = 6826) | Q4 (n = 7973) (n = 6699) | Q5 (n = 8292) (n = 6364) | Diff Q5-Q1 | Q5-Q1/Q1 % | p-trend |
| Magnesium intake (mg/day) | Age < 60 | 237 ± 37 | 310 ± 15 | 359 ± 14 | 413 ± 18 | 535 ± 90 | 298 | 126 | |
| Age ≥ 60 | 240 ± 36 | 311 ± 15 | 359 ± 14 | 413 ± 18 | 529 ± 84 | 289 | 120 | ||
| Grip strength (kg) | Age < 60 | 43.9 ± 0.10 | 43.9 ± 0.09 | 44.3 ± 0.09 | 44.2 ± 0.09 | 44.2 ± 0.11 | 0.3 | 0.75 | 0.021 |
| Age ≥ 60 | 39.7 ± 0.12 | 40.1 ± 0.10 | 40.2 ± 0.09 | 40.2 ± 0.09 | 40.4 ± 0.12 | 0.7 | 1.67 | 0.001 | |
| Fat free mass (%) | Age < 60 | 75.3 ± 0.06 | 75.9 ± 0.05 | 76.5 ± 0.05 | 77.0 ± 0.05 | 77.7 ± 0.06 | 2.4 | 3.19 | <0.001 |
| Age ≥ 60 | 73.7 ± 0.07 | 74.4 ± 0.06 | 74.9 ± 0.06 | 75.2 ± 0.06 | 75.8 ± 0.07 | 2.0 | 2.77 | <0.001 | |
| Fat free massBMI | Age < 60 | 2.35 ± 0.003 | 2.38 ± 0.003 | 2.42 ± 0.003 | 2.45 ± 0.003 | 2.48 ± 0.003 | 0.1 | 5.64 | <0.001 |
| Age ≥ 60 | 2.26 ± 0.004 | 2.29 ± 0.003 | 2.32 ± 0.003 | 2.34 ± 0.003 | 2.36 ± 0.004 | 0.1 | 4.31 | <0.001 | |
| Appendicular Lean MassBMI | Age < 60 | 1.06 ± 0.001 | 1.08 ± 0.001 | 1.09 ± 0.001 | 1.10 ± 0.001 | 1.11 ± 0.001 | 0.05 | 4.82 | <0.001 |
| Age ≥ 60 | 1.00 ± 0.001 | 1.01 ± 0.001 | 1.02 ± 0.001 | 1.03 ± 0.001 | 1.04 ± 0.001 | 0.04 | 3.66 | <0.001 | |
| Subjects Age < 60 Age ≥ 60 | Q1 (n = 4146) (n = 3280) | Q2 (n = 3732) (n = 3380) | Q3 (n = 3569) (n = 3431) | Q4 (n = 3672) (n = 3522) | Q5 (n = 3938) (n = 3448) | ||||
| Heel bone mineral density (g/cm2) | Age < 60 | 0.572 ± 0.002 | 0.575 ± 0.002 | 0.584 ± 0.002 | 0.585 ± 0.002 | 0.590 ± 0.003 | 0.02 | 3.07 | <0.001 |
| Age ≥ 60 | 0.569 ± 0.003 | 0.575 ± 0.002 | 0.579 ± 0.002 | 0.580 ± 0.002 | 0.584 ± 0.003 | 0.02 | 2.69 | 0.001 | |
| WOMEN | Subjects Age < 60 Age ≥ 60 | Q1 (n = 11,128) (n = 5306) | Q2 (n = 10,440) (n = 5949) | Q3 (n = 10,305) (n = 6124) | Q4 (n = 10,051) (n = 6373) | Q5 (n = 9799) (n = 6623) | Diff Q5-Q1 | Q5-Q1/Q1 % | p-trend |
| Magnesium intake (mg/day) | Age < 60 | 216 ± 35 | 283 ± 13 | 326 ± 12 | 373 ± 16 | 476 ± 76 | 260 | 120 | |
| Age ≥ 60 | 219 ± 32 | 283 ± 13 | 326 ± 12 | 373 ± 16 | 475 ± 75 | 256 | 117 | ||
| Grip strength (kg) | Age < 60 | 26.8 ± 0.06 | 27.0 ± 0.06 | 27.2 ± 0.06 | 27.2 ± 0.06 | 27.4 ± 0.07 | 0.7 | 2.46 | <0.001 |
| Age ≥ 60 | 23.5 ± 0.09 | 23.6 ± 0.07 | 23.6 ± 0.07 | 23.8 ± 0.07 | 24.0 ± 0.08 | 0.5 | 2.21 | <0.001 | |
| Fat free mass (%) | Age < 60 | 64.7 ± 0.06 | 65.3 ± 0.05 | 65.7 ± 0.05 | 66.1 ± 0.05 | 67.1 ± 0.06 | 2.4 | 3.76 | <0.001 |
| Age ≥ 60 | 63.0 ± 0.08 | 63.3 ± 0.07 | 63.8 ± 0.06 | 64.3 ± 0.06 | 65.1 ± 0.07 | 2.1 | 3.37 | <0.001 | |
| Fat free massBMI | Age < 60 | 1.73 ± 0.002 | 1.76 ± 0.002 | 1.78 ± 0.002 | 1.80 ± 0.002 | 1.83 ± 0.003 | 0.1 | 5.62 | <0.001 |
| Age ≥ 60 | 1.65 ± 0.003 | 1.66 ± 0.003 | 1.69 ± 0.002 | 1.70 ± 0.002 | 1.73 ± 0.003 | 0.1 | 5.28 | <0.001 | |
| Appendicular Lean MassBMI | Age < 60 | 0.76 ± 0.001 | 0.77 ± 0.001 | 0.77 ± 0.001 | 0.78 ± 0.001 | 0.80 ± 0.001 | 0.04 | 5.30 | <0.001 |
| Age ≥ 60 | 0.72 ± 0.001 | 0.72 ± 0.001 | 0.73 ± 0.001 | 0.74 ± 0.001 | 0.75 ± 0.001 | 0.04 | 4.89 | <0.001 | |
| Subjects Age < 60 Age ≥ 60 | Q1 (n = 5325) (n = 2977) | Q2 (n = 4874) (n = 3218) | Q3 (n = 4754) (n = 3292) | Q4 (n = 4597) (n = 3344) | Q5 (n = 4550) (n = 3510) | ||||
| Heel bone mineral density (g/cm2) | Age < 60 | 0.534 ± 0.002 | 0.535 ± 0.002 | 0.537 ± 0.002 | 0.539 ± 0.002 | 0.538 ± 0.002 | 0.00 | 0.83 | 0.070 |
| Age ≥ 60 | 0.489 ± 0.002 | 0.493 ± 0.002 | 0.495 ± 0.002 | 0.496 ± 0.002 | 0.493 ± 0.002 | 0.00 | 0.87 | 0.256 |
© 2017 by the authors. Licensee MDPI, Basel, Switzerland. This article is an open access article distributed under the terms and conditions of the Creative Commons Attribution (CC BY) license (http://creativecommons.org/licenses/by/4.0/).
Share and Cite
Welch, A.A.; Skinner, J.; Hickson, M. Dietary Magnesium May Be Protective for Aging of Bone and Skeletal Muscle in Middle and Younger Older Age Men and Women: Cross-Sectional Findings from the UK Biobank Cohort. Nutrients 2017, 9, 1189. https://doi.org/10.3390/nu9111189
Welch AA, Skinner J, Hickson M. Dietary Magnesium May Be Protective for Aging of Bone and Skeletal Muscle in Middle and Younger Older Age Men and Women: Cross-Sectional Findings from the UK Biobank Cohort. Nutrients. 2017; 9(11):1189. https://doi.org/10.3390/nu9111189
Chicago/Turabian StyleWelch, Ailsa A., Jane Skinner, and Mary Hickson. 2017. "Dietary Magnesium May Be Protective for Aging of Bone and Skeletal Muscle in Middle and Younger Older Age Men and Women: Cross-Sectional Findings from the UK Biobank Cohort" Nutrients 9, no. 11: 1189. https://doi.org/10.3390/nu9111189