Dietary Patterns and Pancreatic Cancer Risk: A Meta-Analysis


Abstract
:1. Introduction
2. Methods
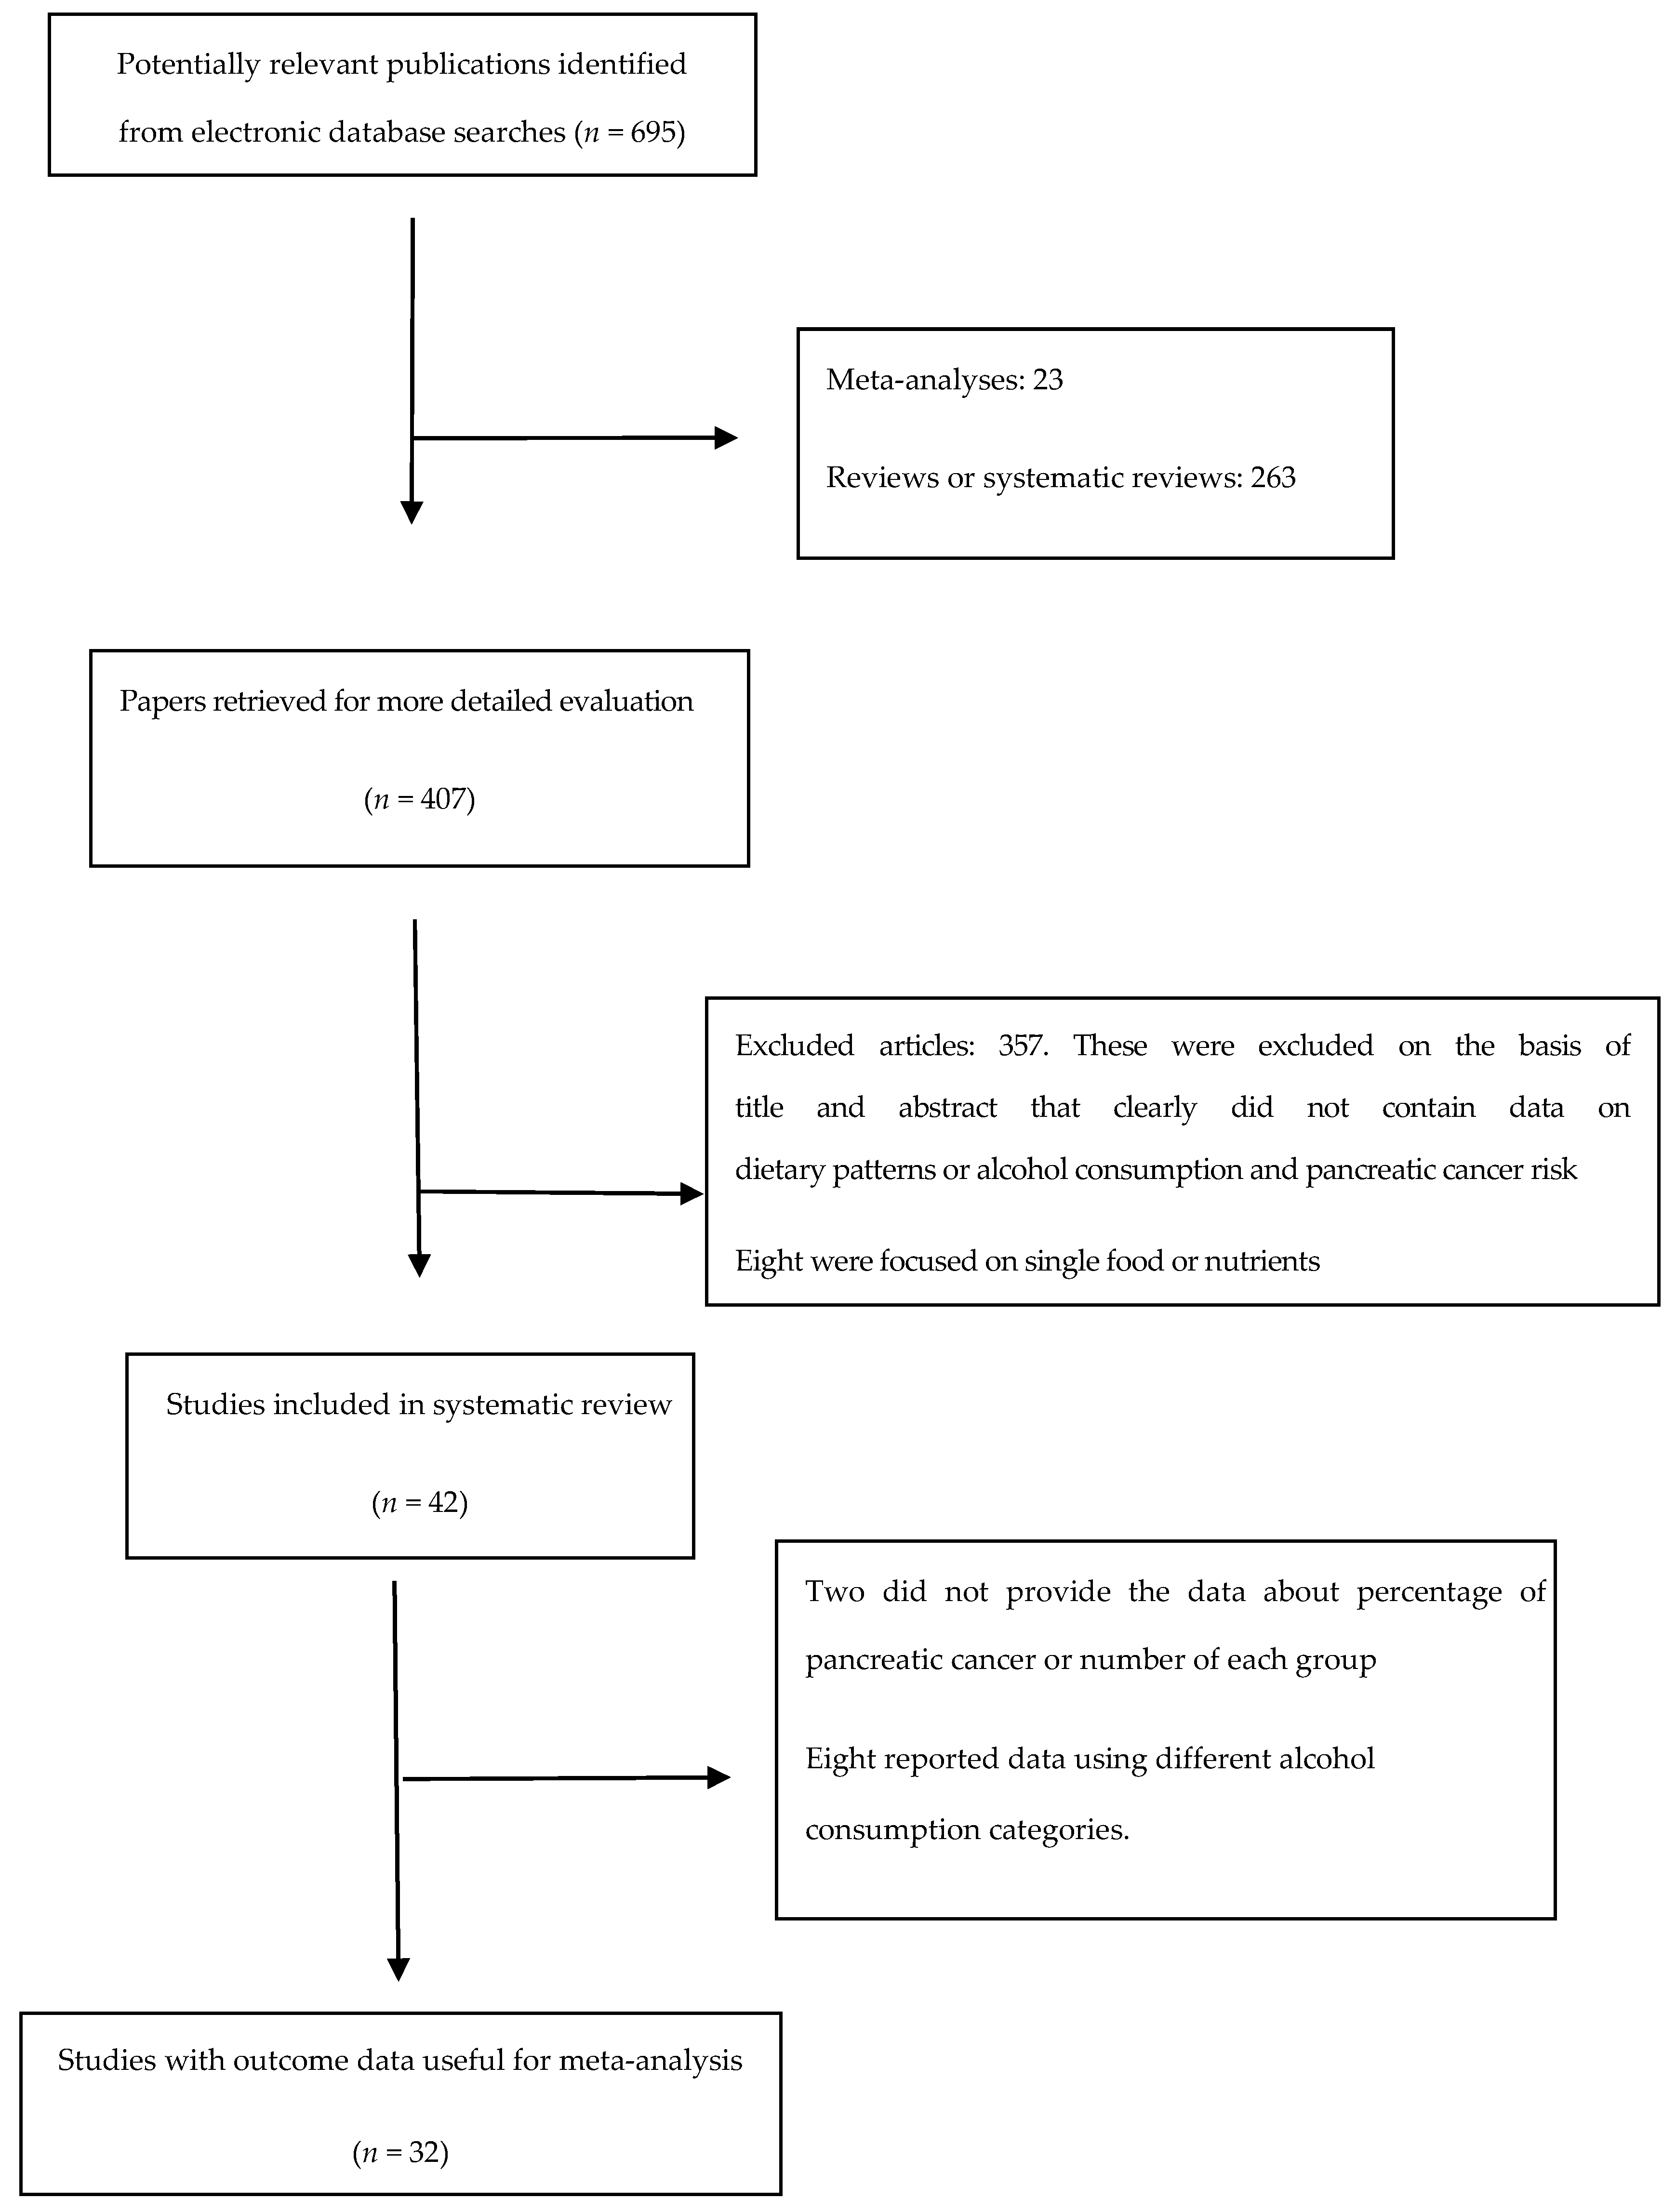
2.1. Literature Search Strategy
2.2. Studies Included Criteria
2.3. Data Extraction
2.4. Definition of “High Intake”
2.5. Assessment of Heterogeneity
2.6. Quality Assessment
3. Statistical Analysis
4. Results
4.1. Overview of Included Studies for the Systematic Review
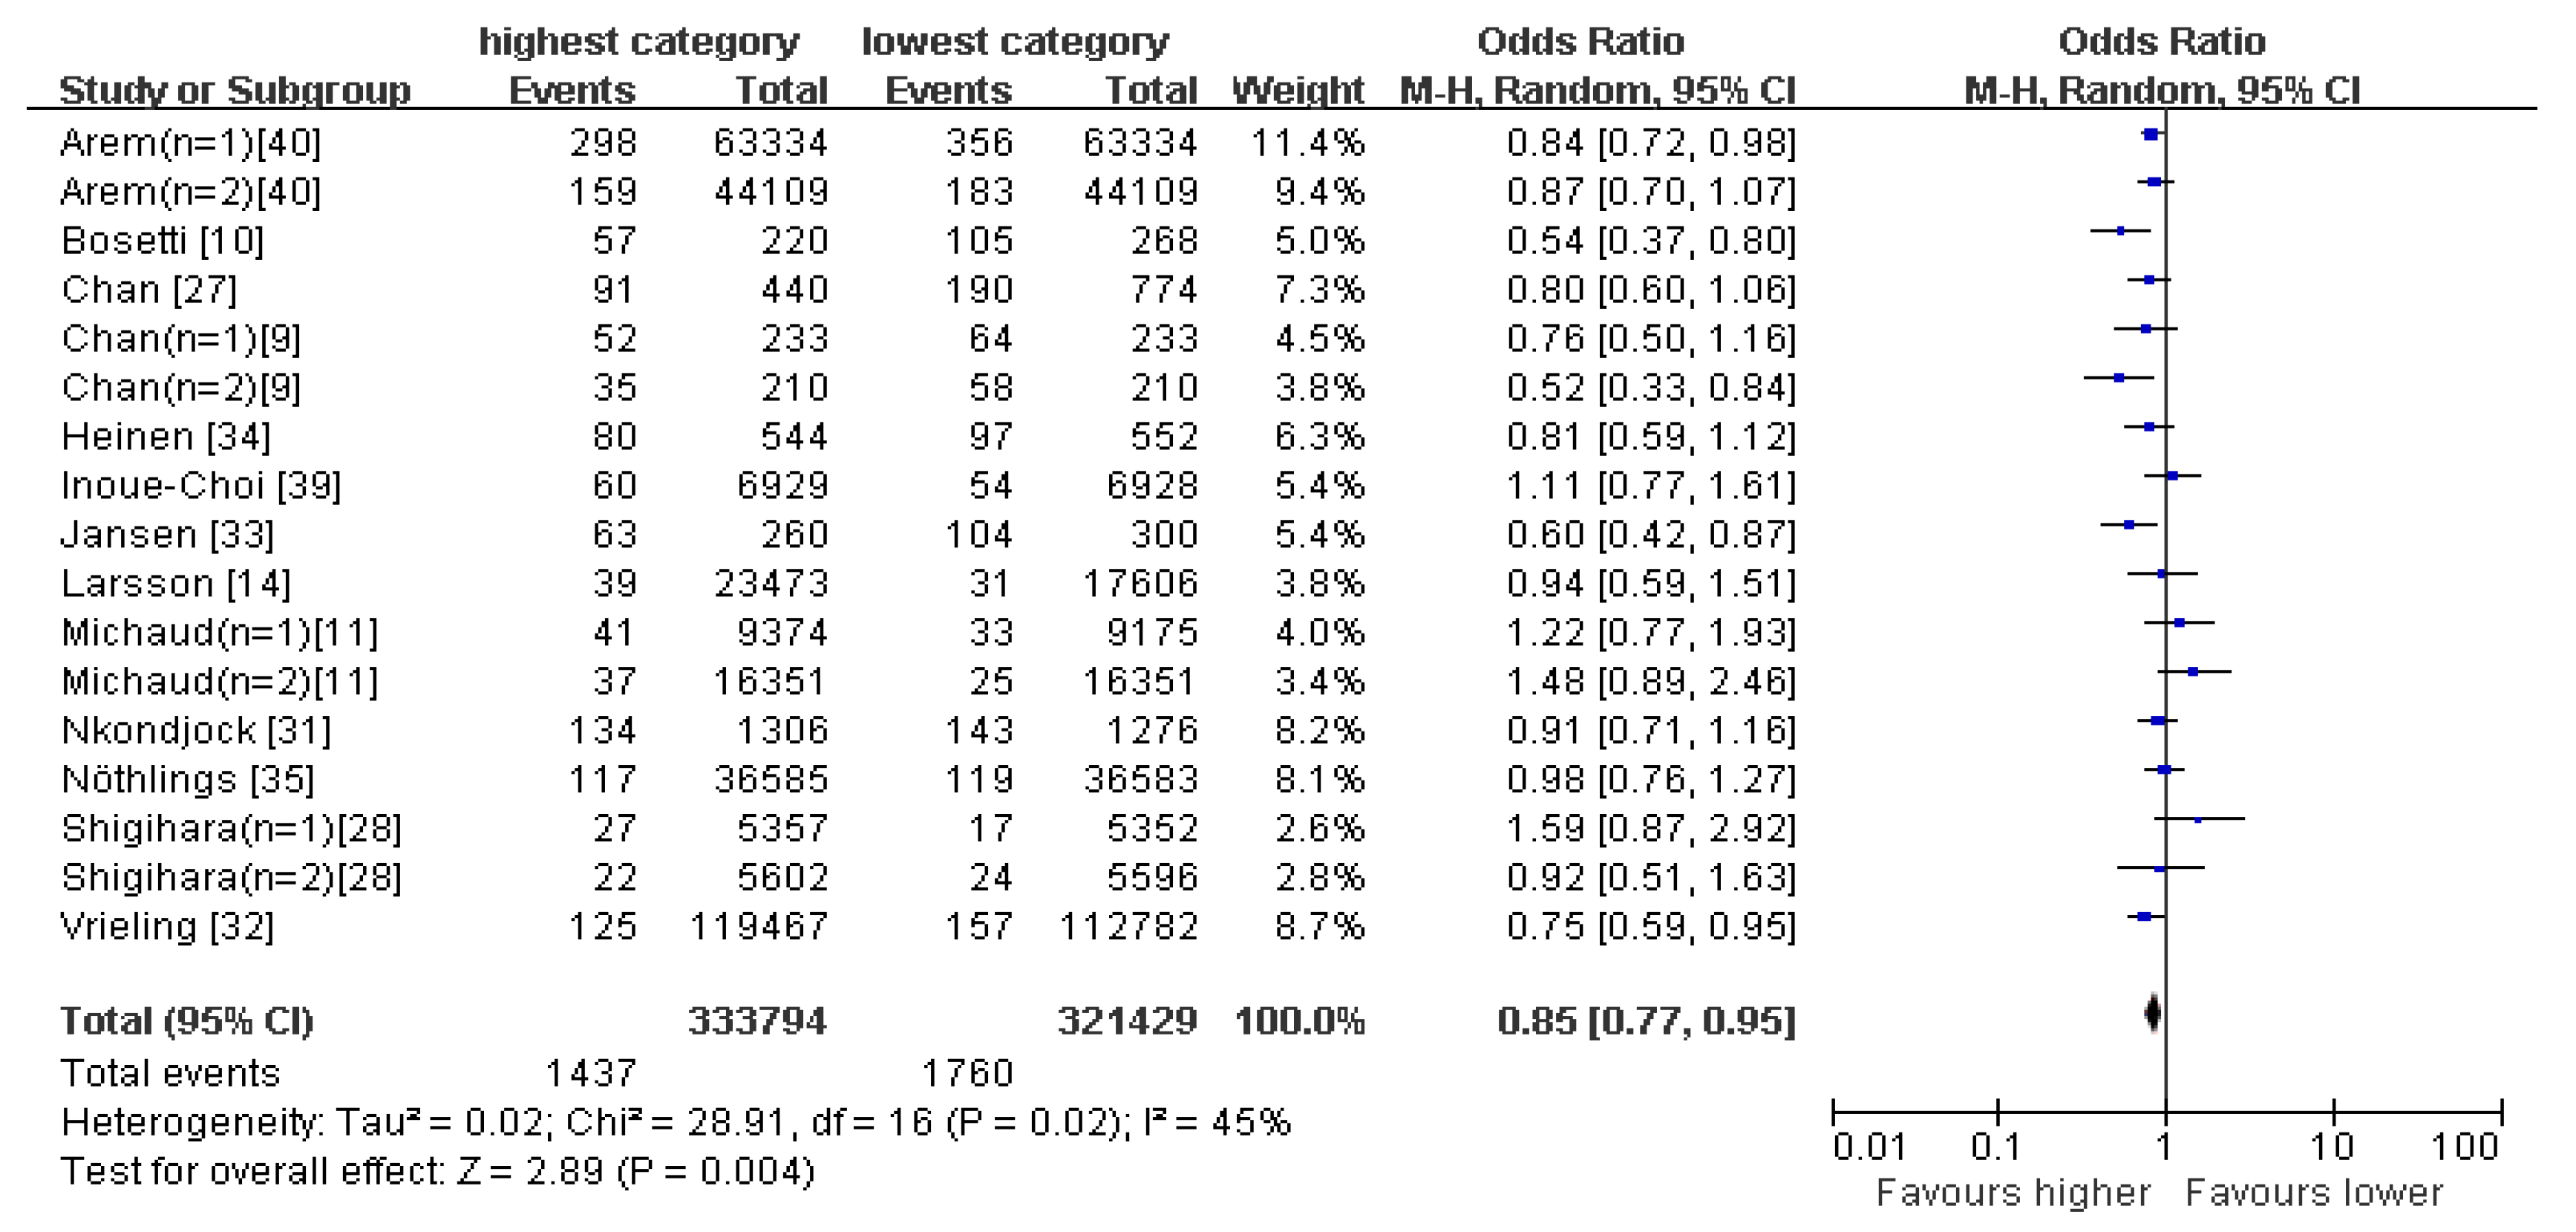
4.2. Healthy Pattern
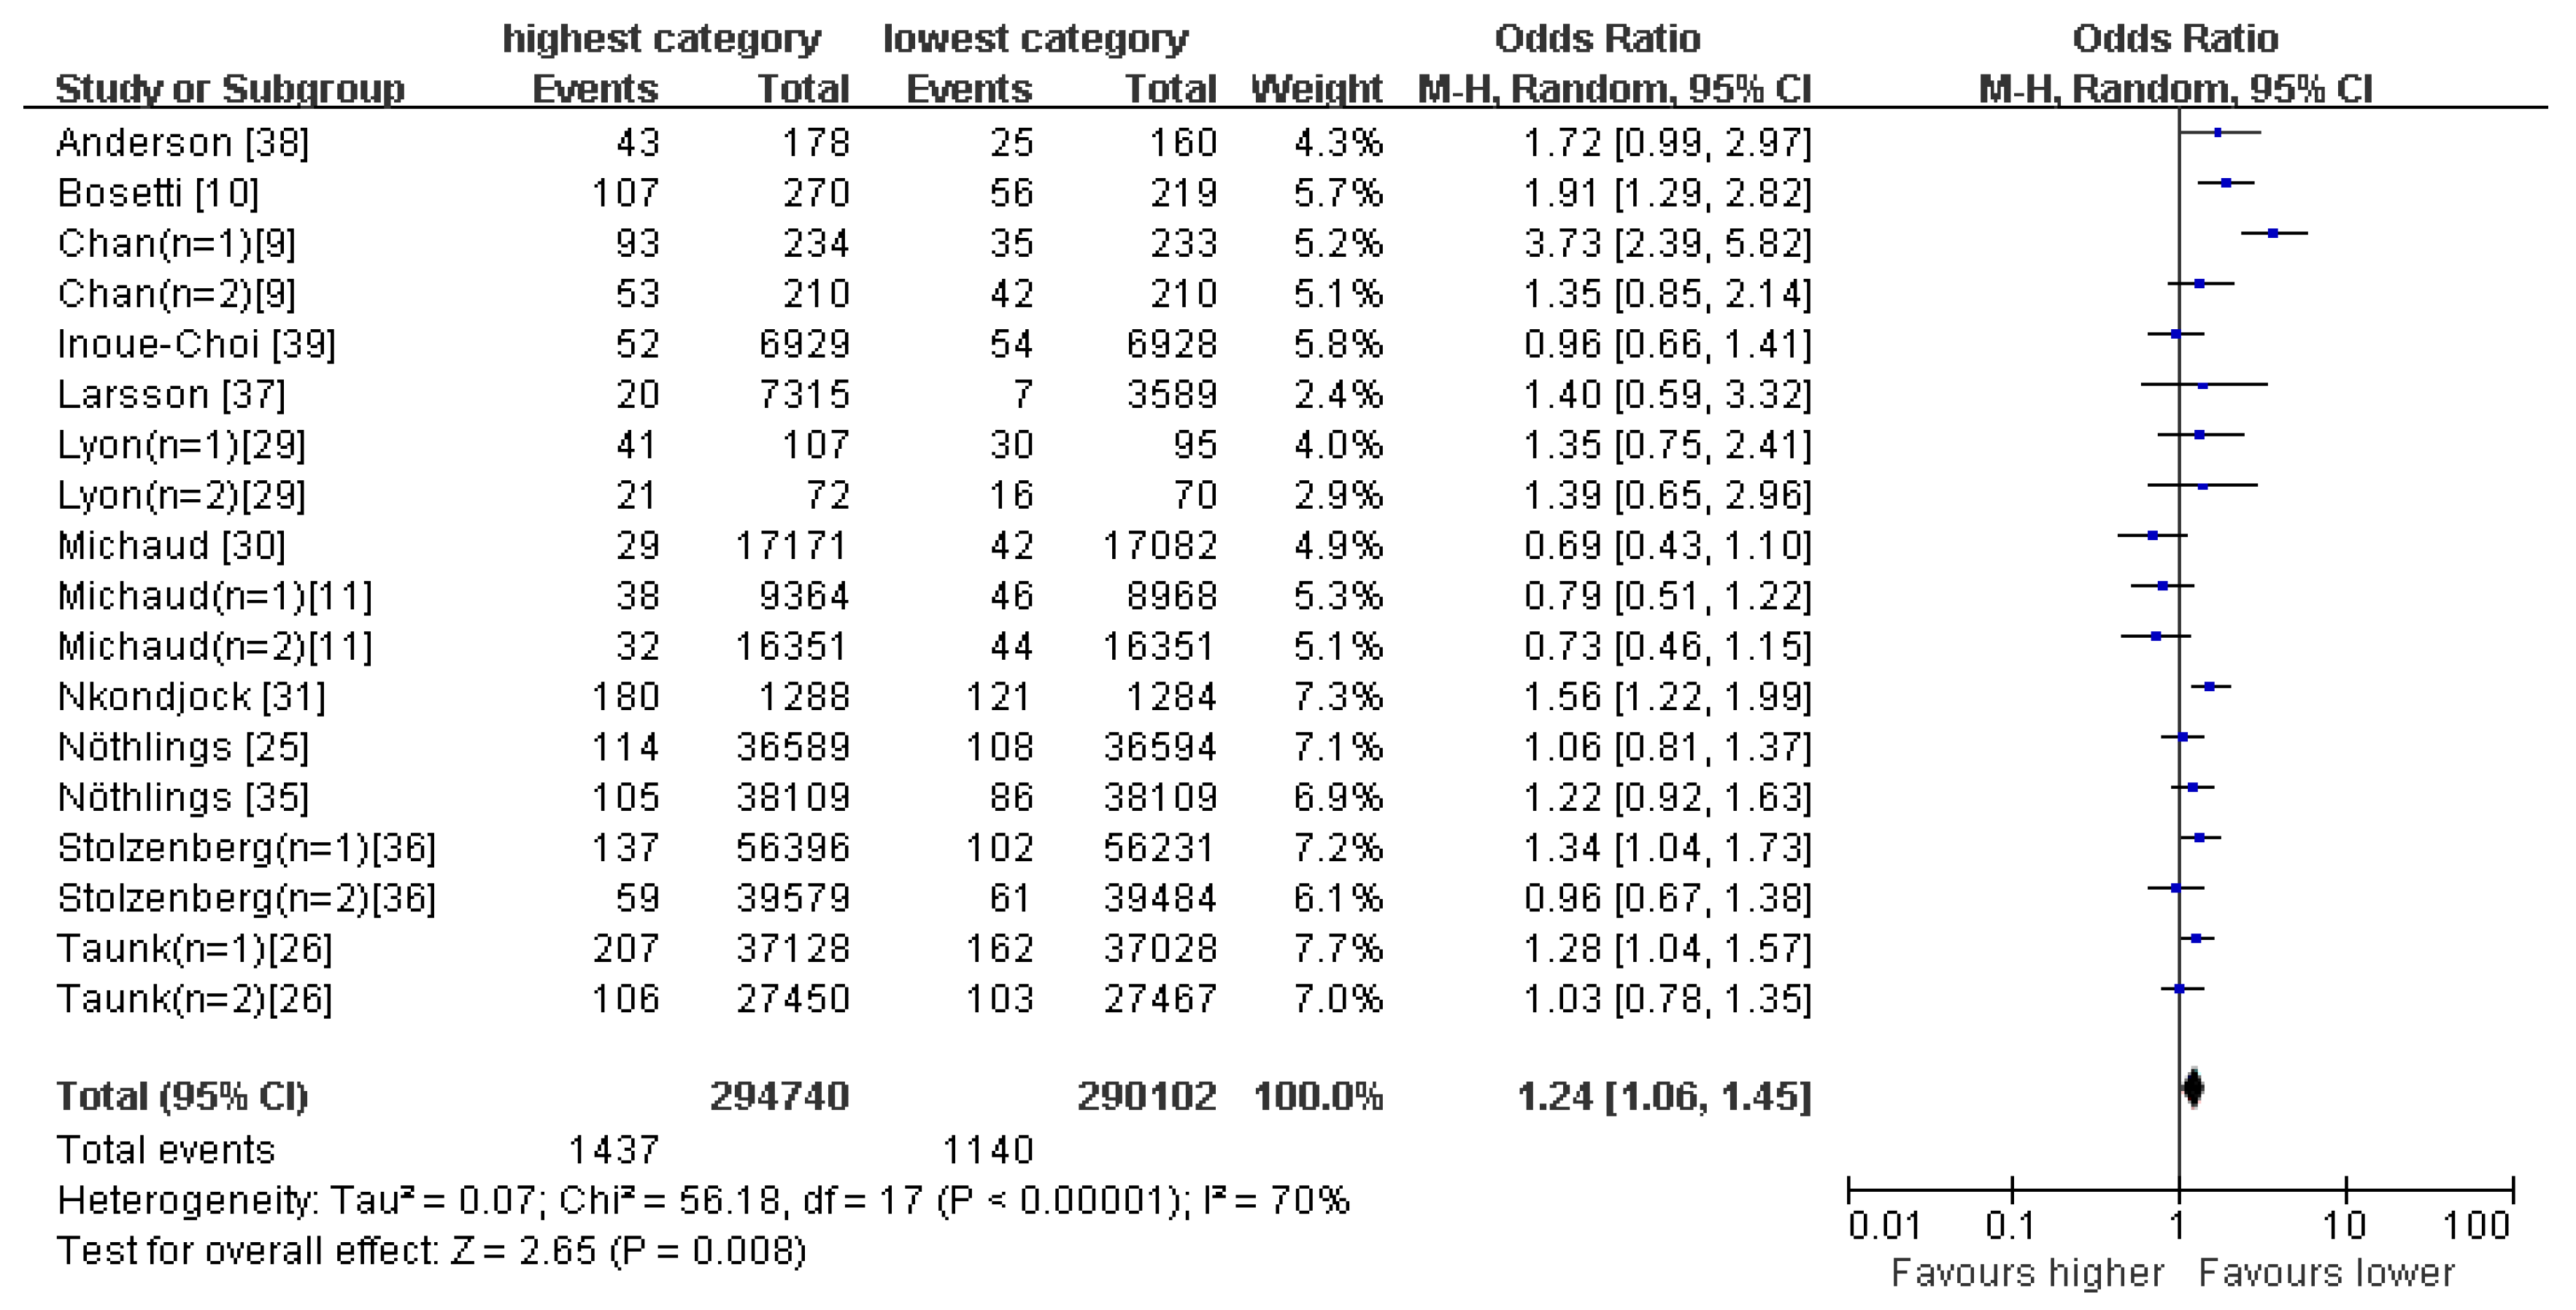
4.3. Western-Type Pattern
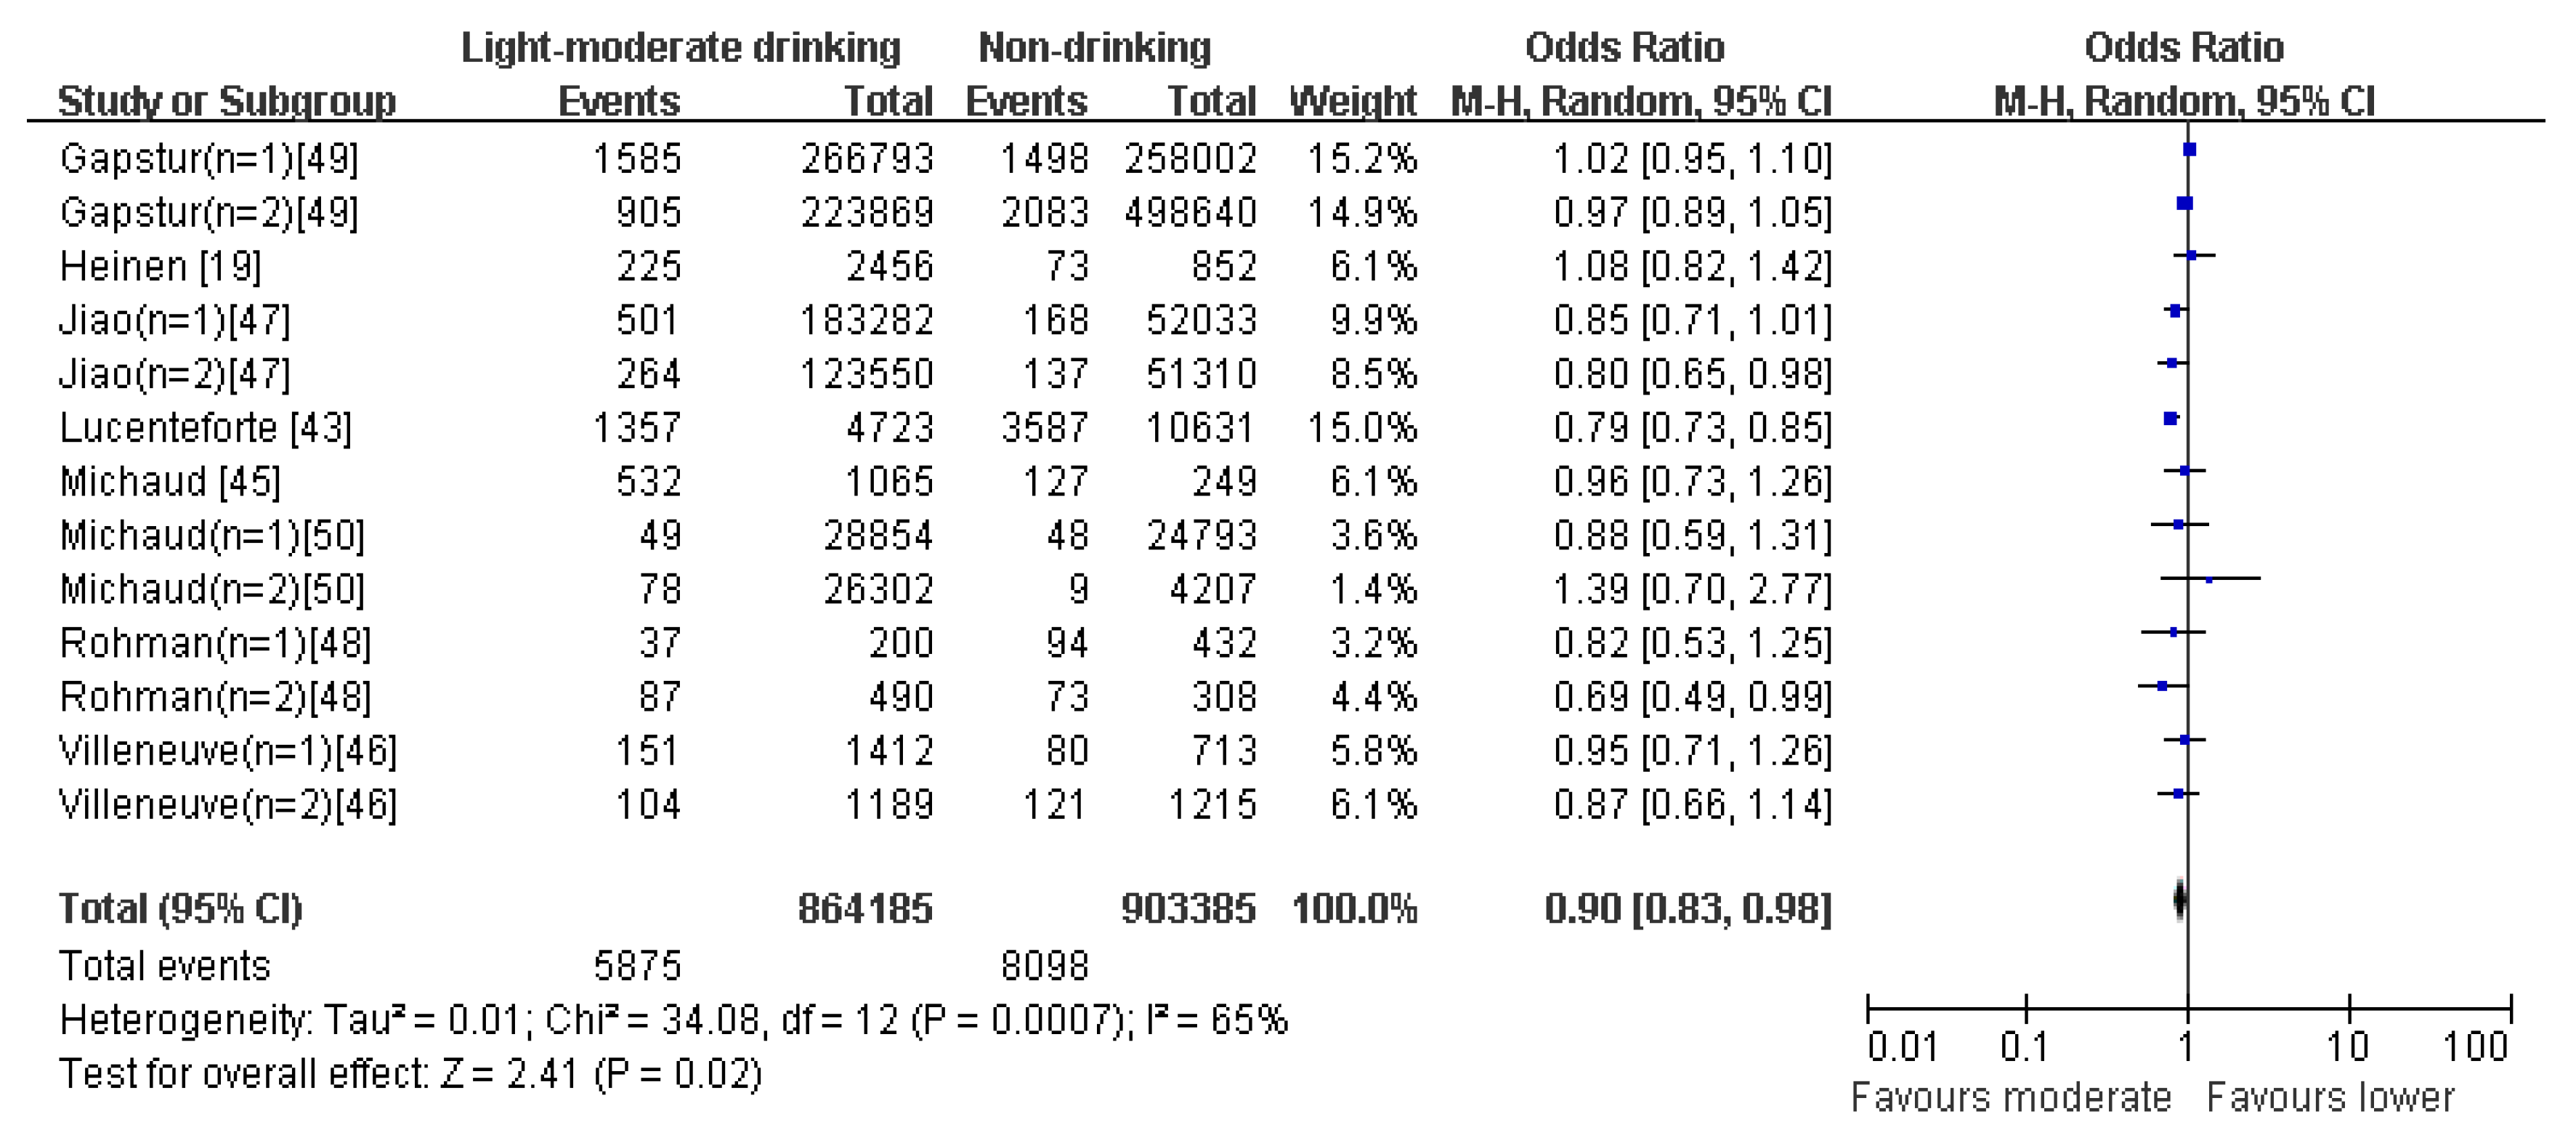
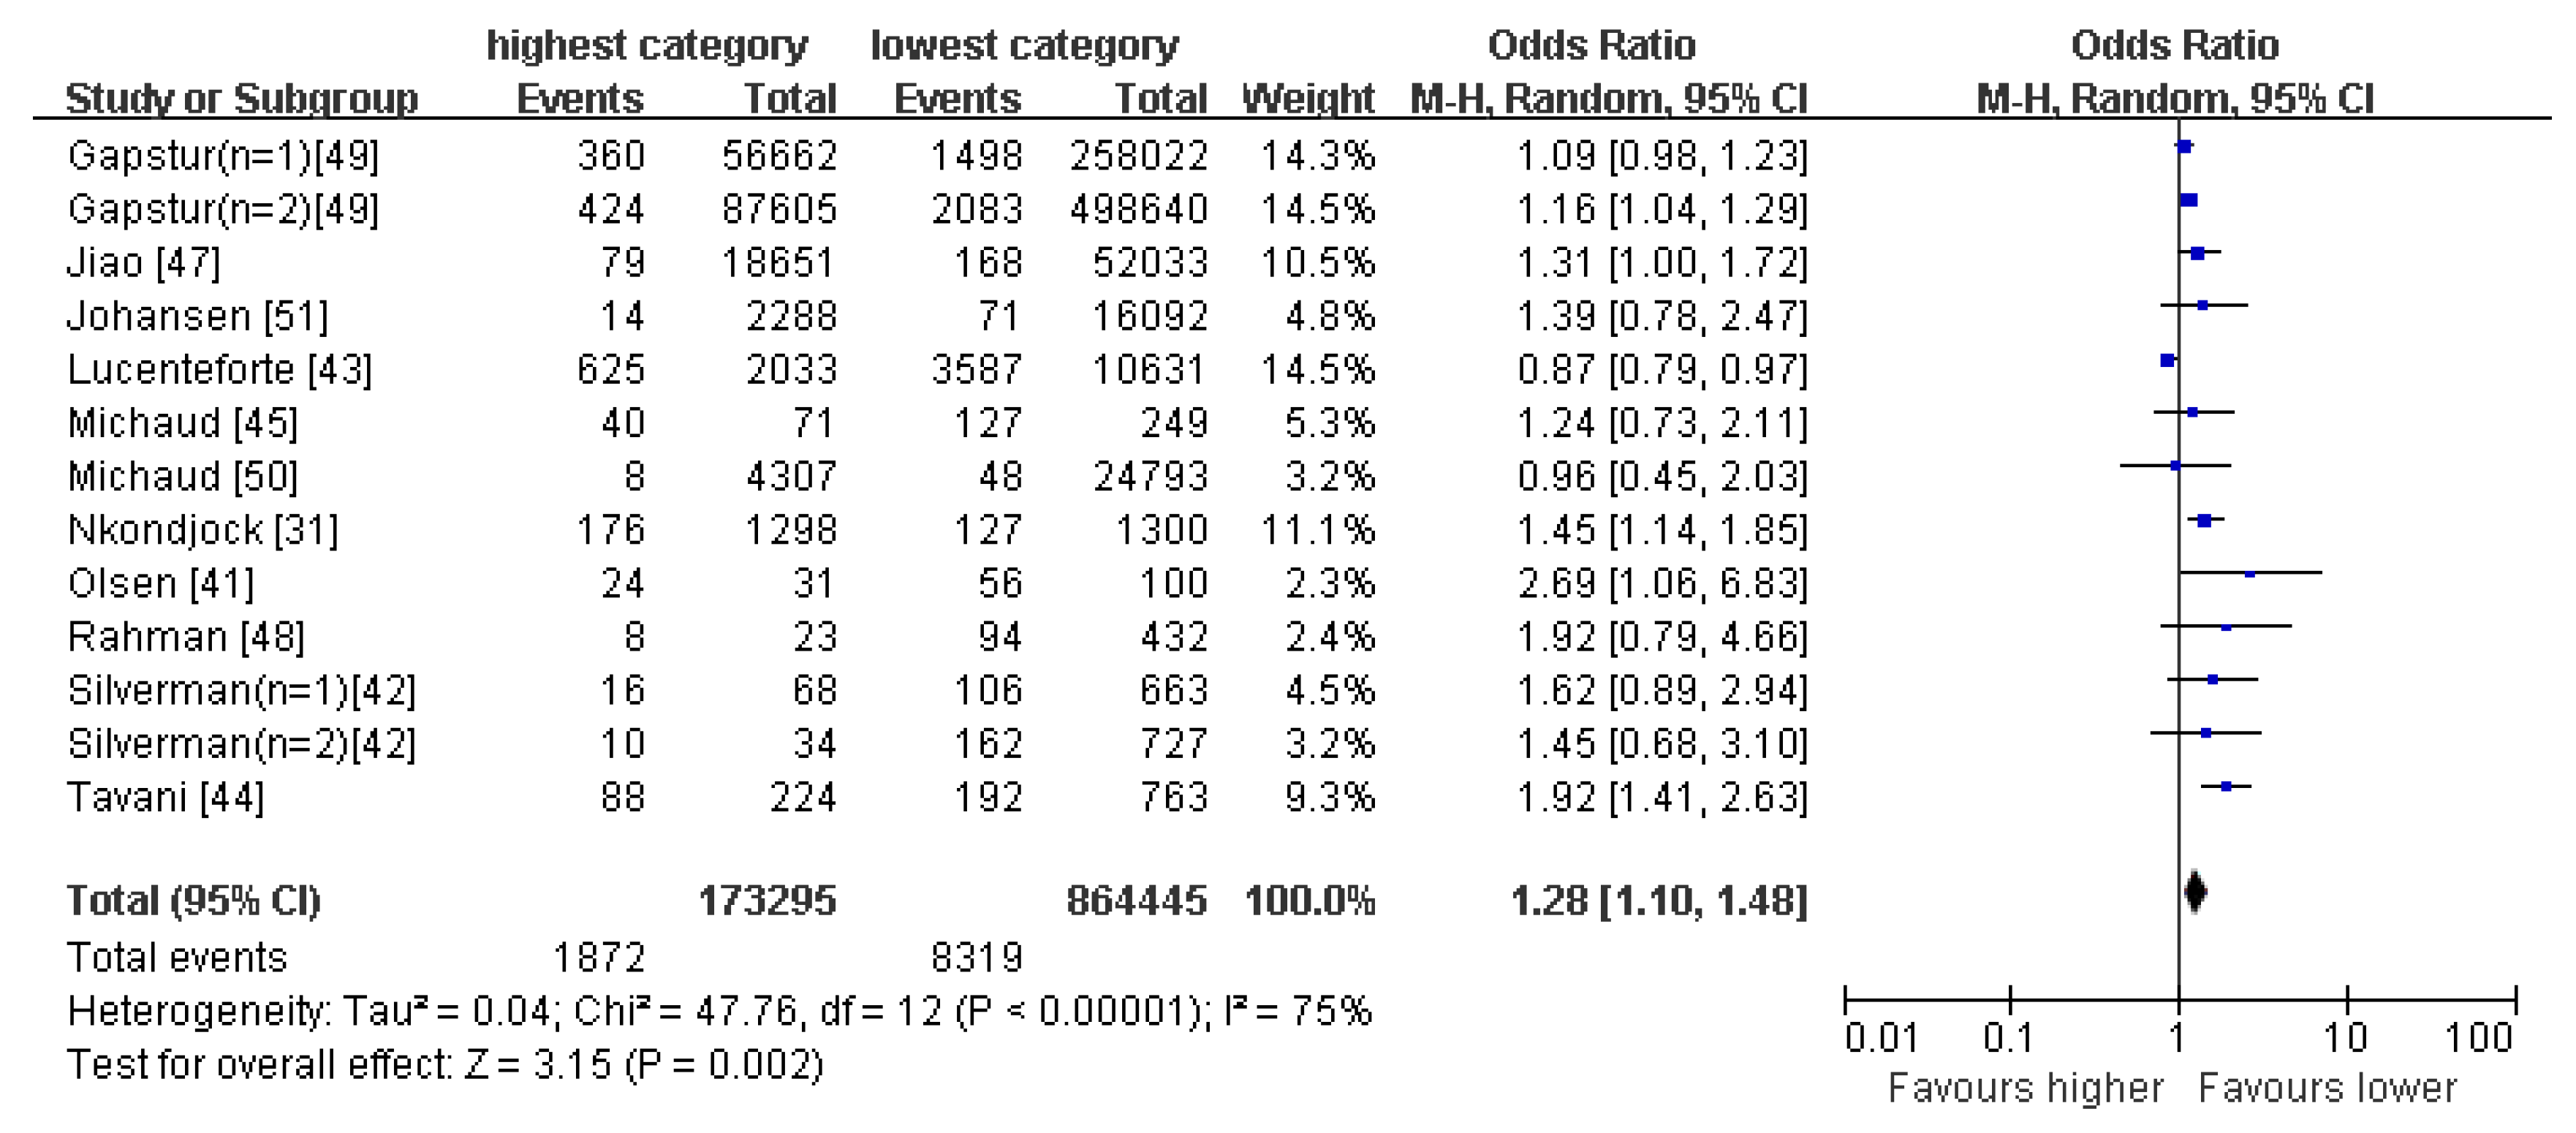
4.4. Drinking Pattern
4.5. Publication Bias
4.6. Quality Assessment
4.7. Sensitivity Analysis
5. Discussion
Strengths and Limitations
6. Conclusions
Acknowledgments
Author Contributions
Conflicts of Interest
Appendix A

| Studies | Selection | Comparability | Outcome | Score | ||||||
|---|---|---|---|---|---|---|---|---|---|---|
| 1 | 2 | 3 | 4 | 5A | 5B | 6 | 7 | 8 | ||
| Chan et al. 2013 [9] | * | * | * | * | * | * | ****** | |||
| Bosetti et al. 2013 [10] | * | * | * | * | * | * | * | ******* | ||
| Michaud et al. 2005 [11] | * | * | * | * | * | * | ****** | |||
| Nöthlings et al. 2008 [25] | * | * | * | * | * | * | * | ******* | ||
| Taunk et al. 2016 [26] | * | * | * | * | * | * | * | ******* | ||
| Chan et al. 2005 [27] | * | * | * | * | * | * | * | ******* | ||
| Shigihara et al. 2014 [28] | * | * | * | * | * | * | * | ******* | ||
| Lyon et al. 1993 [29] | * | * | * | * | * | ***** | ||||
| Michaud et al. 2003 [30] | * | * | * | * | * | * | ****** | |||
| Nkondjock et al. 2005 [31] | * | * | * | * | * | * | ****** | |||
| Vrieling et al. 2009 [32] | * | * | * | * | * | * | * | * | ******** | |
| Larsson et al. 2006 [14] | * | * | * | * | * | * | ******* | |||
| Jansen et al. 2011 [33] | * | * | * | * | * | ***** | ||||
| Heinen et al. 2012 [34] | * | * | * | * | * | * | ****** | |||
| Nöthlings et al. 2005 [35] | * | * | * | * | * | * | * | ******* | ||
| Stolzenberg-Solomon et al. 2007 [36] | * | * | * | * | * | * | * | ******* | ||
| Larsson et al. 2006 [37] | * | * | * | * | * | * | * | ******* | ||
| Anderson et al. 2002 [38] | * | * | * | * | * | ***** | ||||
| Inoue-Choi et al. 2011 [39] | * | * | * | * | * | * | * | * | ******** | |
| Arem et al. 2013 [40] | * | * | * | * | * | * | * | ******* | ||
| Olsen et al. 1989 [41] | * | * | * | * | * | ***** | ||||
| Silverman et al. 1995 [42] | * | * | * | * | * | * | ****** | |||
| Lucenteforte et al. 2012 [43] | * | * | * | * | * | ***** | ||||
| Heinen et al. 2009 [19] | * | * | * | * | * | * | * | ******* | ||
| Tavani et al. 1997 [44] | * | * | * | * | ***** | |||||
| Michaud et al. 2010 [45] | * | * | * | * | * | * | ****** | |||
| Villeneuve et al. 2000 [46] | * | * | * | * | * | * | ****** | |||
| Jiao et al. 2009 [47] | * | * | * | * | * | * | * | ******* | ||
| Rahman et al. 2015 [48] | * | * | * | * | * | * | * | ******* | ||
| Gapstur et al. 2011 [49] | * | * | * | * | * | * | ****** | |||
| Michaud et al. 2001 [50] | * | * | * | * | * | * | ****** | |||
| Johansen et al. 2009 [51] | * | * | * | * | * | * | ****** | |||
References
- Ferlay, J.; Soerjomataram, I.; Ervik, M.; Forman, D.; Bray, F.; Dikshit, R.; Eser, S.; Mathers, C.; Rebelo, M.; Parkin, D.M. GLOBOCAN 2012 v10, Cancer Incidence and Mortality Worldwide: IARC Cancer Base No. 11; International Agency for Research on Cancer: Lyon, France, 2013. [Google Scholar]
- La Vecchia, C.; Bosetti, C.; Lucchini, F.; Bertuccio, P.; Negri, E.; Boyle, P.; Levi, F. Cancer mortality in Europe, 2000–2004, and an overview of trends since 1975. Ann. Oncol. 2010, 21, 1323–1360. [Google Scholar] [CrossRef] [PubMed]
- Chen, W.; Zheng, R.; Zeng, H.; Zhang, S. The updated incidences and mortalities of major cancers in China, 2011. Chin. J. Cancer 2015, 34, 502–507. [Google Scholar] [CrossRef] [PubMed]
- World Cancer Research Fund; American Institute for Cancer Research. Continuous Update Report. Food, Nutrition, Physical Activity, and the Prevention of Pancreatic Cancer; AICR: Washington, DC, USA, 2012. [Google Scholar]
- Silverman, D.T.; Swanson, C.A.; Gridley, G.; Wacholder, S.; Greenberg, R.S.; Brown, L.M.; Hayes, R.B.; Swanson, G.M.; Schoenberg, J.B. Dietary and nutritional factors and pancreatic cancer: A case-control study based on direct interviews. J. Natl. Cancer Inst. 1998, 90, 1710–1719. [Google Scholar] [CrossRef] [PubMed]
- Ji, B.T.; Chow, W.H.; Gridley, G.; McLaughlin, J.K.; Dai, Q.; Wacholder, S.; Hatch, M.C.; Gao, Y.T.; Fraumeni, J.F., Jr. Dietary factors and the risk of pancreatic cancer: A case-control study in Shanghai, China. Cancer Epidemiol. Biomark. Prev. 1995, 4, 885–893. [Google Scholar]
- Zhang, X.Y.; Shu, L.; Si, C.J.; Yu, X.L.; Liao, D.; Gao, W.; Zhang, L.; Zheng, P.F. Dietary patterns, alcohol consumption and risk of coronary heart disease in adults: A Meta-Analysis. Nutrients 2015, 7, 6582–6605. [Google Scholar] [CrossRef] [PubMed]
- Hu, F.B. Dietary pattern analysis: A new direction in nutritional epidemiology. Curr. Opin. Lipidol. 2002, 13, 3–9. [Google Scholar] [CrossRef] [PubMed]
- Chan, J.M.; Gong, Z.; Holly, E.A.; Bracci, P.M. Dietary patterns and risk of pancreatic cancer in a large population-based case-control study in the San Francisco Bay Area. Nutr. Cancer 2013, 65, 157–164. [Google Scholar] [CrossRef] [PubMed]
- Bosetti, C.; Bravi, F.; Turati, F.; Edefonti, V.; Polesel, J.; Decarli, A.; Negri, E.; Talamini, R.; Franceschi, S.; La Vecchia, C. Nutrient-based dietary patterns and pancreatic cancer risk. Ann. Epidemiol. 2013, 23, 124–128. [Google Scholar] [CrossRef] [PubMed]
- Michaud, D.S.; Skinner, H.G.; Wu, K.; Hu, F.; Giovannucci, E.; Willett, W.C.; Colditz, G.A.; Fuchs, C.S. Dietary patterns and pancreatic cancer risk in men and women. J. Natl. Cancer Inst. 2005, 97, 518–524. [Google Scholar] [CrossRef] [PubMed]
- Jansen, R.J.; Robinson, D.P.; Stolzenberg-Solomon, R.Z.; Bamlet, W.R.; de Andrade, M.; Oberg, A.L.; Rabe, K.G.; Anderson, K.E. Nutrients from fruit and vegetable consumption reduce the risk of pancreatic cancer. J. Gastrointest. Cancer 2013, 44, 152–161. [Google Scholar] [CrossRef] [PubMed]
- Olsen, G.W.; Mandel, J.S.; Gibson, R.W.; Wattenberg, L.W.; Schuman, L.M. Nutrients and pancreatic cancer: A population-based case-control study. Cancer Causes Control 1991, 2, 291–297. [Google Scholar] [CrossRef] [PubMed]
- Larsson, S.C.; Håkansson, N.; Näslund, I.; Bergkvist, L.; Wolk, A. Fruit and vegetable consumption in relation to pancreatic cancer risk: A prospective study. Cancer Epidemiol. Biomark. Prev. 2006, 15, 301–305. [Google Scholar] [CrossRef] [PubMed]
- World Cancer Research Fund; American Institute for Cancer Research. Food, Nutrition, Physical Activity, and the Prevention of Cancer: A Global Perspective; AICR: Washington, DC, USA, 2007. [Google Scholar]
- Luo, J.; Inoue, M.; Iwasaki, M.; Sasazuki, S.; Otani, T.; Ye, W.; Tsugane, S.; JPHC Study Group. Green tea and coffee intake and risk of pancreatic cancer in a large-scale, population-based cohort study in Japan (JPHC study). Eur. J. Cancer Prev. 2007, 16, 542–548. [Google Scholar] [CrossRef] [PubMed]
- Wang, J.; Zhang, W.; Sun, L.; Yu, H.; Ni, Q.X.; Risch, H.A.; Gao, Y.T. Green tea drinking and risk of pancreatic cancer: A large-scale, population-based case-control study in urban Shanghai. Cancer Epidemiol. 2012, 36, 354–358. [Google Scholar] [CrossRef]
- Tramacere, I.; Scotti, L.; Jenab, M.; Bagnardi, V.; Bellocco, R.; Rota, M.; Corrao, G.; Bravi, F.; Boffetta, P.; La Vecchia, C. Alcohol drinking and pancreatic cancer risk: A meta-analysis of the dose-risk relation. Int. J. Cancer 2010, 126, 1474–1486. [Google Scholar] [CrossRef] [PubMed]
- Heinen, M.M.; Verhage, B.A.; Ambergen, T.A.; Goldbohm, R.A.; van den Brandt, P.A. Alcohol consumption and risk of pancreatic cancer in the Netherlands cohort study. Am. J. Epidemiol. 2009, 169, 1233–1242. [Google Scholar] [CrossRef] [PubMed]
- Rohrmann, S.; Linseisen, J.; Nöthlings, U.; Overvad, K.; Egeberg, R.; Tjønneland, A.; Boutron-Ruault, M.C.; Clavel-Chapelon, F.; Cottet, V.; Pala, V.; et al. Meat and fish consumption and risk of pancreatic cancer: Results from the European Prospective Investigation into Cancer and Nutrition. Int. J. Cancer 2013, 132, 617–624. [Google Scholar] [CrossRef] [PubMed]
- U.S. Government. Alcoholic Beverages: Dietary Guidelines for Americans 2005; U.S. Government Printing Office: Washington, DC, USA, 2005.
- Higgins, J.P.; Thompson, S.G.; Deeks, J.J.; Altman, D.G. Measuring inconsistency in meta-analyses. BMJ 2003, 327, 557–560. [Google Scholar] [CrossRef] [PubMed] [Green Version]
- Stang, A. Critical evaluation of the Newcastle-Ottawa scale for the assessment of the quality of nonrandomized studies in meta-analyses. Eur. J. Epidemiol. 2010, 25, 603–660. [Google Scholar] [CrossRef] [PubMed]
- Begg, C.B.; Mazumdar, M. Operating characteristics of a rank correlation test for publication bias. Biometrics 1994, 50, 1088–1101. [Google Scholar] [CrossRef] [PubMed]
- Nöthlings, U.; Murphy, S.P.; Wilkens, L.R.; Boeing, H.; Schulze, M.B.; Bueno-de-Mesquita, H.B.; Michaud, D.S.; Roddam, A.; Rohrmann, S.; Tjønneland, A.; et al. A food pattern that is predictive of flavonol intake and risk of pancreatic cancer. Am. J. Clin. Nutr. 2008, 88, 1653–1662. [Google Scholar] [CrossRef] [PubMed]
- Taunk, P.; Hecht, E.; Stolzenberg-Solomon, R. Are meat and heme iron intake associated with pancreatic cancer? Results from the NIH-AARP diet and health cohort. Int. J. Cancer 2016, 138, 2172–2189. [Google Scholar] [CrossRef] [PubMed]
- Chan, J.M.; Wang, F.; Holly, E.A. Vegetable and fruit intake and pancreatic cancer in a population- based case-control study in the San Francisco bay area. Cancer Epidemiol. Biomark. Prev. 2005, 14, 2093–2097. [Google Scholar] [CrossRef] [PubMed]
- Shigihara, M.; Obara, T.; Nagai, M.; Sugawara, Y.; Watanabe, T.; Kakizaki, M.; Nishino, Y.; Kuriyama, S.; Tsuji, I. Consumption of fruits, vegetables, and seaweeds (sea vegetables) and pancreatic cancer risk: The Ohsaki Cohort Study. Cancer Epidemiol. 2014, 38, 129–136. [Google Scholar] [CrossRef] [PubMed]
- Lyon, J.L.; Slattery, M.L.; Mahoney, A.W.; Robison, L.M. Dietary intake as a risk factor for cancer of the exocrine pancreas. Cancer Epidemiol. Biomark. Prev. 1993, 2, 513–518. [Google Scholar]
- Michaud, D.S.; Giovannucci, E.; Willett, W.C.; Colditz, G.A.; Fuchs, C.S. Dietary meat, dairy products, fat, and cholesterol and pancreatic cancer risk in a prospective study. Am. J. Epidemiol. 2003, 157, 1115–1125. [Google Scholar] [CrossRef] [PubMed]
- Nkondjock, A.; Krewski, D.; Johnson, K.C.; Ghadirian, P.; Canadian Cancer Registries Epidemiology Research Group. Dietary patterns and risk of pancreatic cancer. Int. J. Cancer 2005, 114, 817–823. [Google Scholar] [CrossRef] [PubMed]
- Vrieling, A.; Verhage, B.A.; van Duijnhoven, F.J.; Jenab, M.; Overvad, K.; Tjønneland, A.; Olsen, A.; Clavel-Chapelon, F.; Boutron-Ruault, M.C.; Kaaks, R.; et al. Fruit and vegetable consumption and pancreatic cancer risk in the European Prospective Investigation into Cancer and Nutrition. Int. J. Cancer 2009, 124, 1926–1934. [Google Scholar] [CrossRef] [PubMed]
- Jansen, R.J.; Robinson, D.P.; Stolzenberg-Solomon, R.Z.; Bamlet, W.R.; de Andrade, M.; Oberg, A.L.; Hammer, T.J.; Rabe, K.G. Fruit and vegetable consumption is inversely associated with having pancreatic cancer. Cancer Causes Control 2011, 22, 1613–1625. [Google Scholar] [CrossRef] [PubMed]
- Heinen, M.M.; Verhage, B.A.; Goldbohm, R.A.; van den Brandt, P.A. Intake of vegetables, fruits, carotenoids and vitamins C and E and pancreatic cancer risk in The Netherlands Cohort Study. Int. J. Cancer 2012, 130, 147–158. [Google Scholar] [CrossRef] [PubMed]
- Nöthlings, U.; Wilkens, L.R.; Murphy, S.P.; Hankin, J.H.; Henderson, B.E.; Kolonel, L.N. Meat and fat intake as risk factors for pancreatic cancer: The multiethnic cohort study. J. Natl. Cancer Inst. 2005, 97, 1458–1465. [Google Scholar] [CrossRef] [PubMed]
- Stolzenberg-Solomon, R.Z.; Cross, A.J.; Silverman, D.T.; Schairer, C.; Thompson, F.E.; Kipnis, V.; Subar, A.F.; Hollenbeck, A.; Schatzkin, A.; Sinha, R. Meat and meat-mutagen intake and pancreatic cancer risk in the NIH-AARP cohort. Cancer Epidemiol. Biomark. Prev. 2007, 16, 2664–2675. [Google Scholar] [CrossRef] [PubMed]
- Larsson, S.C.; Håkanson, N.; Permert, J.; Wolk, A. Meat, fish, poultry and egg consumption in relation to risk of pancreatic cancer: A prospective study. Int. J. Cancer 2006, 118, 2866–2870. [Google Scholar] [CrossRef] [PubMed]
- Anderson, K.E.; Sinha, R.; Kulldorff, M.; Gross, M.; Lang, N.P.; Barber, C.; Harnack, L.; DiMagno, E.; Bliss, R.; Kadlubar, F.F. Meat intake and cooking techniques: Associations with pancreatic cancer. Mutat. Res. 2002, 506–507, 225–231. [Google Scholar] [CrossRef]
- Inoue-Choi, M.; Flood, A.; Robien, K.; Anderson, K. Nutrients, food groups, dietary patterns, and risk of pancreatic cancer in postmenopausal women. Cancer Epidemiol. Biomark. Prev. 2011, 20, 711–714. [Google Scholar] [CrossRef] [PubMed]
- Arem, H.; Reedy, J.; Sampson, J.; Jiao, L.; Hollenbeck, A.R.; Risch, H.; Mayne, S.T.; Stolzenberg-Solomon, R.Z. The Healthy Eating Index 2005 and risk for pancreatic cancer in the NIH-AARP study. J. Natl. Cancer Inst. 2013, 105, 1298–1305. [Google Scholar] [CrossRef]
- Olsen, G.W.; Mandel, J.S.; Gibson, R.W.; Wattenberg, L.W.; Schuman, L.M. A case-control study of pancreatic cancer and cigarettes, alcohol, coffee and diet. Am. J. Public Health 1989, 79, 1016–1019. [Google Scholar] [CrossRef] [PubMed]
- Silverman, D.T.; Brown, L.M.; Hoover, R.N.; Schiffman, M.; Lillemoe, K.D.; Schoenberg, J.B.; Swanson, G.M.; Hayes, R.B.; Greenberg, R.S. Alcohol and pancreatic cancer in blacks and whites in the United States. Cancer Res. 1995, 55, 4899–4905. [Google Scholar] [PubMed]
- Lucenteforte, E.; La Vecchia, C.; Silverman, D.; Petersen, G.M.; Bracci, P.M.; Ji, B.T.; Bosetti, C.; Li, D.; Gallinger, S. Alcohol consumption and pancreatic cancer: A pooled analysis in the International Pancreatic Cancer Case-Control Consortium (PanC4). Ann. Oncol. 2012, 23, 374–382. [Google Scholar] [CrossRef] [PubMed]
- Tavani, A.; Pregnolato, A.; Negri, E.; La Vecchia, C. Alcohol consumption and risk of pancreatic cancer. Nutr. Cancer 1997, 27, 157–161. [Google Scholar] [CrossRef] [PubMed]
- Michaud, D.S.; Vrieling, A.; Jiao, L.; Mendelsohn, J.B.; Steplowski, E.; Lynch, S.M.; Wactawski-Wende, J.; Arslan, A.A.; Bas Bueno-de-Mesquita, H.; Fuchs, C.S.; et al. Alcohol intake and pancreatic cancer: A pooled analysis from the pancreatic cancer cohort consortium (PanScan). Cancer Causes Control 2010, 21, 1213–1225. [Google Scholar] [CrossRef] [PubMed]
- Villeneuve, P.J.; Johnson, K.C.; Hanley, A.J.; Mao, Y. Alcohol, tobacco and coffee consumption and the risk of pancreatic cancer: Results from the Canadian Enhanced Surveillance System case-control project. Canadian Cancer Registries Epidemiology Research Group. Eur. J. Cancer Prev. 2000, 9, 49–58. [Google Scholar] [CrossRef] [PubMed]
- Jiao, L.; Silverman, D.T.; Schairer, C.; Thiébaut, A.C.; Hollenbeck, A.R.; Leitzmann, M.F.; Schatzkin, A.; Stolzenberg-Solomon, R.Z. Alcohol use and risk of pancreatic cancer: The NIH-AARP Diet and Health Study. Am. J. Epidemiol. 2009, 169, 1043–1051. [Google Scholar] [CrossRef] [PubMed]
- Rahman, F.; Cotterchio, M.; Cleary, S.P.; Gallinger, S. Association between alcohol consumption and pancreatic cancer risk: A case-control study. PLoS ONE 2015, 10, e0124489. [Google Scholar] [CrossRef] [PubMed]
- Gapstur, S.M.; Jacobs, E.J.; Deka, A.; McCullough, M.L.; Patel, A.V.; Thun, M.J. Association of alcohol intake with pancreatic cancer mortality in never smokers. Arch. Intern. Med. 2011, 171, 444–451. [Google Scholar] [CrossRef] [PubMed]
- Michaud, D.S.; Giovannucci, E.; Willett, W.C.; Colditz, G.A.; Fuchs, C.S. Coffee and alcohol consumption and the risk of pancreatic cancer in two prospective United States cohorts. Cancer Epidemiol. Biomark. Prev. 2001, 10, 429–437. [Google Scholar]
- Johansen, D.; Borgström, A.; Lindkvist, B.; Manjer, J. Different markers of alcohol consumption, smoking and body mass index in relation to risk of pancreatic cancer. A prospective cohort study within the Malmö Preventive Project. Pancreatology 2009, 9, 677–686. [Google Scholar] [CrossRef] [PubMed]
- Pathak, S.K.; Sharma, R.A.; Steward, W.P.; Mellon, J.K.; Griffiths, T.R.; Gescher, A.J. Oxidative stress and cyclooxygenase activity in prostate carcinogenesis: Targets for chemopreventive strategies. Eur. J. Cancer 2005, 41, 61–70. [Google Scholar] [CrossRef] [PubMed]
- Algül, H.; Treiber, M.; Lesina, M.; Schmid, R.M. Mechanisms of disease: Chronic inflammation and cancer in the pancreas—A potential role for pancreatic stellate cells? Nat. Clin. Pract. Gastroenterol. Hepatol. 2007, 4, 454–462. [Google Scholar] [CrossRef] [PubMed]
- Wang, C.H.; Qiao, C.; Wang, R.C.; Zhou, W.P. Dietary fiber intake and pancreatic cancer risk: A meta-analysis of epidemiologic studies. Sci. Rep. 2015, 5, 10834. [Google Scholar] [CrossRef] [PubMed]
- Gukovsky, I.; Li, N.; Todoric, J.; Gukovskaya, A.; Karin, M. Inflammation, autophagy, and obesity: Common features in the pathogenesis of pancreatitis and pancreatic cancer. Gastroenterology 2013, 144, 1199–1209. [Google Scholar] [CrossRef] [PubMed]
- Jensen, M.K.; Koh-Banerjee, P.; Franz, M.; Sampson, L.; Grønbaek, M.; Rimm, E.B. Whole grains, bran, and germ in relation to homocysteine and markers of glycemic control, lipids, and inflammation 1. Am. J. Clin. Nutr. 2006, 83, 275–283. [Google Scholar] [PubMed]
- Lin, H.L.; An, Q.Z.; Wang, Q.Z.; Liu, C.X. Folate intake and pancreatic cancer risk: An overall and dose-response meta-analysis. Public Health 2013, 127, 607–613. [Google Scholar] [CrossRef] [PubMed]
- Anderson, K.E.; Kadlubar, F.F.; Kulldorff, M.; Harnack, L.; Gross, M.; Lang, N.P.; Barber, C.; Rothman, N.; Sinha, R. Dietary intake of heterocyclic amines and benzo(a)pyrene: Associations with pancreatic cancer. Cancer Epidemiol. Biomark. Prev. 2005, 4, 2261–2265. [Google Scholar] [CrossRef] [PubMed]
- McCord, J.M. Iron, free radicals, and oxidative injury. Semin. Hematol. 1998, 35, 5–12. [Google Scholar] [PubMed]
- Sanchez, G.V.; Weinstein, S.J.; Stolzenberg-Solomon, R.Z. Is dietary fat, vitamin, D.; or folate associated with pancreatic cancer? Mol. Carcinog. 2012, 51, 119–127. [Google Scholar] [CrossRef] [PubMed]
- Risch, H.A. Etiology of pancreatic cancer, with a hypothesis concerning the role of N-nitroso compounds and excess gastric acidity. J. Natl. Cancer Inst. 2003, 95, 948–960. [Google Scholar] [CrossRef] [PubMed]
- Seitz, H.K.; Stickel, F. Molecular mechanisms of alcohol-mediated carcinogenesis. Nat. Rev. Cancer 2007, 7, 599–612. [Google Scholar] [CrossRef] [PubMed]
- Apte, M.V.; Pirola, R.C.; Wilson, J.S. Battle-scarred pancreas: Role of alcohol and pancreatic stellate cells in pancreatic fibrosis. J. Gastroenterol. Hepatol. 2006, 21, S97–S101. [Google Scholar] [CrossRef] [PubMed]
- Irving, H.M.; Samokhvalov, A.V.; Rehm, J. Alcohol as a risk factor for pancreatitis. A systematic review and meta-analysis. JOP 2009, 10, 387–392. [Google Scholar] [PubMed]
- Duell, E.J. Epidemiology and potential mechanisms of tobacco smoking and heavy alcohol consumption in pancreatic cancer. Mol. Carcinog. 2012, 51, 40–52. [Google Scholar] [CrossRef] [PubMed]
- Lazarus, R.; Sparrow, D.; Weiss, S.T. Alcohol intake and insulin levels: The Normative Aging Study. Am. J. Epidemiol. 1997, 145, 909–916. [Google Scholar] [CrossRef] [PubMed]
- Rosato, V.; Tavani, A.; Bosetti, C.; Pelucchi, C.; Talamini, R.; Polesel, J.; Serraino, D.; Negri, E.; La Vecchia, C. Metabolic syndrome and pancreatic cancer risk: A case-control study in Italy and meta-analysis. Metabolism 2011, 60, 1372–1378. [Google Scholar] [PubMed]
- Esposito, K.; Chiodini, P.; Colao, A.; Lenzi, A.; Giugliano, D. Metabolic syndrome and risk of cancer: A systematic review and meta-analysis. Diabetes Care 2012, 35, 2402–2411. [Google Scholar] [CrossRef] [PubMed] [Green Version]


| Author Publication Year | Location | Study Design | Total Number of Subjects | Age | Diet-Assessment Method | Factors Adjusted for in Analysis | Dietary Patterns Identified |
|---|---|---|---|---|---|---|---|
| Chan et al. 2013 [9] | United States | Case-control | 532 cases 1701 controls | 21–85 years | FFQ | Age, race, education, diabetes, body mass index, smoking, alcohol drinking, physical activity, and total energy. | Prudent, western diet |
| Bosetti et al. 2013 [10] | Italy | Case-control | 326 cases 625 controls | Mean: 62 years | FFQ | Age, sex, study center and adjusted for year of interview, education, body mass index, tobacco smoking, alcohol drinking, and diabetes. | Animal products, unsaturated fats, vitamins and fiber, starch rich |
| Michaud et al. 2005 [11] | United States | Case-control | 47,493 men 77,179 women | 40–75 years | FFQ | Age, pack-years of smoking (for current and past smokers in past 15 years), body mass index, physical activity, history of diabetes mellitus, caloric intake, height, and multivitamin use. | Western, prudent |
| Nöthlings et al. 2008 [25] | United States | Cohort | 424,978 | 35–70 years | FFQ | Age, sex, and center as strata variables and for diabetes mellitus at baseline, BMI, energy intake, smoking status (4 categories), and the number of cigarettes as covariates. | Food; simplified food |
| Taunk et al. 2016 [26] | United States | Cohort | 322,848 | 50–71 years | FFQ | Smoking, BMI, self-reported diabetes (yes, no) and energy-adjusted saturated fat (continuous). | Total meat |
| Chan et al. 2005 [27] | United States | Case-control | 532 cases 1701 controls | 21–85 years | FFQ | Age, sex, and energy intake. | Total vegetables and fruits |
| Shigihara et al. 2014 [28] | Japan | Cohort | 32,859 | 40–74 years | FFQ | Age in years, body mass index in kg/m2, family history of cancer (yes or no), history of diabetes mellitus (yes or no), smoking status, alcohol consumption, time spent walking in hours/day (<0.5, 0.5–0.9, or ≥1), education (junior high school or less, high school, or college/ university or higher), marital status (married or unmarried), job status (employed or unemployed), consumption of meat in g/day and total caloric intake in kcal/day. | Total vegetables and fruits |
| Lyon et al. 1993 [29] | United States | Case-control | 149 cases 2363 controls | < 65 years | FFQ | Age, cigarette smoking, and consumption of coffee and alcohol | Red meat |
| Michaud et al. 2003 [30] | United States | Cohort | 88.802 | 30–55 years | FFQ | Pack-years of smoking (past 15 years; current and past smokers separately), body mass index (quintiles in 1976), history of diabetes mellitus, caloric intake (quintiles), height (quintiles), physical activity (continuous), and menopausal status. | Total meat intake |
| Nkondjock et al. 2005 [31] | Canada | Case-control | 585 cases 4779 controls | 30–74 years | FFQ | Age (in 5-year groups), smoking (0, >0–15 and >15 pack-years), BMI (5 categories), physical activity (total number of hours/month of moderate and strenuous activities), province (eight groups), educational attainment (years) and total energy intake (as a continuous variable). | Western, fruit and vegetables, drinker |
| Vrieling et al. 2009 [32] | European countries | Cohort | 478,400 | 35–70 years | FFQ | Age at entry, sex and center and adjusted for energy from fat, energy from non-fat, weight, height, history of diabetes (yes, no, missing), and smoking status (never, past (quit <10 year, 10 year), current (intensity 1–14, 15–24, 25 cig/day), unknown). | Total fruit and vegetable consumption |
| Larsson et al. 2006 [14] | Sweden | Cohort | 81,922 | > 55 years | FFQ | Age (in months), sex, education (less than high school, high school graduate, or more than high school), body mass index (<23.0, 23.0–24.9, 25.0–29.9, or ≥30 kg/m2), physical activity (hours/week; four categories), cigarette smoking status and pack-years of smoking (never, past < 20 pack-years, past ≥ 20 pack-years, current < 20 pack-years, current 20–39 pack-years, or current 40 pack-years), history of diabetes (yes or no), multivitamin supplement use (no use, occasional use, or regular use), and intakes of total energy (continuous) and alcohol (quartiles). | Fruits and vegetable consumption |
| Jansen et al. 2011 [33] | United States | Case-control | 384 cases 983 controls | 24–94 years | FFQ | Age, sex, smoking, body mass index, energy intake, and alcohol consumption. | Fruit and vegetable intake |
| Heinen et al. 2012 [34] | Netherlands | Cohort | 120,852 | 55–69 years | FFQ | Age(year), sex, smoking (current smoking: yes/no; number of cigarettes smoked per day; number of years of smoking), body mass index (kg/m2), family history of pancreatic cancer (yes/no), history of diabetes mellitus (yes/no), intake of energy (kcal/day), red meat (g/day), coffee (number of cups/day), and alcohol (g/day). | Fruit and vegetables |
| Nöthlings et al. 2005 [35] | United states | Cohort | 190,545 | 45–75 years | FFQ | Sex and time on study and adjusted for age at cohort entry, ethnicity, history of diabetes mellitus, familial history of pancreatic cancer, smoking status, and energy intake. | Red meat intake |
| Stolzenberg-Solomon et al. 2007 [36] | United States | Cohort | 537,302 | 50–71 years | FFQ | Age, energy, smoking, BMI, education, race, self- reported diabetes(yes/no), energy-adjusted saturated fat. | Total meat intake |
| Larsson et al. 2006 [37] | Sweden | Cohort | 61,433 | > 50 years | FFQ | Age (in months), education (less than high school, high school graduate, or more than high school), body mass index (<23.0, 23.0–24.9, 25.0–29.9 or 30 kg/m2), smoking (never smoker, past and smoked <20 pack-years, past and smoked 20 pack-years, current and smoked <20 pack-years or current and smoked 20 pack-years) and intakes of total energy (continuous), alcohol (quartiles) and energy-adjusted folate (quartiles). | Red meat |
| Anderson et al. 2002 [38] | United States | Case-control | 193 cases 674 controls | 20–64 years | FFQ | Age, sex, smoking (pack-years and pack-years squared), education, race, diabetes, white meat, red meat not grilled, and other red meat. | Meat intake |
| Inoue-Choi et al. 2011 [39] | United States | Cohort | 34,642 | 55–69 years | FFQ | Age (continuous), race, education (less than high school, high school, greater than high school), alcohol intake (yes/no), smoking (current, past, never smoker), physical activity (low, moderate, high). | Mediterranean; red meat |
| Arem et al. 2013 [40] | United States | Cohort | 537,128 | 50–71 years | FFQ | Daily caloric intake, sex (where appropriate), diabetes (yes/no), body mass index (15 to <18.5, 18.5 to <25, 25 to <30, 30 to ≤50 kg/m2, missing) and smoking status (categories describing never, ever, current, and dose). | HEI-2005 |
| Olsen et al. 1989 [41] | United States | Case-control | 212 cases 220 controls | 40–84 years | FFQ | Age, education level, reported diabetes mellitus history, cigarette smoking, meat and vegetable consumption. | Total alcohol |
| Silverman et al. 1995 [42] | United States | Case-control | 486 cases 2109 controls | 30–79 years | Questionnaire | Age, area, cigarette smoking, gallbladder disease, diabetes, and income. | Total alcohol consumption |
| Lucenteforte et al. 2012 [43] | Europe, China, United States | Case-control | 5585 cases 11,827 controls | Mean: 64 years | Questionnaire | Age, sex, race/ethnicity, education, body mass index, history of diabetes, tobacco smoking (in categories, plus a continuous term), and center for multicentric studies. | Total alcohol consumption |
| Heinen et al. 2009 [19] | Netherlands | Cohort | 12,085 | 55–69 years | FFQ | Age (years), sex, smoking (smoking status (current smoking: yes/no); number of cigarettes smoked per day; number of years of smoking), energy intake (kcal/day), body mass index (weight (kg)/height (m)2), vegetable intake (g/day), and fruit intake (g/day). | Total ethanol intake |
| Tavani et al. 1997 [44] | Italy | Case-control | 361 cases 997 controls | 17–79 years | Questionnaire | Age, sex, education, smoking status, and history of diabetes, pancreatitis, and cholelithiasis. | Total alcohol intake |
| Michaud et al. 2010 [45] | Europe, China, United States | Case-control | 1530 cases 1530 controls | > 60 years | Questionnaire | Age (continuous), cohort, gender, race (Caucasian, Asian, other), smoking (dose continuous, duration continuous), diabetes (yes, no, missing), and BMI (continuous). | Total alcohol |
| Villeneuve et al. 2000 [46] | Canada | Case-control | 583 cases 4813 controls | Mean: 59 years | Questionnaire | Age, province, coffee consumption, cigarette pack-years, energy intake and dietary fat. | Total alcohol |
| Jiao et al. 2009 [47] | United States | Cohort | 470,681 | 50–71 years | Questionnaire | Sex (for all); smoking variable (never smokers, quit 10 years ago and smoked <20 cigarettes/day, quit 10 years ago and smoked 20 cigarettes/day, quit 5–9 years ago and smoked <20 cigarettes/day, quit 5–9 years ago and smoked 20 cigarettes/day, quit 1–4 years ago and smoked <20 cigarettes/day, quit 1–4 years ago and smoked 20 cigarettes/day, current smokers with <20 cigarettes/day, and current smokers with 20 cigarettes/day); total energy intake (continuous), energy-adjusted saturated fat, red meat, and total folate intake (continuous scale); body mass index (<20, 20 to <25, 25 to <30, 30 kg/m2, missing); physical activity (low, moderate, and high level); and history of diabetes. | Alcohol use |
| Rahman et al. 2015 [48] | Canada | Case-control | 345 cases 1285 controls | ≤89 years | Questionnaire | Sex, age, body mass index (based on weight one year prior to questionnaire completion), type 2 diabetes, pancreatitis, family history of pancreas cancer, smoking status (non-smoker, current, former) | Alcohol consumption |
| Gapstur et al. 2011 [49] | United States | cohort | 453,770 men 576,697 women | 30–111 years | Questionnaire | Age, sex, race/ethnicity, education, marital status, body mass index, family history of pancreatic cancer, and personal history of gallstones, diabetes mellitus, or smoking. | Alcohol intake |
| Michaud et al. 2001 [50] | United States | cohort | 51,529 men 121,700 women | 40–75 years | FFQ | Age in 5-year categories, pack-years of smoking (past 15 years; current and past smokers separately), BMI (quintiles at baseline), history of diabetes mellitus, history of cholecysectomy, energy intake (quintiles), and period. | Alcohol intake |
| Johansen et al. 2009 [51] | Sweden | Cohort | 33,346 | Mean: 50 for men; 44 for women | Questionnaire | Age, sex, smoking status, Mm-MAST category (Mm-MAST is not adjusted for -glutamyl transferase (GT) and -GT is not adjusted for Mm-MAST) and BMI (weight gain not adjusted for BMI). | Alcohol consumption |
| Study Characteristic | Category | Healthy Pattern (95% CI) | Western-Type Pattern (95% CI) | Heavy Drinking Pattern (95% CI) | Light–Moderate Drinking Pattern (95% CI) |
|---|---|---|---|---|---|
| Age | >50 | 0.86 (0.76, 0.98) | 1.23 (1.02, 1.47) | 1.23 (1.11, 1.36) | 0.94 (0.87, 1.00) |
| <50 | 0.91 (0.71,1.16) | 1.28 (0.91, 1.80) | 1.23 (0.75, 2.02) | 0.84 (0.69, 1.02) | |
| Sample size | Large (>5000) | 0.98 (0.86, 1.11) | 1.14 (1.00, 1.30) | 1.14 (0.98, 1.32) | 0.91 (0.83, 1.00) |
| Small (<5000) | 0.72 (0.62, 0.85) | 1.84 (1.22, 2.76) | 1.73 (1.39, 2.16) | 0.84 (0.69, 1.02) | |
| Race | White | 0.85 (0.75, 0.95) | 1.24 (1.06, 1.45) | 1.33 (1.16, 1.52) | 0.94 (0.87, 1.00) |
| Yellow and Other | 1.20 (0.70, 2.06) | - | 0.94 (0.71, 1.25) | 0.84 (0.69, 1.02) | |
| Study design | Case-control | 0.70 (0.59, 0.85) | 1.78 (1.36, 2.32) | 1.47 (1.06, 2.04) | 0.81 (0.76, 0.86) |
| Cohort | 0.95 (0.85, 1.07) | 1.06 (0.93, 1.20) | 1.14 (1.06, 1.23) | 0.96 (0.89, 1.03) |
© 2017 by the authors; licensee MDPI, Basel, Switzerland. This article is an open access article distributed under the terms and conditions of the Creative Commons Attribution (CC-BY) license (http://creativecommons.org/licenses/by/4.0/).
Share and Cite
Lu, P.-Y.; Shu, L.; Shen, S.-S.; Chen, X.-J.; Zhang, X.-Y. Dietary Patterns and Pancreatic Cancer Risk: A Meta-Analysis. Nutrients 2017, 9, 38. https://doi.org/10.3390/nu9010038
Lu P-Y, Shu L, Shen S-S, Chen X-J, Zhang X-Y. Dietary Patterns and Pancreatic Cancer Risk: A Meta-Analysis. Nutrients. 2017; 9(1):38. https://doi.org/10.3390/nu9010038
Chicago/Turabian StyleLu, Pei-Ying, Long Shu, Shan-Shan Shen, Xu-Jiao Chen, and Xiao-Yan Zhang. 2017. "Dietary Patterns and Pancreatic Cancer Risk: A Meta-Analysis" Nutrients 9, no. 1: 38. https://doi.org/10.3390/nu9010038