Development and Validation of a Mediterranean Oriented Culture-Specific Semi-Quantitative Food Frequency Questionnaire

 , , ,
, , ,
Abstract
:
1. Introduction
2. Materials and Methods
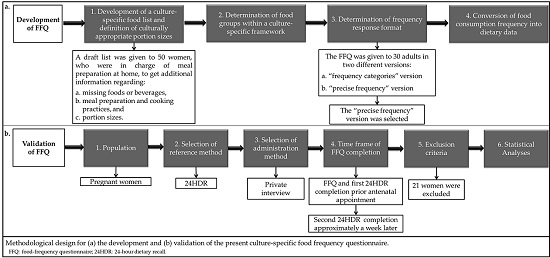
2.1. FFQ Development
2.1.1. Development of a Culture-Specific Food List and Definition of Culturally Appropriate Portion Sizes
2.1.2. Determination of Food Groups within a Culture-Specific Framework
2.1.3. Determination of Frequency Response Format
Example: Some participants reported eating a portion of raw salad or cooked vegetable salad every day and consuming a variety of vegetables, e.g., 2 times per week broccoli, 2 times per week cauliflower, 2 times per week tomato, and 1 time per week lettuce. In the “frequency categories” version, the only frequency type available on the FFQ for the salads consumed 2 times per week was the “2–4 times per week”, scored as 3. As such, the respondent was confronted as consuming 3 times per week each of these salads, i.e., the nutrient content of participant’s choices would be attributed to 10 portions per week, instead of 7. This fact led not only to an overestimation of the nutrients contained in the vegetables, but also to an overestimation of energy intake, mainly derived from the addition of olive oil. This observation on overestimation was further intensified, as the predetermined frequency options and olive oil addition applies also to other foods prevalent in the diet and served daily as side dishes (e.g., pasta, rice, potatoes).
2.1.4. Conversion of Food Consumption Frequency into Dietary Data
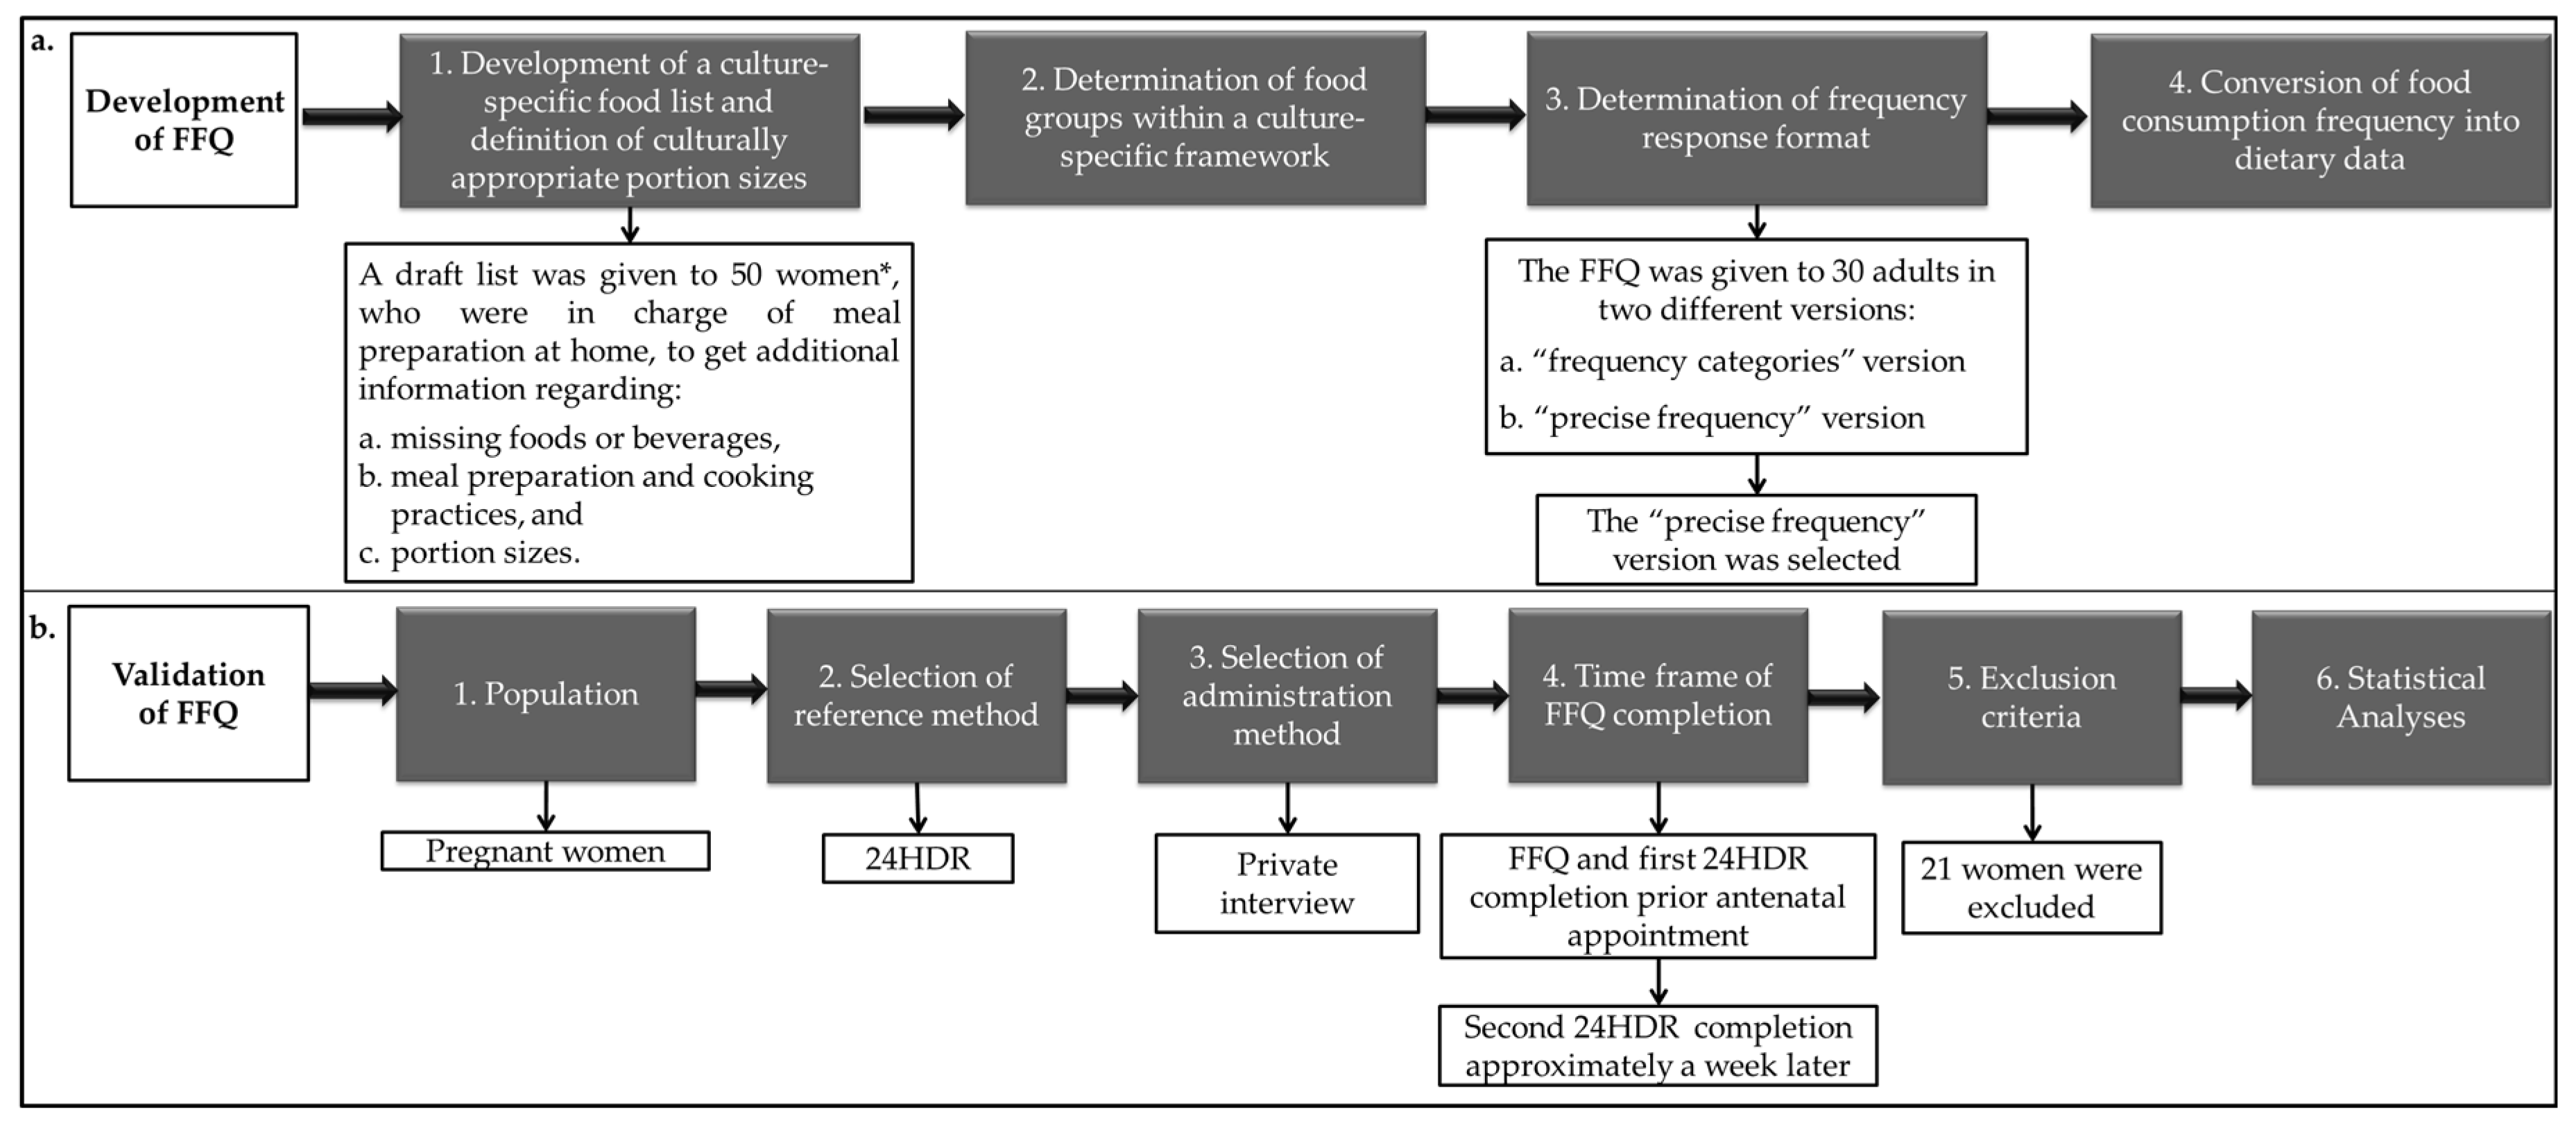
2.2. FFQ Validation
2.2.1. Population
2.2.2. Selection of Reference Method
2.2.3. Selection of Administration Method
2.2.4. Time Frame of FFQ Completion
2.2.5. Exclusion Criteria
2.2.6. Statistical Analyses
3. Results
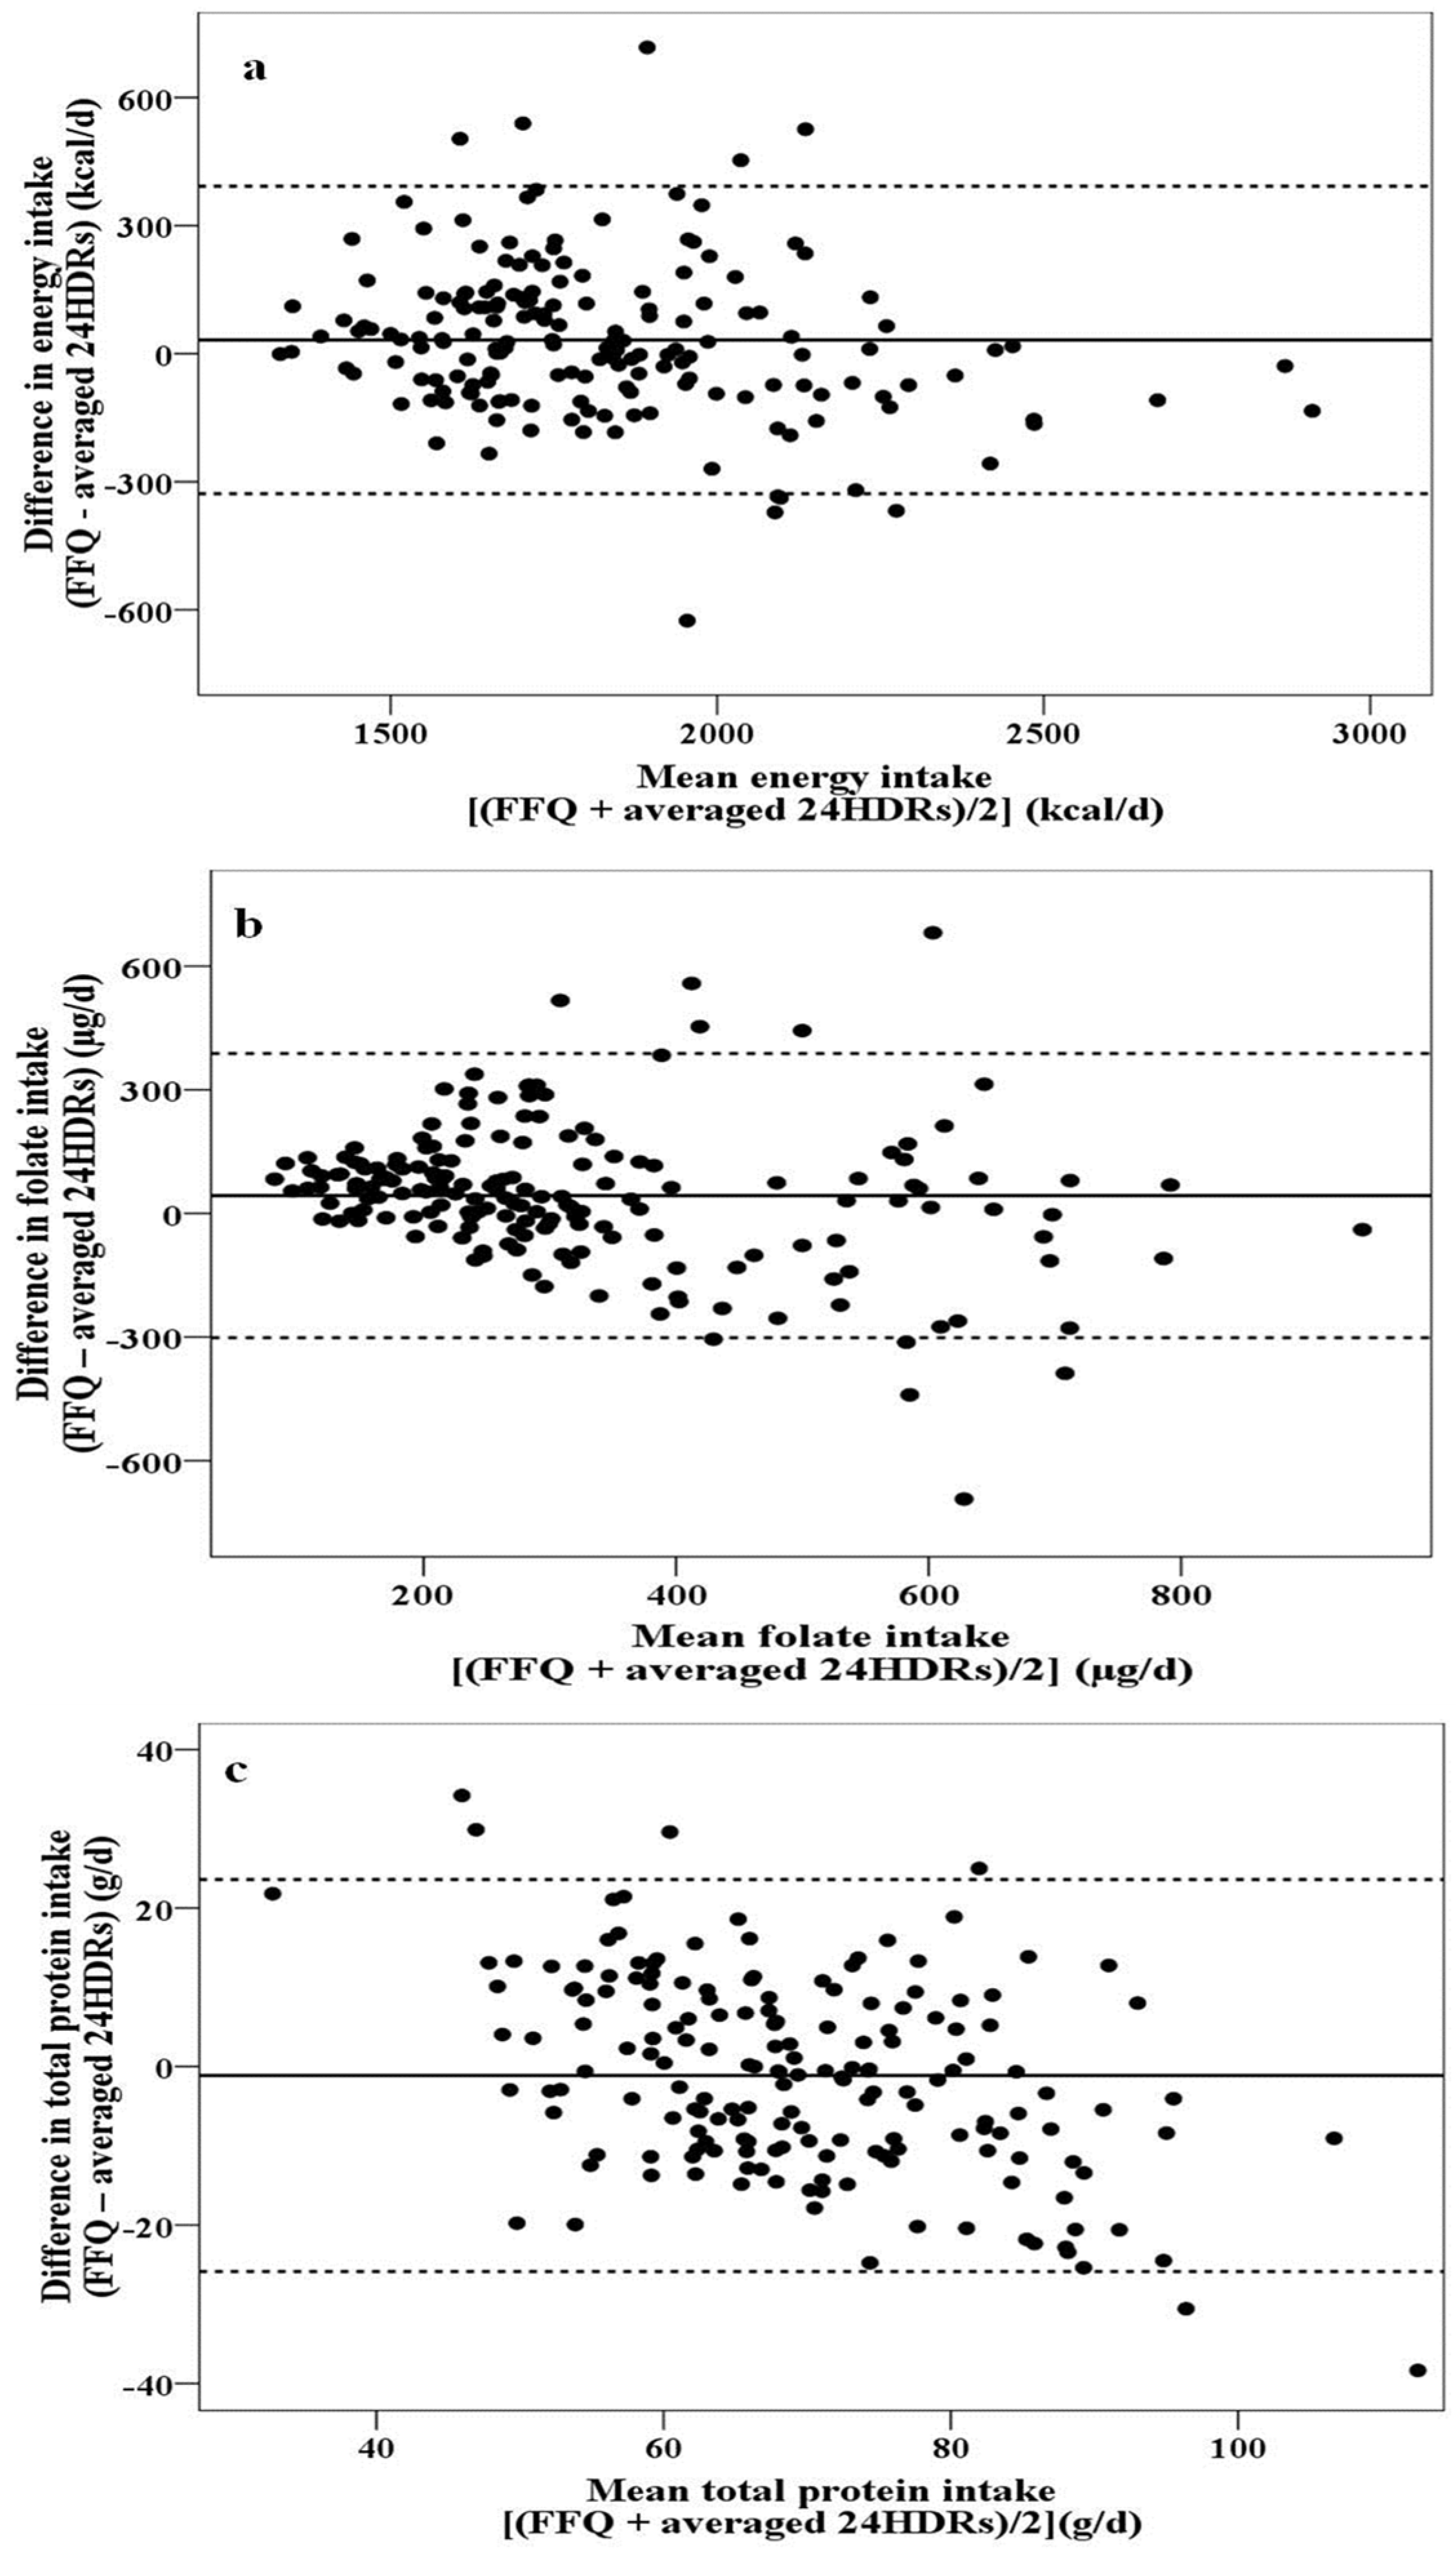
- (a)
- no relationship between differences and mean values were observed (Figure 2a), i.e., the agreement between the two methods is of the same magnitude irrespective of intake quantity (energy, carbohydrates, total lipids, MUFA, saturated fatty acids (SFA), cholesterol, percentage of energy derived from carbohydrates, percentage of energy derived from total lipids, percentage of energy derived from MUFA, percentage of energy derived from SFA, calcium, phosphorus, magnesium, and potassium),
- (b)
- a more scattered plot with increasing mean values was obtained (Figure 2b), meaning that the differences between the two methods are greater at the highest intakes (fiber, polyunsaturated fatty acids (PUFA), percentage of energy derived from PUFA, thiamine, niacin, pantothenic acid, vitamin B6, folate, vitamin B12, vitamin C, vitamin E, iron, and zinc), and
- (c)
- increasing negative differences with increasing mean values were noted (Figure 2c), meaning that, compared with the FFQ, the 24HDRs overestimate the intake as the intake quantity increases (total protein, plant protein, animal protein, percentage of energy derived from total protein, percentage of energy derived from plant protein, percentage of energy derived from animal protein, vitamin A, and sodium).
4. Discussion
4.1. Development of the Culture-Specific FFQ
4.2. FFQ Validation
4.3. Limitations of the Study
4.4. Strengths of the Study
5. Conclusions
Acknowledgments
Author Contributions
Conflicts of Interest
References
- Milner, J.A. Strategies for cancer prevention: The role of diet. Br. J. Nutr. 2002, 87, 265–272. [Google Scholar] [CrossRef]
- Yildiz, F.; Kotzekidou, P.; Michaelidou, A.M.; Nocella, G. Functional foods in mediterranean and middle eastern countries, history, scope and dietary habits. In Anti-Angiogenic Functional and Medicinal Foods; Losso, J., Shahidi, F., Bagchi, D., Eds.; CRC Press: New York, NY, USA, 2007; pp. 177–212. [Google Scholar]
- Sofi, F.; Cesari, F.; Abbate, R.; Gensini, G.F.; Casini, A. Adherence to Mediterranean diet and health status: Meta-analysis. BMJ 2008, 337, a1344. [Google Scholar] [CrossRef] [PubMed]
- Bach-Faig, A.; Berry, E.M.; Lairon, D.; Reguant, J.; Trichopoulou, A.; Dernini, S.; Medina, F.X.; Battino, M.; Belahsen, R.; Gemma, M.; et al. Mediterranean diet pyramid today. Science and cultural updates. Public Health Nutr. 2011, 14, 2274–2284. [Google Scholar] [CrossRef] [PubMed]
- Costacou, T.; Bamia, C.; Ferrari, P.; Riboli, E.; Trichopoulos, D.; Trichopoulou, A. Tracing the Mediterranean diet through principal components and cluster analyses in the Greek population. Eur. J. Clin. Nutr. 2003, 57, 1378–1385. [Google Scholar] [CrossRef] [PubMed]
- Alexandratos, N. The Mediterranean diet in a world context. Public Health Nutr. 2006, 9, 111–117. [Google Scholar] [CrossRef] [PubMed]
- Panagiotakos, D.B.; Pitsavos, C.; Stefanadis, C. Dietary patterns: A Mediterranean diet score and its relation to clinical and biological markers of cardiovascular disease risk. Nutr. Metab. Cardiovasc. Dis. 2006, 16, 559–568. [Google Scholar] [CrossRef] [PubMed]
- Kremmyda, L.S.; Papadaki, A.; Hondros, G.; Kapsokefalou, M.; Scott, J.A. Differentiating between the effect of rapid dietary acculturation and the effect of living away from home for the first time, on the diets of Greek students studying in Glasgow. Appetite 2008, 50, 455–446. [Google Scholar] [CrossRef] [PubMed]
- Dernini, S.; Berry, E.M. Mediterranean diet: From a healthy diet to a sustainable dietary pattern. Front. Nutr. 2015, 2, 15. [Google Scholar] [CrossRef] [PubMed]
- Vasilopoulou, A.; Galitsianos, I.; Fotiou, M.; Menexes, G.; Tsakoumaki, F.; Tsitlakidou, P.; Psirropoulos, D.; Michaelidou, A.M. An exploratory study of dietary intake patterns among adults diagnosed with cardiovascular risk factors. Int. J. Food Sci. Nutr. 2015, 66, 458–465. [Google Scholar] [CrossRef] [PubMed]
- Papazian, T.; Hout, H.; Sibai, D.; Helou, N.; Younes, H.; El Osta, N.; Rabbaa Khabbaz, L. Development, reproducibility and validity of a food frequency questionnaire among pregnant women adherent to the Mediterranean dietary pattern. Clin. Nutr. 2016. [Google Scholar] [CrossRef] [PubMed]
- Willett, W.C. Nutrition Epidemiology, 2nd ed.; Oxford University Press: New York, NY, USA, 1998. [Google Scholar]
- Cade, J.; Thompson, R.; Burley, V.; Warm, D. Development validation and utilization of food-frequency questionnaires—A review. Public Health Nutr. 2002, 5, 567–587. [Google Scholar] [CrossRef] [PubMed]
- Serra-Majem, L.; Andersen, L.F.; Henrique-Sànchez, P.; Doreste-Alonso, J.; Sànchez-Villegas, A.; Ortiz-Andrelluchi, A.; Negri, E.; La Vecchia, C. Evaluating the quality of dietary intake validation studies. Br. J. Nutr. 2009, 102, S3–S9. [Google Scholar] [CrossRef] [PubMed]
- Drewnowski, A.; Rock, C.L.; Henderson, S.A.; Shore, A.B.; Fischler, C.; Galan, P.; Preziosi, P.; Hercberg, S. Serum beta-carotene and vitamin C as biomarkers of vegetable and fruit intakes in a community-based sample of French adults. Am. J. Clin. Nutr. 1997, 65, 1796–1802. [Google Scholar] [PubMed]
- Carithers, T.C.; Talegawkar, S.A.; Rowser, M.L.; Henry, O.R.; Dubbert, P.M.; Bogle, M.L.; Taylor, H.A.; Tucker, K.L. Validity and calibration of food frequency questionnaires used with African-American adults in the Jackson Heart Study. J. Am. Diet. Assoc. 2009, 109, 1184–1193. [Google Scholar] [CrossRef] [PubMed]
- De Castro Selem, S.S.; de Carvalho, A.M.; Verly-Junior, E.; Carlos, J.V.; Teixeira, J.A.; Lobo Marchioni, D.M.; Fisberg, R.M. Validity and reproducibility of a food frequency questionnaire for adults of São Paulo, Brazil. Rev. Bras. Epidemiol. 2014, 17, 852–859. [Google Scholar] [CrossRef]
- Willett, W.C.; Sampson, L.; Stampfer, M.J.; Rosner, B.; Bain, C.; Witschi, J.; Hennekens, C.H.; Speizer, F.E. Reproducibility and validity of a semiquantitative food frequency questionnaire. Am. J. Epidemiol. 1985, 122, 51–65. [Google Scholar] [PubMed]
- Block, G.; Hartman, A.M.; Dresser, C.M.; Carroll, M.D.; Gannon, J.; Gardner, L. A data-based approach to diet questionnaire design and testing. Am. J. Epidemiol. 1986, 124, 453–469. [Google Scholar] [PubMed]
- Teufel, N.I. Development of culturally competent food-frequency questionnaires. Am. J. Clin. Nutr. 1997, 65, 1173S–1178S. [Google Scholar] [PubMed]
- Sharma, S. Development and use of FFQ among adults in diverse settings across the globe. Proc. Nutr. Soc. 2011, 70, 232–251. [Google Scholar] [CrossRef] [PubMed]
- Masson, L.F.; McNeill, G.; Tomany, J.O.; Simpson, J.A.; Peace, H.S.; Wei, L.; Grubb, D.A.; Bolton-Smith, C. Statistical approaches for assessing the relative validity of a food-frequency questionnaire, use of correlation coefficients and the kappa statistic. Public Health Nutr. 2003, 6, 313–321. [Google Scholar] [CrossRef] [PubMed]
- Beck, K.L.; Kruger, R.; Conlon, C.A.; Heath, A.L.M.; Coad, J.; Matthys, C.; Jones, B.; Stonehouse, W. The relative validity and reproducibility of an iron food frequency questionnaire for identifying iron-related dietary patterns in young women. J. Acad. Nutr. Diet. 2012, 112, 1177–1187. [Google Scholar] [CrossRef] [PubMed]
- Tayyem, R.F.; Abu-Mweis, S.S.; Bawadi, H.A.; Agraib, L.; Bani-Hani, K. Validation of a Food Frequency Questionnaire to assess macronutrient and micronutrient intake among Jordanians. J. Acad. Nutr. Diet. 2014, 114, 1046–1052. [Google Scholar] [CrossRef] [PubMed]
- Harding, J.E. The nutritional basis of the fetal origins of adult disease. Int. J. Epidemiol. 2001, 30, 15–23. [Google Scholar] [CrossRef] [PubMed]
- Kunz, L.H.; King, J.C. Impact of maternal nutrition and metabolism on health of the offspring. Semin. Fetal Neonatal Med. 2007, 12, 71–77. [Google Scholar] [CrossRef] [PubMed]
- Barker, D.J.P. Developmental origins of chronic disease. Public Health 2012, 126, 185–189. [Google Scholar] [CrossRef] [PubMed]
- Haugen, M.; Meltzer, H.M.; Brantsæter, A.L.; Mikkelsen, T.; Østerdal, M.L.; Alexander, J.; Olsen, S.F.; Bakketeig, L. Mediterranean-type diet and risk of preterm birth among women in the Norwegian Mother and Child Cohort Study (MoBa): A prospective cohort study. Acta Obstet. Gynecol. Scand. 2008, 87, 319–324. [Google Scholar] [CrossRef] [PubMed]
- Chatzi, L.; Mendez, M.; Garcia, R.; Roumeliotaki, T.; Ibarluzea, J.; Tardón, A.; Amiano, P.; Lertxundi, A.; Iñiguez, C.; Vioque, J.; et al. Mediterranean diet adherence during pregnancy and fetal growth: INMA (Spain) and RHEA (Greece) mother-child cohort studies. Br. J. Nutr. 2012, 107, 135–145. [Google Scholar] [CrossRef] [PubMed]
- Saunders, L.; Guldner, L.; Costet, N.; Kadhel, P.; Rouget, F.; Monfort, C.; Thomé, J.P.; Multigner, L.; Cordiera, S. Effect of a mediterranean diet during pregnancy on fetal growth and preterm delivery: Results from a french caribbean mother–child cohort study (TIMOUN). Paediatr. Perinat. Epidemiol. 2014, 28, 235–244. [Google Scholar] [CrossRef]
- Hebert, J.R.; Gupta, P.C.; Bhonsle, R.B.; Sinor, P.N.; Mehta, H.; Mehta, F.S. Development and testing of a quantitative food frequency questionnaire for use in Gujarat, India. Public Health Nutr. 1999, 2, 39–50. [Google Scholar] [CrossRef]
- Rodríguez, M.M.; Méndez, H.; Torún, B.; Scroeder, D.; Stein, A.D. Validation of a semi-quantitative food-frequency questionnaire for use among adults in Guatemala. Public Health Nutr. 2002, 5, 691–698. [Google Scholar] [CrossRef] [PubMed]
- Cheng, Y.; Yan, H.; Dibley, M.J.; Shen, Y.; Li, Q.; Zeng, L. Validity and reproducibility of a semi-quantitative food frequency questionnaire for use among pregnant women in rural China. Asia Pac. J. Clin. Nutr. 2008, 17, 166–177. [Google Scholar]
- Trichopoulou, A.; Georga, K. Composition Tables of Foods and Greek Dishes, 3rd ed.; Parisianou Publications: Athens, Greece, 2004. [Google Scholar]
- Kafatos, A.G.; Verhagen, H.; Moschandreas, J.; Apostolaki, I.; van Westerop, J.J.M. Mediterranean diet of Crete; foods and nutrient content. J. Am. Diet. Assoc. 2000, 100, 1487–1493. [Google Scholar] [CrossRef]
- United States Department of Agriculture, Agricultural Research Service (USDA). USDA National Nutrient Database for Standard Reference, Release 26. Nutrient Data Laboratory Home Page. Available online: http://www.ars.usda.gov/ba/bhnrc/ndl/ (accessed on 2 September 2013).
- Hu, Y.; Block, G.; Sternfeld, B.; Sowers, M. Dietary glycemic load, glycemic index, and associated factors in a multiethnic cohort of midline women. J. Am. Coll. Nutr. 2009, 28, 636–647. [Google Scholar] [CrossRef] [PubMed]
- Foster-Powell, K.; Holt, S.H.A.; Brand-Miller, J.C. International table of glycemic index and glycemic load values: 2002. Am. J. Clin. Nutr. 2002, 76, 5–56. [Google Scholar] [PubMed]
- World Health Organization (WHO). Report of a WHO Consultation on Obesity. Obesity, Preventing and Managing the Global Epidemic; World Health Organization: Geneva, Switzerland, 1998. [Google Scholar]
- International Physical Activity Questionnaire (IPAQ). The IPAQ Home Page. Available online: https://sites.google.com/site/theipaq/home (accessed on 15 May 2010).
- Chasan-Taber, L.; Schmidt, M.D.; Roberts, D.E.; Hosmer, D.; Markenson, G.; Freedson, P.S. Development and validation of a pregnancy physical activity questionnaire. Med. Sci. Sports Exerc. 2004, 36, 1750–1760. [Google Scholar] [CrossRef] [PubMed]
- Papathanasiou, G.; Georgoudis, G.; Papandreou, M.; Spyropoulos, P.; Georgakopoulos, D.; Kalfakakou, V.; Evangelou, A. Reliability measures of the short International Physical Activity Questionnaire (IPAQ) in Greek young adults. Hellenic J. Cardiol. 2009, 50, 283–294. [Google Scholar] [PubMed]
- Gnardellis, C.; Trichopoulou, A.; Katsouyanni, K.; Polychronopoulos, E.; Rimm, B.E.; Trichopoulos, D. Reproducibility and validity of an extensive semiquantitative food frequency questionnaire among Greek school teacher. Epidemiology 1995, 6, 74–77. [Google Scholar] [CrossRef] [PubMed]
- Katsouyanni, K.; Rimm, E.; Gnardellis, C.; Trichopoulos, D.; Polychronopoulos, E.; Trichopoulou, A. Reproducibility and relative validity of an extensive semi-quantitative food frequency questionnaire using dietary records and biochemical markers among greek schoolteachers. Int. J. Epidemiol. 1997, 26, 118–127. [Google Scholar] [CrossRef]
- Baer, H.J.; Blum, R.E.; Rockett, H.R.H.; Leppert, J.; Gardner, J.D.; Suitor, C.W.; Colditz, G.A. Use of a food frequency questionnaire in American Indian and Caucasian pregnant women: A validation study. BMC Public Health 2005, 5, 135. [Google Scholar] [CrossRef] [PubMed]
- Mouratidou, T.; Ford, F.; Fraser, R.B. Validation of a food-frequency questionnaire for use in pregnancy. Public Health Nutr. 2006, 9, 512–522. [Google Scholar] [CrossRef]
- Deschamps, V.; de Lauzon-Guillain, B.; Lafay, L.; Borys, J.M.; Charles, M.A.; Romon, M. Reproducibility and relative validity of a food-frequency questionnaire among French adults and adolescents. Eur. J. Clin. Nutr. 2009, 63, 282–291. [Google Scholar] [CrossRef]
- Roumelioti, M.; Leotsinidis, M. Relative validity of a semiquantitative food frequency questionnaire designed for schoolchildren in western Greece. Nutr. J. 2009, 8. [Google Scholar] [CrossRef]
- Marques-Vidal, P.; Ross, A.; Wynn, E.; Rezzi, S.; Paccaud, F.; Decarli, B. Reproducibility and relative validity of a food-frequency questionnaire for French-speaking Swiss adults. Food Nutr. Res. 2011, 55, 5905. [Google Scholar] [CrossRef] [PubMed]
- Xia, W.; Sun, C.; Zhang, L.; Zhang, X.; Wang, J.; Wang, H.; Wu, L. Reproducibility and relative validity of a food frequency questionnaire developed for female adolescents in Suihua, North China. PLoS ONE 2011, 6. [Google Scholar] [CrossRef] [PubMed]
- Mejía-Rodríguez, F.; Orjuela, M.A.; García-Guerra, A.; Quezada-Sanchez, A.D.; Neufeld, L.M. Validation of a novel method for retrospectively estimating nutrient intake during pregnancy using a semi-quantitative food frequency questionnaire. Matern. Child Health J. 2012, 16, 1468–1483. [Google Scholar] [CrossRef] [PubMed]
- Barbieri, P.; Nishimura, R.Y.; Crivellenti, L.C.; Sartorelli, D.C.; Sartorelli, D. Relative validation of a quantitative FFQ for use in Brazilian pregnant women. Public Health Nutr. 2013, 16, 1419–1426. [Google Scholar] [CrossRef] [PubMed]
- Liese, A.D.; Crandell, J.L.; Tooze, J.A.; Fangman, M.T.; Couch, S.C.; Merchant, A.T.; Bell, R.A.; Mayer-Davis, E.J. Relative validity and reliability of a food frequency questionnaire in youth with type 1 diabetes. Public Health Nutr. 2015, 18, 428–437. [Google Scholar] [CrossRef]
- Mohammadifard, N.; Sajjadi, F.; Maghroun, M.; Alikhasi, H.; Nilforoushzadeh, F.; Sarrafzadegan, N. Validation of a simplified food frequency questionnaire for the assessment of dietary habits in Iranian adults, Isfahan Healthy Heart Program, Iran. ARYA Atheroscler. 2015, 11, 139–146. [Google Scholar] [PubMed]
- Tang, Y.; Liu, Y.; Xu, L.; Jia, Y.; Shan, D.; Li, W.; Pan, X.; Kang, D.; Huang, C.; Li, X.; et al. Validity and reproducibility of a revised Semi-Quantitative Food Frequency Questionnaire (SQFFQ) for women of age-group 12–44 years in Chengdu. J. Health Popul. Nutr. 2015, 33, 50–59. [Google Scholar] [PubMed]
- Zhang, H.; Qiu, X.; Zhong, C.; Zhang, K.; Xiao, M.; Yi, N.; Xiong, G.; Wang, J.; Yao, J.; Hao, L.; et al. Reproducibility and relative validity of a semi-quantitative food frequency questionnaire for Chinese pregnant women. Nutr. J. 2015, 14, 56. [Google Scholar] [CrossRef] [PubMed]
- Fornés, N.S.; Stringhini, M.L.F.; Elias, B.M. Reproducibility and validity of a food-frequency questionnaire for use among low-income Brazilian workers. Public Health Nutr. 2003, 6, 821–827. [Google Scholar] [CrossRef] [PubMed]
- Bohlscheid-Thomas, S.; Hoting, I.; Boeing, H.; Wahrendorf, J. Reproducibility and relative validity of food group intake in a food frequency questionnaire developed for the german part of the EPIC project. Int. J. Epidemiol. 1997, 26, 71–81. [Google Scholar] [CrossRef]
- Lee, M.N.; Saha, S. Nausea and Vomiting of Pregnancy. Gastroenterol. Clin. N. Am. 2011, 40. [Google Scholar] [CrossRef] [PubMed]
- Suitor, C.J.; Gardner, J.; Willett, W.C. A comparison of food frequency and diet recall methods in studies of nutrient intake of low-income pregnant women. J. Am. Diet. Assoc. 1989, 89, 1786–1794. [Google Scholar] [PubMed]
- Wei, E.K.; Gardner, J.; Field, A.E.; Rosner, B.A.; Colditz, G.A.; Suitor, C.W. Validity of a food frequency questionnaire in assessing nutrient intakes of low income pregnant women. Matern. Child Health J. 1999, 3, 241–246. [Google Scholar] [CrossRef] [PubMed]
- De Vriese, S.R.; de Henauw, S.; de Backer, G.; Dhont, M.; Christophe, A.B. Estimation of dietary fat intake of Belgian pregnant women. Comparison of two methods. Ann. Nutr. Metab. 2001, 45, 273–278. [Google Scholar] [CrossRef] [PubMed]
- Erkkola, M.; Karppinen, M.; Javanainen, J.; Räsänen, L.; Knip, M.; Virtanen, S.M. Validity and reproducibility of a food frequency questionnaire for pregnant Finnish women. Am. J. Epidemiol. 2001, 154, 466–476. [Google Scholar] [CrossRef] [PubMed]
- Mikkelsen, T.B.; Osler, M.; Olsen, S.F. Validity of protein, retinol, folic acid and n-3 fatty acid intakes estimated from the food-frequency questionnaire used in the Danish National Birth Cohort. Public Health Nutr. 2006, 9, 771–778. [Google Scholar] [CrossRef] [PubMed]
- Brunst, K.J.; Kannan, S.; Ni, Y.M.; Gennings, C.; Ganguri, H.B.; Wright, R.J. Validation of a food frequency questionnaire for estimating micronutrient intakes in an urban US sample of multi-ethnic pregnant women. Matern. Child Health J. 2016, 20, 250–260. [Google Scholar] [CrossRef] [PubMed]
- European Food Safety Authority (EFSA). Panel on dietetic products, nutrition and allergies (NDA), scientific opinion on dietary reference values for energy. EFSA J. 2013, 11, 3005. [Google Scholar] [CrossRef] [Green Version]
- Cohen, J. Statistical Power Analysis for the Behavioral Sciences, 2nd ed.; Lawrence Erlbaum Associates, Inc.: Hillsdale, NJ, USA, 1988. [Google Scholar]
- Bland, J.M.; Altman, D. Statistical methods for assessing agreement between two methods of clinical measurement. Lancet 1986, 327, 307–310. [Google Scholar] [CrossRef]
- Mehta, C.; Patel, R. SPSS Exact Tests 7.0 for Windows; SPSS Inc.: Chicago, IL, USA, 1996. [Google Scholar]
- Fleiss, J.L.; Cohen, J. The equivalence of weighted kappa and the intraclass correlation coefficient as measures of reliability. Educ. Psychol. Meas. 1973, 33, 613–619. [Google Scholar] [CrossRef]
- Landis, J.R.; Koch, G.C. The measurement of observer agreement for categorical data. Biometrics 1977, 33, 159–174. [Google Scholar] [CrossRef] [PubMed]
- MacIntyre, U.E.; Venter, C.S.; Vorster, H.H. A culture-sensitive quantitative food frequency questionnaire used in an African population: 1. Development and reproducibility. Public Health Nutr. 2001, 4, 53–62. [Google Scholar] [CrossRef] [PubMed]
- Buchowski, M.S.; Schlundt, D.G.; Hargreaves, M.K.; Hankin, J.H.; Signorello, L.B.; Blot, W.J. Development of a culturally sensitive food frequency questionnaire for use in the Southern Community Cohort Study. Cell. Mol. Biol. 2003, 49, 1295–1304. [Google Scholar] [PubMed]
- Kelemen, L.E.; Anand, S.S.; Vuksan, V.; Yi, Q.; Teo, K.K.; Devanesen, S.; Yusuf, S.; SHARE Investigators. Development and evaluation of cultural food frequency questionnaires for South Asians, Chinese, and Europeans in North America. J. Am. Diet. Assoc. 2003, 103, 1178–1184. [Google Scholar] [CrossRef]
- D’Ambrosio, A.; Tiessen, A.; Simpson-Randall, J. Development of a food frequency questionnaire for toddlers of low-german-speaking mennonites from Mexico. Can. J. Diet. Pract. Res. 2012, 73, 40–44. [Google Scholar] [CrossRef] [PubMed]
- Hamdan, M.; Monteagudo, C.; Lorenzo-Tovar, M.L.; Tur, J.A.; Olea-Serrano, F.; Mariscal-Arcas, M. Development and validation of a nutritional questionnaire for the Palestine population. Public Health Nutr. 2014, 17, 2512–2518. [Google Scholar] [CrossRef] [PubMed]
- Kolahdooz, F.; Simeon, D.; Ferguson, G.; Sharma, S. Development of a Quantitative Food Frequency Questionnaire for use among the Yuṕik People of Western Alaska. PLoS ONE 2014, 9, e100412. [Google Scholar] [CrossRef] [PubMed]
- Sheehy, T.; Kolahdooz, F.; Mtshali, T.L.; Khamis, T.; Sharma, S. Development of a quantitative food frequency questionnaire for use among rural South Africans in KwaZulu-Natal. J. Hum. Nutr. Diet. 2014, 27, 443–449. [Google Scholar] [CrossRef] [PubMed]
- Morita, A.; Natsuhara, K.; Tomitsuka, E.; Odani, S.; Baba, J.; Tadokoro, K.; Igai, K.; Greenhill, A.R.; Horwood, P.F.; Soli, K.W.; et al. Development, validation, and use of a semi-quantitative food frequency questionnaire for assessing protein intake in Papua New Guinean Highlanders. Am. J. Hum. Biol. 2015, 27, 349–357. [Google Scholar] [CrossRef]
- Moghames, P.; Hammami, N.; Hwalla, N.; Yazbeck, N.; Shoaib, H.; Lara Nasreddine, L.; Naja, F. Validity and reliability of a food frequency questionnaire to estimate dietary intake among Lebanese children. Nutr. J. 2016, 15, 4. [Google Scholar] [CrossRef] [PubMed]
- Taren, D.; de Tobar, M.; Ritenbaugh, C.; Graver, E.; Whitacre, R.; Aickin, M. Evaluation of the Southwest Food Frequency Questionnaire. Ecol. Food Nutr. 2000, 38, 515–547. [Google Scholar] [CrossRef]
- Bountziouka, V.; Bathrellou, E.; Giotopoulou, A.; Katsagoni, C.; Bonou, M.; Vallianou, N.; Barbetseas, J.; Avgerinos, P.C.; Panagiotakos, D.B. Development, repeatability and validity regarding energy and macronutrient intake of a semi-quantitative food frequency questionnaire, Methodological considerations. Nutr. Metab. Cardiovasc. Dis. 2012, 22, 659–667. [Google Scholar] [CrossRef] [PubMed]
- Lombard, M.J.; Steyn, N.P.; Charlton, K.E.; Senekal, M. Application and interpretation of multiple statistical tests to evaluate validity of dietary intake assessment methods. Nutr. J. 2015, 14. [Google Scholar] [CrossRef] [Green Version]
- Osowski, J.M.; Beare, T.; Specker, B. Validation of a food frequency questionnaire for assessment of calcium and bone-related nutrient intake in rural populations. J. Am. Diet. Assoc. 2007, 107, 1349–1355. [Google Scholar] [CrossRef]
- Henn, R.L.; Fuchs, S.C.; Moreira, B.L.; Fuchs, F.D. Development and validation of a food frequency questionnaire (FFQ-Porto Alegre) for adolescent, adult and elderly populations from Southern Brazil. Cad. Saude Publica 2010, 26, 2068–2079. [Google Scholar] [CrossRef]
- Jaceldo-Siegl, K.; Knutsen, S.F.; Sabaté, J.; Beeson, W.L.; Chan, J.; Herring, R.P.; Butler, T.L.; Haddad, E.; Bennett, H.; Montgomery, S.; et al. Validation of nutrient intake using an FFQ and repeated 24 h recalls in black and white subjects of the Adventist Health Study-2 (AHS-2). Public Health Nutr. 2010, 13, 812–819. [Google Scholar] [CrossRef]
- Zhao, W.H.; Huang, Z.P.; Zhang, X.; He, L.; Willett, W.; Wang, J.L.; Hasegawa, K.; Chen, J.S. Reproducibility and validity of a Chinese food frequency questionnaire. Biomed. Environ. Sci. 2010, 23, 1–38. [Google Scholar] [CrossRef]
- McGowan, C.A.; Curran, S.; McAuliffe, F.M. Relative validity of a food frequency questionnaire to assess nutrient intake in pregnant women. J. Hum. Nutr. Diet. 2014, 27, 167–174. [Google Scholar] [CrossRef] [PubMed]
- Hjartåker, A.; Frost Andersen, L.; Lund, E. Comparison of diet measures from a food-frequency questionnaire with measures from repeated 24-h dietary recalls. The Norwegian Women and Cancer Study. Public Health Nutr. 2007, 10, 1094–1103. [Google Scholar] [CrossRef] [PubMed]
- Ahn, Y.; Kwon, E.; Shim, J.E.; Park, M.K.; Joo, Y.; Kimm, K.; Park, C.; Kim, D.H. Validation and reproducibility of food frequency questionnaire for Korean genome epidemiologic study. Eur. J. Clin. Nutr. 2007, 61, 1435–1441. [Google Scholar] [CrossRef] [PubMed]
- Dehghan, M.; del Cerro, S.; Zhang, X.; Cuneo, J.M.; Linetzky, B.; Diaz, R.; Merchant, A.T. Validation of a semi-quantitative Food Frequency Questionnaire for Argentinean adults. PLoS ONE 2012, 7, e37958. [Google Scholar] [CrossRef] [PubMed]
- Shim, J.S.; Oh, K.; Kim, H.C. Dietary assessment methods in epidemiologic studies. Epidemiol. Health 2014, 36, e2014009. [Google Scholar] [CrossRef]
- Pinto, E.; Severo, M.; Correia, S.; dos Santos Silva, I.; Lopes, C.; Barros, H. Validity and reproducibility of a semi-quantitative food frequency questionnaire for use among Portuguese pregnant women. Matern. Child Nutr. 2010, 6, 105–119. [Google Scholar] [CrossRef] [PubMed]

| Step 1. Convert Frequency Consumption Data into Grams of Food per Day. |
| For this purpose, any weekly or monthly frequency of consumption was converted into daily, by dividing with 7 or 30, respectively. The daily frequency of consumption by food was, then, multiplied by the appropriate portion size in grams. |
| Step 2. Calculate Daily Nutrient Intake by Food. |
| The daily nutrient intake by food was computed by multiplying the food intake (in grams) by the corresponding nutrient content per gram. |
| Step 3. Calculate Daily Nutrient Intake by Food Group. |
| Daily nutrient intake by food group was computed by summing the daily nutrient contribution of all food items belonging to this food category. |
| Step 4. Calculate Total Daily Nutrient Intake. |
| Total daily nutrient intake was computed by summing up the daily nutrient contributions of all food items. |
| Step 5. Compute the Nutrient Density (Nutrient Intake per Energy Intake) by Food/Food Group and Overall. |
| Step 6. Compute Dietary GI and MDS. |
| Dietary GI was calculated according to Hu et al., (2009) [37], using white bread as the standard reference. GI values of the different food items were derived from published international tables [38]. |
| MDS was computed according to Panagiotakos et al., (2006) [7]. |
| Characteristic | Mean (SD) |
| Maternal age (year) | 36.8 (4.1) |
| Pre-pregnancy BMI (kg/m2) | 24.1 (4.8) |
| Characteristic | n (%) |
| Pre-pregnancy BMI | |
| Underweight (BMI < 18.5 kg/m2) | 7 (3.9) |
| Normal (BMI 18.5–24.9 kg/m2) | 108 (60.3) |
| Overweight (BMI 25–29.9 kg/m2) | 43 (24.0) |
| Obese (BMI ≥ 30 kg/m2) | 21 (11.8) |
| Education | |
| 9 years | 10 (5.6) |
| 12 years | 69 (38.6) |
| >12 years | 100 (55.8) |
| Working during pregnancy | |
| Yes | 103 (57.5) |
| No | 76 (42.5) |
| Smoking during pregnancy | |
| Yes | 26 (14.5) |
| No | 153 (85.5) |
| Physical activity level | |
| Low activity | 147 (82.1) |
| Moderate activity | 17 (9.5) |
| High activity | 15 (8.4) |
| Min | Q25 | Median | Q75 | Max | Mean (SD) | SE | Skewness | Kurtosis | K-S p | ||
|---|---|---|---|---|---|---|---|---|---|---|---|
| Energy (kcal) | F | 1330 | 1645 | 1800 | 1980 | 2854 | 1838 (271) | 20 | 0.9 | 1.4 | 0.12 |
| R | 1294 | 1599 | 1738 | 1937 | 2977 | 1806 (310) | 23 | 1.1 | 1.4 | 0.03 | |
| Total protein (g) | F | 40 | 61 | 68 | 77 | 102 | 69 (11) | 1 | 0.3 | 0.03 | 0.59 |
| R | 22 | 60 | 69 | 79 | 132 | 70 (16) | 1 | 0.4 | 0.9 | 0.38 | |
| Plant protein (g) | F | 12 | 19 | 23 | 28 | 39 | 23 (5) | 0.4 | 0.4 | −0.2 | 0.51 |
| R | 4 | 15 | 21 | 28 | 48 | 22 (8) | 1 | 0.5 | 0.04 | 0.45 | |
| Animal protein (g) | F | 24 | 39 | 44 | 53 | 79 | 45 (11) | 1 | 0.4 | 0.4 | 0.28 |
| R | 6 | 35 | 47 | 59 | 118 | 48 (18) | 1 | 0.4 | 0.8 | 0.88 | |
| Carbohydrates (g) | F | 103 | 151 | 172 | 194 | 326 | 174 (34) | 3 | 0.9 | 2.2 | 0.12 |
| R | 86 | 142 | 164 | 190 | 308 | 170 (41) | 3 | 0.9 | 1.3 | 0.05 | |
| Fiber (g) | F | 7 | 14 | 17 | 21 | 37 | 18 (5) | 0.4 | 0.8 | 0.7 | 0.29 |
| R | 4 | 11 | 15 | 20 | 40 | 17 (7) | 1 | 0.9 | 0.5 | 0.05 | |
| Total lipids (g) | F | 59 | 81 | 89 | 98 | 147 | 91 (15) | 1 | 0.8 | 1.1 | 0.08 |
| R | 46 | 78 | 88 | 99 | 152 | 89 (17) | 1 | 0.7 | 1.5 | 0.27 | |
| MUFA (g) | F | 28 | 40 | 44 | 49 | 73 | 45 (7) | 1 | 0.9 | 1.9 | 0.15 |
| R | 24 | 37 | 43 | 48 | 81 | 43 (9) | 1 | 0.6 | 1.6 | 0.64 | |
| PUFA (g) | F | 7 | 10 | 11 | 14 | 27 | 12 (3) | 0.3 | 1.2 | 2 | 0.003 |
| R | 4 | 9 | 11 | 14 | 35 | 12 (5) | 0.4 | 1.6 | 3.7 | <0.001 | |
| SFA (g) | F | 14 | 23 | 28 | 31 | 51 | 28 (7) | 1 | 0.7 | 1 | 0.29 |
| R | 8 | 22 | 27 | 33 | 57 | 28 (8) | 1 | 0.8 | 1.1 | 0.05 | |
| Cholesterol (mg) | F | 75 | 186 | 219 | 262 | 437 | 229 (67) | 5 | 0.8 | 1.1 | 0.15 |
| R | 36 | 154 | 207 | 268 | 625 | 226 (102) | 8 | 1 | 1.3 | 0.04 | |
| % Energy from total protein | F | 10 | 14 | 15 | 16 | 22 | 15 (2) | 0.1 | 0.2 | 1.1 | 0.41 |
| R | 6 | 14 | 16 | 17 | 28 | 16 (3) | 0.2 | 0.4 | 2.3 | 0.83 | |
| % Energy from plant protein | F | 3 | 4 | 5 | 6 | 8 | 5 (1) | 0.1 | 0.2 | −0.1 | 0.54 |
| R | 1 | 4 | 5 | 6 | 9 | 5 (2) | 0.1 | 0.2 | −0.5 | 0.91 | |
| % Energy from animal protein | F | 4 | 9 | 10 | 11 | 16 | 10 (2) | 0.2 | 0.2 | 0.2 | 0.26 |
| R | 2 | 8 | 11 | 13 | 25 | 11 (4) | 0.3 | 0.3 | 1.2 | 0.75 | |
| % Energy from carbohydrates | F | 26 | 35 | 37 | 40 | 50 | 38 (4) | 0.3 | 0.4 | 0.4 | 0.25 |
| R | 20 | 34 | 37 | 41 | 62 | 37 (6) | 0.4 | 0.4 | 2.1 | 0.52 | |
| % Energy from total lipids | F | 33 | 42 | 45 | 48 | 53 | 45 (4) | 0.3 | −0.4 | 0.02 | 0.78 |
| R | 30 | 42 | 45 | 48 | 55 | 45 (5) | 0.4 | −0.4 | 0.02 | 0.64 | |
| % Energy from MUFA | F | 16 | 20 | 22 | 24 | 29 | 22 (2) | 0.2 | 0.2 | −0.2 | 0.94 |
| R | 12 | 19 | 21 | 24 | 32 | 22 (4) | 0.3 | 0.2 | −0.2 | 0.87 | |
| % Energy from PUFA | F | 4 | 5 | 6 | 7 | 15 | 6 (1) | 0.1 | 2.5 | 11 | 0.009 |
| R | 0 | 4 | 5 | 7 | 14 | 6 (2) | 0.2 | 0.8 | 2.1 | 0.001 | |
| % Energy from SFA | F | 8 | 12 | 13 | 15 | 19 | 14 (2) | 0.2 | 0.1 | 0.1 | 0.78 |
| R | 5 | 12 | 14 | 16 | 22 | 14 (3) | 0.2 | −0.1 | −0.1 | 0.96 | |
| Thiamin (mg) | F | 0.6 | 1.2 | 1.4 | 1.8 | 3.5 | 1.6 (0.6) | 0.04 | 1.1 | 1 | 0.03 |
| R | 0.3 | 1 | 1.4 | 2.1 | 3.8 | 1.6 (0.7) | 0.05 | 0.6 | −0.4 | 0.01 | |
| Riboflavin (mg) | F | 0.9 | 1.7 | 2.1 | 2.6 | 4.6 | 2.2 (0.8) | 0.06 | 0.8 | 0.2 | 0.11 |
| R | 0.6 | 1.4 | 1.8 | 2.5 | 4.7 | 2 (0.9) | 0.06 | 0.9 | 0.3 | 0.004 | |
| Niacin (mg) | F | 7 | 14 | 17 | 22 | 44 | 19 (7) | 1 | 1.1 | 0.7 | 0.01 |
| R | 2 | 13 | 18 | 26 | 49 | 19 (9) | 1 | 0.7 | 0.1 | 0.1 | |
| Pantothenic acid (mg) | F | 3 | 4 | 5 | 9 | 22 | 7 (4) | 0.3 | 1.3 | 0.9 | <0.001 |
| R | 1 | 4 | 5 | 6 | 20 | 6 (4) | 0.3 | 1.4 | 0.5 | <0.001 | |
| Vitamin B6 (mg) | F | 0.9 | 1.4 | 1.7 | 2.3 | 5.6 | 2 (0.8) | 0.06 | 1.4 | 2.1 | 0.001 |
| R | 0.4 | 1.3 | 1.6 | 2.1 | 4.4 | 1.9 (0.9) | 0.07 | 1 | 0.2 | <0.001 | |
| Folate (μg) | F | 113 | 225 | 292 | 426 | 944 | 346 (171) | 12 | 1.2 | 1.1 | 0.001 |
| R | 30 | 140 | 244 | 409 | 975 | 303 (210) | 16 | 1.1 | 0.7 | 0.001 | |
| Vitamin B12 (μg) | F | 1.6 | 3 | 4.5 | 6.3 | 14.3 | 5.1 (2.6) | 0.2 | 1.1 | 0.5 | 0.01 |
| R | 0.2 | 2.4 | 3.8 | 7.1 | 17.7 | 4.8 (3.2) | 0.2 | 1.1 | 0.7 | <0.001 | |
| Vitamin C (mg) | F | 23 | 80 | 117 | 167 | 419 | 134 (71) | 5 | 1.2 | 1.5 | 0.017 |
| R | 3 | 43 | 95 | 153 | 421 | 110 (87) | 7 | 1.1 | 0.8 | 0.03 | |
| Vitamin A (RAE) | F | 205 | 410 | 499 | 606 | 1164 | 511 (155) | 12 | 0.8 | 1.5 | 0.38 |
| R | 79 | 281 | 420 | 704 | 1642 | 503 (290) | 22 | 1 | 0.7 | 0.007 | |
| Vitamin E (mg) | F | 5 | 9 | 12 | 17 | 37 | 14 (6) | 0.5 | 1.3 | 1.4 | 0.003 |
| R | 3 | 7 | 10 | 15 | 32 | 12 (7) | 0.5 | 1.1 | 0.3 | <0.001 | |
| Calcium (mg) | F | 454 | 857 | 1011 | 1221 | 2035 | 1044 (279) | 21 | 0.6 | 0.7 | 0.35 |
| R | 304 | 728 | 957 | 1177 | 2468 | 979 (336) | 25 | 0.7 | 1.7 | 0.87 | |
| Phosphorus (mg) | F | 716 | 1049 | 1221 | 1383 | 2086 | 1223 (250) | 19 | 0.5 | 0.4 | 0.57 |
| R | 426 | 949 | 1116 | 1381 | 2333 | 1172 (314) | 23 | 0.7 | 0.9 | 0.12 | |
| Magnesium (mg) | F | 136 | 207 | 243 | 279 | 425 | 248 (53) | 4 | 0.5 | 0.1 | 0.51 |
| R | 98 | 183 | 213 | 265 | 532 | 226 (66) | 5 | 1.1 | 2.4 | 0.05 | |
| Potassium (mg) | F | 1360 | 2077 | 2389 | 2692 | 4191 | 2428 (503) | 38 | 0.6 | 0.7 | 0.41 |
| R | 633 | 1770 | 2262 | 2749 | 4217 | 2276 (685) | 51 | 0.3 | −0.1 | 0.61 | |
| Sodium (mg) | F | 1242 | 1790 | 2027 | 2323 | 3557 | 2094 (468) | 35 | 0.7 | 0.6 | 0.16 |
| R | 731 | 1719 | 2078 | 2690 | 5014 | 2264 (816) | 61 | 0.9 | 0.8 | 0.003 | |
| Iron (mg) | F | 6 | 9 | 12 | 17 | 39 | 14 (7) | 1 | 1.3 | 1.2 | <0.001 |
| R | 3 | 8 | 10 | 17 | 37 | 13 (8) | 1 | 1.1 | 0.1 | <0.001 | |
| Zinc (mg) | F | 5 | 9 | 11 | 15 | 34 | 13 (6) | 0.4 | 1.3 | 0.9 | <0.001 |
| R | 3 | 8 | 11 | 15 | 32 | 13 (7) | 0.5 | 1.2 | 0.4 | <0.001 |
| Mean Difference * (SD) | Skewness | p | Kurtosis | K-S p | Cohen’s d | Lower LOA | Upper LOA | ||
|---|---|---|---|---|---|---|---|---|---|
| Macronutrients with no statistically significant difference | Total protein (g) | −1.13 (12.37) | 0.02 | 0.22 | 0.00 | 0.93 | −25.87 | 23.60 | |
| Total lipids (g) | 1.67 (12.17) | 0.13 | 0.069 | 0.52 | 0.98 | −22.68 | 26.01 | ||
| PUFA (g) | 0.09 (3.84) | −0.30 | 0.38 | 1.54 | 0.18 | −7.59 | 7.77 | ||
| SFA (g) | 0.16 (5.39) | −0.64 | 0.70 | 0.83 | 0.64 | −10.62 | 10.94 | ||
| Cholesterol (mg) | 3.15 (98.09) | −0.88 | 0.67 | 1.73 | 0.10 | −193.04 | 199.34 | ||
| % Energy from plant protein | 0.21 (1.62) | −0.14 | 0.077 | −0.25 | 0.64 | −3.03 | 3.46 | ||
| % Energy from carbohydrates | 0.35 (4.89) | −0.05 | 0.35 | 0.69 | 0.74 | −9.43 | 10.12 | ||
| % Energy from total lipids | −0.02 (4.51) | −0.10 | 0.94 | −0.05 | 0.92 | −9.04 | 9.00 | ||
| % Energy from MUFA | 0.34 (3.61) | −0.19 | 0.21 | 0.55 | 0.31 | −6.88 | 7.56 | ||
| % Energy from PUFA | 0.20 (2.02) | 0.29 | 0.18 | 1.49 | 0.02 | −3.83 | 4.24 | ||
| % Energy from SFA | −0.13 (2.25) | −0.16 | 0.44 | −0.39 | 0.94 | −4.64 | 4.37 | ||
| Macronutrients significantly higher in FFQ | Energy (kcal) | 32.10 (180.01) † | 0.35 | 0.018 | 1.85 | 0.25 | 0.16 | −327.92 | 392.13 |
| Plant Protein (g) | 1.45 (7.31) † | −0.37 | 0.009 | −0.06 | 0.70 | 0.21 | −13.16 | 16.06 | |
| Carbohydrates (g) | 4.48 (28.45) † | −0.39 | 0.036 | 1.04 | 0.48 | 0.16 | −52.42 | 61.39 | |
| Fiber (g) | 1.52 (5.96) † | −0.64 | 0.001 | 2.05 | 0.50 | 0.27 | −10.40 | 13.44 | |
| MUFA (g) | 1.66 (7.81) † | 0.20 | 0.005 | 0.36 | 0.91 | 0.22 | −13.96 | 17.28 | |
| Macronutrients significantly lower in FFQ | Animal Protein (g) | −2.60 (15.59) † | 0.00 | 0.027 | 0.19 | 0.96 | −0.18 | −33.77 | 28.58 |
| %Energy from total protein | −0.49 (2.39) † | −0.02 | 0.006 | −0.18 | 0.96 | −0.22 | −5.28 | 4.30 | |
| %Energy from animal protein | −0.71 (3.27) † | 0.00 | 0.004 | 0.02 | 0.78 | −0.24 | −7.24 | 5.82 | |
| Micronutrients with no statistically significant difference | Thiamin (mg) | −0.01 (0.59) | 0.34 | 0.90 | 1.27 | 0.55 | −1.19 | 1.18 | |
| Niacin (mg) | −0.47 (7.77) | 0.83 | 0.42 | 3.44 | 0.19 | −16.01 | 15.08 | ||
| Vitamin B12 (μg) | 0.37 (2.75) | 0.36 | 0.070 | 2.66 | 0.38 | −5.13 | 5.88 | ||
| Vitamin A (RAE) | 7.42 (264.39) | −1.07 | 0.71 | 2.10 | 0.09 | −521.36 | 536.19 | ||
| Iron (mg) | 0.71 (6.13) | 0.61 | 0.14 | 2.68 | <0.001 | −11.55 | 12.97 | ||
| Zinc (mg) | 0.25 (5.64) | 0.45 | 0.56 | 3.00 | 0.11 | −11.03 | 11.52 | ||
| Micronutrients significantly higher in FFQ | Riboflavin (mg) | 0.24 (0.66) † | 0.35 | <0.001 | 1.88 | 0.60 | 0.36 | −1.08 | 1.56 |
| Pantothenic acid (mg) | 0.92 (3.50) § | 0.48 | <0.001 | 3.83 | 0.01 | 0.23 | −6.08 | 7.92 | |
| Vitamin B6 (mg) | 0.12 (0.72) § | 0.61 | 0.029 | 3.09 | 0.02 | 0.15 | −1.32 | 1.56 | |
| Folate (μg) | 43.23 (172.46) † | −0.09 | 0.001 | 2.92 | 0.05 | 0.25 | −301.69 | 388.15 | |
| Vitamin C (mg) | 23.65 (67.43) † | −0.20 | <0.001 | 1.72 | 0.77 | 0.34 | −111.21 | 158.51 | |
| Vitamin E (mg) | 1.57 (5.05) † | 0.30 | <0.001 | 1.19 | 0.21 | 0.28 | −8.52 | 11.67 | |
| Calcium (mg) | 64.77 (269.50) † | −0.34 | 0.002 | 1.06 | 0.16 | 0.24 | −474.24 | 603.77 | |
| Phosphorus (mg) | 50.39 (228.73) † | −0.29 | 0.004 | 0.13 | 0.84 | 0.23 | −407.08 | 507.86 | |
| Magnesium (mg) | 21.39 (47.48) † | 0.01 | <0.001 | −0.22 | 0.90 | 0.42 | −73.57 | 116.35 | |
| Potassium (mg) | 151.23 (519.84) † | −0.02 | <0.001 | −0.08 | 0.93 | 0.31 | −888.45 | 1190.91 | |
| Micronutrients significantly lower in FFQ | Sodium (mg) | −169.46 (654.62) † | −0.97 | 0.001 | 1.68 | 0.11 | −0.30 | −1478.70 | 1139.77 |
| Correlation Coefficient * | Weighted Kappa † | ICC † | Correctly % | Grossly % | |
|---|---|---|---|---|---|
| Energy (kcal) | 0.75 § | 0.71 | 0.89 | 92.7 | 1.1 |
| Total protein (g) | 0.66 ‡ | 0.63 | 0.76 | 89.9 | 0.0 |
| Plant protein (g) | 0.52 ‡ | 0.49 | 0.63 | 81.6 | 2.2 |
| Animal protein (g) | 0.50 ‡ | 0.44 | 0.60 | 78.2 | 2.8 |
| Carbohydrates (g) | 0.73 ‡ | 0.60 | 0.83 | 86.6 | 1.1 |
| Fiber (g) | 0.61 ‡ | 0.56 | 0.72 | 84.9 | 1.7 |
| Total lipids (g) | 0.72 ‡ | 0.41 | 0.83 | 88.3 | 2.2 |
| MUFA (g) | 0.55 ‡ | 0.31 | 0.69 | 78.8 | 6.1 |
| PUFA (g) | 0.54 § | 0.50 | 0.73 | 83.2 | 3.9 |
| SFA (g) | 0.77 ‡ | 0.58 | 0.86 | 90.5 | 0.6 |
| Cholesterol (mg) | 0.35 § | 0.32 | 0.53 | 73.2 | 3.9 |
| % Energy from total protein | 0.55 ‡ | 0.41 | 0.65 | 77.6 | 3.9 |
| % Energy from plant protein | 0.39 ‡ | 0.37 | 0.49 | 78.8 | 6.1 |
| % Energy from animal protein | 0.45 ‡ | 0.34 | 0.55 | 73.2 | 3.9 |
| % Energy from carbohydrates | 0.52 ‡ | 0.43 | 0.66 | 78.2 | 3.3 |
| % Energy from total lipids | 0.45 ‡ | 0.61 | 0.61 | 77.1 | 3.9 |
| % Energy from MUFA | 0.38 ‡ | 0.51 | 0.51 | 76.0 | 6.1 |
| % Energy from PUFA | 0.41 § | 0.37 | 0.63 | 78.2 | 6.1 |
| % Energy from SFA | 0.66 ‡ | 0.78 | 0.78 | 86.6 | 2.8 |
| Thiamin (mg) | 0.61 § | 0.59 | 0.74 | 86.6 | 2.2 |
| Riboflavin (mg) | 0.65 § | 0.58 | 0.78 | 87.1 | 2.2 |
| Niacin (mg) | 0.56 § | 0.55 | 0.72 | 88.3 | 3.9 |
| Pantothenic acid (mg) | 0.56 § | 0.49 | 0.78 | 83.2 | 3.3 |
| Vitamin B6 (mg) | 0.56 § | 0.52 | 0.71 | 82.7 | 3.3 |
| Folate (μg) | 0.59 § | 0.55 | 0.74 | 84.4 | 2.8 |
| Vitamin B12 (μg) | 0.51 § | 0.51 | 0.71 | 83.2 | 2.8 |
| Vitamin C (mg) | 0.62 § | 0.61 | 0.76 | 86.0 | 1.1 |
| Vitamin A (RAE) | 0.46 § | 0.40 | 0.52 | 78.8 | 3.3 |
| Vitamin E (mg) | 0.63 § | 0.58 | 0.81 | 86.6 | 1.7 |
| Calcium (mg) | 0.63 ‡ | 0.55 | 0.76 | 85.5 | 2.8 |
| Phosphorus (mg) | 0.69 ‡ | 0.66 | 0.80 | 89.9 | 1.1 |
| Magnesium (mg) | 0.63 § | 0.56 | 0.78 | 85.4 | 1.7 |
| Potassium (mg) | 0.66 ‡ | 0.54 | 0.76 | 86.0 | 2.2 |
| Sodium (mg) | 0.60 § | 0.57 | 0.67 | 86.0 | 2.2 |
| Iron (mg) | 0.61 § | 0.56 | 0.78 | 85.5 | 2.8 |
| Zinc (mg) | 0.52 § | 0.47 | 0.76 | 79.3 | 2.8 |
© 2016 by the authors; licensee MDPI, Basel, Switzerland. This article is an open access article distributed under the terms and conditions of the Creative Commons Attribution (CC-BY) license (http://creativecommons.org/licenses/by/4.0/).
Share and Cite
Athanasiadou, E.; Kyrkou, C.; Fotiou, M.; Tsakoumaki, F.; Dimitropoulou, A.; Polychroniadou, E.; Menexes, G.; Athanasiadis, A.P.; Biliaderis, C.G.; Michaelidou, A.-M. Development and Validation of a Mediterranean Oriented Culture-Specific Semi-Quantitative Food Frequency Questionnaire. Nutrients 2016, 8, 522. https://doi.org/10.3390/nu8090522
Athanasiadou E, Kyrkou C, Fotiou M, Tsakoumaki F, Dimitropoulou A, Polychroniadou E, Menexes G, Athanasiadis AP, Biliaderis CG, Michaelidou A-M. Development and Validation of a Mediterranean Oriented Culture-Specific Semi-Quantitative Food Frequency Questionnaire. Nutrients. 2016; 8(9):522. https://doi.org/10.3390/nu8090522
Chicago/Turabian StyleAthanasiadou, Elpiniki, Charikleia Kyrkou, Maria Fotiou, Foteini Tsakoumaki, Aristea Dimitropoulou, Eleni Polychroniadou, Georgios Menexes, Apostolos P. Athanasiadis, Costas G. Biliaderis, and Alexandra-Maria Michaelidou. 2016. "Development and Validation of a Mediterranean Oriented Culture-Specific Semi-Quantitative Food Frequency Questionnaire" Nutrients 8, no. 9: 522. https://doi.org/10.3390/nu8090522