Article

MADD-FOLH1 Polymorphisms and Their Haplotypes with Serum Lipid Levels and the Risk of Coronary Heart Disease and Ischemic Stroke in a Chinese Han Population

1
Department of Cardiology, Institute of Cardiovascular Diseases, the First Affiliated Hospital, Guangxi Medical University, 22 Shuangyong Road, Nanning 530021, Guangxi, China
2
Department of Neurology, the First Affiliated Hospital, Guangxi Medical University, 22 Shuangyong Road, Nanning 530021, Guangxi, China
*
Author to whom correspondence should be addressed.
Nutrients 2016, 8(4), 208; https://doi.org/10.3390/nu8040208
Submission received: 25 February 2016 / Revised: 22 March 2016 / Accepted: 30 March 2016 / Published: 8 April 2016

Abstract

:
This study aimed to detect the association of the MADD-FOLH1 single nucleotide polymorphisms (SNPs) and their haplotypes with the risk of coronary heart disease (CHD) and ischemic stroke (IS) in a Chinese Han population. Six SNPs of rs7395662, rs326214, rs326217, rs1051006, rs3736101, and rs7120118 were genotyped in 584 CHD and 555 IS patients, and 596 healthy controls. The genotypic and allelic frequencies of the rs7395662 SNP were different between controls and patients, and the genotypes of the rs7395662 SNP were associated with the risk of CHD and IS in different genetic models. Six main haplotypes among the rs1051006, rs326214, rs326217, rs3736101, and rs7120118 SNPs were detected in our study population, the haplotypes of G-G-T-G-C and G-A-T-G-T were associated with an increased risk of CHD and IS, respectively. The subjects with rs7395662GG genotype in controls had higher triglyceride (TG) and lower high-density lipoprotein cholesterol (HDL-C) levels than the subjects with AA/AG genotypes. Several SNPs interacted with alcohol consumption to influence serum TG (rs326214, rs326217, and rs7120118) and HDL-C (rs7395662) levels. The SNP of rs3736101 interacted with cigarette smoking to modify serum HDL-C levels. The SNP of rs1051006 interacted with body mass index ≥24 kg/m2 to modulate serum low-density lipoprotein cholesterol levels. The interactions of several haplotypes and alcohol consumption on the risk of CHD and IS were also observed.

1. Introduction

Coronary heart disease (CHD) and ischemic stroke (IS) remain the major causes of morbidity and mortality worldwide [1,2]. The pathological basis of both diseases is atherosclerosis, a progressive inflammatory disorder and, therefore, CHD and IS may share common pathogenesis, as well as many risk factors [2,3]. Previous genome-wide association studies (GWASs) have identified many genes and loci in the predisposition to CHD [4] or IS [5] in different populations. Furthermore, some genetic variants originally shown to influence the risk of CHD were also subsequently found to be associated with IS [6,7].
The MAP-kinase activating death domain (MADD) and folate hydrolase 1 (FOLH1) gene (MADD-FOLH1) is located on chromosome 11p. The MADD protein can modulate tumor necrosis factor-alpha and propagate the apoptotic signals [8]. Folate is an essential nutrient that supports nucleotide synthesis and biological methylation reactions. Diminished folate status results in chromosome breakage and is associated with several diseases, including cardiovascular disease [9,10]. Genetic variants involved in folate metabolism may modify the effects of lifestyle (smoking and drinking) on plasma homocysteine concentrations—a risk factor for cardiovascular disease [11]. A novel single nucleotide polymorphism (SNP) of rs7395662 in or near MADD-FOLH1 has been found association with serum lipid levels [12,13] and the risk of CHD [14] in a previous GWAS and two replication studies. Exactly as patterns of linkage disequilibrium (LD) vary between populations, genetic anomalies of ion channels or specific endothelial regulators may underlie coronary microvascular disease [15,16], the results are complicated and inconsistent across different populations [17,18]. In addition, there are still many variants have not been explored in the MADD-FOLH1 cluster. Therefore, the purpose of the present study was to detect the association of six SNPs (rs7395662, rs326214, rs326217, rs1051006, rs3736101, and rs7120118) in or near MADD-FOLH1 and their haplotypes with serum lipid traits and the risk of CHD and IS in a Chinese Han populations.

2. Materials and Methods

2.1. Study Patients

A total of 1139 unrelated patients with CHD (n = 584) and IS (n = 555) were recruited from hospitalized patients in the First Affiliated Hospital, Guangxi Medical University. The diagnosis of CHD was based on typical ischemic discomfort plus one or more of electrocardiographic change (ST-segment depression or elevation of ≥0.5 mm, T-wave inversion of ≥3 mm in ≥3 leads, or left bundle branch block), as well as increases in the cardiac markers, including creatinine kinase-MB and troponin T. Coronary angiography was performed in patients with CHD. The coronary angiograms were reviewed by two independent angiographers who were both blinded to the results of the genotypes. For a vessel to be scored, stenosis ≥50% had to be noted in an epicardial coronary vessel of interest or in one of its major branches. In the event of discordance of the number of vessels scored between the two reviewers, angiograms were scored by a third independent reviewer. The selected CHD patients were subject to significant coronary stenosis (≥50%) in at least either one of the three main coronary arteries or their major branches (branch diameter ≥2 mm). Additionally, angiographic severity of disease was classified according to the number of coronary vessels with significant stenosis (luminal narrowing ≥50%) as one-, two-, or three-vessel disease in the three major coronary arteries [19,20]. The diagnosis and classification of IS was ascertained in accordance with the TOAST (Trial of Org 10172 in Acute Stroke Treatment) criteria [21] after strict neurological examination, computed tomography, or magnetic resonance imaging (MRI). The selected IS patients in the study included individuals who were eligible for one of the two subtypes of TOAST criteria: large-artery atherosclerosis and small-vessel occlusion. Individuals with a history of hematologic or brain MRI revealing cerebral hemorrhage, cardioembolic stroke or unspecified stroke, neoplastic or intracranial space-occupying lesion, infection, and other types of intracranial lesions, renal, liver, thyroid, autoimmune diseases, and type 1 diabetes were excluded. The selected IS patients who had a past history of CHD were also excluded, while the selected CHD patients who had a past history of IS were excluded from the study.

2.2. Control Subjects

A total of 596 control subjects matched by age, gender, and ethnic group were randomly selected from the healthy adults who underwent periodical medical check-up at the Physical Examination Center of the First Affiliated Hospital, Guangxi Medical University during the same period when CHD and IS patients were recruited. The controls were free of CHD and IS by questionnaires, history-taking, and clinical examination. The examination comprised physical examination, blood sampling, electrocardiography, chest X-ray, and Doppler echocardiography. All enrolled individuals were Han Chinese from Guangxi, the People’s Republic of China. Information on demography, socioeconomic status, medical history, and lifestyle factors was collected by trained research staff with standardized questionnaires for all participants. This study was approved by the Ethics Committee of the First Affiliated Hospital, Guangxi Medical University, and written informed consent was obtained from each participant before data collection. The reported investigations were in accordance with the principles of the Declaration of Helsinki.

2.3. Biochemical Measurements

Venous blood samples were obtained from all subjects after at least 12 h of fasting. The levels of serum total cholesterol (TC), triglyceride (TG), high-density lipoprotein cholesterol (HDL-C), and low-density lipoprotein cholesterol (LDL-C) in samples were determined by enzymatic methods with commercially available kits, Tcho-1, TG-LH (RANDOX Laboratories Ltd., Ardmore, Diamond Road, Crumlin Co., Antrim, UK, BT29 4QY), Cholestest N HDL, and Cholestest LDL (Daiichi Pure Chemicals Co., Ltd., Tokyo, Japan), respectively. Serum apolipoprotein (Apo) A1 and ApoB levels were detected by the immunoturbidimetric immunoassay (RANDOX Laboratories Ltd.). All determinations were performed with an autoanalyzer (Type 7170A; Hitachi Ltd., Tokyo, Japan) in the Clinical Science Experiment Center of the First Affiliated Hospital, Guangxi Medical University [22,23,24,25,26,27,28,29,30,31,32,33].

2.4. Diagnostic Criteria

The normal values of serum TC, TG, HDL-C, LDL-C, ApoA1, and ApoB levels, and the ratio of ApoA1 to ApoB in our Clinical Science Experiment Center were 3.10–5.17, 0.56–1.70, 0.91–1.81, 2.70–3.20 mmol/L, 1.00–1.78, 0.63–1.14 g/L, and 1.00–2.50, respectively [22,23,24,25,26,27,28,29,30,31,32,33]. Type 2 diabetes was diagnosed according to the WHO diagnostic criteria for diabetes: (1) fasting glucose (FPG) ≥7.0 mmol/L; (2) 2 h postprandial glucose ≥11.1 mmol/L; or (3) self-reported diagnosis of diabetes or use of anti-diabetic medications [34,35]. The individuals with TC >5.17 mmol/L, and/or TG >1.70 mmol/L were defined as hyperlipidemic [36,37,38]. Hypertension was defined according to the criteria outlined by the 1999 World Health Organization—International Society of Hypertension Guidelines for the management of hypertension [39,40,41]. Uncontrolled hypertension was defined as a systolic blood pressure of 140 mmHg or higher and a diastolic blood pressure of 90 mmHg or higher. The subjects with systolic blood pressure of only 140 mmHg or higher but a diastolic blood pressure of <90 mmHg were diagnosed as isolated systolic hypertension. Normal weight, overweight, and obesity were defined as a body mass index (BMI) <24, 24–28, and >28kg/m2, respectively [42,43].

2.5. SNP Selection

The SNPs were selected on the basis of the following assumptions: (1) Selected SNPs were established by Haploview (Broad Instituteof MIT and Harvard, Cambridge, MA, USA, version 4.2); (2) SNPs information was obtained from NCBI dbSNP Build 132 (http://www.Ncbi.nlm.nih.gov/SNP/); (3) SNPs were restricted to minor allele frequency (MAF) >1%; and (4) SNPs might be associated with the plasma lipid levels or cardiovascular disease in recent studies [12,13,14,15,16,17,18].

2.6. Genotyping

Genomic DNA was extracted from leucocytes of venous blood using the phenol-chloroform method, and then sent to the Center for Human Genetics Research, Shanghai Genesky Bio-Tech Co. Ltd. Genotyping of the SNPs were performed by the Snapshot technology platform [22,23,24,25,26,27,28,29,30,31,32,33]. The restriction enzymes for the SNPs were SAP (Promega) and Exonuclease I (Epicentre), respectively. The sense and antisense primers were: rs7120118F: 5′-TGCTCCCCTCTTCCAAACCACT-3′, rs7120118R: 5′-TCCTTCTCCCCAAGACCTCACTC-3′; rs326214F: 5′-TGGCTCATGACAGGTGGTGCTA-3′, rs326214R: 5′-TAGCAGCGGGATGACAGGAAAC-3′; rs326217F: 5′-CCCAGGGACGTTCCTTGTGTAA-3′, rs326217R: 5′-CCTGGTTGCAACATCCACAGAAT-3′; rs7395662F: 5′-CTGTGGCTCCCACATCACTGG-3′, rs7395662R: 5′-AAATGATTTTCCCTGCATGCTAGTT-3′; rs3736101 and rs1051006F: 5′-CGGCCTTTAGGAACCTGCTGAC-3′, rs3736101 and rs1051006R: 5′-TTGGCTGAATCGGGGAGTGTAA-3′.

2.7. Statistical Analyses

The statistical analyses were carried out using the statistical software package SPSS 21.0 (SPSS Inc., Chicago, IL, USA). Quantitative variables were expressed as mean ± standard deviation (serum TG levels were presented as medians and interquartile ranges). Qualitative variables were expressed as percentages. Allele frequency was determined via direct counting, and the standard goodness-of-fit test was used to test the Hardy–Weinberg equilibrium. A chi-square analysis was used to evaluate the difference in genotype distribution and sex ratio between the groups. The general characteristics between patient and control groups were tested by the Student’s unpaired t-test. The association of genotypes and serum lipid parameters was tested by analysis of covariance (ANCOVA). Any variants associated with the serum lipid parameter at a value of p < 0.008 (corresponding to p < 0.05 after adjusting for six independent tests by the Bonferroni correction) were considered statistically significant. Unconditional logistic regression was used to assess the correlation between the risk of CHD and IS and genotypes. Age, gender, BMI, smoking, and alcohol consumption were adjusted for the statistical analysis. Odds ratio (OR) and 95% confidence interval (95% CI) were calculated using unconditional logistic regression. The interactions of six SNPs with alcohol consumption, cigarette smoking, BMI ≥ 24 kg/m2, age, and sex on serum lipid levels and the risk of CHD and IS were detected by using a factorial regression analysis after controlling for potential confounders, a PI ≤ 0.0017 was considered statistically significant after Bonferroni correction. The pattern of pair-wise LD between the selected SNPs was measured by D' and r2 using the SHEsis software [44]. Haplotype frequency was determined by means of the algorithms implemented in the PHASE program.

3. Results

3.1. General Characteristics of the Subjects

The general characteristics of the patients and healthy controls are summarized in Table 1. The values of BMI, pulse pressure, and TG were higher but diastolic blood pressure, TC, HDL-C, ApoA1, the percentages of subjects who consumed alcohol, and the ratio of ApoA1 to ApoB were lower in CHD patients than in controls (p < 0.001 for all). The values of BMI, systolic blood pressure, pulse pressure, and TG were higher but TC, HDL-C, ApoA1, the percentages of subjects who consumed alcohol, and the ratio of ApoA1 to ApoB were lower in IS patients than in controls (p < 0.001 for all).

3.2. Genotypic and Allelic Frequencies in Controls and Patients

The genotypic and allelic frequencies of the 6 MADD-FOLH1 SNPs are presented in Table 2. The genotype distribution of the 5 SNPs (not including rs1051006 in IS patients, p = 0.026) was concordant with the Hardy–Weinberg equilibrium in patients and controls (p > 0.05 for all). The genotypic and allelic frequencies of the rs7395662, but not the other five SNPs, were different between controls and patients (CHD and IS, p < 0.01 for all), the rs7395662G allele and rs7395662GG genotype frequencies were lower in CHD (G, 36.6%; GG, 12.7%) or IS (G, 36.3%; GG, 14.4%) patients than in control subjects (G, 42.6%; GG, 18.8%; p < 0.01 for all).

3.3. Genotypes of the Six MADD-FOLH1 SNPs and the Risk of CHD and IS

As shown in Table 3, the genotypes of the rs7395662, but not the other five SNPs, were associated with the risk of CHD after the Bonferroni correction (a value of p < 0.008 was considered statistically significant) in different genetic models: co-dominant model: GG vs. AA (OR = 0.78, 95% CI = 0.66–0.92, p = 0.0068); recessive model: GG vs. AA/GA (OR = 0.63, 95% CI = 0.46–0.86, p = 0.0038); and log-additive model: G vs. A (OR = 0.78, 95% CI = 0.66–0.92, p = 0.003).
The genotypes of the rs7395662 SNP were also associated with the risk of IS in different genetic models: dominant model: GA/GG vs. AA (OR = 0.70, 95% CI = 0.55–0.89, p = 0.0039); and log-additive model: G vs. A (OR = 0.78, 95% CI = 0.66–0.91, p = 0.0024).

3.4. Haplotypes and the Risk of CHD and IS

There was strong LD among the rs1051006, rs326214, rs326217, rs3736101, and rs7120118 SNPs in controls and patients (D' = 0.8946–0.9983) but weak LD between the rs7395662 and the other five SNPs (D' = 0.1127–0.3275). Thus, haplotype analyses among the five SNPs and the associations of their haplotypes and the risk of CHD and IS were performed. Six main haplotypes are shown in Table 4. The haplotype of G-G-T-G-C (in the order of rs1051006, rs326214, rs326217, rs3736101 and rs7120118 SNPs) was associated with an increased risk for CHD (adjusted OR = 1.59, 95% CI = 1.06–2.38, p = 0.026). The haplotype of G-A-T-G-T was associated with an increased risk for IS (adjusted OR = 1.95, 95% CI = 1.04–3.68, p = 0.039).

3.5. Genotypes and Serum Lipid Levels

The association of the MADD-FOLH1 SNPs and serum lipid levels in controls is presented in Table 5. Serum TG and HDL-C levels were different among the three genotypes of the rs7395662 but not the other five SNPs (p = 0.005 and 0.001; respectively), the subjects with rs7395662GG genotype had higher TG and lower HDL-C levels than the subjects with rs7395662AA and rs7395662AG genotypes. There was no difference in serum TC, LDL-C, ApoA1, ApoB levels, and the ApoA1/ApoB ratio among the three genotypes of the SNP.

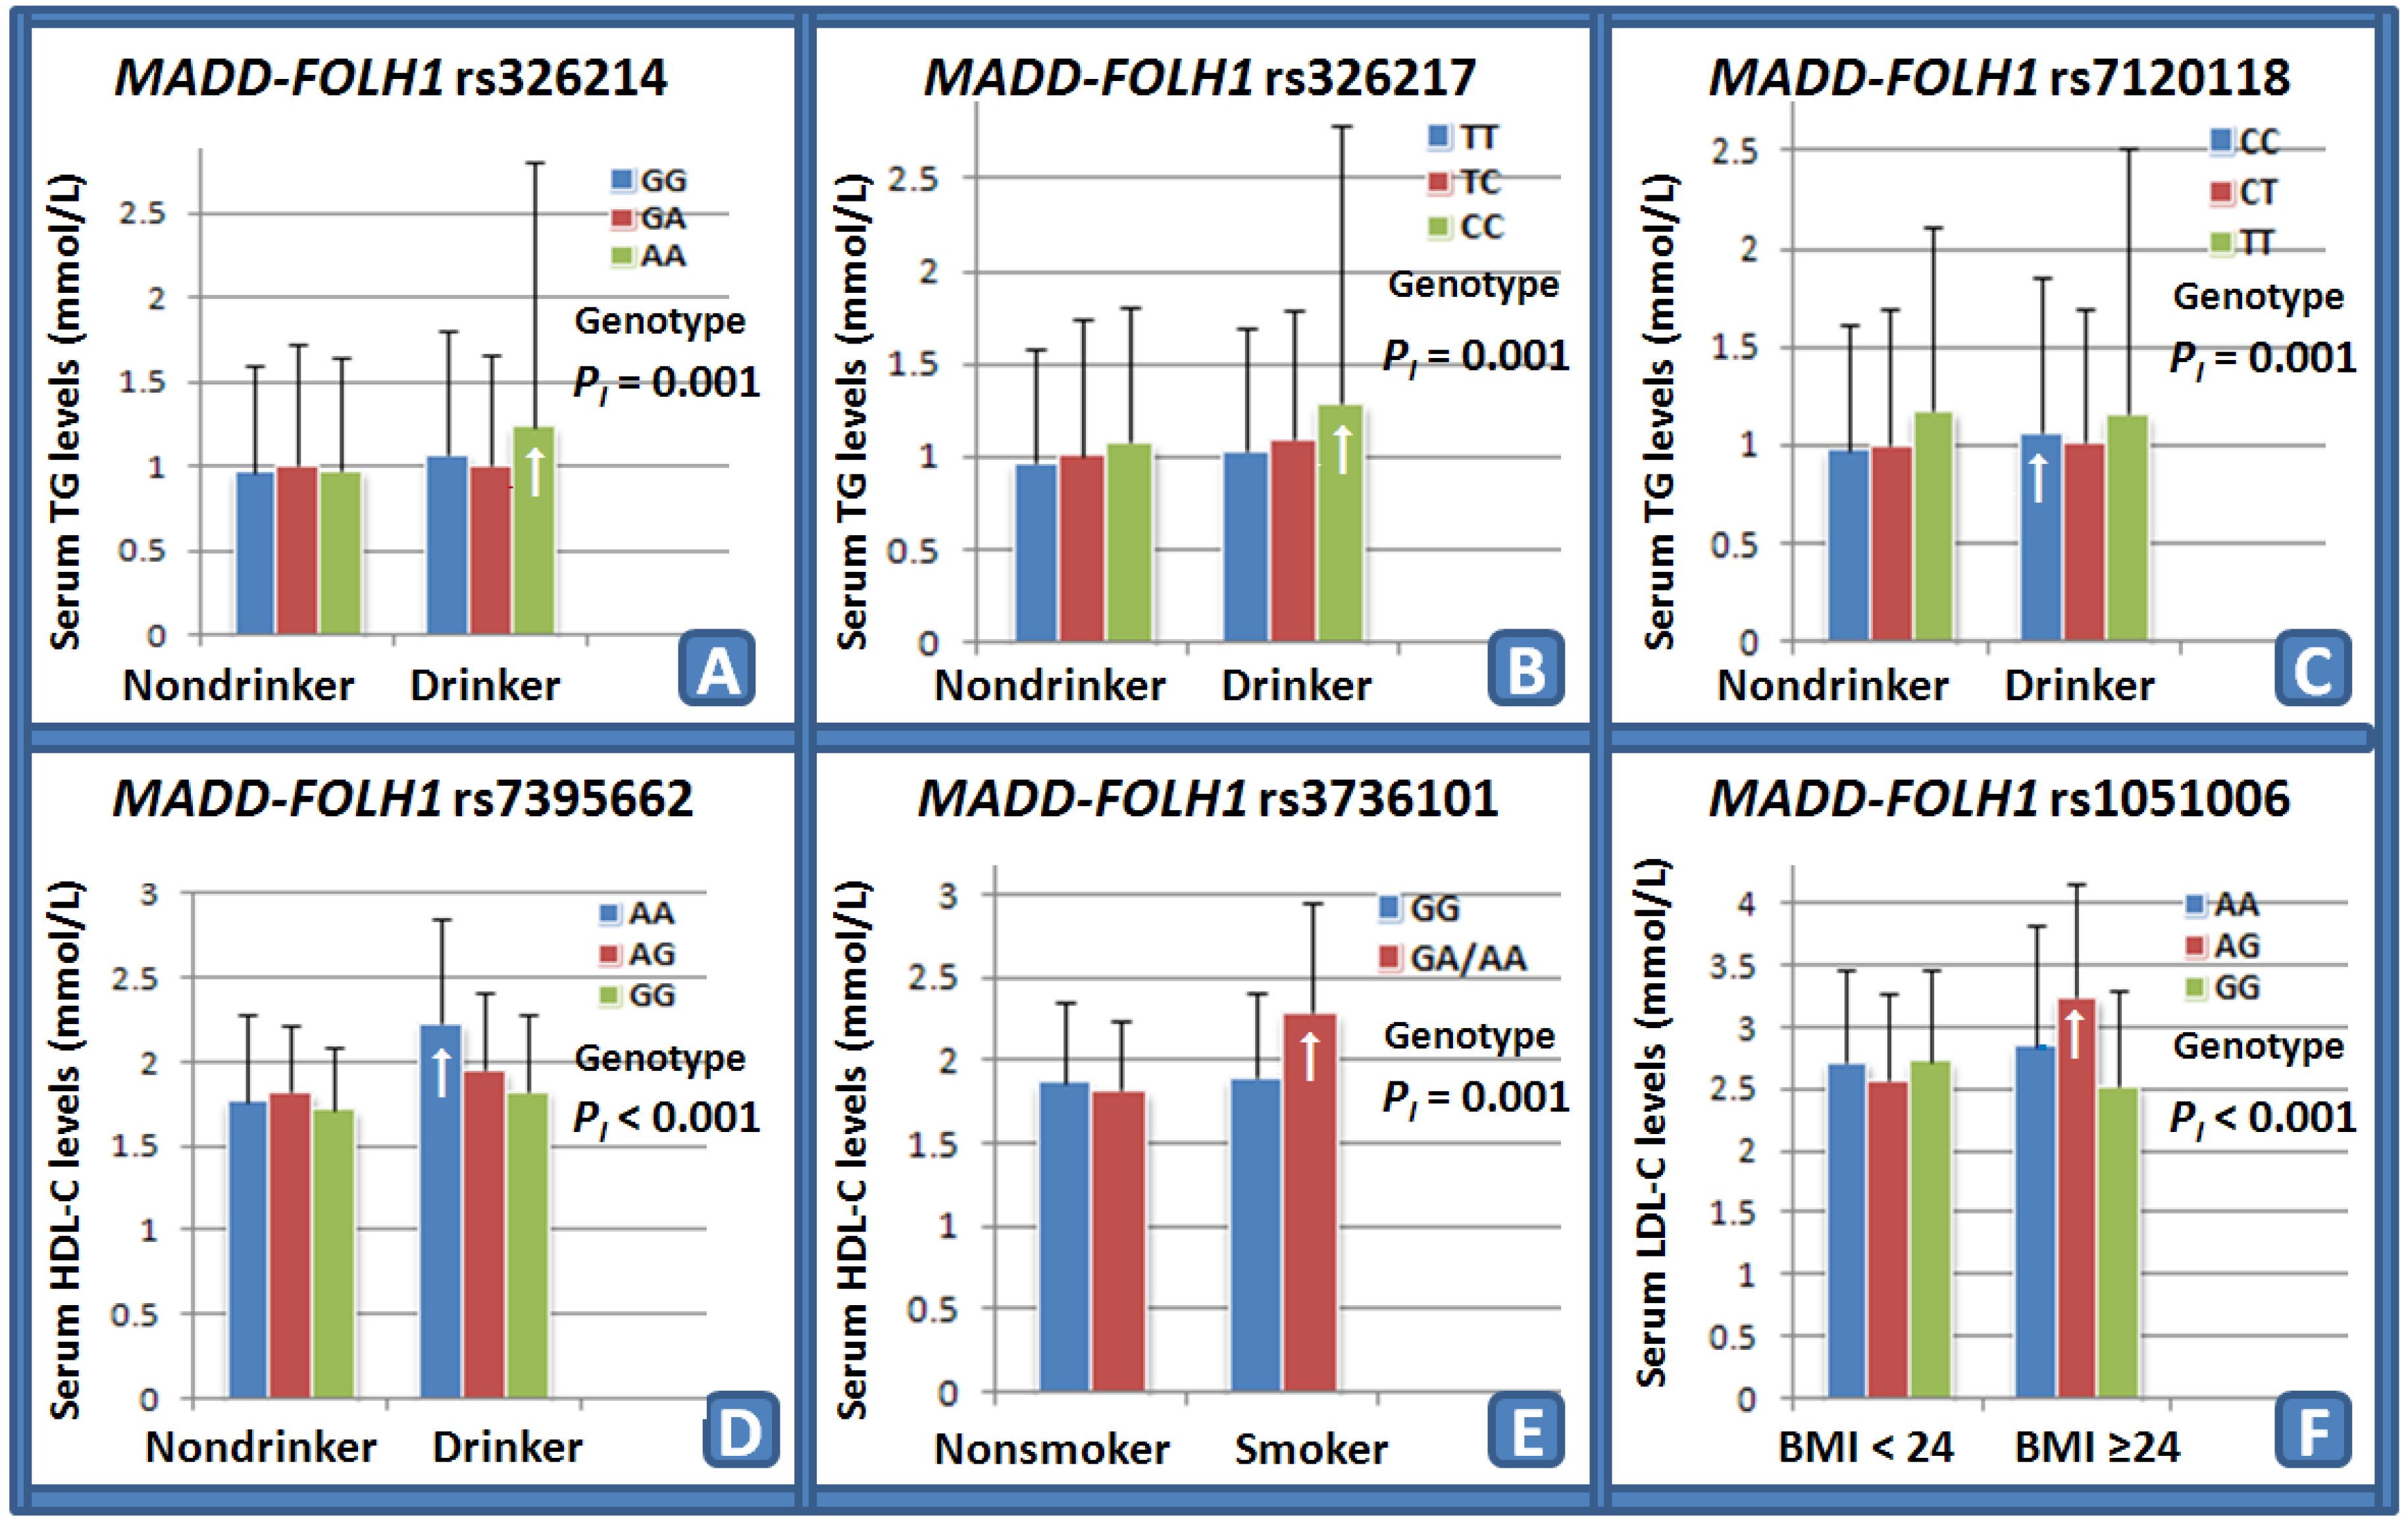
3.6. Interactions of the MADD-FOLH1 SNPs and Drinking, Smoking, BMI, Age, and Sex on Serum Lipid Levels and the Risk of CHD and IS

The interactions of the MADD-FOLH1 SNPs and drinking, smoking, BMI, age, and sex on serum lipid levels and the risk of CHD and IS are shown in Table 6. Several SNPs interacted with alcohol consumption to influence serum TG (rs326214, Figure 1A; rs326217, Figure 1B; and rs7120118, Figure 1C) and HDL-C (rs7395662, Figure 1D) levels. The SNP of rs3736101 interacted with cigarette smoking to modify serum HDL-C (Figure 1E) levels. The SNP of rs1051006 interacted with BMI ≥ 24 kg/m2 to modulate serum LDL-C (Figure 1F) levels.

3.7. Interactions of the Genotypes and Drinking, Smoking, and BMI on the Risk of CHD and IS

The rs3736101GA/AA genotypes interacted with alcohol consumption to decrease the risk of CHD (OR = 0.33, 95% CI = 0.12–0.89, p = 0.0021). No interactions of the genotypes and smoking and BMI on the risk of CHD and IS was detected in our study population.

3.8. Interactions of the Haplotypes and Drinking on the Risk of CHD

The interactions of several haplotypes and alcohol consumption on the risk of CHD were noted in this study. As compared with the A-G-T-G-C haplotype in non-drinkers, the haplotypes of G-G-T-A-C (OR = 1.69, 95% CI = 1.02–2.81) and G-A-T-G-T (OR = 3.61, 95% CI = 1.29–10.15) in non-drinkers were associated with an increased risk for CHD, whereas the haplotypes of A-G-T-G-C (OR = 0.34, 95% CI = 0.22–0.51), G-A-C-G-T (OR = 0.39, 95% CI = 0.25–0.59), G-G-T-A-C (OR = 0.11, 95% CI = 0.04–0.30) and G-A-C-G-C (OR = 0.17, 95% CI = 0.07–0.40) in drinkers were associated with a decreased risk for CHD.
For the drinkers, as compared with the A-G-T-G-C haplotype, the haplotype of G-G-T-G-C (OR = 2.38, 95% CI = 1.25–4.56) was associated with an increased risk for CHD, whereas the haplotype of G-G-T-A-C (OR = 0.32, 95% CI = 0.12–0.87) was associated with a decreased risk for CHD.
As compared with the same haplotype in non-drinkers, the haplotypes of A-G-T-G-C (OR = 0.34, 95% CI = 0.22-0.51), G-A-C-G-T (OR = 0.36, 95% CI = 0.24–0.54), G-G-T-A-C (OR = 0.06, 95% CI = 0.02–0.19), G-A-C-G-C (OR = 0.18, 95% CI = 0.06–0.53), and G-A-T-G-T (OR = 0.07, 95% CI = 0.01–0.34) in drinkers were associated with a decreased risk for CHD.

3.9. Interactions of the Haplotypes and Drinking on the Risk of IS

The interactions of several haplotypes and alcohol consumption on the risk of IS were also noted in this study. As compared with the A-G-T-G-C haplotype in non-drinkers, the haplotype of G-A-T-G-T (OR = 4.05, 95% CI = 1.46–11.27) in non-drinkers was associated with an increased risk for IS, whereas the haplotypes of A-G-T-G-C (OR = 0.33, 95% CI = 0.22–0.50), G-A-C-G-T (OR = 0.39, 95% CI = 0.26–0.58), G-G-T-A-C (OR = 0.41, 95% CI = 0.22–0.79), G-A-C-G-C (OR = 0.25, 95% CI = 0.12–0.52), and G-A-T-G-T (OR = 0.28, 95% CI = 0.10–0.79) in drinkers were associated with a decreased risk for IS.
For the drinkers, as compared with the A-G-T-G-C haplotype, no significant association was detected between the haplotypes and IS.
As compared with the same haplotype in non-drinkers, the haplotypes of A-G-T-G-C (OR = 0.33, 95% CI = 0.22–0.50), G-A-C-G-T (OR = 0.48, 95% CI = 0.32–0.72), G-G-T-A-C (OR = 0.30, 95% CI = 0.13–0.67), G-A-C-G-C (OR = 0.37, 95% CI = 0.14–0.98), and G-A-T-G-T (OR = 0.07, 95% CI = 0.02–0.29) in drinkers were associated with a decreased risk for IS.

4. Discussion

In the present study, we showed that the genotypic and allelic frequencies of the rs7395662 SNP were different between controls and CHD or IS patients, and that the rs7395662 genotypes or alleles were associated with the risk of CHD and IS in different genetic models. The SNPs of rs1051006, rs326214, rs326217, rs3736101, and rs7120118 were strong LD in controls and patients. Six main haplotypes of the five SNPs were detected. The haplotype of G-G-T-G-C was associated with an increased risk for CHD, whereas the haplotype of G-A-T-G-T was associated with an increased risk for IS. The subjects with rs7395662GG genotype in controls had higher TG and lower HDL-C levels than the subjects with rs7395662AA and rs7395662AG genotypes. Several SNPs interacted with alcohol consumption to influence serum TG (rs326214, rs326217, and rs7120118) and HDL-C (rs7395662) levels. Two SNPs interacted with cigarette smoking to modify serum TG (rs7395662) and HDL-C (rs3736101) levels. The SNP of rs1051006 interacted with BMI ≥ 24 kg/m2 to modulate serum LDL-C levels. The rs3736101GA/AA genotypes interacted with alcohol consumption to decrease the risk of CHD. The interactions of several haplotypes and alcohol consumption on the risk of CHD and IS were also observed. To the best of our knowledge, this is the first report to evaluate the interaction between the six MADD-FOLH1 SNPs and their haplotypes and several environmental factors on serum lipid levels and the risk of CHD and IS.
We showed that the genotypic and allelic frequencies of the rs7395662, but not the other five SNPs were different between controls and CHD or IS patients, the patients with CHD (36.6%, p = 0.003) or IS (36.3%, p = 0.002) had lower frequencies of rs7395662G allele than the controls (42.6%). The genotypes of the rs7395662 SNP were also associated with the risk of CHD and IS after the Bonferroni correction in different genetic models. In a previous GWAS, the rs7395662G allele frequency was 61% in a total of 17,797–22,562 persons, aged 18-104 years and from geographic regions spanning from the Nordic countries to Southern Europe [12]. In two recent studies, we and other researchers showed that the allelic frequency of rs7395662G was 44.9% in the healthy Mulao population [13], 43.7% in Han Chinese [13], 47.3% in CHD cases [14], and 51.9% in non-CHD controls [14]. The data in the International HapMap Project’s database have suggested that the frequency of rs7395662G allele was 62.7% in European, 58.9% in Han Chinese in Beijing, 48.9% in Japanese, and 44.2% in Sub-Saharan African [13]. As compared with the other populations, we found that the frequency of rs7395662G allele in our study populations was lower than that in Han Chinese from Beijing, which may be caused by different sample sizes and Han Chinese from Beijing and Guangxi are different parts of Han. These results suggest that the prevalence of the rs7395662G allele variation may have racial/ethnic- and sex-specificity. The prevalence of the rs7395662G allele is higher in European than in Chinese. These findings may also partly explain why the prevalence of cardiovascular disease is different between European and Chinese.
The association of the rs1051006, rs326214, rs326217, rs3736101, and rs7120118 SNPs and the risk of CHD and IS has not been reported previously. In the present study, we showed that there were no associations of the five SNPs and the risk of CHD and IS. However, there was high LD among the rs1051006, rs326214, rs326217, rs3736101, and rs7120118 SNPs in controls and patients. Haplotype analyses of the five SNPs showed that the haplotype of G-G-T-G-C was associated with an increased risk for CHD, whereas the haplotype of G-A-T-G-T was associated with an increased risk for IS. However, these findings still need to be confirmed in the other populations with larger sample sizes.
The results of the present study showed that serum TG and HDL-C levels were different among the three genotypes of the rs7395662, but not the other five SNPs, the subjects with rs7395662GG genotype had higher TG and lower HDL-C levels than the subjects with rs7395662AA and rs7395662AG genotypes. There was no difference in serum TC, LDL-C, ApoA1, ApoB levels, and the ApoA1/ApoB ratio among the three genotypes of the SNP. The association between the rs7395662 SNP and serum or plasma lipid levels has been investigated in several previous studies [12,13,14]. In a previous GWAS, Aulchenko et al. [12] showed significant association between the rs7395662 SNP and HDL-C levels in 16 population-based cohorts (p = 6 × 10⁻¹¹). The coded allele (the allele for which effect was estimated) was the rs7395662G allele. In a previous comparative study of two ethnic groups, we found that there may be a sex-specific association of the rs7395662 SNP and serum lipid concentrations in the Mulao and Han populations [13]. A recent study also showed that the rs7395662A allele was significantly associated with decreased HDL-C levels (β = −0.024, p = 0.007) in 1069 healthy control subjects [14]. However, the association of the rs1051006, rs326214, rs326217, rs3736101, and rs7120118 SNPs and serum or plasma lipid phenotypes is not well-known. In a previous study, Akiyama et al. [8] investigated functional genes at homologous loci identified using human lipid GWASs that responded to a high-fat, high-cholesterol diet intervention in an animal model. They showed that the gene of MADD rs7120118 SNP was potential target of lipid association (HDL-C). MADD encodes the MADD protein, which interacts with tumor necrosis factor-alpha receptor 1 to activate mitogen-activated protein kinase and propagate apoptotic signals [8]. In addition, G protein-coupled receptor kinase 5, which is also reported to interact with MADD [45], has been demonstrated to exhibit a significant increase in its gene expression induced by high-fat, high-cholesterol diet intervention, supporting the potential involvement of both G protein-coupled receptor kinase 5 and MADD in lipid metabolism [8].
The interactions of the MADD-FOLH1 SNPs and their haplotypes and some environmental factors on serum lipid levels and the risk of CHD and IS are not known. In the present study, we firstly showed that several MADD-FOLH1 SNPs interacted with alcohol consumption to influence serum TG (rs326214, rs326217, and rs7120118) and HDL-C (rs7395662) levels. The SNP of rs3736101 interacted with cigarette smoking to modify serum HDL-C levels. The SNP of rs1051006 interacted with BMI ≥ 24 kg/m2 to modulate serum LDL-C levels. The haplotypes of G-G-T-A-C and G-A-T-G-T in non-drinkers were associated with an increased risk for CHD, whereas the haplotypes of A-G-T-G-C, G-A-C-G-T, G-G-T-A-C, and G-A-C-G-C in drinkers were associated with a decreased risk for CHD. The haplotype of G-A-T-G-T in non-drinkers was associated with an increased risk for IS, whereas the haplotypes of A-G-T-G-C, G-A-C-G-T, G-G-T-A-C, G-A-C-G-C, and G-A-T-G-T in drinkers were associated with a decreased risk for IS. It is well known that heavy alcohol intake and cigarette smoking have a disadvantageous effect on lipid profiles. In the current study, however, we showed that the rs3736101 AG/GG genotypes interacted with cigarette smoking to increase serum HDL-C levels. The reason for this contradictory finding is not clear. In our study populations, most smokers also have drinking habits. Thus, these interactions still need to be determined.
There were several potential limitations in this study. Firstly, the sample size was relatively small compared to many GWASs and replication studies. Therefore, further studies with larger sample sizes are needed to confirm our results. Secondly, there were significant differences in the general characteristics between the control and patient groups. Although age, gender, BMI, cigarette smoking, and alcohol consumption have been adjusted for the statistical analysis, we could not completely eliminate the potential effects of these factors on serum lipid levels and the risk of CHD and IS. Thirdly, the association of the six SNPs and serum lipid levels in the CHD and IS groups was not analyzed because of the interference of lipid-lowering drugs. Finally, it is well known that both CHD and IS are the complex multifactorial disorders that are believed to result from an interaction between the genetic background of an individual and various environmental factors. Although we have detected the association between six MADD-FOLH1 SNPs and their haplotypes and the risk of CHD and IS, there are still many unmeasured environmental and genetic factors and their interactions.

5. Conclusions

The results of the present study showed that the genotypic and allelic frequencies of the rs7395662 SNP were different between controls and patients; the rs7395662 genotypes were associated with the risk of CHD and IS in different genetic models. Six main haplotypes among the rs1051006, rs326214, rs326217, rs3736101, and rs7120118 SNPs were detected. The haplotype of G-G-T-G-C was associated with an increased risk for CHD, whereas the haplotype of G-A-T-G-T was associated with an increased risk for IS. The subjects with rs7395662GG genotype in controls had higher TG and lower HDL-C levels than the subjects with rs7395662AA and rs7395662AG genotypes. Several SNPs and their haplotypes interacted with alcohol consumption, cigarette smoking, and BMI ≥ 24 kg/m2 to modify serum TG, HDL-C, and LDL-C levels, and the risk of CHD and IS.

Acknowledgments

This study was supported by the Science Foundation of Guangxi Returned Oversea Scholars (No. 0991004) and the National Natural Science Foundation of China (No. 30960130).

Author Contributions

D.-F.W. participated in the design, performed the statistical analyses, and drafted the manuscript. R.-X.Y. conceived the study, participated in the design, and helped to draft and edit the manuscript. X.-L.C., F.H., J.-Z.W. and W.-X.C. collected the data and the samples. All authors read and approved the final manuscript.

Conflicts of Interest

The authors declare no conflict of interest.

Abbreviations

The following abbreviations are used in this manuscript:
ANCOVAAnalysis of covariance
ApoApolipoprotein
CHDCoronary heart disease
CIConfidence interval
FOLH1Folate hydrolase 1
FPGFasting glucose
GWASsGenome-wide association studies
HDL-CHigh-density lipoprotein cholesterol
ISIschemic stroke
LDLinkage disequilibrium
LDL-CLow-density lipoprotein cholesterol
MADDMAP-kinase activating death domain
MAFMinor allele frequency
MRIMagnetic resonance imaging
OROdds ratio
SNPSingle nucleotide polymorphism
TCTotal cholesterol
TGTriglyceride

References

  1. Mozaffarian, D.; Benjamin, E.J.; Go, A.S.; Arnett, D.K.; Blaha, M.J.; Cushman, M.; de Ferranti, S.; Després, J.P.; Fullerton, H.J.; Howard, V.J.; et al. Heart disease and stroke statistics—2015 update: A report from the American Heart Association. Circulation 2015, 131, e29–e322. [Google Scholar] [CrossRef] [PubMed]
  2. Yamada, Y.; Matsui, K.; Takeuchi, I.; Fujimaki, T. Association of genetic variants with coronary artery disease and ischemic stroke in a longitudinal population-based genetic epidemiological study. Biomed. Rep. 2015, 3, 413–419. [Google Scholar] [CrossRef] [PubMed]
  3. Banerjee, A.; Lim, C.C.; Silver, L.E.; Welch, S.J.; Banning, A.P.; Rothwell, P.M. Familial history of stroke is associated with acute coronary syndromes in women. Circ. Cardiovasc. Genet. 2011, 4, 9–15. [Google Scholar] [CrossRef] [PubMed]
  4. Sabater-Lleal, M.; Huang, J.; Chasman, D.; Naitza, S.; Dehghan, A.; Johnson, A.D.; Teumer, A.; Reiner, A.P.; Folkersen, L.; Basu, S.; et al. Multiethnic meta-analysis of genome-wide association studies in >100,000 subjects identifies 23 fibrinogen-associated Loci but no strong evidence of a causal association between circulating fibrinogen and cardiovascular disease. Circulation 2013, 128, 1310–1324. [Google Scholar] [CrossRef] [PubMed]
  5. Bevan, S.; Traylor, M.; Adib-Samii, P.; Malik, R.; Paul, N.L.; Jackson, C.; Farrall, M.; Rothwell, P.M.; Sudlow, C.; Dichgans, M.; et al. Genetic heritability of ischemic stroke and the contribution of previously reported candidate gene and genomewide associations. Stroke 2012, 43, 3161–3167. [Google Scholar] [CrossRef] [PubMed]
  6. Williams, F.M.; Carter, A.M.; Hysi, P.G.; Surdulescu, G.; Hodgkiss, D.; Soranzo, N.; Traylor, M.; Bevan, S.; Dichgans, M.; Rothwell, P.M.; et al. Ischemic stroke is associated with the ABO locus: The EuroCLOT study. Ann. Neurol. 2013, 73, 16–31. [Google Scholar] [CrossRef] [PubMed] [Green Version]
  7. Dichgans, M.; Malik, R.; König, I.R.; Rosand, J.; Clarke, R.; Gretarsdottir, S.; Thorleifsson, G.; Mitchell, B.D.; Assimes, T.L.; Levi, C.; et al. Shared genetic susceptibility to ischemic stroke and coronary artery disease: A genome-wide analysis of common variants. Stroke 2014, 45, 24–36. [Google Scholar] [CrossRef] [PubMed] [Green Version]
  8. Akiyama, K.; Liang, Y.Q.; Isono, M.; Kato, N. Investigation of functional genes at homologous loci identified based on genome-wide association studies of blood lipids via high-fat diet intervention in rats using an in vivo in vivo approach. J. Atheroscler. Thromb. 2015, 22, 455–480. [Google Scholar] [CrossRef] [PubMed]
  9. DeVos, L.; Chanson, A.; Liu, Z.; Ciappio, E.D.; Parnell, L.D.; Mason, J.B.; Tucker, K.L.; Crott, J.W. Associations between single nucleotide polymorphisms in folate uptake and metabolizing genes with blood folate, homocysteine, and DNA uracil concentrations. Am. J. Clin. Nutr. 2008, 88, 1149–1158. [Google Scholar] [PubMed]
  10. Wang, B.; Liu, M.; Yan, W.; Mao, J.; Jiang, D.; Li, H.; Chen, Y. Association of SNPs in genes involved in folate metabolism with the risk of congenital heart disease. J. Matern. Fetal Neonatal Med. 2013, 26, 1768–1777. [Google Scholar] [CrossRef] [PubMed]
  11. Huang, T.; Tucker, K.L.; Lee, Y.C.; Crott, J.W.; Parnell, L.D.; Shen, J.; Smith, C.E.; Ordovas, J.M.; Li, D.; Lai, C.Q. Interactions between genetic variants of folate metabolism genes and lifestyle affect plasma homocysteine concentrations in the Boston Puerto Rican population. Public Health Nutr. 2011, 14, 1805–1812. [Google Scholar] [CrossRef] [PubMed]
  12. Aulchenko, Y.S.; Ripatti, S.; Lindqvist, I.; Boomsma, D.; Heid, I.M.; Pramstaller, P.P.; Penninx, B.W.; Janssens, A.C.; Wilson, J.F.; Spector, T.; et al. Loci influencing lipid levels and coronary heart disease risk in 16 European population cohorts. Nat. Genet. 2009, 41, 47–55. [Google Scholar] [CrossRef] [PubMed] [Green Version]
  13. Huang, K.K.; Yin, R.X.; Zeng, X.N.; Huang, P.; Lin, Q.Z.; Wu, J.; Guo, T.; Wang, W.; Yang, D.Z.; Lin, W.X. Association of the rs7395662 SNP in the MADD-FOLH1 and several environmental factors with serum lipid levels in the Mulao and Han populations. Int. J. Med. Sci. 2013, 10, 1537–1546. [Google Scholar] [CrossRef] [PubMed]
  14. Wang, X.B.; Han, Y.D.; Cui, N.H.; Gao, J.J.; Yang, J.; Huang, Z.L.; Zhu, Q.; Zheng, F. Associations of lipid levels susceptibility loci with coronary artery disease in Chinese population. Lipids Health Dis. 2015, 14, 80. [Google Scholar] [CrossRef] [PubMed]
  15. Fedele, F.; Mancone, M.; Chilian, W.M.; Severino, P.; Canali, E.; Logan, S.; De Marchis, M.L.; Volterrani, M.; Palmirotta, R.; Guadagni, F. Role of genetic polymorphisms of ion channels in the pathophysiology of coronary microvascular dysfunction and ischemic heart disease. Basic Res. Cardiol. 2013, 108, 387. [Google Scholar] [CrossRef] [PubMed]
  16. Fedele, F.; Severino, P.; Bruno, N.; Stio, R.; Caira, C.; D’Ambrosi, A.; Brasolin, B.; Ohanyan, V.; Mancone, M. Role of ion channels in coronary microcirculation: A review of the literature. Future Cardiol. 2013, 9, 897–905. [Google Scholar] [CrossRef] [PubMed]
  17. Carty, C.L.; Buzková, P.; Fornage, M.; Franceschini, N.; Cole, S.; Heiss, G.; Hindorff, L.A.; Howard, B.V.; Mann, S.; Martin, L.W.; et al. Associations between incident ischemic stroke events and stroke and cardiovascular disease-related genome-wide association studies single nucleotide polymorphisms in the Population Architecture Using Genomics and Epidemiology study. Circ. Cardiovasc. Genet. 2012, 5, 210–216. [Google Scholar] [CrossRef] [PubMed]
  18. Franceschini, N.; Carty, C.; Bůzková, P.; Reiner, A.P.; Garrett, T.; Lin, Y.; Vöckler, J.S.; Hindorff, L.A.; Cole, S.A.; Boerwinkle, E.; et al. Association of genetic variants and incident coronary heart disease in multiethnic cohorts: The PAGE study. Circ. Cardiovasc. Genet. 2011, 4, 661–672. [Google Scholar] [CrossRef] [PubMed]
  19. Chen, Q.; Reis, S.E.; Kammerer, C.M.; McNamara, D.M.; Holubkov, R.; Sharaf, B.L.; Sopko, G.; Pauly, D.F.; Merz, C.N.; Kamboh, M.I.; et al. Association between the severity of angiographic coronary artery disease and paraoxonase gene polymorphisms in the National Heart, Lung, and Blood Institute-sponsored Women’s Ischemia Syndrome Evaluation (WISE) study. Am. J. Hum. Genet. 2003, 72, 13–22. [Google Scholar] [CrossRef] [PubMed]
  20. Xu, Y.; Wang, W.; Zhang, L.; Qi, L.P.; Li, L.Y.; Chen, L.F.; Fang, Q.; Dang, A.M.; Yan, X.W. A polymorphism in the ABCG1 promoter is functionally associated with coronary artery disease in a Chinese Han population. Atherosclerosis 2011, 219, 648–654. [Google Scholar] [CrossRef] [PubMed]
  21. Adams, H.P. Jr.; Bendixen, B.H.; Kappelle, L.J.; Biller, J.; Love, B.B.; Gordon, D.L.; Marsh, E.E. 3rd. Classification of subtype of acute ischemic stroke. Definitions for use in a multicenter clinical trial. TOAST. Trial of Org 10172 in Acute Stroke Treatment. Stroke 1993, 24, 35–41. [Google Scholar] [CrossRef] [PubMed]
  22. Wu, D.F.; Yin, R.X.; Cao, X.L.; Chen, W.X.; Aung, L.H.; Wang, W.; Huang, K.K.; Huang, P.; Zeng, X.N.; Wu, J. Scavenger receptor class B type 1 gene rs5888 single nucleotide polymorphism and the risk of coronary artery disease and ischemic stroke: A case-control study. Int. J. Med. Sci. 2013, 10, 1771–1777. [Google Scholar] [CrossRef] [PubMed]
  23. Yin, R.X.; Yang, Q.; Zhou, Y.J. Polymorphisms in the FADS1/FADS2 gene cluster are associated with the risk of coronary artery disease and ischemic stroke. J. Am. Coll. Cardiol. 2014, 64, C117–C118. [Google Scholar] [CrossRef]
  24. Yin, R.X.; Zhou, Y.J.; Hong, S.C. Polymorphisms in the glucokinase regulator gene are associated with serum lipid levels and the risk of coronary artery disease and ischemic stroke. J. Am. Coll. Cardiol. 2014, 64, C119. [Google Scholar] [CrossRef]
  25. Wu, D.F.; Yin, R.X.; Cao, X.L.; Chen, W.X. Association between single nucleotide polymorphism rs1044925 and the risk of coronary artery disease and ischemic stroke. Int. J. Mol. Sci. 2014, 15, 3546–3559. [Google Scholar] [CrossRef] [PubMed]
  26. Yang, Q.; Yin, R.X.; Zhou, Y.J.; Cao, X.L.; Guo, T.; Chen, W.X. Association of polymorphisms in the MAFB gene and the risk of coronary artery disease and ischemic stroke: A case–control study. Lipids Health Dis. 2015, 14, 79. [Google Scholar] [CrossRef] [PubMed]
  27. Zhou, Y.J.; Yang, Q.; Yin, R.X. Polymorphisms in the CELSR2-PSRC1-SORT1 are associated with serum lipid traits, the risk of coronary artery disease and ischemic stroke. J. Am. Coll. Cardiol. 2015, 66, C104–C105. [Google Scholar] [CrossRef]
  28. Yang, Q.; Zhou, Y.J.; Yin, R.X. Polymorphisms in the MAFB gene are associated with the risk of coronary artery disease and ischemic stroke. J. Am. Coll. Cardiol. 2015, 66, C139. [Google Scholar] [CrossRef]
  29. Nie, R.J.; Guo, T.; Cao, X.L.; Chen, W.X.; Wu, J.Z.; Yin, R.X. Polymorphisms in the DOCK7 gene and the risks of coronary artery disease and ischemic stroke. J. Am. Coll. Cardiol. 2015, 66, C268. [Google Scholar] [CrossRef]
  30. Zhou, Y.J.; Hong, S.C.; Yang, Q.; Yin, R.X.; Cao, X.L.; Chen, W.X. Association of variants in CELSR2-PSRC1-SORT1 with risk of serum lipid traits, coronary artery disease and ischemic stroke. Int. J. Clin. Exp. Pathol. 2015, 8, 9543–9551. [Google Scholar] [PubMed]
  31. Yang, Q.; Yin, R.X.; Cao, X.L.; Wu, D.F.; Chen, W.X.; Zhou, Y.J. Association of two polymorphisms in the FADS1/FADS2 gene cluster and the risk of coronary artery disease and ischemic stroke. Int. J. Clin. Exp. Pathol. 2015, 8, 7318–7331. [Google Scholar] [PubMed]
  32. Zhou, Y.J.; Hong, S.C.; Yin, R.X.; Yang, Q.; Cao, X.L.; Chen, W.X. Polymorphisms in the GCKR are associated with serum lipid traits, the risk of coronary artery disease and ischemic stroke. Int. J. Clin. Exp. Med. 2015, 8, 10678–10686. [Google Scholar] [PubMed]
  33. Nie, R.J.; Yin, R.X.; Huang, F.; Cao, X.L.; Wu, J.Z.; Chen, W.X.; Li, Z.M. Two DOCK7 polymorphisms and their haplotypes are associated with the risk of coronary artery disease and ischemic stroke. Int. J. Clin. Exp. Pathol. 2016, 9, 2169–2180. [Google Scholar]
  34. Wang, H.; Qiu, Q.; Tan, L.L.; Liu, T.; Deng, X.Q.; Chen, Y.M.; Chen, W.; Yu, X.Q.; Hu, B.J.; Chen, W.Q. Prevalence and determinants of diabetes and impaired fasting glucose among urban community-dwelling adults in Guangzhou, China. Diabetes Metab. 2009, 35, 378–384. [Google Scholar] [CrossRef] [PubMed]
  35. Yang, M.; Chen, P.; Jin, H.; Xie, X.; Gao, T.; Yang, L.; Yu, X. Circulating levels of irisin in middle-aged first-degree relatives of type 2 diabetes mellitus- correlation with pancreatic β-cell function. Diabetol. Metab. Syndr. 2014, 6, 133. [Google Scholar] [CrossRef] [PubMed]
  36. Aung, L.H.; Yin, R.X.; Wu, D.F.; Wang, W.; Liu, C.W.; Pan, S.L. Association of the variants in the BUD13-ZNF259 genes and the risk of hyperlipidaemia. J. Cell. Mol. Med. 2014, 18, 1417–1428. [Google Scholar] [CrossRef] [PubMed]
  37. Guo, T.; Yin, R.X.; Huang, F.; Yao, L.M.; Lin, W.X.; Pan, S.L. Association between the DOCK7, PCSK9 and GALNT2 gene polymorphisms and serum lipid levels. Sci. Rep. 2016, 6, 19079. [Google Scholar] [CrossRef] [PubMed]
  38. Liao, P.J.; Xie, R.B.; Yin, R.X.; Wei, D.X.; Huang, J.; Huang, F.; Li, H.; Lin, W.X.; Wu, J.Z.; Pan, S.L. Serum lipid profiles, the prevalence of dyslipidemia and the risk factors in two isolated Chinese minorities. Int. J. Clin. Exp. Med. 2015, 8, 19200–19211. [Google Scholar] [PubMed]
  39. Yin, R.X.; Wu, D.F.; Wu, J.Z.; Cao, X.L.; Aung, L.H.H.; Miao, L.; Long, X.J.; Liu, W.Y.; Zhang, L.; Li, M. Interactions of several lipid-related gene polymorphisms and cigarette smoking on blood pressure levels. Int. J. Biol. Sci. 2012, 8, 685–696. [Google Scholar] [CrossRef] [PubMed]
  40. Yin, R.X.; Aung, L.H.H.; Long, X.J.; Yan, T.T.; Cao, X.L.; Huang, F. Interactions of several single nucleotide polymorphisms and alcohol consumption on blood pressure levels. J. Am. Coll. Cardiol. 2015, 66, C197. [Google Scholar] [CrossRef]
  41. Yin, R.X.; Aung, L.H.; Long, X.J.; Yan, T.T.; Cao, X.L.; Huang, F.; Wu, J.Z.; Yang, D.Z.; Lin, W.X.; Pan, S.L. Interactions of several genetic polymorphisms and alcohol consumption on blood pressure levels. Biofactors 2015, 41, 339–351. [Google Scholar] [PubMed]
  42. Zhou, B.F.; Cooperative Meta-Analysis Group of the Working Group on Obesity in China. Predictive values of body mass index and waist circumference for risk factors of certain related diseases in Chinese adults—Study on optimal cut-off points of body mass index and waist circumference in Chinese adults. Biomed. Environ. Sci. 2002, 15, 83–96. [Google Scholar] [PubMed]
  43. Wildman, R.P.; Gu, D.; Reynolds, K.; Duan, X.; He, J. Appropriate body mass index and waist circumference cutoffs for categorization of overweight and central adiposity among Chinese adults. Am. J. Clin. Nutr. 2004, 80, 1129–1136. [Google Scholar] [PubMed]
  44. Shi, Y.Y.; He, L. SHEsis, a powerful software platform for analyses of linkage disequilibrium, haplotype construction, and genetic association at polymorphism loci. Cell Res. 2005, 15, 97–98. [Google Scholar] [CrossRef] [PubMed]
  45. Wu, Z.; Chen, Y.; Yang, T.; Gao, Q.; Yuan, M.; Ma, L. Targeted ubiquitination and degradation of G-protein-coupled receptor kinase 5 by the DDB1-CUL4 ubiquitin ligase complex. PLoS ONE 2012, 7, e43997. [Google Scholar] [CrossRef] [PubMed]
Figure 1. Interactions of the MADD-FOLH1 SNPs and drinking, smoking, BMI, age, and sex on serum lipid levels. MADD-FOLH1, MAP-kinase activating death domain-folate hydrolase 1; TG, triglyceride; HDL-C, high-density lipoprotein cholesterol; LDL-C, low-density lipoprotein cholesterol; BMI, body mass index. The differences in serum TG levels among the genotypes were determined by the Kruskal–Wallis test. The differences in serum HDL-C and LDL-C levels among the genotypes were assessed using analysis of covariance. The interactions of the genotypes and alcohol consumption, cigarette smoking or BMI ≥ 24 kg/m2 on serum lipid levels were detected by using a factorial regression analysis after controlling for potential confounders (PI). Genotype and alcohol consumption, cigarette smoking or BMI ≥ 24 kg/m2 interaction increases serum lipid levels (↑). A PI ≤ 0.0017 was considered statistically significant after Bonferroni correction.
Nutrients 08 00208 g001
Table 1. Comparison of general characteristics and serum lipid levels between controls and patients.
ParameterControlCHDISP1P2
Number596584555
Male/Female435/161432/152401/1540.7010.780
Age, years61.53 ± 10.8862.21 ± 10.5062.82 ± 12.350.2750.061
Body mass index, kg/m2 (kg/m2)22.42 ± 2.8623.84 ± 3.8223.40 ± 3.510.0000.000
Systolic blood pressure, mmHg130.63 ± 20.02132.98 ± 23.31147.72 ± 22.150.0660.000
Diastolic blood pressure, mmHg83.00 ± 13.4279.18 ± 14.2283.78 ± 12.970.0000.332
Pulse pressure, mmHg49.78 ± 14.7053.42 ± 18.0363.78 ± 18.300.0000.000
Cigarette smoking, n (%)267 (44.8)284 (48.6)248 (44.68)0.1870.969
Alcohol consumption, n (%)284 (47.7)169 (28.9)172 (31.0)0.0000.000
Total cholesterol, mmol/L4.94 ± 1.114.53 ± 1.194.52 ± 1.150.0000.000
Triglyceride, mmol/L1.01 (0.71)1.36(0.96)1.36(0.93)0.0000.000
HDL-C, mmol/L1.90 ± 0.501.14 ± 0.341.23 ± 0.400.0000.000
LDL-C, mmol/L2.74 ± 0.802.71 ± 1.002.68 ± 0.900.5320.263
Apolipoprotein (Apo) A1, g/L1.41 ± 0.281.04 ± 0.521.02 ± 0.220.0000.000
ApoB, g/L0.91 ± 0.220.91 ± 0.270.89 ± 0.250.9870.349
ApoA1/ApoB1.63 ± 0.501.23 ± 0.791.26 ± 0.600.0000.000
CHD, coronary heart disease; IS, ischemic stroke; HDL-C, high-density lipoprotein cholesterol; LDL-C, low-density lipoprotein cholesterol. The value of triglyceride was presented as median (interquartile range), the difference between CHD/IS patients and controls was determined by the Wilcoxon–Mann–Whitney test. P1, CHD vs. controls; P2, IS vs. controls.
Table 2. Genotypic and allelic frequencies of six SNPs in controls and patients (n (%)).
SNP/GenotypeControl n = 596CHD n = 584IS n = 555AlleleControlCHDIS
rs7395662
AA200 (33.6)231 (39.6)232 (41.8)
AG284 (47.7)279 (47.8)243 (43.8)A684 (57.4)741 (63.4)707 (63.7)
GG112 (18.8)74 (12.7)80 (14.4)G508 (42.6)427 (36.6)403 (36.3)
χ29.9179.445χ29.0549.574
P0.0070.009P0.0030.002
PHWE0.5300.4700.210
rs326214
GG311 (52.1)295 (50.4)291 (52.4)
GA243 (40.7)248 (42.4)233 (42.0)G865 (72.4)838 (71.6)815 (73.4)
AA43 (7.2)42 (7.2)31 (5.6)A329 (27.6)332 (28.4)295 (26.6)
χ20.3631.291χ20.1980.279
P0.8340.524P0.6560.598
PHWE0.6330.2990.074
rs326217
TT326 (54.6)313 (53.5)316 (56.9)
TC232 (38.9)234 (40.0)213 (38.4)T884 (74.0)860 (73.5)845 (76.2)
CC39 (6.5)38 (6.5)26 (4.7)C310 (26.0)310 (26.5)264 (23.8)
χ20.1642.038χ20.0871.431
P0.9210.361P0.7690.232
PHWE0.7910.5150.188
rs1051006
AA242 (40.5)207 (35.5)213 (38.4)
AG275 (46.1)293 (50.3)281 (50.6)A759 (63.6)707 (60.6)707 (63.7)
GG80 (13.4)83 (14.2)61 (11.0)G435 (36.4)459 (39.4)403 (36.4)
χ23.1882.946χ22.1570.004
P0.2030.229P0.1420.950
PHWE0.8930.2030.026
rs3736101
GG543 (91.0)526 (90.2)495 (89.2)
GA52 (8.7)55 (9.4)60 (10.8)G1138 (95.3)1107 (94.9)1050 (94.6)
AA2 (0.3)2 (0.3)0A56 (4.7)59 (5.1)60 (5.4)
χ20.1883.264χ20.1740.616
P0.9100.196P0.6760.433
PHWE0.5290.6620.178
rs7120118
CC342 (57.5)317 (54.3)315 (56.8)
CT224 (37.6)232 (39.7)216 (38.9)C908 (76.3)866 (74.1)846 (76.2)
TT29 (4.9)35 (6.0)24 (4.3)T282 (23.7)302 (25.9)264 (23.8)
χ21.5490.336χ21.4740.002
P0.4610.845P0.2250.961
PHWE0.3170.3830.083
SNP, single nucleotide polymorphism; CHD, coronary heart disease; IS, ischemic stroke; HWE, Hardy-Weinberg equilibrium.
Table 3. Genotypes of the six MADD-FOLH1 SNPs and the risk of CHD and IS.
SNP/ModelRef. GenotypeEffect GenotypeCHD (OR 95% CI)pIS (OR 95% CI)p
rs7395662
Co-dominantAAGA0.85 (0.66–1.09)0.00680.74 (0.57–0.95)0.0088
GG0.78 (0.66–0.92)0.62 (0.44–0.87)
DominantAAGA/GG0.77 (0.61–0.98)0.0320.70 (0.55–0.89)0.0039
RecessiveAA/GAGG0.63 (0.46–0.86)0.00380.73 (0.53–1.00)0.046
OverdominantAA/GGGA1.00 (0.80–1.26)0.970.86 (0.68–1.08)0.19
Log-additive0.78 (0.66–0.92)0.0030.78 (0.66–0.91)0.0024
rs326214
Co-dominantGGGA1.08 (0.85–1.37)0.831.02 (0.81–1.30)0.52
AA1.03 (0.65–1.62)0.77 (0.47–1.26)
DominantGGGA/AA1.07 (0.85–1.34)0.570.99 (0.78–1.24)0.91
RecessiveGG/GAAA1.00 (0.64–1.55)0.990.76 (0.47–1.23)0.26
OverdominantGG/AAGA1.07 (0.85–1.35)0.561.05 (0.83–1.33)0.66
Log-additive1.04 (0.87–1.25)0.650.95 (0.79–1.15)0.59
rs326217
Co-dominantTTTC1.05 (0.83–1.33)0.920.95 (0.74–1.21)0.36
CC1.01 (0.63–1.63)0.69 (0.41–1.16)
DominantTTCT/CC1.05 (0.83–1.31)0.70.91 (0.72–1.15)0.43
RecessiveTT/CTCC0.99 (0.63–1.58)0.980.70 (0.42–1.17)0.17
OverdominantTT/CCCT1.05 (0.83–1.32)0.690.98 (0.77–1.24)0.87
Log-additive1.03 (0.85–1.24)0.770.89 (0.74–1.08)0.24
rs1051006
Co-dominantAAGA1.25 (0.97–1.60)0.201.16 (0.91–1.49)0.23
GG1.21 (0.85–1.74)0.87 (0.59–1.27)
DominantAAGA/GG1.24 (0.98–1.57)0.0751.09 (0.86–1.39)0.45
RecessiveAA/GAGG1.07 (0.77–1.49)0.680.80 (0.56–1.14)0.21
OverdominantAA/GGGA1.18 (0.94–1.49)0.151.20 (0.95–1.51)0.12
Log-additive1.14 (0.96–1.34)0.140.99 (0.84–1.18)0.95
rs3736101
Co-dominantGGGA1.09 (0.73–1.63)0.911.27 (0.86–1.87)0.13
AA1.03 (0.14–7.36)0.00 (0.00–NA)
DominantGGGA/AA1.09 (0.74–1.61)0.671.22 (0.83–1.80)0.32
RecessiveGG/GAAA1.02 (1.14–7.29)0.980.00 (0.00–NA)0.1
OverdominantGG/AAGA1.09 (0.73–1.62)0.671.27 (0.86–1.88)0.23
Log-additive1.08 (0.75–1.57)0.681.16 (0.80–1.70)0.43
rs7120118
Co-dominantCCCT1.12 (0.88–1.42)0.461.05 (0.82–1.33)0.85
TT1.30 (0.78–2.18)0.90 (0.51–1.58)
DominantCCCT/TT1.14 (0.90–1.43)0.271.03 (0.82–1.30)0.8
RecessiveCC/CTTT1.24 (0.75–2.06)0.400.88 (0.51–1.53)0.66
OverdominantCC/TTCT1.09 (0.86–1.38)0.461.06 (0.83–1.34)0.66
Log-additive1.13 (0.93–1.37)0.221.01 (0.82–1.23)0.96
SNP, single nucleotide polymorphism; CHD, coronary heart disease; IS, ischemic stroke.
Table 4. Haplotype frequencies of the five MADD-FOLH1 SNPs and the risk of CHD and IS.
HaplotypeControl FrequencyCHDIS
FrequencyOR (95% CI)pFrequencyOR (95% CI)p
A-G-T-G-C0.63390.61781.000.63321.00
G-A-C-G-T0.21990.22811.07 (0.86–1.33)0.540.21610.91 (0.73–1.13)0.38
G-G-T-G-C0.04190.05111.59 (1.06–2.38)0.0260.04391.06 (0.69–1.64)0.78
G-G-T-A-C0.04690.04921.12 (0.74–1.68)0.590.05051.30 (0.87–1.94)0.20
G-A-C-G-C0.03970.03290.75 (0.45–1.27)0.280.03370.71 (0.43–1.17)0.18
G-A-T-G-T0.01590.01771.74 (0.88–3.46)0.110.02021.95 (1.04–3.68)0.039
CHD, coronary heart disease; IS, ischemic stroke. The haplotypes consist of five alleles in the order of rs1051006, rs326214, rs326217, rs3736101, and rs7120118 SNPs.
Table 5. Genotypes of the six MADD-FOLH1 SNPs and serum lipid levels in controls.
SNP/GenotypenTC (mmol/L)TG (mmol/L)HDL-C (mmol/L)LDL-C (mmol/L)ApoA1 (g/L)ApoB (g/L)ApoA1/ApoB
rs7395662
AA2005.00 ± 1.061.03 (0.58)1.99 ± 0.612.79 ± 0.831.44 ± 0.290.92 ± 0.231.65 ± 0.57
AG2844.88 ± 0.940.98 (0.64)1.88 ± 0.442.75 ± 0.761.39 ± 0.240.90 ± 0.191.61 ± 0.41
GG1125.00 ± 1.461.23 (0.79)1.77 ± 0.422.64 ± 0.811.36 ± 0.230.90 ± 0.231.62 ± 0.49
F0.84610.5547.4821.3133.9291.1430.525
P0.4300.0050.0010.2700.0200.3200.592
rs326214
GG3114.98 ± 1.151.01 (0.71)1.90 ± 0.542.75 ± 0.831.40 ± 0.300.90 ± 0.221.64 ± 0.54
GA2434.90 ± 0.911.01 (0.67)1.93 ± 0.482.76 ± 0.761.40 ± 0.200.81 ± 0.211.61 ± 0.42
AA434.97 ± 1.561.18 (0.75)1.71 ± 0.262.63 ± 0.791.35 ± 0.200.87 ± 0.241.63 ± 0.45
F0.3603.7713.6540.4860.9590.7300.225
P0.6980.1150.0260.6160.3840.4820.799
rs326217
TT3264.97 ± 1.141.00 (0.65)1.91 ± 0.552.74 ± 0.831.41 ± 0.290.90 ± 0.221.65 ± 0.53
TC2324.90 ± 0.911.01 (0.71)1.90 ± 0.472.80 ± 0.751.39 ± 0.200.92 ± 0.201.60 ± 0.41
CC395.02 ± 1.611.23 (0.75)1.74 ± 0.262.60 ± 0.781.36 ± 0.210.87 ± 0.251.65 ± 0.46
F0.3235.0902.2730.9130.7010.7360.691
P0.7240.0780.1040.4020.4970.4800.501
rs1051006
AA2425.02 ± 1.121.03 (0.67)1.92 ± 0.552.76 ± 0.801.41 ± 0.280.91 ± 0.211.62 ± 0.52
AG2754.86 ± 1.011.01 (0.71)1.88 ± 0.462.75 ± 0.811.40 ± 0.240.91 ± 0.221.62 ± 0.46
GG805.00 ± 1.281.02 (0.74)1.87 ± 0.502.71 ± 0.741.38 ± 0.220.88 ± 0.211.65 ± 0.47
F1.5120.2440.6000.1100.4530.8890.112
P0.2210.8850.5490.8960.6360.4110.894
rs3736101
GG5434.94 ± 1.111.02 (0.66)1.88 ± 0.492.74 ± 0.801.39 ± 0.250.91 ± 0.221.61 ± 0.47
GA/AA545.02 ± 0.961.00 (0.79)2.02 ± 0.602.82 ± 0.791.45 ± 0.290.88 ± 0.201.76 ± 0.64
F0.3070.2143.4870.5182.3331.1564.530
P0.5800.8310.0620.4720.1270.2830.034
rs7120118
CC3424.97 ± 1.141.02 (0.73)1.90 ± 0.542.75 ± 0.821.41 ± 0.300.90 ± 0.221.64 ± 0.53
CT2244.88 ± 0.881.01 (0.69)1.90 ± 0.472.75 ± 0.751.39 ± 0.180.91 ± 0.201.61 ± 0.41
TT295.15 ± 1.861.18 (0.88)1.76 ± 0.282.66 ± 0.871.33 ± 1.330.89 ± 0.301.61 ± 0.49
F0.9271.0351.1880.2021.5760.0720.383
P0.3960.5960.3060.8170.2080.9310.682
SNP, single nucleotide polymorphism; TC, total cholesterol; TG, triglyceride; HDL-C, high-density lipoprotein cholesterol; LDL-C, low-density lipoprotein cholesterol; ApoA1, apolipoprotein A1; ApoB, apolipoprotein B. The value of triglyceride was presented as median (interquartile range), and the difference among the genotypes was determined by the Kruskal-Wallis test. A p < 0.008 was considered statistically significant after Bonferroni correction.
Table 6. The PI values for interactions of genotypes and drinking, smoking, and BMI on serum lipid levels and the risk of CHD and IS.
SNP/FactorLipidCHDIS
TCTGHDL-CLDL-CApoA1ApoBApoA1/B
rs7395662
Drinking0.1750.0020.0000.4540.0640.3140.0730.6200.650
Smoking0.0310.0020.1280.0370.7890.0460.0460.6300.590
BMI0.3140.9910.3670.2220.5300.6870.7110.6020.453
Age0.0040.0030.6350.4250.3900.2770.7090.1410.019
Sex0.3770.1060.1180.8520.3450.2720.0770.3440.178
rs326214
Drinking0.6110.0010.2120.2820.3930.3090.1960.3800.420
Smoking0.6860.0160.1210.1180.3660.6260.7550.4190.475
BMI0.7350.1310.7920.1330.1300.1000.7920.4320.341
Age0.1450.0040.7620.9480.7030.3340.5830.2250.865
Sex0.5060.0200.5820.3350.9510.7180.5060.5960.842
rs326217
Drinking0.5290.0010.1920.3070.2950.3920.0890.4400.072
Smoking0.8540.0150.4380.2590.5210.8080.9670.9090.900
BMI0.9170.0840.6700.0560.0940.0420.6700.5030.334
Age0.3210.0040.8440.7990.7160.1410.4390.3980.821
Sex0.5100.2070.7260.5770.8900.9210.7180.6800.678
rs1051006
Drinking0.7800.0190.9140.4490.8170.8860.7980.5390.181
Smoking0.4560.0650.1800.0400.4680.7150.3380.3480.614
BMI0.0280.4320.3210.0000.1160.0110.9410.1200.430
Age0.0190.0310.0820.6970.3660.1070.5730.1530.679
Sex0.7180.0970.9750.0960.6450.3600.6050.9950.608
rs3736101
Drinking0.8810.2970.0020.6490.0280.1790.1520.00210.650
Smoking0.9110.4500.0010.3750.0750.8530.3760.6300.550
BMI0.0640.5370.0990.1980.7580.7790.4270.6490.881
Age0.9860.3740.9420.6320.8590.1520.2440.2180.383
Sex0.0730.2330.3960.3430.7200.0990.1690.4670.758
rs7120118
Drinking0.2870.0010.3590.8870.1980.4300.0630.5900.640
Smoking0.8810.0130.4230.1030.3480.1590.5430.4890.391
BMI0.3230.0200.7860.2160.4210.0320.8650.6040.567
Age0.1020.0020.8170.7710.2880.7810.9580.2580.780
Sex0.2340.0550.9630.7850.7460.4930.7490.5050.491
SNP, single nucleotide polymorphism; TC, total cholesterol; TG, triglyceride; HDL-C, high-density lipoprotein cholesterol; LDL-C, low-density lipoprotein cholesterol; ApoA1, apolipoprotein A1; ApoB, apolipoprotein B; CHD, coronary heart disease; IS, ischemic stroke; BMI, body mass index. A PI ≤ 0.0017 was considered statistically significant after Bonferroni correction.

