Is There a Chronic Elevation in Organ-Tissue Sleeping Metabolic Rate in Very Fit Runners?

 ,
,
Abstract
:1. Introduction
2. Materials and Methods
2.1. Subjects
2.2. O2peak Measurement
2.3. Anthropometry and Dual Energy X-ray Absorptiometry (DXA) Measurements
2.4. Measurement of Organ-Tissue Mass Using MRI
2.5. Measurement of Sleeping EE Using IHC
2.6. Calculation of REE
2.7. Blood Collection and Analysis
2.8. Statistical Analysis
3. Results
4. Discussion
5. Conclusions
Acknowledgments
Author Contribution
Conflicts of Interest
Abbreviations
| EE | energy expenditure |
| IHC | indirect human calorimeter |
| REE | resting energy expenditure |
| FFM | fat-free mas |
| SM | skeletal muscle |
| MRI | magnetic resonance imaging |
| O2 | oxygen uptake |
| CO2 | carbon dioxide output |
| RER | respiratory exchange ratio |
| DXA | dual energy X-ray absorptiometry |
| CV | coefficient of validation |
| TSH | thyroid-stimulating hormone |
| T3 | triiodothyronine |
| T4 | thyroxine |
| ECG | electrocardiogram |
References
- Ganpule, A.A.; Tanaka, S.; Ishikawa-Takata, K.; Tabata, I. Interindividual variability in sleeping metabolic rate in Japanese subjects. Eur. J. Clin. Nutr. 2007, 61, 1256–1261. [Google Scholar] [CrossRef] [PubMed]
- Ravussin, E.; Bogardus, C. Relationship of genetics, age, and physical fitness to daily energy expenditure and fuel utilization. Am. J. Clin. Nutr. 1989, 49, 968–975. [Google Scholar] [PubMed]
- Ishikawa-Takata, K.; Tabata, I.; Sasaki, S.; Rafamantanantsoa, H.H.; Okazaki, H.; Okubo, H.; Tanaka, S.; Yamamoto, S.; Shirota, T.; Uchida, K.; et al. Physical activity level in healthy free-living Japanese estimated by doubly labelled water method and International Physical Activity Questionnaire. Eur. J. Clin. Nutr. 2008, 62, 885–891. [Google Scholar] [CrossRef] [PubMed]
- Gallagher, D.; Belmonte, D.; Deurenberg, P.; Wang, Z.; Krasnow, N.; Pi-Sunyer, F.X.; Heymsfield, S.B. Organ-tissue mass measurement allows modeling of REE and metabolically active tissue mass. Am. J. Physiol. 1998, 275, 249–258. [Google Scholar]
- Illner, K.; Brinkmann, G.; Heller, M.; Bosy-Westphal, A.; Muller, M.J. Metabolically active components of fat free mass and resting energy expenditure in nonobese adults. Am. J. Physiol. Endocrinol. Metab. 2000, 278, 308–315. [Google Scholar]
- Bosy-Westphal, A.; Reinecke, U.; Schlorke, T.; Illner, K.; Kutzner, D.; Heller, M.; Muller, M.J. Effect of organ and tissue masses on resting energy expenditure in underweight, normal weight and obese adults. Int. J. Obes. Relat. Metab. Disord. 2004, 28, 72–79. [Google Scholar] [CrossRef] [PubMed]
- Beekley, M.D.; Abe, T.; Kondo, M.; Midorikawa, T.; Yamauchi, T. Comparison of maximum aerobic capacity and body composition of elite Sumo wrestlers to elite athletes in combat and other sports. J. Sports Sci. Med. 2006, 5, 13–20. [Google Scholar] [PubMed]
- Midorikawa, T.; Kondo, M.; Beekley, M.D.; Koizumi, K.; Abe, T. High REE in Sumo wrestlers attributed to large organ-tissue mass. Med. Sci. Sports Exerc. 2007, 39, 688–693. [Google Scholar] [CrossRef] [PubMed]
- Elia, M. The inter-organ flux of substrates in fed and fasted man, as indicated by arterio-venous balance studies. Nutr. Res. Rev. 1991, 4, 3–31. [Google Scholar] [CrossRef] [PubMed]
- Speakman, J.R.; Selman, C. Physical activity and resting metabolic rate. Proc. Nutr. Soc. 2003, 62, 621–634. [Google Scholar] [CrossRef] [PubMed]
- Smith, D.A.; Dollman, J.; Withers, R.T.; Brinkman, M.; Keeves, J.P.; Clark, D.G. Relationship between maximum aerobic power and resting metabolic rate in young adult women. J. Appl. Physiol. 1997, 82, 156–163. [Google Scholar] [PubMed]
- Santa-Clara, H.; Szymanski, L.; Ordille, T.; Fernhall, B. Effects of exercise training on resting metabolic rate in postmenopausal African American and Caucasian women. Metabolism 2006, 55, 1358–1364. [Google Scholar] [CrossRef] [PubMed]
- Scharhag-Rosenberger, F.; Meyer, T.; Walitzek, S.; Kindermann, W. Effects of one year aerobic endurance training on resting metabolic rate and exercise fat oxidation in previously untrained men and women. Metabolic endurance training adaptations. Int. J. Sports Med. 2010, 31, 498–504. [Google Scholar] [CrossRef] [PubMed]
- Lee, M.G.; Sedlock, D.A.; Flynn, M.G.; Kamimori, G.H. Resting metabolic rate after endurance exercise training. Med. Sci. Sports Exerc. 2009, 41, 1444–1451. [Google Scholar] [CrossRef] [PubMed]
- William, D.M.; Frank, I.K.; Victor, L.K. Exercise Physiology: Nutrition, Energy, and Human Performance, 7th ed.; Lippincott Williams & Wilkins: Philadelphia, PA, USA, 2010. [Google Scholar]
- Konishi, M.; Takahashi, M.; Endo, N.; Numao, S.; Takagi, S.; Miyashita, M.; Midorikawa, T.; Suzuki, K.; Sakamoto, S. Effect of one night of sleep deprivation on maximal fat oxidation during graded exercise. J. Phys. Fitness Sports Med. 2013, 2, 121–126. [Google Scholar] [CrossRef]
- Konishi, M.; Takahashi, M.; Endo, N.; Numao, S.; Takagi, S.; Miyashita, M.; Midorikawa, T.; Suzuki, K.; Sakamoto, S. Effects of sleep deprivation on autonomic and endocrine functions throughout the day and on exercise tolerance in the evening. J. Sports Sci. 2013, 31, 248–255. [Google Scholar] [CrossRef] [PubMed]
- Tanaka, K.; Takeshima, N.; Kato, T.; Niihata, S.; Ueda, K. Critical determinants of endurance performance in middle-aged and elderly endurance runners with heterogeneous training habits. Eur. J. Appl. Physiol. Occup. Physiol. 1990, 59, 443–449. [Google Scholar] [CrossRef] [PubMed]
- Abe, T.; Kearns, C.F.; Fukunaga, T. Sex differences in whole body skeletal muscle mass measured by magnetic resonance imaging and its distribution in young Japanese adults. Br. J. Sports Med. 2003, 37, 436–440. [Google Scholar] [CrossRef] [PubMed]
- Snyder, W.S.; Cooke, M.J.; Nasset, E.S.; Karhausen, L.R.; Howells, G.P.; Tipton, I.H. Report of the Task Group on Reference Man; Pergamon: Oxford, UK, 1975; pp. 112, 282–285. [Google Scholar]
- Duck, F.A. Physical Properties of Tissue; Academic press: New York, NY, USA, 1990; p. 138. [Google Scholar]
- Ogiu, N.; Nakamura, Y.; Ijiri, I.; Hiraiwa, K.; Ogiu, T. A statistical analysis of the internal organ weights of normal Japanese people. Health Phys. 1997, 72, 368–383. [Google Scholar] [CrossRef] [PubMed]
- Heymsfield, S.B.; Gallagher, D.; Kotler, D.P.; Wang, Z.; Allison, D.B.; Heshka, S. Body-size dependence of resting energy expenditure can be attributed to nonenergetic homogeneity of fat-free mass. Am. J. Physiol. Endocrinol. Metab. 2002, 282, 132–138. [Google Scholar]
- Futami, J.; Tanaka, S.; Yamamura, C.; Oka, J.; Ishikawa-Takata, K.; Kashiwazaki, H. Measurement of energy expenditure by whole-body indirect human calorimeter –evaluation of validity and error factors. Nippon Eiyo Shokuryo Gakkaishi (J. Jpn. Soc. Nutr. Food Sci.) 2003, 56, 229–236. (In Japanese) [Google Scholar] [CrossRef]
- Yamamura, C.; Tanaka, S.; Futami, J.; Oka, J.; Ishikawa-Takata, K.; Kashiwazaki, H. Activity diary method for predicting energy expenditure as evaluated by a whole-body indirect human calorimeter. J. Nutr. Sci. Vitaminol. 2003, 49, 262–269. [Google Scholar] [CrossRef] [PubMed]
- Usui, C.; Ando, T.; Ohkawara, K.; Miyake, R.; Oshima, Y.; Hibi, M.; Oishi, S.; Tokuyama, K.; Tanaka, S. Validity and reproducibility of a novel method for time-course evaluation of diet-induced thermogenesis in a respiratory chamber. Physiol. Rep. 2015, 3, e12410. [Google Scholar] [CrossRef] [PubMed]
- Weir, J.B. New methods for calculating metabolic rate with special reference to protein metabolism. J. Physiol. 1949, 109, 1–9. [Google Scholar] [CrossRef] [PubMed]
- Bland, J.M.; Altman, D.G. Statistical methods for assessing agreement between two methods of clinical measurement. Lancet 1986, 1, 307–310. [Google Scholar] [CrossRef]


| Very Fit Runners | Fit Runners | p | |
|---|---|---|---|
| n = 8 | n = 9 | ||
| Age (years) | 21± 1 | 20 ± 1 | n.s. |
| Standing height (cm) | 170.8 ± 4.7 | 170.9 ± 5.3 | n.s. |
| Body mass (kg) | 58.0 ± 6.7 | 55.0 ± 4.1 | n.s. |
| BMI (kg/m2) | 19.8 ± 1.7 | 18.8 ± 1.1 | n.s. |
| Fat (%) | 8.5 ± 0.9 | 10.9 ± 2.7 | <0.05 |
| Fat mass (kg) | 4.9 ± 0.9 | 6.0 ± 1.5 | n.s. |
| Fat-free mass (FFM) (kg) | 53.0 ± 5.9 | 49.0 ± 4.2 | n.s. |
| Peak heart rate (beats/min) | 180 ± 10 | 181 ± 8 | n.s. |
| Peak RER | 1.17 ± 0.04 | 1.25 ± 0.08 | <0.05 |
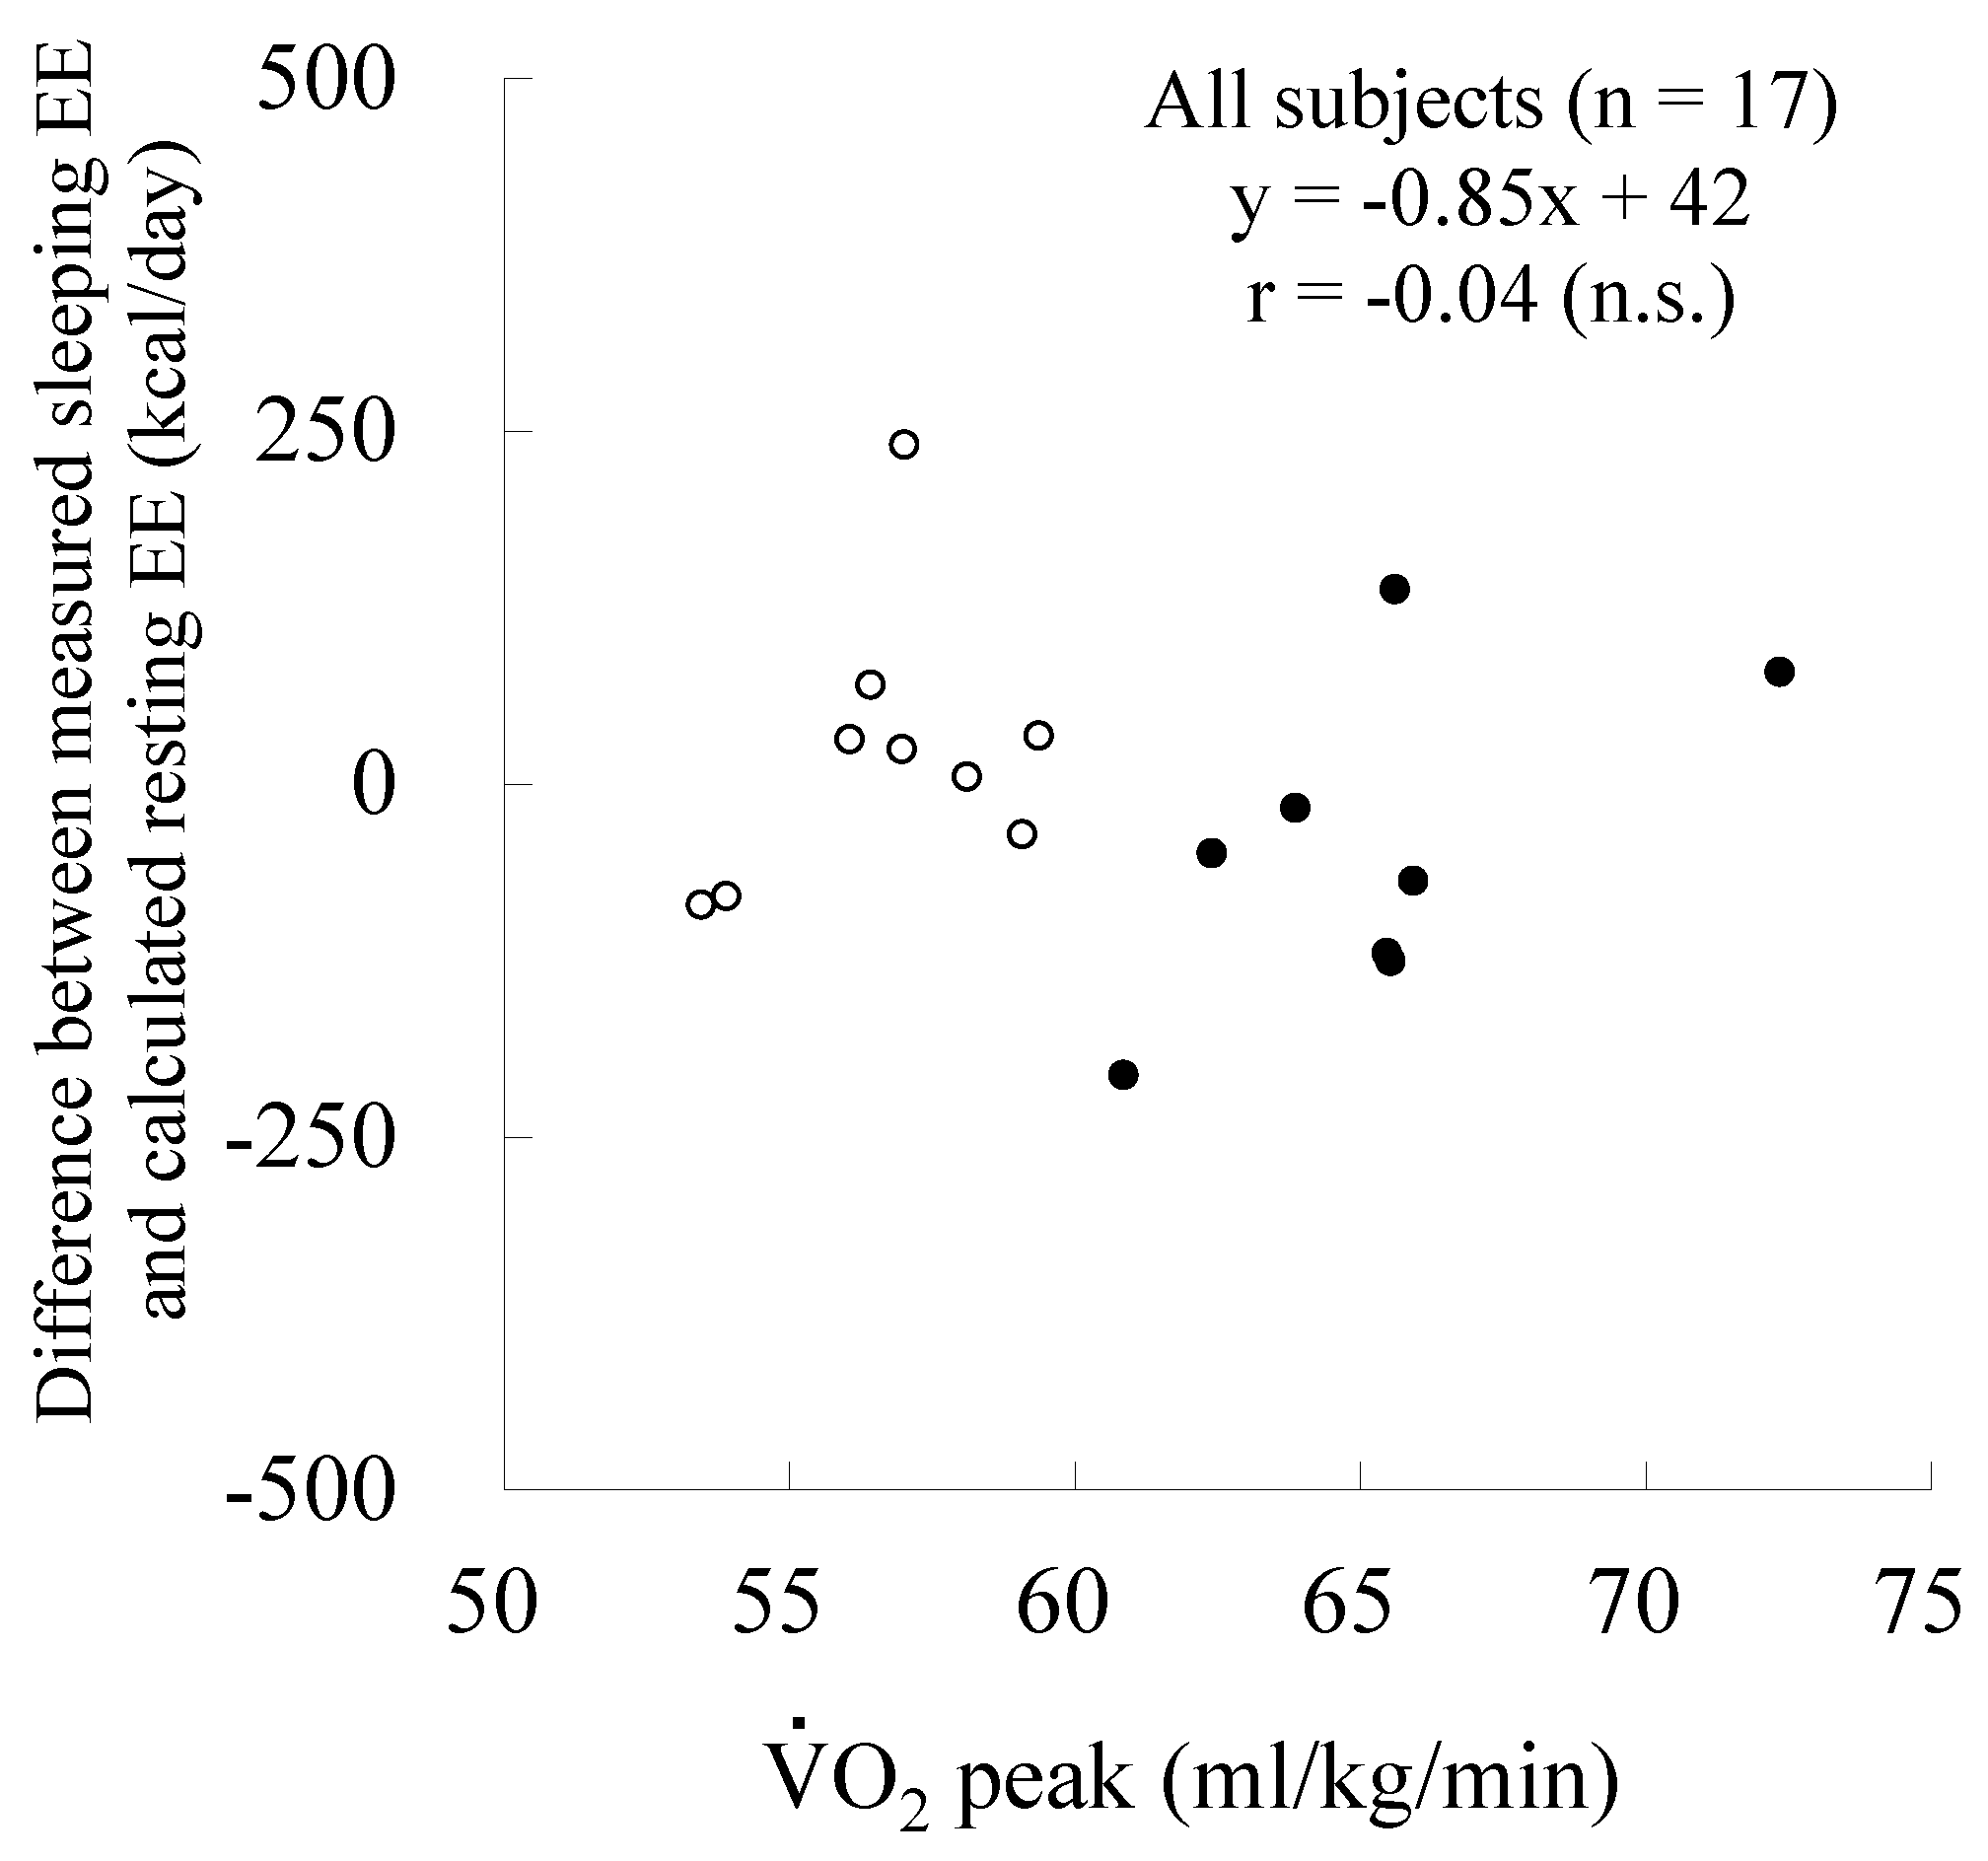
| O2peak (mL/min) | 3860 ± 320 | 3205 ± 292 | <0.01 |
| O2peak (mL/kg/min) | 65.2 ± 3.4 | 56.7 ± 2.1 | <0.01 |
| Organ-Tissue Mass (kg) | Very Fit Runners | Fit Runners | p |
|---|---|---|---|
| n = 8 | n = 9 | ||
| Skeletal muscle | 24.4 ± 3.2 | 22.5 ± 2.3 | n.s. |
| Adipose tissue 1 | 5.9 ± 1.1 | 7.2 ± 1.8 | n.s. |
| Liver | 1.48 ± 0.32 | 1.26 ± 0.12 | n.s. |
| Brain | 1.54 ± 0.13 | 1.52 ± 0.10 | n.s. |
| Heart 2 | 0.29 ± 0.02 | 0.28 ± 0.02 | n.s. |
| Kidney | 0.30 ± 0.08 | 0.30 ± 0.04 | n.s. |
| Residual 3 | 24.0 ± 2.5 | 21.9 ± 2.0 | n.s. |
| Very Fit Runners | Fit Runners | p | |
|---|---|---|---|
| n = 8 | n = 9 | ||
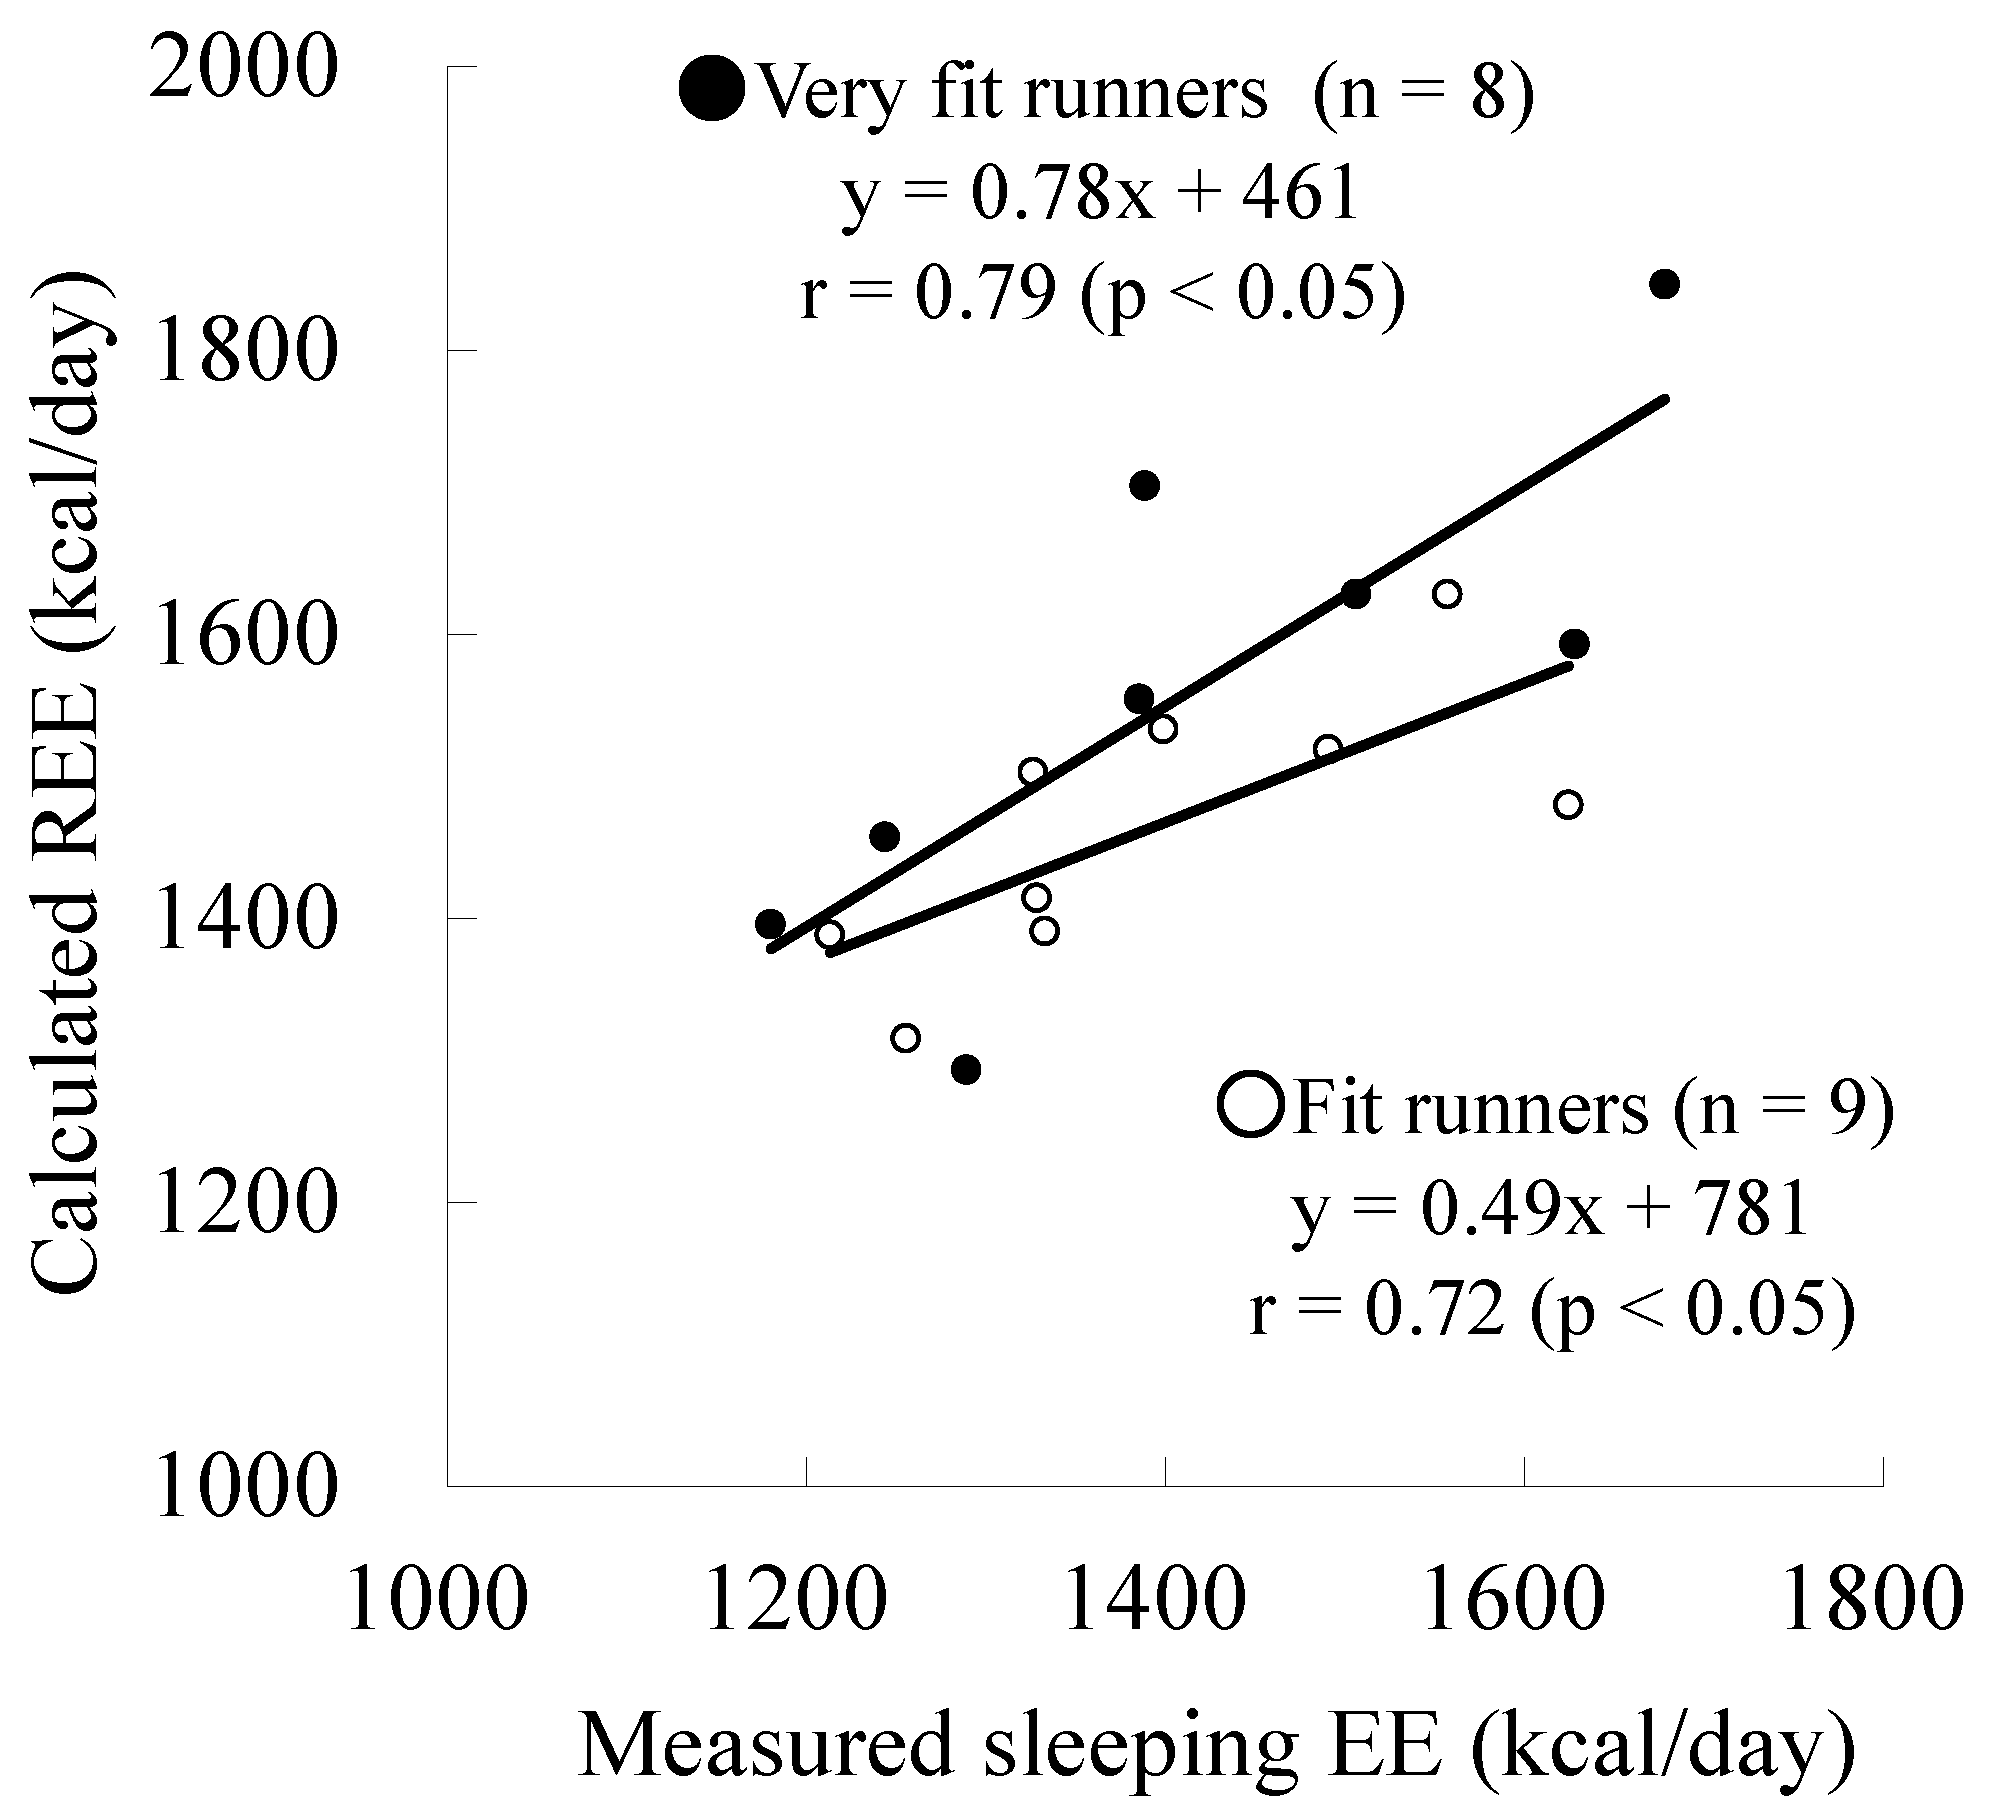
| Measured sleeping EE (kcal/day) | 1412 ± 179 | 1392 ± 139 | n.s. |
| Calculated REE (kcal/day) | 1559 ± 176 | 1464 ± 95 | n.s. |
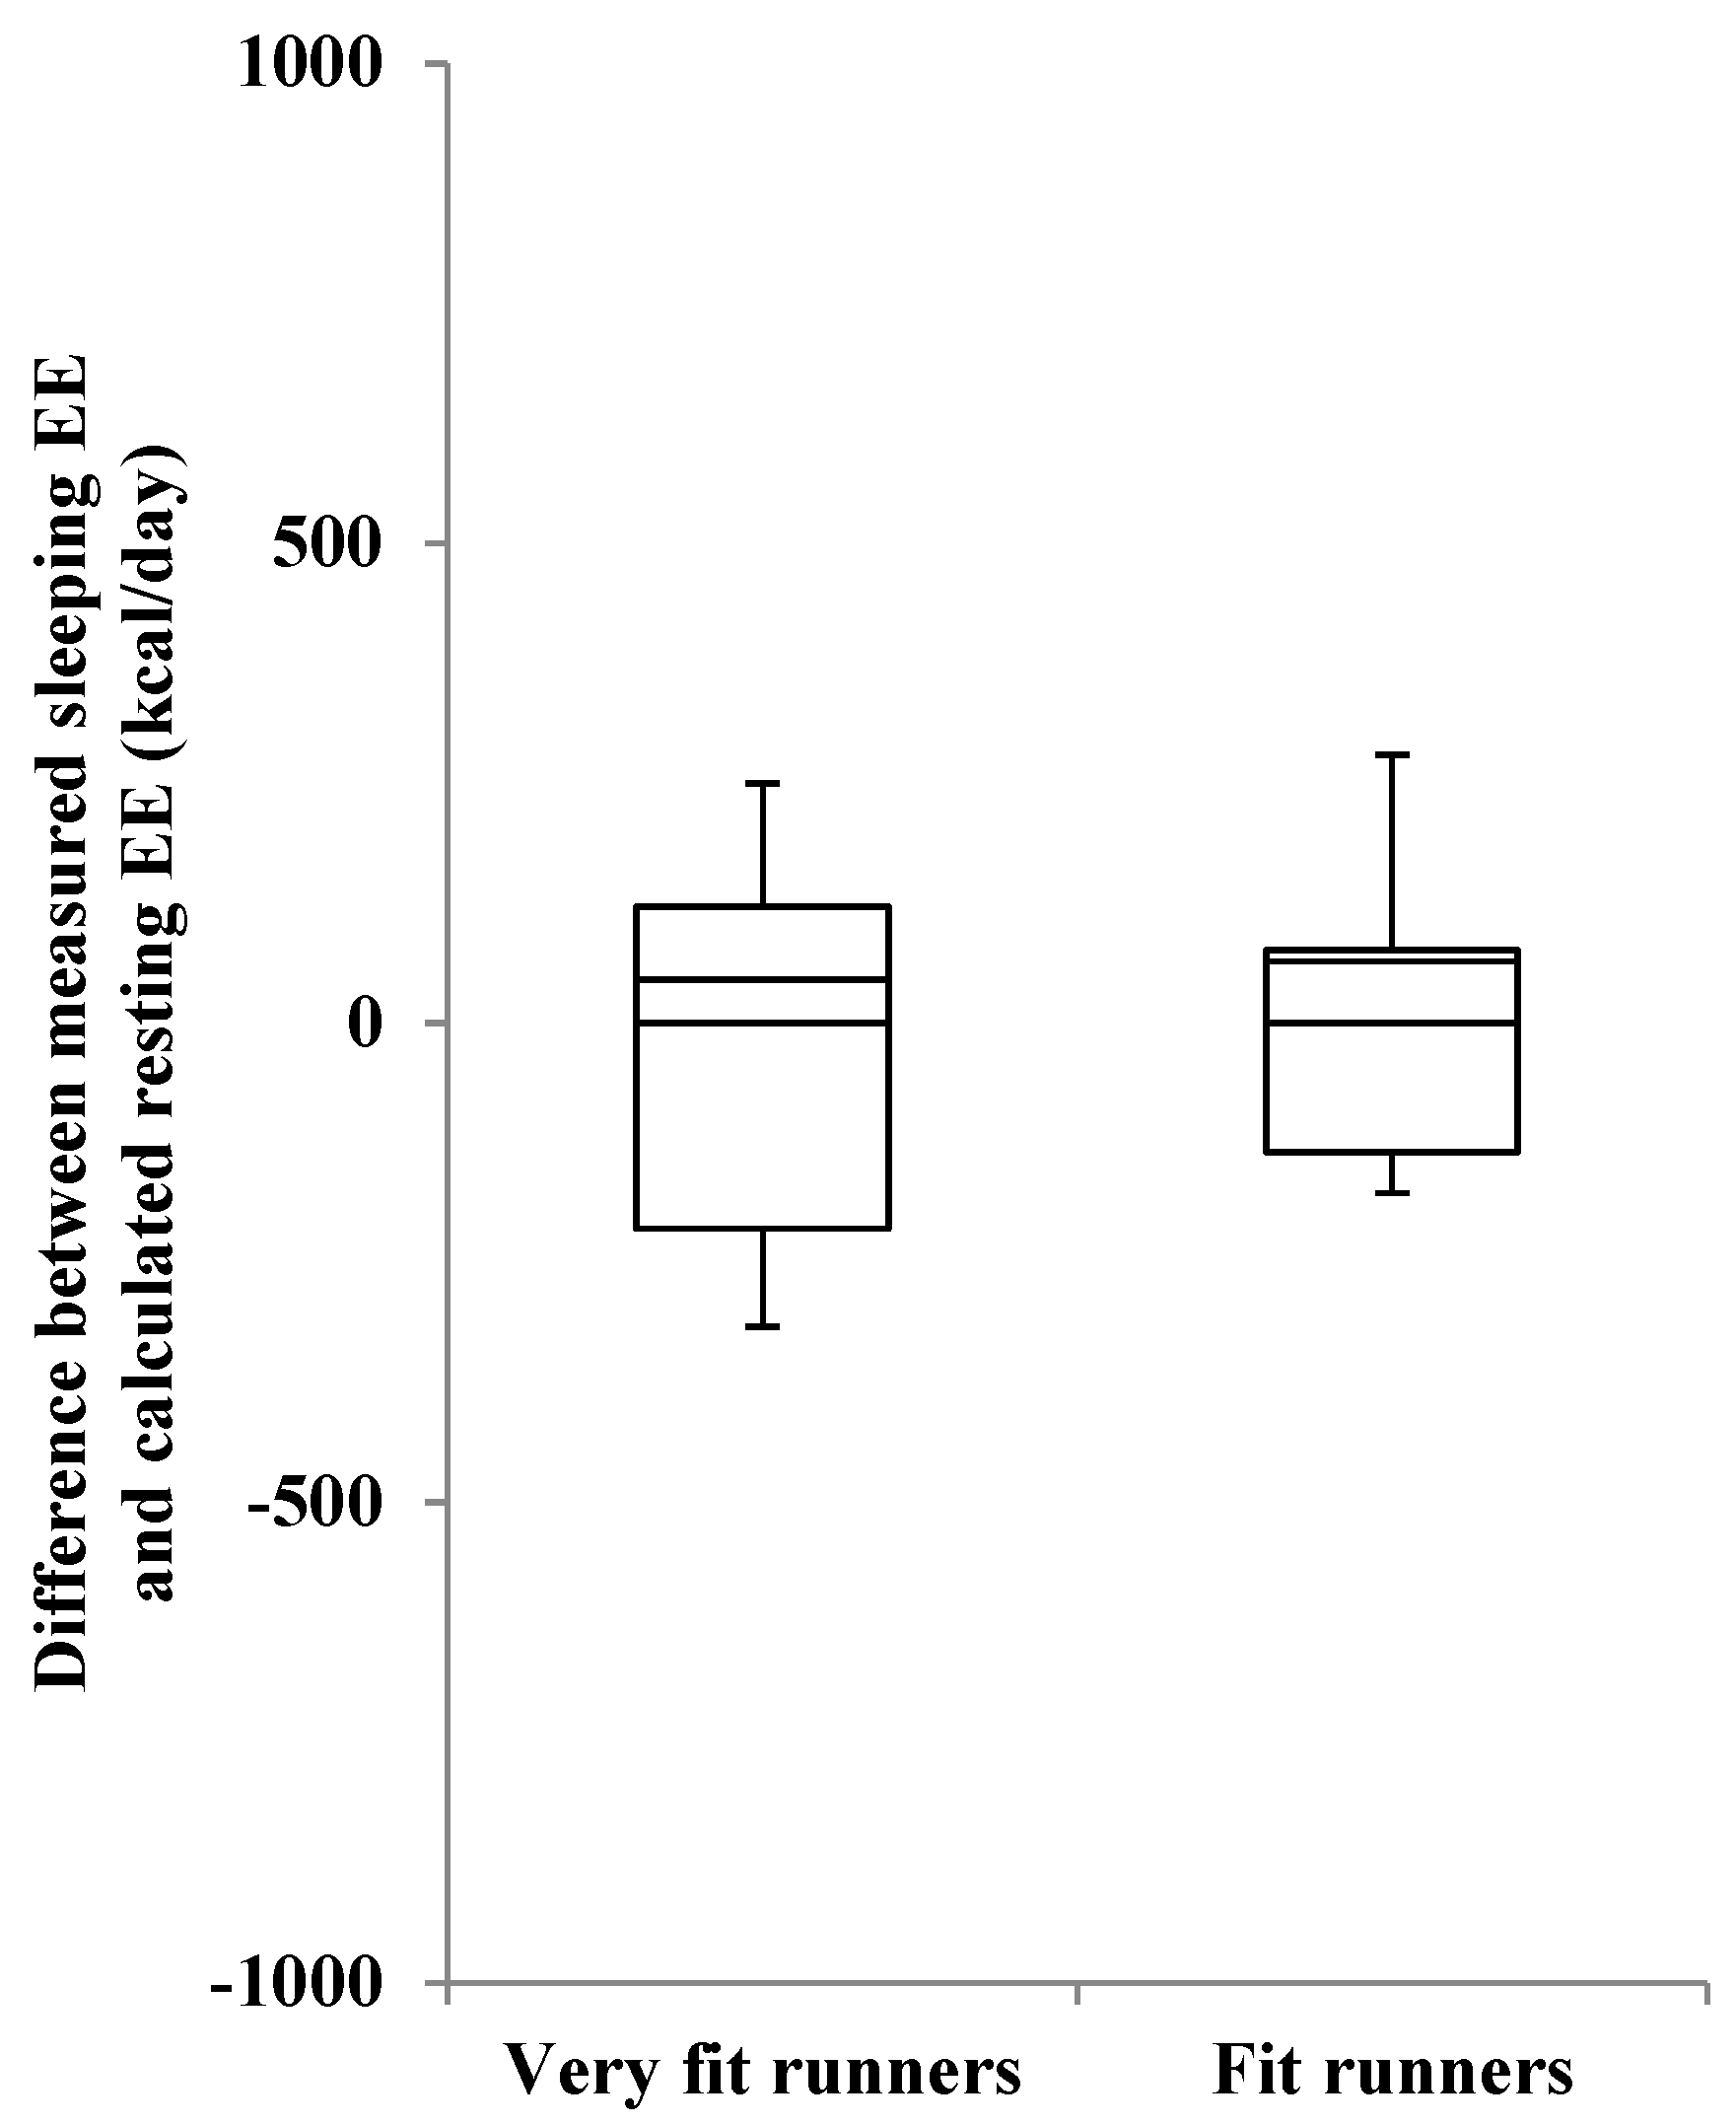
| Difference (Measured − Calculated) | −147 ± 115 | −72 ± 97 | n.s. |
| Very Fit Runners | Fit Runners | p | |
|---|---|---|---|
| n = 8 | n = 9 | ||
| TSH (μIU/mL) | 1.89 ± 0.94 | 2.02 ± 1.21 | n.s. |
| Total T3 (ng/mL) | 0.96 ± 0.94 | 1.05 ± 0.16 | n.s. |
| Free T3 (pg/mL) | 2.93 ± 0.70 | 3.15 ± 0.33 | n.s. |
| Total T4 (μg/dL) | 6.54 ± 1.10 | 7.36 ± 0.68 | n.s. |
| Free T4 (ng/dL) | 1.13 ± 0.19 | 1.33 ± 0.79 | <0.05 |
| Epinephrine (pg/mL) | 35 ± 13 | 59 ± 57 | n.s. |
| Norepinephrine (pg/mL) | 225 ± 112 | 377 ± 176 | n.s. |
© 2016 by the authors; licensee MDPI, Basel, Switzerland. This article is an open access article distributed under the terms and conditions of the Creative Commons by Attribution (CC-BY) license (http://creativecommons.org/licenses/by/4.0/).
Share and Cite
Midorikawa, T.; Tanaka, S.; Ando, T.; Tanaka, C.; Masayuki, K.; Ohta, M.; Torii, S.; Sakamoto, S. Is There a Chronic Elevation in Organ-Tissue Sleeping Metabolic Rate in Very Fit Runners? Nutrients 2016, 8, 196. https://doi.org/10.3390/nu8040196
Midorikawa T, Tanaka S, Ando T, Tanaka C, Masayuki K, Ohta M, Torii S, Sakamoto S. Is There a Chronic Elevation in Organ-Tissue Sleeping Metabolic Rate in Very Fit Runners? Nutrients. 2016; 8(4):196. https://doi.org/10.3390/nu8040196
Chicago/Turabian StyleMidorikawa, Taishi, Shigeho Tanaka, Takafumi Ando, Chiaki Tanaka, Konishi Masayuki, Megumi Ohta, Suguru Torii, and Shizuo Sakamoto. 2016. "Is There a Chronic Elevation in Organ-Tissue Sleeping Metabolic Rate in Very Fit Runners?" Nutrients 8, no. 4: 196. https://doi.org/10.3390/nu8040196