Vitamin D Intake and Status in 6-Year-Old Icelandic Children Followed up from Infancy

Abstract
:1. Introduction
2. Materials and Methods
2.1. Study Design and Subjects
2.2. Vitamin D Measurement
2.3. Covariates
2.4. Statistical Analysis
3. Results

| Variable | All Subjects (n = 139) 1 | 25(OH)D < 50 nmol/L (n = 50) | 25(OH)D ≥ 50 nmol/L (n = 89) | p-Value |
|---|---|---|---|---|
| Male gender, n (%) | 70 (50) | 22 (31) | 48 (69) | 0.26 2 |
| Female gender, n (%) | 69 (50) | 28 (41) | 41 (59) | 0.26 2 |
| Breastfeeding, month, median (25th, 75th centile) | 8 (6, 10) | 7 (4, 9) | 9 (7, 10) | 0.017 3 |
| Exclusive breastfeeding, month, median (25th, 75th centile) | 4 (2, 5) | 4 (2, 5) | 4 (3, 5) | 0.14 3 |
| Children at 6 years | ||||
| Age, year, mean ± SD | 6.1 ± 0.3 | 6.1 (0.2) | 6.2 (0.3) | 0.60 4 |
| BMI, kg/m2, median (25th, 75th centile) | 15.5 (14.8, 16.5) | 15.5 (15.0, 16.8) | 15.5 (14.7, 16.4) | 0.49 3 |
| Physical activity, h, median (25th, 75th centile) | 1.6 (1.0, 2.5) | 1.6 (1.0, 2.0) | 1.6 (1.1, 2.7) | 0.16 3 |
| Total vitamin D intake, µg/day, median (25th, 75th centile) | 5.0 (2.3, 12.1) | 3.2 (2.1, 6.6) | 7.5 (2.7, 13.7) | 0.003 3 |
| Vitamin D from food, µg/day, median (25th, 75th centile) | 2.3 (1.6, 3.3) | 2.4 (1.7, 3.0) | 2.3 (1.6, 3.4) | 0.69 3 |
| Vitamin D from supplements, µg/day, median (25th, 75th centile) | 1.5 (0.0, 10.0) | 0.0 (0.0, 4.0) | 4.7 (0.0, 10.0) | 0.002 3 |
| No vitamin D supplement use, n (%) | 63 (47) | 31 (49) | 32 (51) | 0.003 2 |
| Vitamin D supplement use < 10 µg/day, n (%) | 37 (27) | 11 (30) | 26 (70) | 0.36 2 |
| Vitamin D supplement use ≥ 10 µg/day, n (%) | 35 (26) | 6 (17) | 29 (83) | 0.007 2 |
| Blood samples in winter/spring, n (%) | 38 (27) | 21 (55) | 17 (45) | 0.004 2 |
| Blood samples in autumn, n (%) | 34 (25) | 13 (38) | 21 (62) | 0.75 2 |
| Blood samples in summer, n (%) | 67 (48) | 16 (24) | 51 (76) | 0.004 2 |
| Serum 25(OH)D, nmol/L, mean ± SD | 56.5 ± 17.9 | 39.3 ± 9.5 | 66.1 ± 13.8 | <0.001 4 |
| Serum TG, mmol/L, mean ± SD | 0.6 ± 0.2 | 0.7 ± 0.3 | 0.6 ± 0.2 | 0.26 4 |
| Serum TC, mmol/L, mean ± SD | 4.4 ± 0.6 | 4.4 ± 0.6 | 4.4 ± 0.7 | 0.57 4 |
| Serum LDL-C, mmol/L, mean ± SD | 2.5 ± 0.6 | 2.6 ± 0.5 | 2.5 ± 0.6 | 0.47 4 |
| Serum HDL-C, mmol/L, mean ± SD | 1.6 ± 0.3 | 1.6 ± 0.3 | 1.6 ± 0.3 | 0.80 4 |
| Mothers of 6 year old children | ||||
| Age, year, mean ± SD | 36.6 ± 5.0 | 36.2 ± 5.4 | 36.8 ± 4.8 | 0.50 4 |
| BMI, kg/m2, median (25th, 75th centile) | 24.4 (21.8, 27.8) | 24.8 (23.3, 28.1) | 24.4 (21.5, 27.3) | 0.16 3 |
| Primary education, n (%) | 18 (13) | 9 (50) | 9 (50) | 0.18 2 |
| Secondary education, n (%) | 31 (23) | 11 (35) | 20 (65) | 0.95 2 |
| Tertiary education, n (%) | 87 (64) | 29 (33) | 58 (67) | 0.40 2 |
| Model 1 (n = 139) | Model 2 (n = 74) | |||
|---|---|---|---|---|
| Variable | OR | 95% CI | OR | 95% CI |
| Female gender | 0.68 | 0.31–1.48 | 0.59 | 0.18–1.94 |
| Breastfeeding, month | 1.07 | 0.95–1.22 | 1.10 | 0.91–1.34 |
| Total vitamin D intake, 10 µg/day | 3.85 | 1.73–8.58 | 10.93 | 2.21–53.99 |
| Blood samples in winter/spring | reference | reference | ||
| Blood samples in autumn | 3.03 | 1.04–8.84 | 5.64 | 1.16–27.32 |
| Blood samples in summer | 5.84 | 2.12–16.07 | 8.88 | 1.83–43.23 |
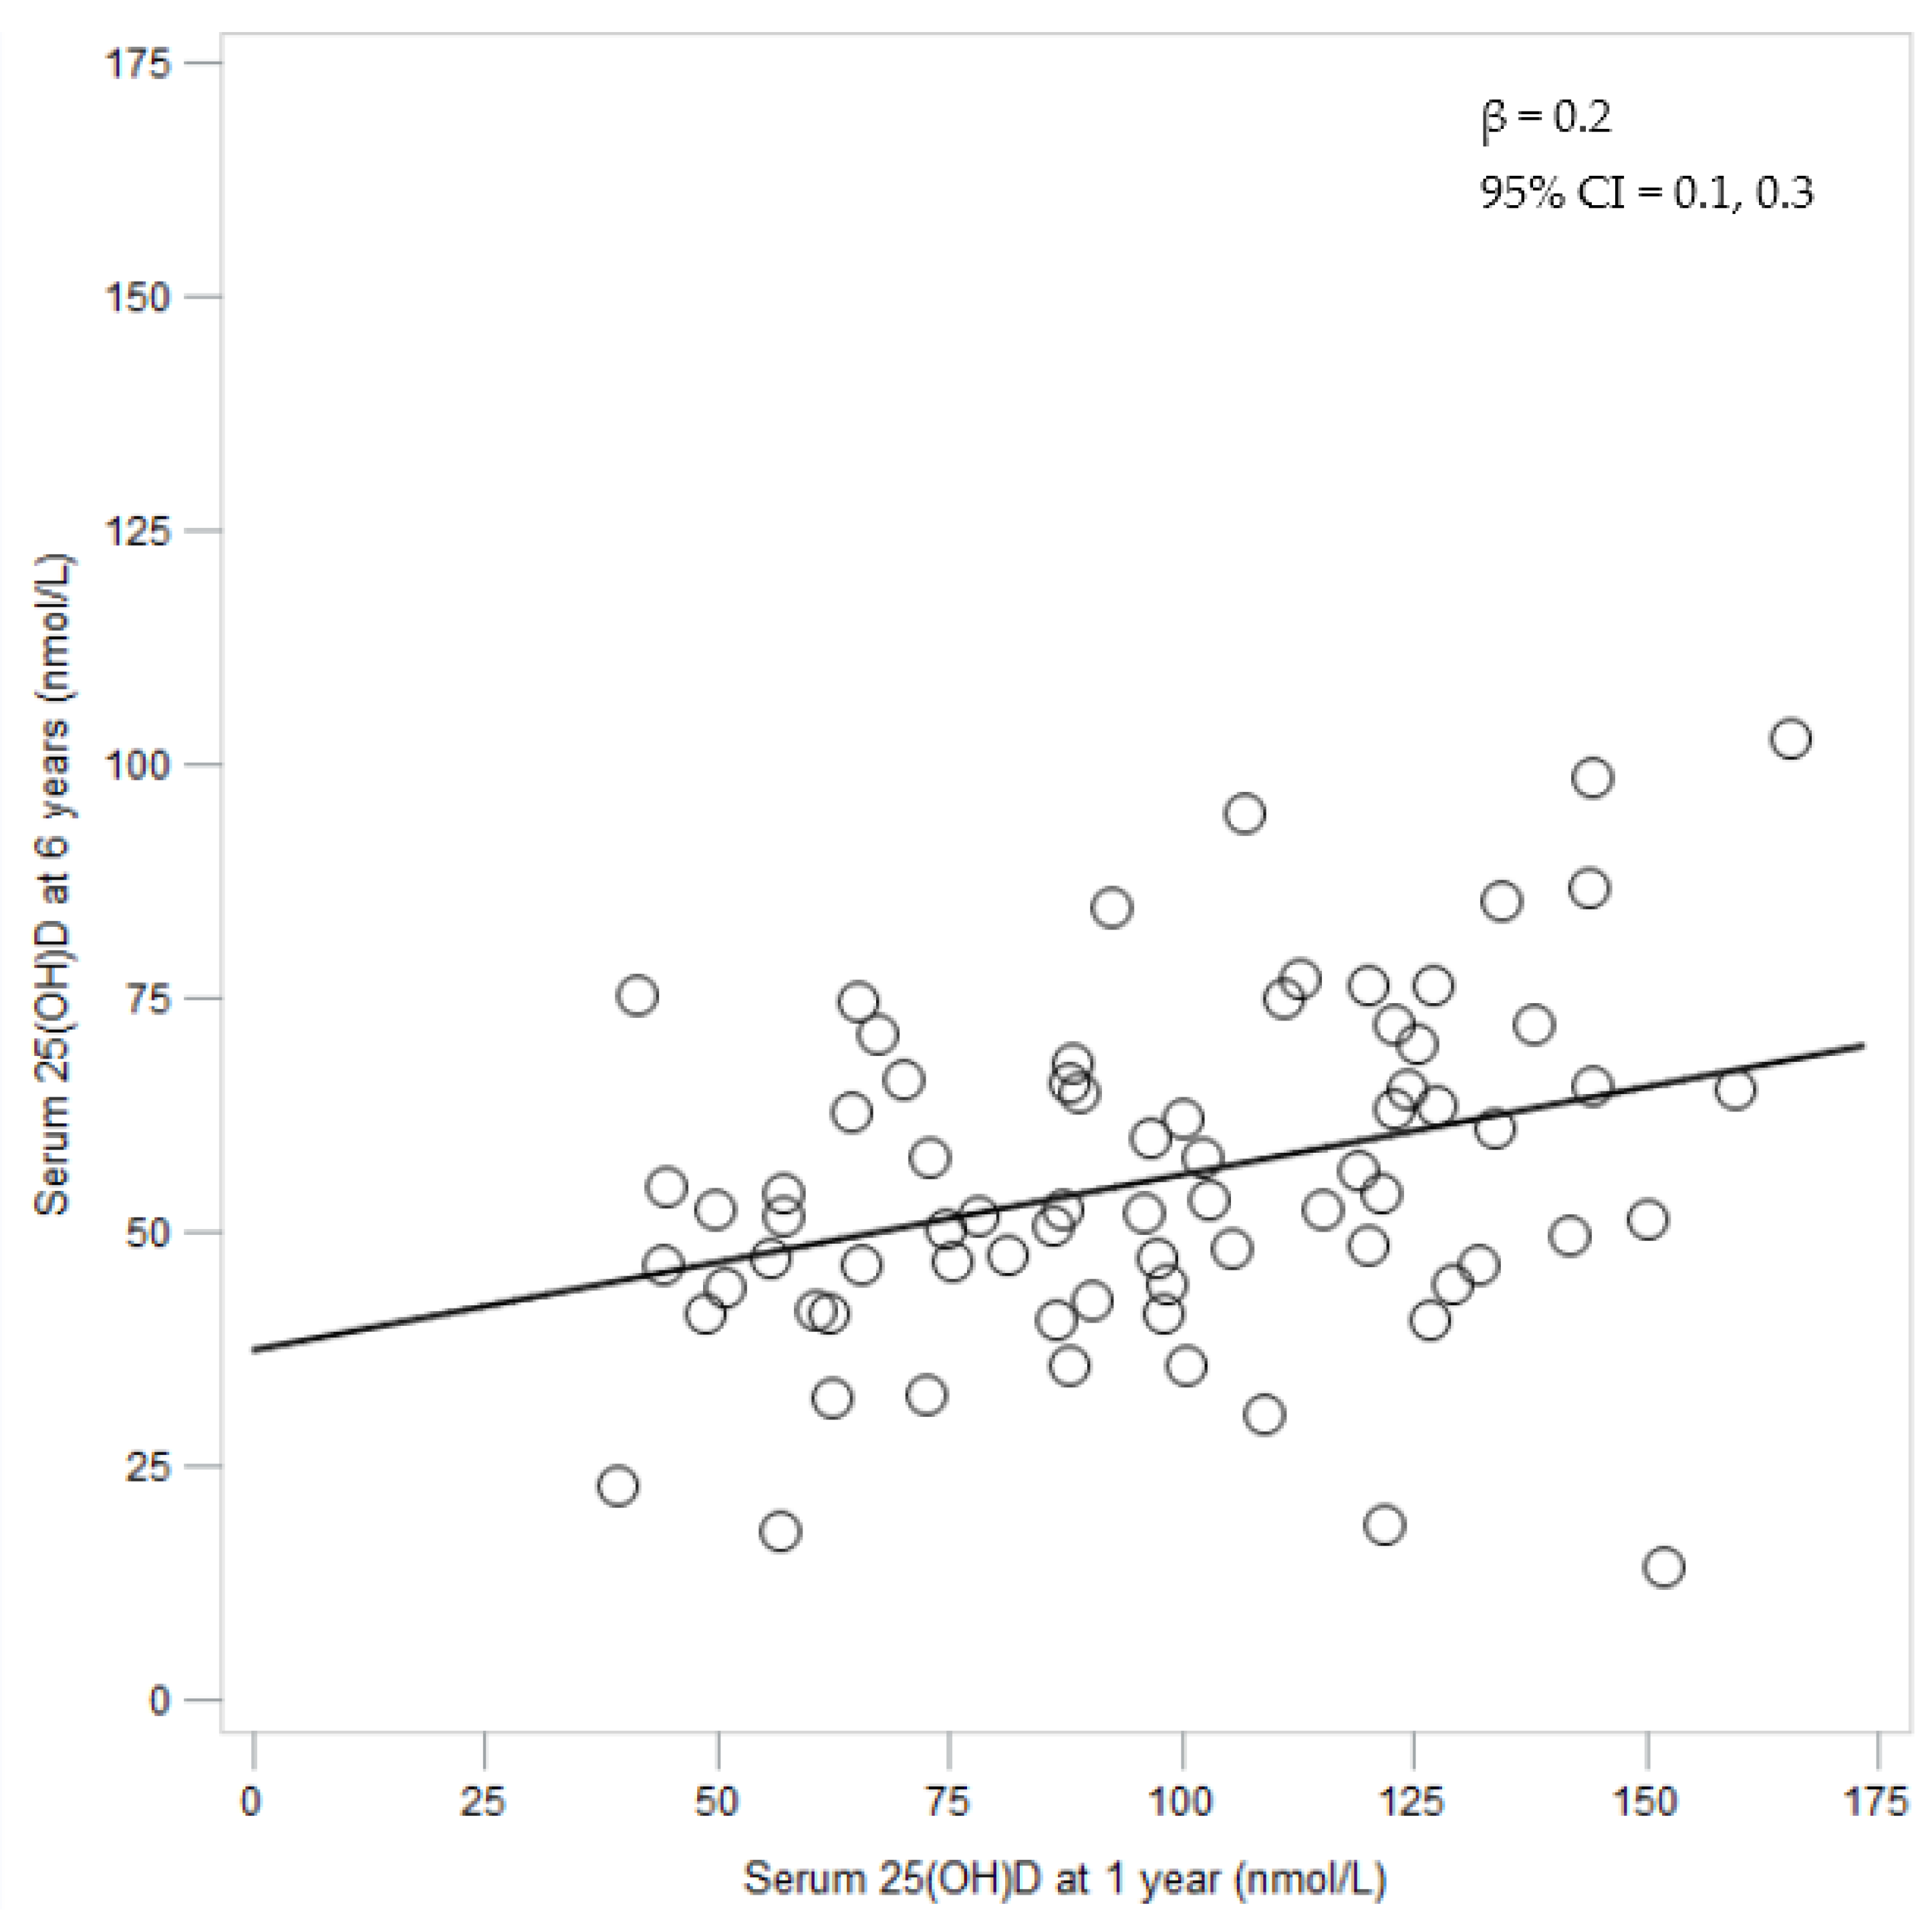
| Serum 25(OH)D at 1 year, nmol/L | 1.02 | 1.002–1.04 | ||
| Variable | Age 1 Year | Age 6 Years | Change from 1 to 6 Years |
|---|---|---|---|
| Total vitamin D intake µg/day, median (25th, 75th centile) | 6.4 (3.5, 11.6) | 4.5 (2.1, 11.0) | −0.9 (−8.1, 4.4) |
| Total vitamin D intake, µg/kg/day, median (25th, 75th centile) | 0.7 (0.3, 1.2) | 0.2 (0.1, 0.5) | −0.3 (−1.0, 0.0) |
| Serum 25(OH)D, nmol/L, mean ± SD | 97.5 ± 32.4 | 55.8 ± 17.9 | −41.6 ± 31.2 |

| Serum 25(OH)D Tertile at 6 Years | |||
|---|---|---|---|
| Serum 25(OH)D tertile at 1 year | 1, n (%) | 2, n (%) | 3, n (%) |
| 1, n (%) | 12 (48) | 9 (36) | 4 (16) |
| 2, n (%) | 8 (32) | 10 (40) | 7 (28) |
| 3, n (%) | 5 (21) | 6 (25) | 13 (54) |
4. Discussion
Acknowledgments
Author Contributions
Conflicts of Interest
References
- Cranney, A.; Horsley, T.; O’Donnell, S.; Weiler, H.; Puil, L.; Ooi, D.; Atkinson, S.; Ward, L.; Moher, D.; Hanley, D.; et al. Effectiveness and safety of vitamin D in relation to bone health. Evid. Rep. Technol. Assess. 2007, 1–235. [Google Scholar]
- Zipitis, C.S.; Akobeng, A.K. Vitamin D supplementation in early childhood and risk of type 1 diabetes: A systematic review and meta-analysis. Arch. Dis. Child. 2008, 93, 512–517. [Google Scholar] [CrossRef] [PubMed]
- Tornhammar, P.; Ueda, P.; Hult, M.; Simila, H.; Eyles, D.; Norman, M. Season of birth, neonatal vitamin D status, and cardiovascular disease risk at 35 years of age: A cohort study from Sweden. Am. J. Clin. Nutr. 2014, 99, 472–478. [Google Scholar] [CrossRef] [PubMed]
- Holick, M.F. The vitamin D deficiency pandemic and consequences for nonskeletal health: Mechanisms of action. Mol. Asp. Med. 2008, 29, 361–368. [Google Scholar] [CrossRef] [PubMed]
- Kelishadi, R.; Farajzadegan, Z.; Bahreynian, M. Association between vitamin D status and lipid profile in children and adolescents: A systematic review and meta-analysis. Int. J. Food Sci. Nutr. 2014, 65, 404–410. [Google Scholar] [CrossRef] [PubMed]
- Ganji, V.; Zhang, X.; Shaikh, N.; Tangpricha, V. Serum 25-hydroxyvitamin D concentrations are associated with prevalence of metabolic syndrome and various cardiometabolic risk factors in US children and adolescents based on assay-adjusted serum 25-hydroxyvitamin D data from NHANES 2001–2006. Am. J. Clin. Nutr. 2011, 94, 225–233. [Google Scholar] [CrossRef] [PubMed]
- Dolinsky, D.H.; Armstrong, S.; Mangarelli, C.; Kemper, A.R. The association between vitamin D and cardiometabolic risk factors in children: A systematic review. Clin. Pediatr. (Phila.) 2013, 52, 210–223. [Google Scholar] [CrossRef] [PubMed]
- Institute of Medicine. Dietary Reference Intakes for Calcium and Vitamin D; National Academy Press: Washington, DC, USA, 2011. [Google Scholar]
- DeLuca, H.F. Overview of general physiologic features and functions of vitamin D. Am. J. Clin. Nutr. 2004, 80, 1689s–1696s. [Google Scholar] [PubMed]
- Helgason, A.; Sigurdardottir, S.; Gulcher, J.R.; Ward, R.; Stefansson, K. mtDNA and the origin of the Icelanders: Deciphering signals of recent population history. Am. J. Hum. Genet. 2000, 66, 999–1016. [Google Scholar] [CrossRef] [PubMed]
- Steingrimsdottir, L.; Gunnarsson, O.; Indridason, O.S.; Franzson, L.; Sigurdsson, G. Relationship between serum parathyroid hormone levels, vitamin D sufficiency, and calcium intake. JAMA 2005, 294, 2336–2341. [Google Scholar] [CrossRef] [PubMed]
- Gunnarsson, O.; Indridason, O.S.; Franzson, L.; Halldorsdottir, E.; Sigurdsson, G. Vitamin-D homeostasis amongst adult Icelandic population. Laeknabladid 2004, 90, 29–36. (In Icelandic) [Google Scholar] [PubMed]
- Nordic Council of Ministers. Nordic Nutrition Recommendations 2012. Integrating Nutrition and Physical Activity; Nordic Council of Ministers: Copenhagen, Denmark, 2014. [Google Scholar]
- Wagner, C.L.; Greer, F.R. Prevention of rickets and vitamin D deficiency in infants, children, and adolescents. Pediatrics 2008, 122, 1142–1152. [Google Scholar] [CrossRef] [PubMed]
- Canadian Paediatric Society. Vitamin D supplementation: Recommendations for Canadian mothers and infants. Paediatr. Child Health 2007, 12, 583–598. [Google Scholar]
- Directorate of Health. Dietary Recommendations for Adults and Children from 2 Years; Directorate of Health: Reykjavik, Iceland, 2014. (In Icelandic) [Google Scholar]
- Thorisdottir, B.; Gunnarsdottir, I.; Steingrimsdottir, L.; Palsson, G.I.; Thorsdottir, I. Vitamin D intake and status in 12-month-old infants at 63–66 degrees N. Nutrients 2014, 6, 1182–1193. [Google Scholar] [CrossRef] [PubMed] [Green Version]
- Bjarnadottir, A.; Kristjansdottir, A.G.; Hrafnkelsson, H.; Johannsson, E.; Magnusson, K.T.; Thorsdottir, I. Insufficient autumn vitamin D intake and low vitamin D status in 7-year-old Icelandic children. Public Health Nutr. 2015, 18, 208–217. [Google Scholar] [CrossRef] [PubMed]
- Nielsen, A.; Michaelsen, K.F.; Holm, L. Parental concerns about complementary feeding: Differences according to interviews with mothers with children of 7 and 13 months of age. Eur. J. Clin. Nutr. 2013, 67, 1157–1162. [Google Scholar] [CrossRef] [PubMed]
- Kyttala, P.; Erkkola, M.; Kronberg-Kippila, C.; Tapanainen, H.; Veijola, R.; Simell, O.; Knip, M.; Virtanen, S.M. Food consumption and nutrient intake in Finnish 1–6-year-old children. Public Health Nutr. 2010, 13, 947–956. [Google Scholar] [CrossRef] [PubMed]
- Thorsdottir, I.; Gunnarsdottir, I. Vitamin D in nutrition of young Icelandic children. Laeknabladid 2005, 91, 581–586. (In Icelandic) [Google Scholar] [PubMed]
- Hintzpeter, B.; Scheidt-Nave, C.; Muller, M.J.; Schenk, L.; Mensink, G.B. Higher prevalence of vitamin D deficiency is associated with immigrant background among children and adolescents in Germany. J. Nutr. 2008, 138, 1482–1490. [Google Scholar] [PubMed]
- Makinen, M.; Simell, V.; Mykkanen, J.; Ilonen, J.; Veijola, R.; Hyoty, H.; Knip, M.; Simell, O.; Toppari, J.; Hermann, R. An increase in serum 25-hydroxyvitamin D concentrations preceded a plateau in type 1 diabetes incidence in Finnish children. J. Clin. Endocrinol. Metab. 2014, 99, E2353–E2356. [Google Scholar] [CrossRef] [PubMed]
- Mansbach, J.M.; Ginde, A.A.; Camargo, C.A., Jr. Serum 25-hydroxyvitamin D levels among US children aged 1 to 11 years: Do children need more vitamin D? Pediatrics 2009, 124, 1404–1410. [Google Scholar] [CrossRef] [PubMed]
- Thorisdottir, A.V.; Thorsdottir, I.; Palsson, G.I. Nutrition and iron status of 1-year olds following a revision in infant dietary recommendations. Anemia 2011, 2011, 986303. [Google Scholar] [CrossRef] [PubMed]
- Thorisdottir, A.V.; Gunnarsdottir, I.; Palsson, G.I.; Gretarsson, S.J.; Thorsdottir, I. Iron status and developmental scores in 6-year-olds highlights ongoing need to tackle iron deficiency in infants. Acta Pediatr. 2013, 102, 914–919. [Google Scholar] [CrossRef] [PubMed]
- Holick, M.F.; Binkley, N.C.; Bischoff-Ferrari, H.A.; Gordon, C.M.; Hanley, D.A.; Heaney, R.P.; Murad, M.H.; Weaver, C.M. Evaluation, treatment, and prevention of vitamin D deficiency: An endocrine society clinical practice guideline. J. Clin. Endocrinol. Metab. 2011, 96, 1911–1930. [Google Scholar] [CrossRef] [PubMed]
- Rockell, J.E.; Green, T.J.; Skeaff, C.M.; Whiting, S.J.; Taylor, R.W.; Williams, S.M.; Parnell, W.R.; Scragg, R.; Wilson, N.; Schaaf, D.; et al. Season and ethnicity are determinants of serum 25-hydroxyvitamin D concentrations in New Zealand children aged 5–14 years. J. Nutr. 2005, 135, 2602–2608. [Google Scholar] [PubMed]
- Madsen, K.H.; Rasmussen, L.B.; Mejborn, H.; Andersen, E.W.; Molgaard, C.; Nissen, J.; Tetens, I.; Andersen, R. Vitamin D status and its determinants in children and adults among families in late summer in Denmark. Br. J. Nutr. 2014, 112, 776–784. [Google Scholar] [CrossRef] [PubMed] [Green Version]
- Voortman, T.; van den Hooven, E.H.; Heijboer, A.C.; Hofman, A.; Jaddoe, V.W.; Franco, O.H. Vitamin D deficiency in school-age children is associated with sociodemographic and lifestyle factors. J. Nutr. 2015, 145, 791–798. [Google Scholar] [CrossRef] [PubMed]
- Friedewald, W.T.; Levy, R.I.; Fredrickson, D.S. Estimation of the concentration of low-density lipoprotein cholesterol in plasma, without use of the preparative ultracentrifuge. Clin. Chem. 1972, 18, 499–502. [Google Scholar] [PubMed]
- Jorde, R.; Sneve, M.; Hutchinson, M.; Emaus, N.; Figenschau, Y.; Grimnes, G. Tracking of serum 25-hydroxyvitamin D levels during 14 years in a population-based study and during 12 months in an intervention study. Am. J. Epidemiol. 2010, 171, 903–908. [Google Scholar] [CrossRef] [PubMed]
- Twisk, J.W. The problem of evaluating the magnitude of tracking coefficients. Eur. J. Epidemiol. 2003, 18, 1025–1026. [Google Scholar] [CrossRef] [PubMed]
- Ohlund, I.; Hernell, O.; Hornell, A.; Lind, T. Serum lipid and apolipoprotein levels in 4-year-old children are associated with parental levels and track over time. Eur. J. Clin. Nutr. 2011, 65, 463–469. [Google Scholar] [CrossRef] [PubMed]
- WHO Scientific Group on the Prevention and Management of Osteoporosis. Prevention and Management of Osteoporosis: Report of a WHO Scientific Group; World Health Organization: Geneva, Switzerland, 2003. [Google Scholar]
- Misra, M.; Pacaud, D.; Petryk, A.; Collett-Solberg, P.F.; Kappy, M. Vitamin D deficiency in children and its management: Review of current knowledge and recommendations. Pediatrics 2008, 122, 398–417. [Google Scholar] [CrossRef] [PubMed]
- Pludowski, P.; Socha, P.; Karczmarewicz, E.; Zagorecka, E.; Lukaszkiewicz, J.; Stolarczyk, A.; Piotrowska-Jastrzebska, J.; Kryskiewicz, E.; Lorenc, R.S.; Socha, J. Vitamin D supplementation and status in infants: A prospective cohort observational study. J. Pediatr. Gastroenterol. Nutr. 2011, 53, 93–99. [Google Scholar] [CrossRef] [PubMed]
- Zittermann, A.; Ernst, J.B.; Gummert, J.F.; Borgermann, J. Vitamin D supplementation, body weight and human serum 25-hydroxyvitamin D response: A systematic review. Eur. J. Clin. Nutr. 2014, 53, 367–374. [Google Scholar] [CrossRef] [PubMed]
- Weng, F.L.; Shults, J.; Leonard, M.B.; Stallings, V.A.; Zemel, B.S. Risk factors for low serum 25-hydroxyvitamin D concentrations in otherwise healthy children and adolescents. Am. J. Clin. Nutr. 2007, 86, 150–158. [Google Scholar] [PubMed]
- Janssen, M.J.; Wielders, J.P.; Bekker, C.C.; Boesten, L.S.; Buijs, M.M.; Heijboer, A.C.; van der Horst, F.A.; Loupatty, F.J.; van den Ouweland, J.M. Multicenter comparison study of current methods to measure 25-hydroxyvitamin D in serum. Steroids 2012, 77, 1366–1372. [Google Scholar] [CrossRef] [PubMed]
- Singh, R.J.; Taylor, R.L.; Reddy, G.S.; Grebe, S.K. C-3 epimers can account for a significant proportion of total circulating 25-hydroxyvitamin D in infants, complicating accurate measurement and interpretation of vitamin D status. J. Clin. Endocrinol. Metab. 2006, 91, 3055–3061. [Google Scholar] [CrossRef] [PubMed]
- Stepman, H.C.; Vanderroost, A.; Stockl, D.; Thienpont, L.M. Full-scan mass spectral evidence for 3-epi-25-hydroxyvitamin D3 in serum of infants and adults. Clin. Chem. Lab. Med. 2011, 49, 253–256. [Google Scholar] [CrossRef] [PubMed]
- Cashman, K.D.; Fitzgerald, A.P.; Kiely, M.; Seamans, K.M. A systematic review and meta-regression analysis of the vitamin D intake-serum 25-hydroxyvitamin D relationship to inform European recommendations. Br. J. Nutr. 2011, 106, 1638–1648. [Google Scholar] [CrossRef] [PubMed]
- Black, L.J.; Seamans, K.M.; Cashman, K.D.; Kiely, M. An updated systematic review and meta-analysis of the efficacy of vitamin D food fortification. J. Nutr. 2012, 142, 1102–1108. [Google Scholar] [CrossRef] [PubMed]
- Holick, M.F. Vitamin D deficiency. New Engl. J. Med. 2007, 357, 266–281. [Google Scholar] [CrossRef] [PubMed]
- Ohlund, I.; Silfverdal, S.A.; Hernell, O.; Lind, T. Serum 25-hydroxyvitamin D levels in preschool-age children in northern Sweden are inadequate after summer and diminish further during winter. J. Pediatr. Gastroenterol. Nutr. 2013, 56, 551–555. [Google Scholar] [CrossRef] [PubMed]
- Touvier, M.; Deschasaux, M.; Montourcy, M.; Sutton, A.; Charnaux, N.; Kesse-Guyot, E.; Assmann, K.E.; Fezeu, L.; Latino-Martel, P.; Druesne-Pecollo, N.; et al. Determinants of vitamin D status in Caucasian adults: Influence of sun exposure, dietary intake, sociodemographic, lifestyle, anthropometric, and genetic factors. J. Invest. Dermatol. 2015, 135, 378–388. [Google Scholar] [CrossRef] [PubMed]
- Kuhn, T.; Kaaks, R.; Teucher, B.; Hirche, F.; Dierkes, J.; Weikert, C.; Katzke, V.; Boeing, H.; Stangl, G.I.; Buijsse, B. Dietary, lifestyle, and genetic determinants of vitamin D status: A cross-sectional analysis from the European Prospective Investigation into Cancer and Nutrition (EPIC)-Germany study. Eur. J. Nutr. 2014, 53, 731–741. [Google Scholar] [CrossRef] [PubMed]
- Thorisdottir, A.V.; Gunnarsdottir, I.; Thorsdottir, I. Revised infant dietary recommendations: The impact of maternal education and other parental factors on adherence rates in Iceland. Acta Paediatr. 2013, 102, 143–148. [Google Scholar] [CrossRef] [PubMed]
- Thorisdottir, B.; Gunnarsdottir, I.; Thorisdottir, A.V.; Palsson, G.I.; Halldorsson, T.I.; Thorsdottir, I. Nutrient intake in infancy and body mass index at six years in two population-based cohorts recruited before and after revision of infant dietary recommendations. Ann. Nutr. Metab. 2013, 63, 145–151. [Google Scholar] [CrossRef] [PubMed]
- Erkkola, M.; Kyttala, P.; Takkinen, H.M.; Kronberg-Kippila, C.; Nevalainen, J.; Simell, O.; Ilonen, J.; Veijola, R.; Knip, M.; Virtanen, S.M. Nutrient intake variability and number of days needed to assess intake in preschool children. Br. J. Nutr. 2011, 106, 130–140. [Google Scholar] [CrossRef] [PubMed]
- Holick, M.F. Environmental factors that influence the cutaneous production of vitamin D. Am. J. Clin. Nutr. 1995, 61, 638s–645s. [Google Scholar] [PubMed]
© 2016 by the authors; licensee MDPI, Basel, Switzerland. This article is an open access article distributed under the terms and conditions of the Creative Commons by Attribution (CC-BY) license (http://creativecommons.org/licenses/by/4.0/).
Share and Cite
Thorisdottir, B.; Gunnarsdottir, I.; Steingrimsdottir, L.; Palsson, G.I.; Birgisdottir, B.E.; Thorsdottir, I. Vitamin D Intake and Status in 6-Year-Old Icelandic Children Followed up from Infancy. Nutrients 2016, 8, 75. https://doi.org/10.3390/nu8020075
Thorisdottir B, Gunnarsdottir I, Steingrimsdottir L, Palsson GI, Birgisdottir BE, Thorsdottir I. Vitamin D Intake and Status in 6-Year-Old Icelandic Children Followed up from Infancy. Nutrients. 2016; 8(2):75. https://doi.org/10.3390/nu8020075
Chicago/Turabian StyleThorisdottir, Birna, Ingibjorg Gunnarsdottir, Laufey Steingrimsdottir, Gestur I. Palsson, Bryndis E. Birgisdottir, and Inga Thorsdottir. 2016. "Vitamin D Intake and Status in 6-Year-Old Icelandic Children Followed up from Infancy" Nutrients 8, no. 2: 75. https://doi.org/10.3390/nu8020075