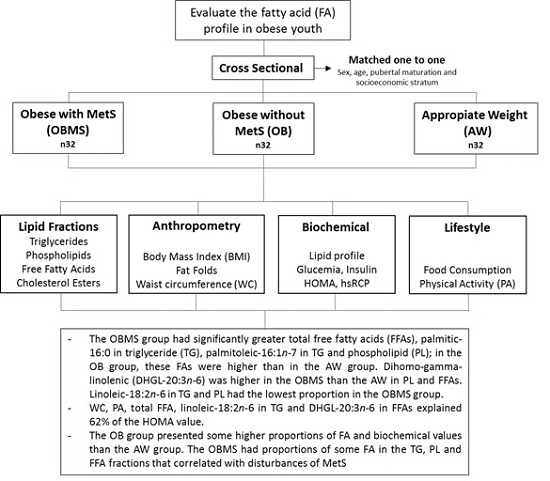
Profile of Free Fatty Acids and Fractions of Phospholipids, Cholesterol Esters and Triglycerides in Serum of Obese Youth with and without Metabolic Syndrome

Abstract
: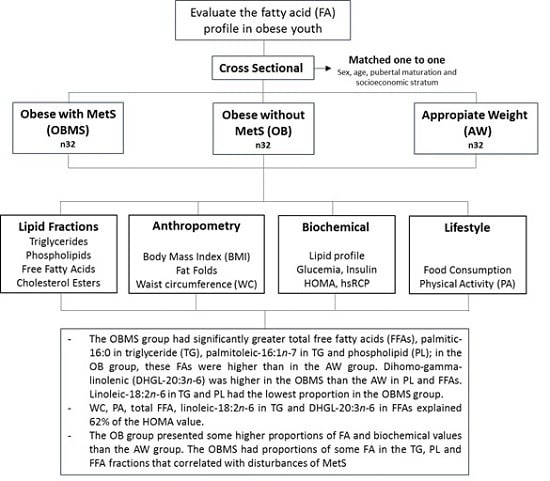
1. Introduction
2. Materials and Methods
3. Results

| OBMS n = 32 | OB n = 32 | AW n = 32 | p *,† | ||
|---|---|---|---|---|---|
| Age (Me, IQR) | 13.9 (4.8) | 14.2 (4.1) | 14.0 (4.2) | 0.93 * | |
| Gender (%) | Boys | 56.3 | 56.3 | 56.3 | 1.00 † |
| Girls | 43.8 | 43.8 | 43.8 | ||
| Pubertal Maturation (%) | Prepubescent | 12.5 | 12.5 | 12.5 | 0.99 † |
| Pubescent | 25.0 | 21.9 | 25.0 | ||
| Post-pubescent | 62.5 | 65.6 | 62.5 | ||
| Socioeconomic Stratum (%) | Low | 53.1 | 53.1 | 50.0 | 0.84 † |
| Medium | 37.5 | 31.3 | 38.5 | ||
| High | 9.4 | 15.6 | 11.5 | ||
| OBMS n = 32 | OB n = 32 | AW n = 32 | p *,† | |
|---|---|---|---|---|
| Anthropometric | ||||
| BMI kg/m2 | 31.1 ± 5.0 a, 2 | 27.1 ± 2.9 b | 20.2 ± 2.3 c | <0.001 * |
| Waist circumference cm | 91.2 ± 10.9 a | 80.5 ± 5.6 b | 67.6 ± 5.4 c | <0.001 * |
| Subscapular fold mm | 29.9 ± 10.9 a | 25.5 ± 8.1 a | 11.5 ± 3.5 b | <0.001 * |
| Triceps fold mm | 25.2 ± 6.7 a | 23.6 ± 6.2 a | 12.9 ± 4.1 b | <0.001 * |
| % fat | 38.1 (18.7) a | 34.7 (15.8) a | 22.2 (14.2) b | <0.001 † |
| Biochemical | ||||
| Blood glucose mg/dL | 90.3 ± 8.2 a | 83.7 ± 7.5 b | 83.3 ± 6.9 b | <0.001 * |
| Insulin mU/L | 25.7 (12.4) a | 11.5 (7.8) b | 7.1(4.1) c | <0.001 † |
| HOMA | 3.2 (1.7) a | 1.5 (1.0) b | 0.9(0.5) c | <0.001 † |
| Cholesterol (mg/dL) | 192.6 ± 50.3 a | 172.3 ± 34.5 | 162.1 ± 27.9 b | <0.001 * |
| Triglycerides (mg/dL) | 162 (94) a | 92 (37) b | 71 (32) c | <0.001 † |
| HDL-C (mg/dL) | 38 (6) a | 45 (15) b | 54 (15) c | <0.001 † |
| LDL-C (mg/dL) | 99 (61) a | 88 (37) a | 79 (31) b | <0.001 † |
| hsCRP (mg/dL) | 1.7 (2.9) a | 0.9 (2.5) a | 0.4 (0.7) b | <0.001 † |
| Nutrient consumption/day | ||||
| Kilocalories | 2238 (436) a | 2007 (264) a | 2442 (229) b | <0.001 † |
| Total fat (g) | 79.5 (14.6) a | 70.3 (12.5) b | 96.9 (44.0) c | <0.001 † |
| Saturated fat (g) | 31.3 (9.2) | 28.5 (8.3) a | 36.4 (20.1) b | 0.015 † |
| Monounsaturated fat (g) | 26.7 (5.1) a | 25.5 (3.5) a | 30.0 (1.7) b | <0.001 † |
| Polyunsaturated fat (g) | 16.3 (1.6) a | 15.4 (1.5) b | 15.7 (1.8) c | 0.004 † |
| Total carbohydrates (g) | 294 (50) a | 276 (57) a | 329 (36) b | <0.001 † |
| Complex carbohydrates (g) | 232 (58) a | 222 (51) a | 263 (28) b | <0.001 † |
| Fiber (g) | 14 ± 2 a | 14 ± 3 a | 16 ± 1 b | 0.001 * |
| Physical activity | ||||
| METs/day | 61.5 (15.4) | 61.1 (10.0) | 62.8 (14.7) | 0.88 † |
| MVPA Blocks | 1.3 (3.60) | 1.3 (2.3) | 1.0 (2.5) | 0.317 † |
| VPA Blocks | 0.1 (1.0) | 0.3 (1.0) | 0.0 (1.3) | 0.991 † |
| Hours of TV/day | 3.6 ± 1.7 | 3.8 ± 2.7 | 3.3 ± 3.1 | 0.57 * |
| Triglycerides | ||||
|---|---|---|---|---|
| FA (% Total FA) | OBMS | OB | AW | p *,† |
| n = 32 | n = 32 | n = 32 | ||
| SFA sum | 38.3 (7.1) a, 2 | 34.6 (8.9) b | 30.8 (7.6) c | <0.001 † |
| Palmitic-16:0 | 29.7 ± 4.0 a | 26.4 ± 3.7 b | 23.6 ± 3.3 c | <0.001 * |
| Stearic-18:0 | 6.2 (3.8) | 7.4 (4.1) | 7.2 (3.8) | 0.42 † |
| MUFA sum | 36.1 ± 5.2 a | 33.5 ± 5.0 | 31.7 ± 5.0 b | 0.003 * |
| Palmitoleic-16:1n-7 3 | 4.5 (2.0) a | 4.1 (1.4) a | 3.0 (1.6) b | 0.009 † |
| Oleic-18:1n-9 | 32.1 ± 4.3 | 30.7 ± 3.9 | 30.1 ± 4.3 | 0.14 * |
| PUFA sum | - | - | - | - |
| Linoleic-18:2n-6 | 25.6 ± 5.8 a | 32.2 ± 6.3 b | 36.4 ± 7.5 c | <0.001 † |
| Phospholipids | ||||
| SFA sum | 52.8 (11.3) a | 54.1 (11.3) | 56.4 (5.9) b | 0.017 † |
| Palmitic-16:0 | 30.6 ± 3.4 a | 31.7 ± 3.0 | 33.2 ± 3.0 b | 0.006 * |
| Stearic-18:0 | 19.8 (4.9) | 20.1 (6.0) | 21.2 (2.1) | 0.34 † |
| Behenic-22:0 | 0.5 (0.2) a | 0.6 (0.2) b,c | 0.8 (0.2) b,c | 0.015 † |
| MUFA sum | 17.5 (7.3) a | 15.1 (8.3) b,c | 13.8 (3.5) b,c | <0.001 † |
| Palmitoleic-16:1n-7 4 | 0.9 (0.4) a | 0.8 (0.2) b | 0.5 (0.2) c | <0.001 † |
| Oleic-18:1n-9 | 16.7 (7.3) a | 14.1 (8.1) b,c | 13.5 (3.4) b,c | <0.001 † |
| PUFA sum | 30.0 (4.8) | 31.1 (3.8) | 29.9 (4.1) | 0.74 † |
| Linoleic-18:2n-6 | 18.0 ± 2.2 a | 19.2 ± 2.6 a | 21.0 ± 2.8 b | <0.001 * |
| DHGL-20:3n-6 | 2.8 ± 0.7 a | 2.5 ± 0.4 | 2.1 ± 0.5 b | <0.001 * |
| Eicosatrienoic-20:3n-3 5 | 8.2 ± 2.2 | 7.7 ± 2.0 | 5.6 ± 2.7 | 0.063 * |
| Arachidonic-20:4n6 | 5.0 (1.2) | 5.3 (1.5) | 4.8 (2.3) | 0.77 * |
| Cholesterol Esters | ||||
| SFA sum | 35.7 (15.5) | 35.1 (16.0) | 35.7 (13.2) | 0.92 † |
| Palmitic-16:0 | 33.2 ± 7.7 | 31.0 ± 7.1 | 31.2 ± 5.2 | 0.35 * |
| Stearic-18:0 6 | 10.4 (12.1) | 11.3 (7.0) | 12.3 (9.3) | 0.96 † |
| MUFA sum | - | - | - | - |
| Oleic-18:1n-9 | 28.4 (4.1) | 26.3 (8.2) | 26.2 (5.7) | 0.44 † |
| PUFA sum | - | - | - | - |
| Linoleic-18:2n-6 | 35.9 ± 9.5 | 34.5 ± 10.7 | 35.2 ± 10.4 | 0.84 * |
| Free Fatty Acids | ||||
| SFA sum | 44.7 (4.1) | 46.1 (6.4) | 43.2 (6.7) | 0.59 † |
| Myristic-14:0 | 1.1 (0.2) | 1.4 (0.1) | 1.1 (0.5) | 0.47 * |
| Palmitic-16:0 | 30.0 (2.4) | 30.0 (3.7) | 30.8 (4.5) | 0.93 † |
| Stearic-18:0 | 14.4 (2.2) | 15.4 (2.7) | 14.5 (3.4) | 0.45 † |
| MUFA sum | 20.9 (4.1) | 19.1 (4.6) | 19.1 (5.6) | 0.22 † |
| Palmitoleic-16:1n-7 7 | 1.7 (0.7) | 1.7 (0.5) | 1.5 (0.6) | 0.46 † |
| Oleic-18:1n-9 | 19.3 (4.0) | 17.9 (3.3) | 18.4 (3.4) | 0.31 † |
| PUFA sum | 33.5 (3.4) | 34.0 (4.1) | 34.4 (4.9) | 0.68 † |
| Linoleic-18:2n-6 | 21.7 (3.3) | 22.6 (3.3) | 24.5 (5.3) | 0.14 † |
| DHGL-20:3n-6 | 3.0 ± 0.6 a | 2.8 ± 0.6 | 2.4 ± 2.5 b | <0.001 * |
| Arachidonic-20:4n6 | 6.6 (1.1) | 6.5 (3.1) | 5.8 (2.0) | 0.25 † |
| DHA-22:6n-3 | 1.9 ± 0.4 | 1.9 ± 0.5 | 1.8 ± 0.5 | 0.51 * |
| Total FFA (mg/dL) | 199.5 (40.0) a | 100.8 (24.1) b | 98.8 (29.9) b | 0.014 † |
| Ratio of Fatty Acids | OBSM | OB | AW | p *,† |
|---|---|---|---|---|
| n = 32 | n = 32 | n = 32 | ||
| Triglycerides | ||||
| 16:1/16:0 3 | 0.1 (0.1) a, 2 | 0.1 (0.2) | 0.1 (0.1) b | 0.005 † |
| 18:1/18:0 | 5.1 ± 1.9 | 4.4 ± 1.9 | 4.4 ± 1.8 | 0.30 † |
| Phospholipids | ||||
| 16:1n-7/16:0 4 | 0.03 (0.01) a | 0.02 (0.01) b | 0.01 (0.01) c | <0.001 † |
| 18:1n-9/18:0 | 0.8 (0.7) a | 0.7 (0.7) | 0.6 (0.2) b | <0.001 † |
| 20:3n-6/18:2n-6 | 0.2 (0.1) a | 0.1 (0.0) b | 0.1 (0.0) c | <0.001 † |
| 20:4n6/20:3n6 | 1.9 (0.7) | 2.0 (1.2) | 2.3 (1.4) | 0,059 † |
| Cholesterol Esters | ||||
| 18:1n-9/18:0 5 | 2.3 (2.6) | 2.4 (1.7) | 2.1 (1.6) | 0.94 * |
| Free Fatty Acids | ||||
| 16:1/16:0 6 | 0.5 (0.0) | 0.6 (0.0) | 0.5 (0.0) | 0.57 † |
| 18:1n-9/18:0 | 1.3 (0.4) | 1.2 (0.4) | 1.3 (0.4) | 0.47 † |
| 20:3n-6/18:2n-6 | 0.1 ± 0.0 a | 0.1 ± 0.0 a | 0.1 ± 0.0 b | <0.001 * |
| 20:4n6/20:3n6 | 2.2 (0.8) | 2.3 (0.8) | 2.5 (1.5) | 0.22 † |
| Variables | β * | β † | IC † | p † | IFV † |
|---|---|---|---|---|---|
| Waist circumference | 1.025 | 1.025 | 0.008; 0.015 | 0.000 | 1.543 |
| Average METs/d | −1.018 | −1.018 | −0.012; −0.003 | 0.001 | 1.278 |
| Linoleic-18:2n-6 in TG | −1.016 | −1.016 | −0.013; −0.001 | 0.024 | 1.606 |
| DHGL-20:3n-6 in FFA | 1.276 | 1.258 | 0.028; 0.172 | 0.007 | 1.767 |
| Total FFA in mg/dL | 1.004 | 1.004 | 0.000; 0.003 | 0.028 | 1.379 |
4. Discussion
5. Conclusions
Supplementary Materials
Acknowledgments
Author Contributions
Conflicts of Interest
Abbreviations
| ARA | arachidonic acid |
| AW | appropriate weight |
| BMI | Body Mass Index |
| CE | cholesterol ester |
| HDL-C | high-density lipoprotein |
| LDL-C | low-density lipoprotein |
| DHA | docosahexaenoic acid |
| DHGL | dihomo-γ-linolenic acid |
| DM | diabetes mellitus |
| FA | fatty acid |
| FFA | free fatty acid |
| HOMA | Homeostasis Model Assessment |
| hsCRP | high-sensitivity C-reactive protein |
| HT | hypertension |
| IR | insulin resistance |
| MET | Metabolic equivalent |
| MetS | metabolic syndrome |
| MUFA | monounsaturated fatty acid |
| MVPA | moderate to vigorous physical activity |
| OBMS | obese with metabolic syndrome |
| OB | obese |
| PA | physical activity |
| PL | phospholipid |
| PUFA | polyunsaturated fatty acid |
| SFA | saturated fatty acid |
| TG | triglyceride |
| VLDL | very-low-density lipoprotein |
| VPA | vigorous physical activity |
| WC | waist circumference |
References
- World Health Organization. Global Status Report on Noncommunicable Diseases; Publisher: World Health Organization (WHO), Geneve, Switzerland, 2011. [Google Scholar]
- Ng, M.; Fleming, T.; Robinson, M.; Thomson, B.; Graetz, N.; Margono, C.; Mullany, E.C. Global, regional, and national prevalence of overweight and obesity in children and adults during 1980–2013: A systematic analysis for the Global Burden of Disease Study 2013. Lancet 2014, 384, 766–781. [Google Scholar] [CrossRef]
- Rivera, J.Á.; de Cossío, T.G.; Pedraza, L.S.; Aburto, T.C.; Sánchez, T.G.; Martorell, R. Childhood and adolescent overweight and obesity in Latin America: A systematic review. Lancet. Diabetes Endocrinol. 2014, 2, 321–332. [Google Scholar] [CrossRef]
- Eckel, R.H.; Grundy, S.M.; Zimmet, P.Z. The metabolic syndrome. Lancet 2005, 365, 1415–1428. [Google Scholar] [CrossRef]
- Lafontan, M. Adipose tissue and adipocyte dysregulation. Diabetes Metab. 2014, 40, 16–28. [Google Scholar] [CrossRef] [PubMed]
- Shulman, G.I. Ectopic fat in insulin resistance, dyslipidemia, and cardiometabolic disease. N. Engl. J. Med. 2014, 371, 1131–1141. [Google Scholar] [CrossRef] [PubMed]
- Tarantino, G. Spleen: A new role for an old player? World J. Gastroenterol. 2011, 17, 3776–3784. [Google Scholar] [CrossRef] [PubMed]
- Takahashi, Y.; Fukusato, T.; Inui, A.; Fujisawa, T. Nonalcoholic fatty liver disease and nonalcoholic steatohepatitis. Nihon Rinsho 2012, 70, 1827–1834. [Google Scholar] [CrossRef] [PubMed]
- Aguilera, C.M.; Gil-Campos, M.; Cañete, R.; Gil, A. Alterations in plasma and tissue lipids associated with obesity and metabolic syndrome. Clin. Sci. 2008, 114, 183–193. [Google Scholar] [CrossRef] [PubMed]
- Steffen, L.M.; Vessby, B.; Jacobs, D.R.; Steinberger, J.; Moran, A.; Hong, C.-P.; Sinaiko, A.R. Serum phospholipid and cholesteryl ester fatty acids and estimated desaturase activities are related to overweight and cardiovascular risk factors in adolescents. Int. J. Obes. 2008, 32, 1297–1304. [Google Scholar] [CrossRef] [PubMed]
- Okada, T.; Furuhashi, N.; Kuromori, Y.; Miyashita, M.; Iwata, F.; Harada, K. Plasma palmitoleic acid content and obesity in children. Am. J. Clin. Nutr. 2005, 82, 747–750. [Google Scholar] [PubMed]
- Warensjö, E.; Ohrvall, M.; Vessby, B. Fatty acid composition and estimated desaturase activities are associated with obesity and lifestyle variables in men and women. Nutr. Metab. Cardiovasc. Dis. 2006, 16, 128–136. [Google Scholar] [CrossRef] [PubMed]
- Warensjö, E.; Risérus, U.; Vessby, B. Fatty acid composition of serum lipids predicts the development of the metabolic syndrome in men. Diabetologia 2005, 48, 1999–2005. [Google Scholar] [CrossRef] [PubMed]
- Paillard, F.; Catheline, D.; Duff, F.; le Bouriel, M.; Deugnier, Y.; Pouchard, M.; Daubert, J.-C.; Legrand, P. Plasma palmitoleic acid, a product of stearoyl-coA desaturase activity, is an independent marker of triglyceridemia and abdominal adiposity. Nutr. Metab. Cardiovasc. Dis. 2008, 18, 436–440. [Google Scholar] [CrossRef] [PubMed]
- Warensjö, E.; Sundström, J.; Lind, L.; Vessby, B. Factor analysis of fatty acids in serum lipids as a measure of dietary fat quality in relation to the metabolic syndrome in men. Am. J. Clin. Nutr. 2006, 84, 442–448. [Google Scholar] [PubMed]
- Araya, J.; Rodrigo, R.; Pettinelli, P.; Araya, A.V.; Poniachik, J.; Videla, L.A. Decreased liver fatty acid delta-6 and delta-5 desaturase activity in obese patients. Obesity 2010, 18, 1460–1463. [Google Scholar] [CrossRef] [PubMed]
- Nikolaidis, M.G.; Mougios, V. Effects of Exercise on the Fatty-Acid Composition of Blood and Tissue Lipids. Sport Med. 2004, 34, 1051–1076. [Google Scholar] [CrossRef]
- Hodson, L.; Skeaff, C.M.; Fielding, B.A. Fatty acid composition of adipose tissue and blood in humans and its use as a biomarker of dietary intake. Prog. Lipid Res. 2008, 47, 348–380. [Google Scholar] [CrossRef] [PubMed]
- Kotronen, A.; Velagapudi, V.; Yetukuri, L.; Westerbacka, J.; Bergholm, R.; Ekroos, K.; Makkonen, J.; Taskinen, M.-R.; Oresic, M.; Yki-Järvinen, H. Serum saturated fatty acids containing triacylglycerols are better markers of insulin resistance than total serum triacylglycerol concentrations. Diabetologia 2009, 52, 684–690. [Google Scholar] [CrossRef] [PubMed]
- Kishino, T.; Watanabe, K.; Urata, T.; Takano, M.; Uemura, T.; Nishikawa, K.; Mine, Y.; Matsumoto, M.; Ohtsuka, K.; Ohnishi, H.; et al. Visceral fat thickness in overweight men correlates with alterations in serum fatty acid composition. Clin. Chim. Acta 2008, 398, 57–62. [Google Scholar] [CrossRef] [PubMed]
- Agudelo, G.; Velásquez, C.; Bedoya, G.; Estrada, A.; Manjarrés, L.M.; Patiño, F. Variations in the prevalence of metabolic syndrome in adolescents according to different criteria used for diagnosis: which definition should be chosen for this age group? Metab. Syndr. Relat. Disord. 2014, 12, 202–209. [Google Scholar] [CrossRef] [PubMed]
- Klein-platat, C.; Drai, J.; Oujaa, M.; Schlienger, J.; Simon, C. Plasma fatty acid composition is associated with the metabolic syndrome and low-grade inflammation in overweight adolescents. Am. J. Clin. Nutr. 2005, 82, 1178–1184. [Google Scholar] [PubMed]
- Gil-Campos, M.; del Carmen Ramírez-Tortosa, M.; Larqué, E.; Linde, J.; Aguilera, C.M.; Cañete, R.; Gil, A. Metabolic syndrome affects fatty acid composition of plasma lipids in obese prepubertal children. Lipids 2008, 43, 723–732. [Google Scholar] [CrossRef] [PubMed]
- Decsi, T.; Csábi, G.; Török, K.; Erhardt, É.; Minda, H.; Burus, I.; Molnár, S.; Molnár, D. Polyunsaturated Fatty Acids in Plasma Lipids of Obese Children With and Without Metabolic Cardiovascular Syndrome. Lipids 2000, 35, 1179–1184. [Google Scholar] [CrossRef] [PubMed]
- Elizondo, L.; Serrano, M.; Ugalde, P.; Cuello, C.; Borbolla, J. Plasma phospholipid fatty acids in obese male and female Mexican children. Ann. Nutr. Metab. 2010, 57, 234–241. [Google Scholar] [CrossRef] [PubMed]
- De Onis, M.; Onyango, A.W.; Borghi, E.; Siyam, A.; Siekmann, J. Development of a WHO growth reference for school-aged children and adolescents. Bull. World Health Organ. 2007, 85, 660–667. [Google Scholar] [CrossRef] [PubMed]
- Ford, E.S.; Li, C.; Cook, S.; Choi, H.K. Serum concentrations of uric acid and the metabolic syndrome among US children and adolescents. Circulation 2007, 115, 2526–2532. [Google Scholar] [CrossRef] [PubMed]
- Lohman, T.; Roche, A.; Martorell, F. Anthropometric standardization reference manual.; Human Kinetics Books: Champaign, IL, USA, 1988. [Google Scholar]
- Fernandez, J.; Redden, D.; Pietrobelli, A.; Allison, D. Waist circumference percentiles in nationally representative samples of African-American, European-American, and Mexican-American children and adolescents. J. Pediatr. 2004, 145, 439–444. [Google Scholar] [CrossRef] [PubMed]
- Food and Nutrition Board; Institute of Medicine. Dietary Reference Intakes. Application in Dietary Assessment; National Academy Press: Washington DC, 2000. [Google Scholar]
- Manjarrés, L. Métodos para precisar la recolección de la ingesta dietética en estudios poblacionales. Perspect. Nutr. Humana 2007, 9, 155–163. [Google Scholar]
- Manjarrés, L.; Manjarrés, S. Programa de Evaluación de Ingesta Dietética EVINDI v4; Colombia Universidad de Antioquia. Escuela de Nutrición y Dietética: Medellín, Colombia, 2008. [Google Scholar]
- Pate, R.R.; Ross, R.; Trost, S.G.; Sirard, J.R.; Dowda, M. Validation of a 3-Day Physical Activity Recall Instrument in Female Youth Recall Instrument in Female Youth. Pediatr. Exerc. Sci. 2003, 15, 257–265. [Google Scholar]
- Dowda, M.; Saunders, R.; Hastings, L.; Gay, J.; Evans, A. Physical activity and sedentary pursuits of children living in residential children’s homes. J. Phys. Act. Health 2009, 6, 195–202. [Google Scholar] [PubMed]
- Ainsworth, B.E.; Haskell, W.L.; Whitt, M.C.; Irwin, M.L.; Swartz, A.N.N.M.; Strath, S.J.; Brien, W.L.O.; Bassett, D.R.; Schmitz, K.H.; Emplaincourt, P.O.; et al. Compendium of Physical Activities: An MET intensities. Med. Sci. Sport. Exerc. 2000, 32, S498–S504. [Google Scholar] [CrossRef]
- Gomez, L.F.; Parra, D.C.; Lobelo, F.; Samper, B.; Moreno, J.; Jacoby, E.; Lucumi, D.I.; Matsudo, S.; Borda, C. Television viewing and its association with overweight in Colombian children: results from the 2005 National Nutrition Survey: A cross sectional study. Int. J. Behav. Nutr. Phys. Act. 2007, 4. [Google Scholar] [CrossRef] [PubMed]
- Marshall, W.; Tanner, J. Variations in pattern of pubertal changes in girls. Arch. Dis. Child. 1969, 44, 291–303. [Google Scholar] [CrossRef] [PubMed]
- Marshall, W.; Tanner, J. Variations in the pattern of pubertal changes in boys. Arch. Dis. Child. 1970, 45, 13–23. [Google Scholar] [CrossRef] [PubMed]
- National High Blood Pressure Education Program Working Group on High Blood Pressure in Children and Adolescents The fourth report on the diagnosis, evaluation, and treatment of high blood pressure in children and adolescents. Pediatrics 2004, 114, 555–577.
- National Cholesterol Education Program Third Report of the National Cholesterol Education Program (NCEP) Expert Panel on Detection, Evaluation, and Treatment of High Blood Cholesterol in Adults (Adult Treatment Panel III) final report. Circulation 2002, 106, 3143–3421.
- Lee, J.M.; Okumura, M.J.; Davis, M.M.; Herman, W.H.; Gurney, J.G. Prevalence and determinants of insulin resistance among U.S. adolescents: a population-based study. Diabetes Care 2006, 29, 2427–2432. [Google Scholar] [CrossRef] [PubMed]
- Yin, J.; Li, M.; Xu, L.; Wang, Y.; Cheng, H.; Zhao, X.; Mi, J. Insulin resistance determined by Homeostasis Model Assessment (HOMA) and associations with metabolic syndrome among Chinese children and teenagers. Diabetol. Metab. Syndr. 2013, 5, 71. [Google Scholar] [CrossRef] [PubMed]
- Myers, G.L.; Rifai, N.; Tracy, R.P.; Roberts, W.L.; Alexander, R.W.; Biasucci, L.M.; Catravas, J.D.; Cole, T.G.; Cooper, G.R.; Khan, B.V.; et al. CDC/AHA Workshop on Markers of Inflammation and Cardiovascular Disease: Application to Clinical and Public Health Practice: report from the laboratory science discussion group. Circulation 2004, 110, e545–e549. [Google Scholar] [CrossRef] [PubMed]
- Folch, J.; Lees, M.; Stannley, S. A simple method for the isolation and purification of total lipid from animal tissues. J. Biol. Chem. 1957, 226, 497–509. [Google Scholar] [PubMed]
- Agren, J.; Julkunen, A.; Penttila, I. Rapid separation of serum lipids for fatty acid analysis by a single aminopropyl column. J. Lipid Res. 1992, 33, 1871–1876. [Google Scholar] [PubMed]
- Kaluzny, M.; Duncan, L.; Merrit, M.; Epps, D. Rapid separation of lipid classes in high yield and purity using bonded phase columns. J. Lipid Res. 1985, 26, 135–140. [Google Scholar] [PubMed]
- Kang, J.X.; Wang, J. A simplified method for analysis of polyunsaturated fatty acids. BMC Biochem. 2005, 6, 5. [Google Scholar] [CrossRef] [PubMed] [Green Version]
- Ntambi, J. Regulation of stearoyl-CoA desaturases and role in metabolism. Prog. Lipid Res. 2004, 43, 91–104. [Google Scholar] [CrossRef]
- Zong, G.; Zhu, J.; Sun, L.; Ye, X.; Lu, L.; Jin, Q.; Zheng, H.; Yu, Z.; Zhu, Z.; Li, H.; Sun, Q.; Lin, X. Associations of erythrocyte fatty acids in the de novo lipogenesis pathway with risk of metabolic syndrome in a cohort study of middle-aged and older Chinese. Am. J. Clin. Nutr. 2013, 98, 319–326. [Google Scholar] [CrossRef] [PubMed]
- Nakamura, M.T.; Nara, T.Y. Structure, function, and dietary regulation of delta6, delta5, and delta9 desaturases. Annu. Rev. Nutr. 2004, 24, 345–376. [Google Scholar] [CrossRef] [PubMed]
- Tremblay, A.J.; Després, J.-P.; Piché, M.-È.; Nadeau, A.; Bergeron, J.; Alméras, N.; Tremblay, A.; Lemieux, S. Associations between the fatty acid content of triglyceride, visceral adipose tissue accumulation, and components of the insulin resistance syndrome. Metabolism 2004, 53, 310–317. [Google Scholar] [CrossRef] [PubMed]
- Kurotani, K.; Sato, M.; Ejima, Y.; Nanri, A.; Yi, S.; Pham, N.M.; Akter, S.; Poudel-Tandukar, K.; Kimura, Y.; Imaizumi, K.; Mizoue, T. High levels of stearic acid, palmitoleic acid, and dihomo-γ-linolenic acid and low levels of linoleic acid in serum cholesterol ester are associated with high insulin resistance. Nutr. Res. 2012, 32, 669–675. [Google Scholar] [CrossRef] [PubMed]
- Roke, K.; Ralston, J.C.; Abdelmagid, S.; Nielsen, D.E.; Badawi, A.; El-Sohemy, A.; Ma, D.W.L.; Mutch, D.M. Variation in the FADS1/2 gene cluster alters plasma n-6 PUFA and is weakly associated with hsCRP levels in healthy young adults. Prostaglandins Leukot. Essent. Fatty Acids 2013, 89, 257–263. [Google Scholar] [CrossRef] [PubMed]
- Sabin, M.A.; de Hora, M.; Holly, J.M.; Hunt, L.P.; Ford, A.L.; Williams, S.R.; Baker, J.S.; Retallick, C.J.; Crowne, E.C.; Shield, J.P.H. Fasting nonesterified fatty acid profiles in childhood and their relationship with adiposity, insulin sensitivity, and lipid levels. Pediatrics 2007, 120, e1426–e1433. [Google Scholar] [CrossRef] [PubMed]
- Reinehr, T.; Kiess, W.; Andler, W. Insulin sensitivity indices of glucose and free fatty acid metabolism in obese children and adolescents in relation to serum lipids. Metabolism 2005, 54, 397–402. [Google Scholar] [CrossRef] [PubMed]
- Deng, J.; Liu, S.; Zou, L.; Xu, C.; Geng, B.; Xu, G. Lipolysis response to endoplasmic reticulum stress in adipose cells. J. Biol. Chem. 2012, 287, 6240–6249. [Google Scholar] [CrossRef] [PubMed]
- Finelli, C.; Tarantino, G. Is there any consensus as to what diet or lifestyle approach is the right one for NAFLD patients? J. Gastrointest. Liver Dis. 2012, 21, 293–302. [Google Scholar]
- Telford, R.D.; Cunningham, R.B.; Telford, R.M.; Riley, M.; Abhayaratna, W.P. Determinants of childhood adiposity: evidence from the Australian LOOK study. PLoS ONE 2012, 7, e50014. [Google Scholar] [CrossRef] [PubMed]
- Martín-Calvo, N.; Ochoa, M.C.; Marti, A.; Martínez-González, M.Á. Asociación entre los macronutrientes de la dieta y la obesidad en la infancia y adolescencia; un estudio de casos y controles. Nutr. Hosp. 2013, 28, 1515–1522. [Google Scholar] [PubMed]
© 2016 by the authors; licensee MDPI, Basel, Switzerland. This article is an open access article distributed under the terms and conditions of the Creative Commons by Attribution (CC-BY) license (http://creativecommons.org/licenses/by/4.0/).
Share and Cite
Bermúdez-Cardona, J.; Velásquez-Rodríguez, C. Profile of Free Fatty Acids and Fractions of Phospholipids, Cholesterol Esters and Triglycerides in Serum of Obese Youth with and without Metabolic Syndrome. Nutrients 2016, 8, 54. https://doi.org/10.3390/nu8020054
Bermúdez-Cardona J, Velásquez-Rodríguez C. Profile of Free Fatty Acids and Fractions of Phospholipids, Cholesterol Esters and Triglycerides in Serum of Obese Youth with and without Metabolic Syndrome. Nutrients. 2016; 8(2):54. https://doi.org/10.3390/nu8020054
Chicago/Turabian StyleBermúdez-Cardona, Juliana, and Claudia Velásquez-Rodríguez. 2016. "Profile of Free Fatty Acids and Fractions of Phospholipids, Cholesterol Esters and Triglycerides in Serum of Obese Youth with and without Metabolic Syndrome" Nutrients 8, no. 2: 54. https://doi.org/10.3390/nu8020054