Changes in Meat/Poultry/Fish Consumption in Australia: From 1995 to 2011–2012


Abstract
:1. Introduction
2. Materials and Methods
2.1. The Surveys
2.2. Meat/Poultry/Fish Disaggregation
2.3. Categorisation of Meats
2.4. Statistical Analysis
3. Results
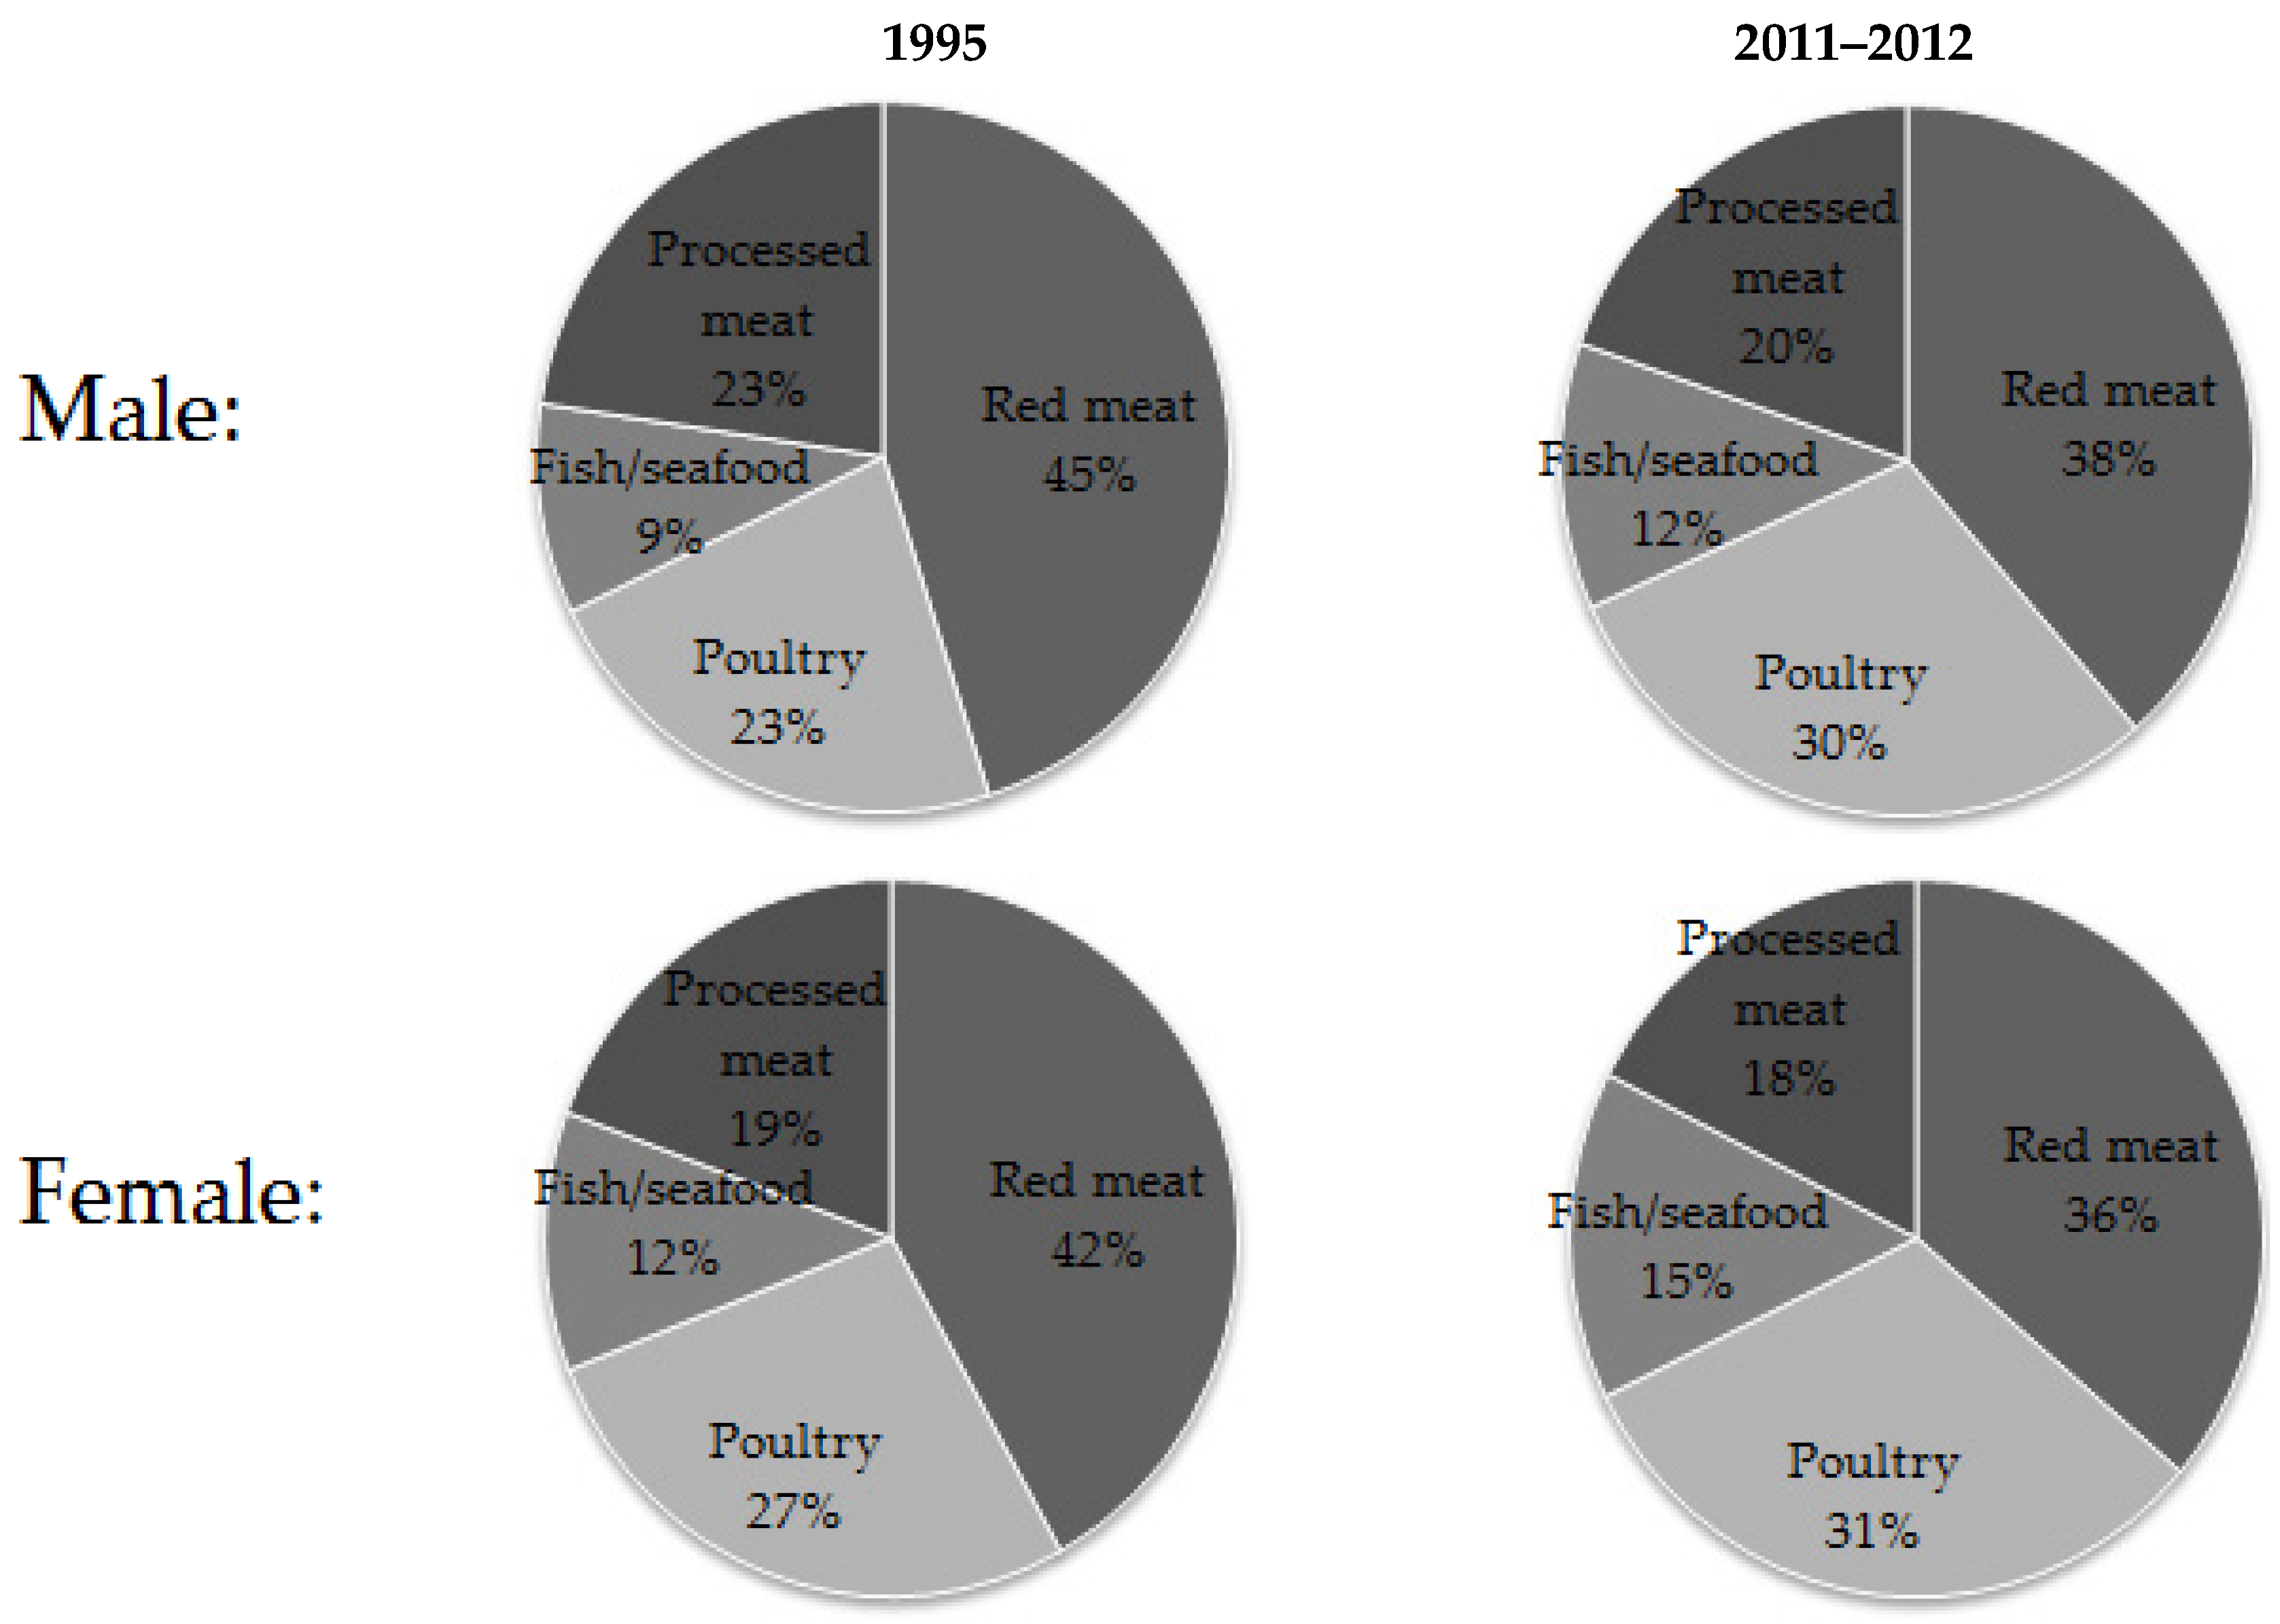
3.1. Proportion
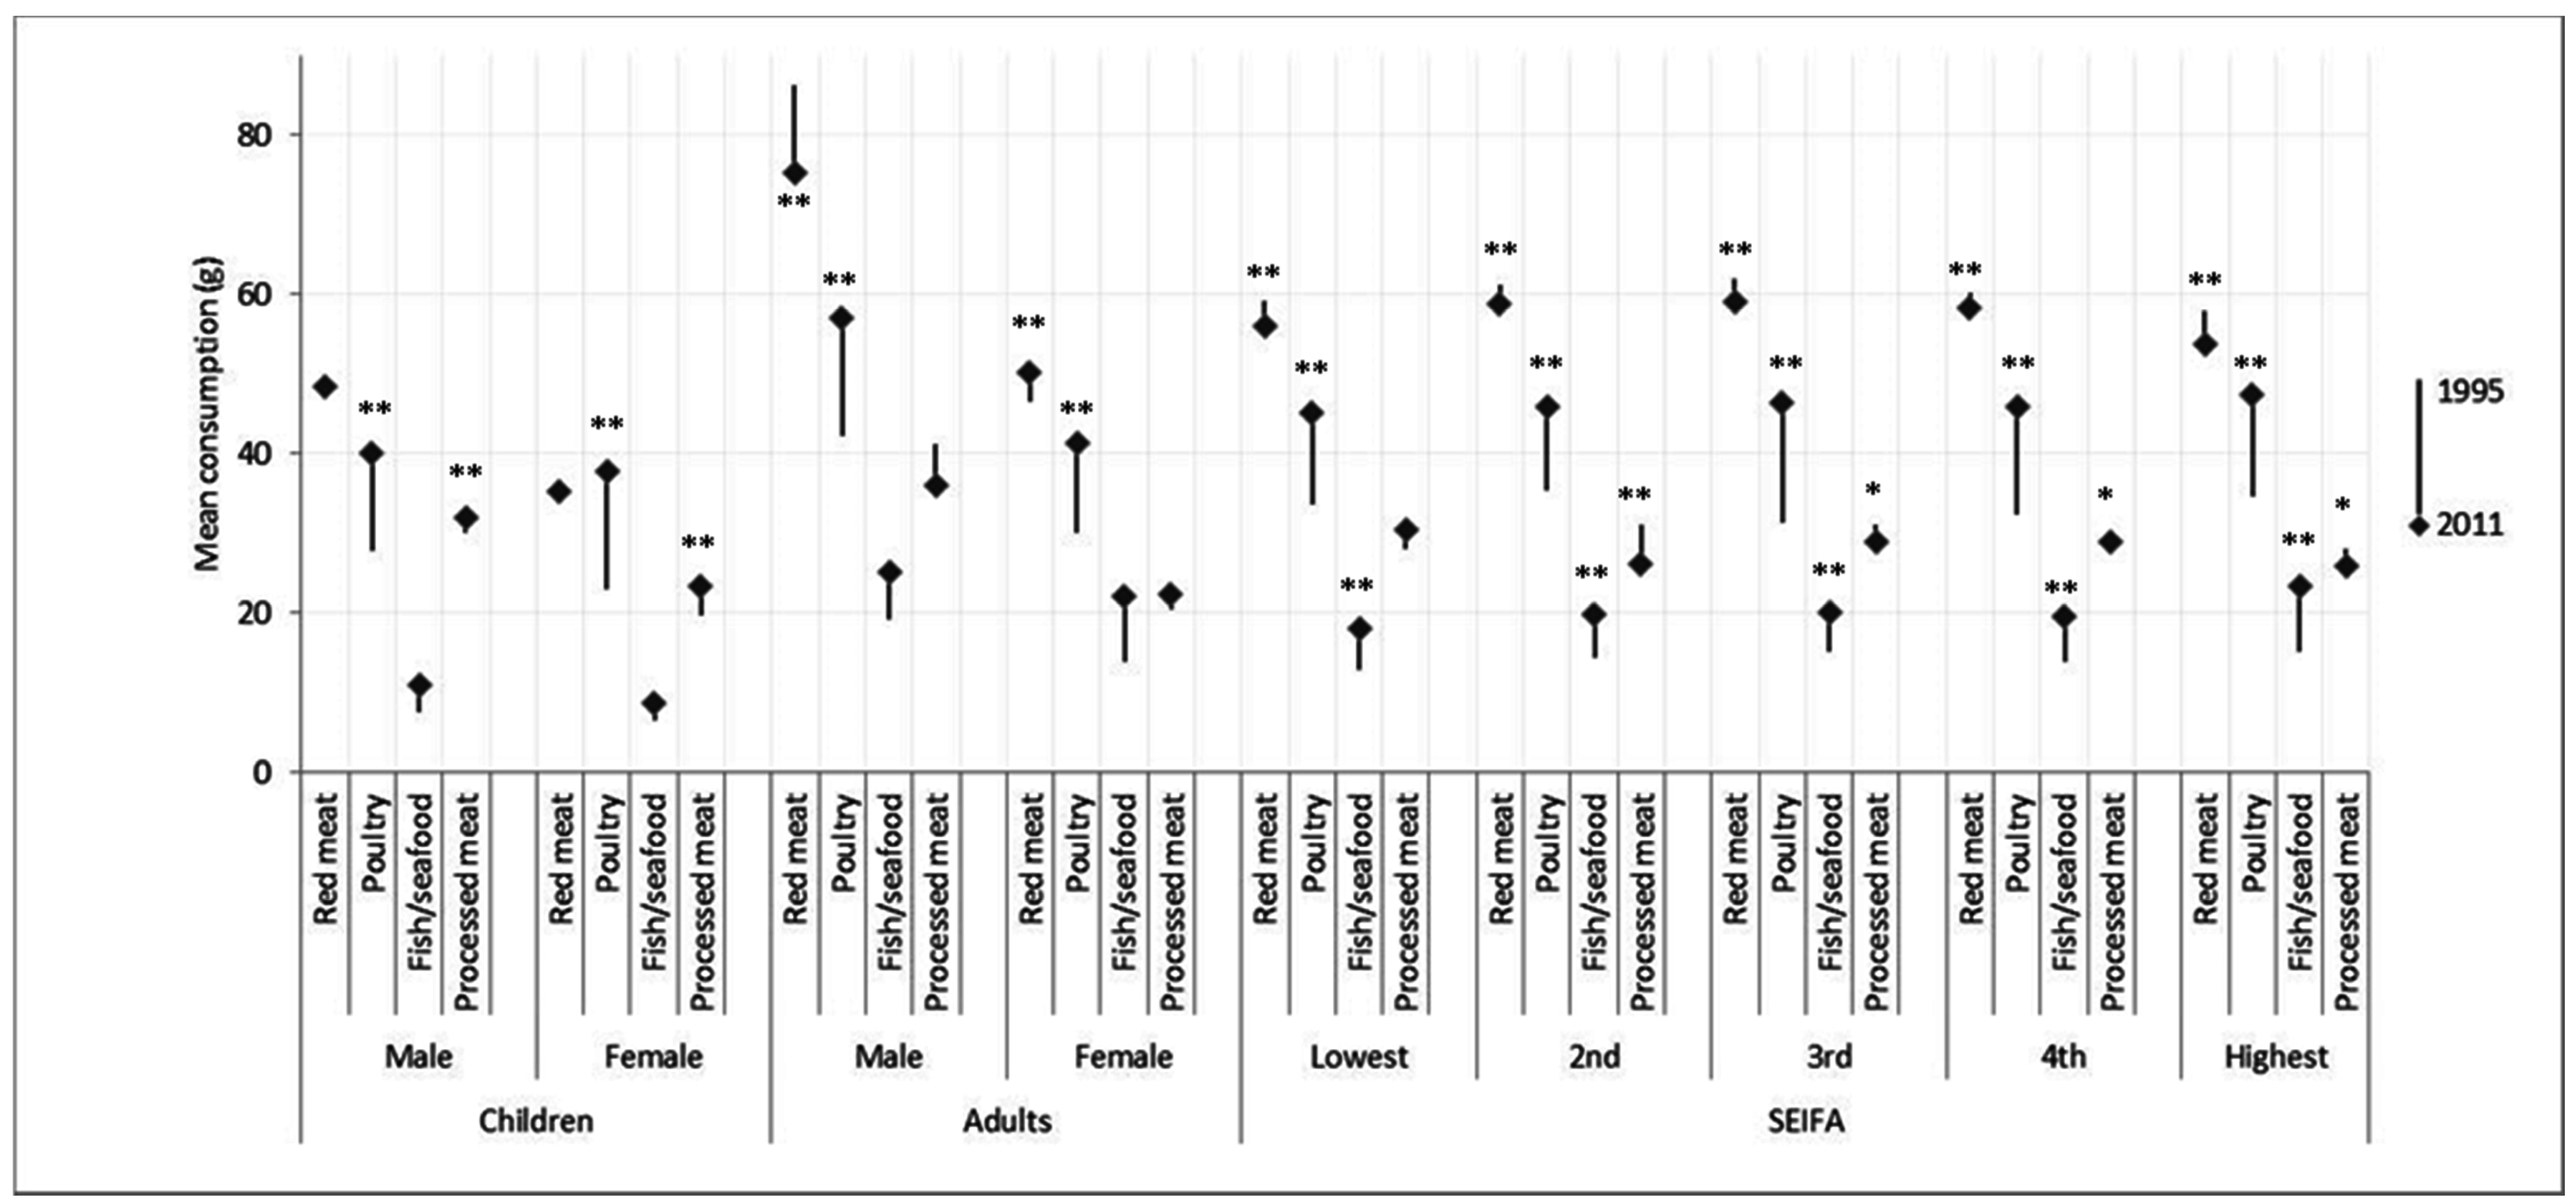
3.2. Per-Capita Consumption
3.3. Per-Consumer Consumption
4. Discussion
5. Conclusions
Supplementary Materials
Acknowledgments
Author Contributions
Conflicts of Interest
References
- National Health and Medical Research Council. Australian Guide to Healthy Eating. Available online: https://www.eatforhealth.gov.au/guidelines/australian-guide-healthy-eating (accessed on 14 September 2016).
- Daniel, C.R.; Cross, A.J.; Koebnick, C.; Sinha, R. Trends in meat consumption in the USA. Public Health Nutr. 2011, 14, 575–583. [Google Scholar] [CrossRef] [PubMed]
- Wang, Y.; Beydoun, M.A.; Caballero, B.; Gary, T.L.; Lawrence, R. Trends and correlates in meat consumption patterns in the US adult population. Public Health Nutr. 2010, 13, 1333–1345. [Google Scholar] [PubMed]
- Williams, P.; Droulez, V. Australian red meat consumption—Implications of changes over 20 years on nutrient composition. Food Aust. 2010, 62, 87–94. [Google Scholar]
- Australian Bureau of Agricultural and Resource Economics and Sciences. Agricultural Commodity Statistics 2014. Available online: http://data.daff.gov.au/data/warehouse/agcstd9abcc002/agcstd9abcc0022014/ACS_2014_1.0.0.pdf (accessed on 14 September 2016).
- Food and Agriculture Organization. Livestock Primary 1961–2012. In FAOSTAT. Available online: http://faostat.fao.org/site/569/default.aspx#ancor (accessed on 31 August 2016).
- Australian Bureau of Statistics. National Nutrition Survey: Foods Eaten Australia 1995; Australian Bureau of Statistics: Canberra, Australia, 1999.
- Australian Bureau of Statistics. Australian Health Survey: Nutrition First Results—Foods and Nutrients, 2011–2012. In 2011–2012 National Nutrition and Physical Activity Survey; Australian Bureau of Statistics: Canberra, Australia, 2014. [Google Scholar]
- Food Standards Australia New Zealand. Australian Food, Supplement and Nutrient Database (AUSNUT); Food Standards Australia New Zealand: Canberra, Australia, 2014.
- Food Standards Australia New Zealand. AUSNUT 2011–2013—AUSNUT 1999 Matching File. Available online: http://www.foodstandards.gov.au/science/monitoringnutrients/ausnut/ausnutdatafiles/Pages/matchingfile.aspx (accessed on 14 September 2016).
- Pot, G.K.; Prynne, C.J.; Almoosawi, S.; Kuh, D.; Stephen, A.M. Trends in food consumption over 30 years: Evidence from a British birth cohort. Eur. J. Clin. Nutr. 2014, 69, 817–823. [Google Scholar] [CrossRef] [PubMed]
- Gonzalez, C.A.; Riboli, E. Diet and cancer prevention: Contributions from the European prospective investigation into cancer and nutrition (epic) study. Eur. J. Cancer 2010, 46, 2555–2562. [Google Scholar] [CrossRef] [PubMed]
- Sinha, R.; Cross, A.J.; Graubard, B.I.; Leitzmann, M.F.; Schatzkin, A. Meat intake and mortality: A prospective study of over half a million people. Arch. Intern. Med. 2009, 169, 562–571. [Google Scholar] [CrossRef] [PubMed]
- Alexander, D.D.; Weed, D.L.; Miller, P.E.; Mohamed, M.A. Red meat and colorectal cancer: A quantitative update on the state of the epidemiologic science. J. Am. Coll. Nutr. 2015, 34, 521–543. [Google Scholar] [CrossRef] [PubMed]
- Corpet, D.E. Red meat and colon cancer: Should we become vegetarians, or can we make meat safer? Meat Sci. 2011, 89, 310–316. [Google Scholar] [CrossRef] [PubMed] [Green Version]
- Larsson, S.C.; Orsini, N. Red meat and processed meat consumption and all-cause mortality: A meta-analysis. Am. J. Epidemiol. 2014, 179, 282–289. [Google Scholar] [CrossRef] [PubMed]
- Chowdhury, R.; Chowdhury, S.; Stevens, S.; Gorman, D.; Pan, A.; Warnakula, S.; Ward, H.; Johnson, L.; Crowe, F.; Hu, F.B.; et al. Association between fish consumption, long chain omega 3 fatty acids, and risk of cerebrovascular disease: Systematic review and meta-analysis. Br. Med. J. 2012, 345, e6698. [Google Scholar] [CrossRef] [PubMed] [Green Version]
- Engeset, D.; Braaten, T.; Teucher, B.; Kuhn, T.; Bueno-de-Mesquita, H.B.; Leenders, M.; Agudo, A.; Bergmann, M.M.; Valanou, E.; Naska, A.; et al. Fish consumption and mortality in the european prospective investigation into cancer and nutrition cohort. Eur. J. Epidemiol. 2015, 30, 57–70. [Google Scholar] [CrossRef] [PubMed] [Green Version]
- National Health and Medical Research Council. Nutrient Reference Values for Australia and New Zealand 2013. Available online: https://www.nrv.gov.au/ (accessed on 14 September 2016).
- Richi, E.B.; Baumer, B.; Conrad, B.; Darioli, R.; Schmid, A.; Keller, U. Health Risks Associated with Meat Consumption: A Review of Epidemiological Studies. Int. J. Vitam. Nutr. Res. 2015, 85, 70–78. [Google Scholar] [CrossRef] [PubMed]
- Fisheries Research and Development Corporation. Retail Sale and Consumption of Seafood; Commonwealth Government’s Department of Agriculture, Fisheries and Forestry: Canberra, Australia, 2002.

| Proportion * | Overall | Children | Adults | ||||||||||||
| Overall | Male | Female | Male | Female | |||||||||||
| 1995 | 2011–2012 | p | 1995 | 2011–2012 | p | 1995 | 2011–2012 | p | 1995 | 2011–2012 | p | 1995 | 2011–2012 | p | |
| Red meat | 56.1 | 48.6 | <0.001 | 54.5 | 47.4 | <0.001 | 51.9 | 44.6 | <0.001 | 62.4 | 54.1 | <0.001 | 52.0 | 45.4 | <0.001 |
| Beef | 42.9 | 38.0 | <0.001 | 44.5 | 39.9 | 0.01 | 41.4 | 36.6 | 0.004 | 48.3 | 42.4 | <0.001 | 38.0 | 34.2 | <0.001 |
| Lamb | 11.7 | 8.1 | <0.001 | 8.7 | 6.6 | 0.02 | 8.8 | 5.6 | 0.001 | 12.8 | 9.3 | <0.001 | 12.2 | 8.2 | <0.001 |
| Pork | 7.5 | 7.5 | 0.93 | 5.7 | 5.4 | 0.74 | 6.0 | 5.9 | 0.78 | 8.5 | 8.9 | 0.69 | 7.4 | 7.3 | 0.73 |
| Kangaroo | 0.1 | 0.3 | 0.06 | 0.3 | 0.4 | 0.10 | 0.1 | 0.4 | 0.08 | 0.2 | 0.4 | 0.07 | 0.1 | 0.3 | 0.004 |
| Game meat | 0.1 | 0.1 | 0.47 | 0.2 | 0.0 | 0.06 | 0.0 | 0.1 | 0.22 | 0.1 | 0.2 | 0.77 | 0.1 | 0.1 | 0.38 |
| Poultry | 29.0 | 37.7 | <0.001 | 27.5 | 37.5 | <0.001 | 26.6 | 39.4 | <0.001 | 29.8 | 37.8 | <0.001 | 29.2 | 37.2 | <0.001 |
| Chicken | 27.6 | 36.8 | <0.001 | 26.7 | 37.1 | <0.001 | 26.2 | 38.9 | <0.001 | 28.2 | 36.6 | <0.001 | 27.7 | 36.4 | <0.001 |
| Other poultry | 1.9 | 1.3 | 0.61 | 0.8 | 0.6 | 0.05 | 0.6 | 0.9 | 0.08 | 2.1 | 1.6 | 0.07 | 2.3 | 1.2 | <0.001 |
| Fish/seafood | 15.6 | 21.4 | <0.001 | 9.6 | 13.7 | 0.001 | 11.8 | 14.3 | 0.03 | 17.4 | 22.5 | <0.001 | 16.5 | 24.4 | <0.001 |
| Finfish | 9.0 | 9.7 | <0.001 | 6.1 | 6.9 | 0.97 | 8.0 | 7.3 | 0.39 | 10.1 | 11.0 | 0.13 | 9.1 | 10.0 | 0.31 |
| Seafood | 4.0 | 5.4 | <0.001 | 2.3 | 3.0 | 0.05 | 2.2 | 3.2 | 0.07 | 4.6 | 5.8 | 0.006 | 4.2 | 6.3 | <0.001 |
| Canned fish | 4.4 | 7.8 | <0.001 | 1.7 | 4.2 | <0.001 | 2.6 | 5.0 | 0.001 | 4.8 | 8.0 | <0.001 | 5.2 | 9.5 | <0.001 |
| Fish/seafood products | 0.8 | 1.6 | <0.001 | 0.4 | 0.5 | 0.13 | 0.4 | 0.9 | 0.10 | 0.8 | 1.6 | 0.33 | 0.7 | 2.0 | <0.001 |
| Organ/offal meat | 0.6 | 0.1 | <0.001 | 0.1 | 0.1 | 0.06 | 0.1 | 0.0 | 0.57 | 0.8 | 0.2 | <0.001 | 0.6 | 0.1 | <0.001 |
| Processed meat | 44.0 | 37.8 | <0.001 | 47.0 | 44.7 | 0.06 | 40.8 | 41.1 | 0.61 | 50.5 | 40.4 | <0.001 | 38.4 | 32.8 | <0.001 |
| Total meat/poultry/fish | 91.7 | 91.3 | 0.16 | 90.6 | 90.8 | 0.09 | 90.1 | 90.0 | 0.11 | 94.6 | 93.2 | 0.16 | 89.9 | 90.1 | 0.84 |
| Proportion | SEIFA | ||||||||||||||
| Lowest | 2nd Quintile | 3rd Quintile | 4th Quintile | Highest | |||||||||||
| 1995 | 2011–2012 | p | 1995 | 2011–2012 | p | 1995 | 2011–2012 | p | 1995 | 2011–2012 | p | 1995 | 2011–2012 | p | |
| Red meat | 55.8 | 48.0 | <0.001 | 56.1 | 50.1 | <0.001 | 55.6 | 48.8 | <0.001 | 57.2 | 49.2 | <0.001 | 55.5 | 47.2 | <0.001 |
| Beef | 42.3 | 37.1 | <0.001 | 41.8 | 39.2 | 0.06 | 43.4 | 39.5 | 0.004 | 44.2 | 37.5 | <0.001 | 42.6 | 36.9 | <0.001 |
| Lamb | 11.4 | 7.5 | <0.001 | 13.0 | 8.2 | <0.001 | 11.4 | 7.0 | <0.001 | 11.7 | 8.9 | 0.001 | 10.8 | 8.8 | 0.01 |
| Pork | 6.9 | 8.3 | 0.07 | 8.0 | 7.2 | 0.28 | 7.5 | 7.6 | 0.81 | 7.8 | 7.6 | 0.77 | 7.1 | 6.8 | 0.58 |
| Kangaroo | 0.2 | 0.4 | 0.11 | 0.0 | 0.2 | 0.05 | 0.3 | 0.3 | 0.82 | 0.1 | 0.4 | 0.05 | 0.1 | 0.4 | 0.02 |
| Game meat | 0.1 | 0.3 | 0.25 | 0.2 | 0.1 | 0.32 | 0.1 | 0.1 | 0.14 | 0.0 | 0.0 | 0.58 | 0.0 | 0.0 | 0.45 |
| Poultry | 27.8 | 36.8 | <0.001 | 28.6 | 36.0 | <0.001 | 27.8 | 37.8 | <0.001 | 28.8 | 37.3 | <0.001 | 31.3 | 40.0 | <0.001 |
| Chicken | 27.0 | 36.1 | <0.001 | 26.9 | 35.4 | <0.001 | 26.8 | 36.9 | <0.001 | 27.5 | 36.4 | <0.001 | 29.5 | 38.9 | <0.001 |
| Other poultry | 1.2 | 0.8 | 0.19 | 2.3 | 1.0 | <0.001 | 1.4 | 1.2 | 0.52 | 1.9 | 1.4 | 0.07 | 2.4 | 1.7 | <0.001 |
| Fish/seafood | 13.9 | 17.8 | <0.001 | 15.0 | 19.8 | <0.001 | 16.0 | 19.6 | <0.001 | 16.0 | 20.0 | <0.001 | 16.6 | 23.6 | <0.001 |
| Finfish | 8.3 | 9.0 | 0.39 | 8.9 | 9.9 | 0.18 | 9.1 | 9.5 | 0.62 | 9.8 | 9.0 | 0.32 | 9.0 | 10.6 | 0.04 |
| Seafood | 3.5 | 4.6 | 0.05 | 4.1 | 4.5 | 0.48 | 4.2 | 5.1 | 0.12 | 3.9 | 5.9 | 0.001 | 4.2 | 6.7 | <0.001 |
| Canned fish | 3.7 | 6.1 | <0.001 | 3.9 | 7.3 | <0.001 | 4.1 | 7.9 | <0.001 | 4.5 | 8.1 | <0.001 | 5.6 | 9.5 | <0.001 |
| Fish/seafood products | 0.6 | 0.7 | 0.585 | 0.9 | 1.8 | 0.08 | 0.9 | 0.9 | 0.10 | 0.4 | 0.9 | 0.97 | 1.0 | 1.2 | 0.47 |
| Organ/offal meat | 0.6 | 0.1 | 0.01 | 0.7 | 0.0 | <0.001 | 0.4 | 0.2 | 0.33 | 0.7 | 0.1 | 0.002 | 0.5 | 0.1 | <0.001 |
| Processed meat | 41.8 | 39.8 | 0.11 | 43.3 | 35.6 | <0.001 | 44.6 | 40.5 | 0.003 | 45.1 | 39.2 | <0.001 | 44.9 | 39.5 | <0.001 |
| Total meat/poultry/fish | 91.2 | 91.0 | 0.35 | 91.7 | 90.3 | 0.26 | 91.6 | 91.8 | 0.15 | 91.4 | 91.4 | 0.58 | 92.7 | 91.8 | 0.14 |
| Per-Capita Consumption (g) | Per-Consumer Consumption (g) | |||||||||
|---|---|---|---|---|---|---|---|---|---|---|
| 1995 | 2011–2012 | Difference (g) | Difference (%) | p * | 1995 | 2011–2012 | Difference (g) | Difference (%) | p ^ | |
| Mean (SD) | Mean (SD) | Median (25–75th Quartile) | Median (25–75th Quartile) | |||||||
| Red meat | 59.9 (89.0) | 57.0 (88.4) | −2.9 | −4.8 | <0.001 | 81.0 (45.3–138.2) | 98.1 (47.5–163.5) | 17.1 | 21.2 | <0.001 |
| Beef | 41.4 (75.2) | 40.0 (75.8) | −1.4 | −3.4 | <0.001 | 70.9 (38.9–129.6) | 83.3 (36.3–155.3) | 12.4 | 17.5 | <0.001 |
| Lamb | 11.4 (44.2) | 9.6 (40.2) | −1.9 | −15.8 | <0.001 | 72.6 (43.5–126.5) | 104.0 (61.0–156.0) | 31.4 | 43.3 | <0.001 |
| Pork | 6.8 (32.7) | 7.0 (33.7) | 0.2 | 2.9 | 0.35 | 69.1 (34.6–126.5) | 75.0 (30.5–120.0) | 5.9 | 8.5 | 0.54 |
| Poultry | 33.5 (73.7) | 46.2 (86.7) | 12.7 | 37.9 | <0.001 | 90.0 (48.9–152.7) | 95.0 (57.0–166.0) | 5.0 | 5.6 | 0.001 |
| Chicken | 32.1 (72.2) | 44.7 (84.8) | 12.6 | 39.3 | <0.001 | 92.0 (49.3–153.4) | 93.6 (57.0–162.7) | 1.6 | 1.7 | 0.021 |
| Other poultry | 1.4 (15.4) | 1.5 (19.4) | 0.1 | 7.1 | <0.001 | 47.7 (15.0–101.8) | 92.3 (33.6–151.9) | 44.6 | 93.5 | <0.001 |
| Fish/seafood | 15.2 (49.2) | 22.1 (60.5) | 6.9 | 45.4 | <0.001 | 64.0 (35.5–117.5) | 81.9 (46.1–124.0) | 17.7 | 27.7 | <0.001 |
| Finfish | 8.2 (38.3) | 10.9 (43.1) | 2.8 | 32.9 | 0.02 | 63.0 (34.0–117.5) | 103.5 (53.7–136.8) | 40.5 | 64.3 | <0.001 |
| Seafood | 3.3 (23.0) | 3.5 (21.2) | 0.2 | 9.6 | <0.001 | 60.8 (26.8–118.5) | 46.6 (20.0–89.6) | −14.1 | 23.4 | <0.001 |
| Canned fish | 2.8 (18.2) | 5.9 (25.0) | 3.1 | 110.7 | <0.001 | 50.2 (30.0–84.3) | 71.3 (40.0–95.0) | 21.1 | 42.0 | <0.001 |
| Processed meat | 29.1 (57.5) | 26.5 (58.0) | −2.6 | −8.9 | <0.001 | 42.7 (21.1–84.0) | 44.2 (18.8–93.5) | 2.3 | 5.4 | 0.48 |
| Total | 137.2 (124.7) | 152.0 (128.9) | 14.8 | 10.8 | <0.001 | 118.1 (65.4–197.6) | 139.1 (80.0–219.2) | 21.1 | 17.8 | <0.001 |
© 2016 by the authors; licensee MDPI, Basel, Switzerland. This article is an open access article distributed under the terms and conditions of the Creative Commons Attribution (CC-BY) license (http://creativecommons.org/licenses/by/4.0/).
Share and Cite
Sui, Z.; Raubenheimer, D.; Cunningham, J.; Rangan, A. Changes in Meat/Poultry/Fish Consumption in Australia: From 1995 to 2011–2012. Nutrients 2016, 8, 753. https://doi.org/10.3390/nu8120753
Sui Z, Raubenheimer D, Cunningham J, Rangan A. Changes in Meat/Poultry/Fish Consumption in Australia: From 1995 to 2011–2012. Nutrients. 2016; 8(12):753. https://doi.org/10.3390/nu8120753
Chicago/Turabian StyleSui, Zhixian, David Raubenheimer, Judy Cunningham, and Anna Rangan. 2016. "Changes in Meat/Poultry/Fish Consumption in Australia: From 1995 to 2011–2012" Nutrients 8, no. 12: 753. https://doi.org/10.3390/nu8120753