Caffeine Use among Active Duty Navy and Marine Corps Personnel

Abstract
:1. Introduction
2. Materials and Methods
2.1. Recruitment Procedures
2.2. Survey (Questionnaire) Description
2.3. Data Analysis
3. Results
3.1. Caffeine Prevalence
3.2. Caffeine Consumption
3.3. Characteristics Independently Associated with Caffeine Use
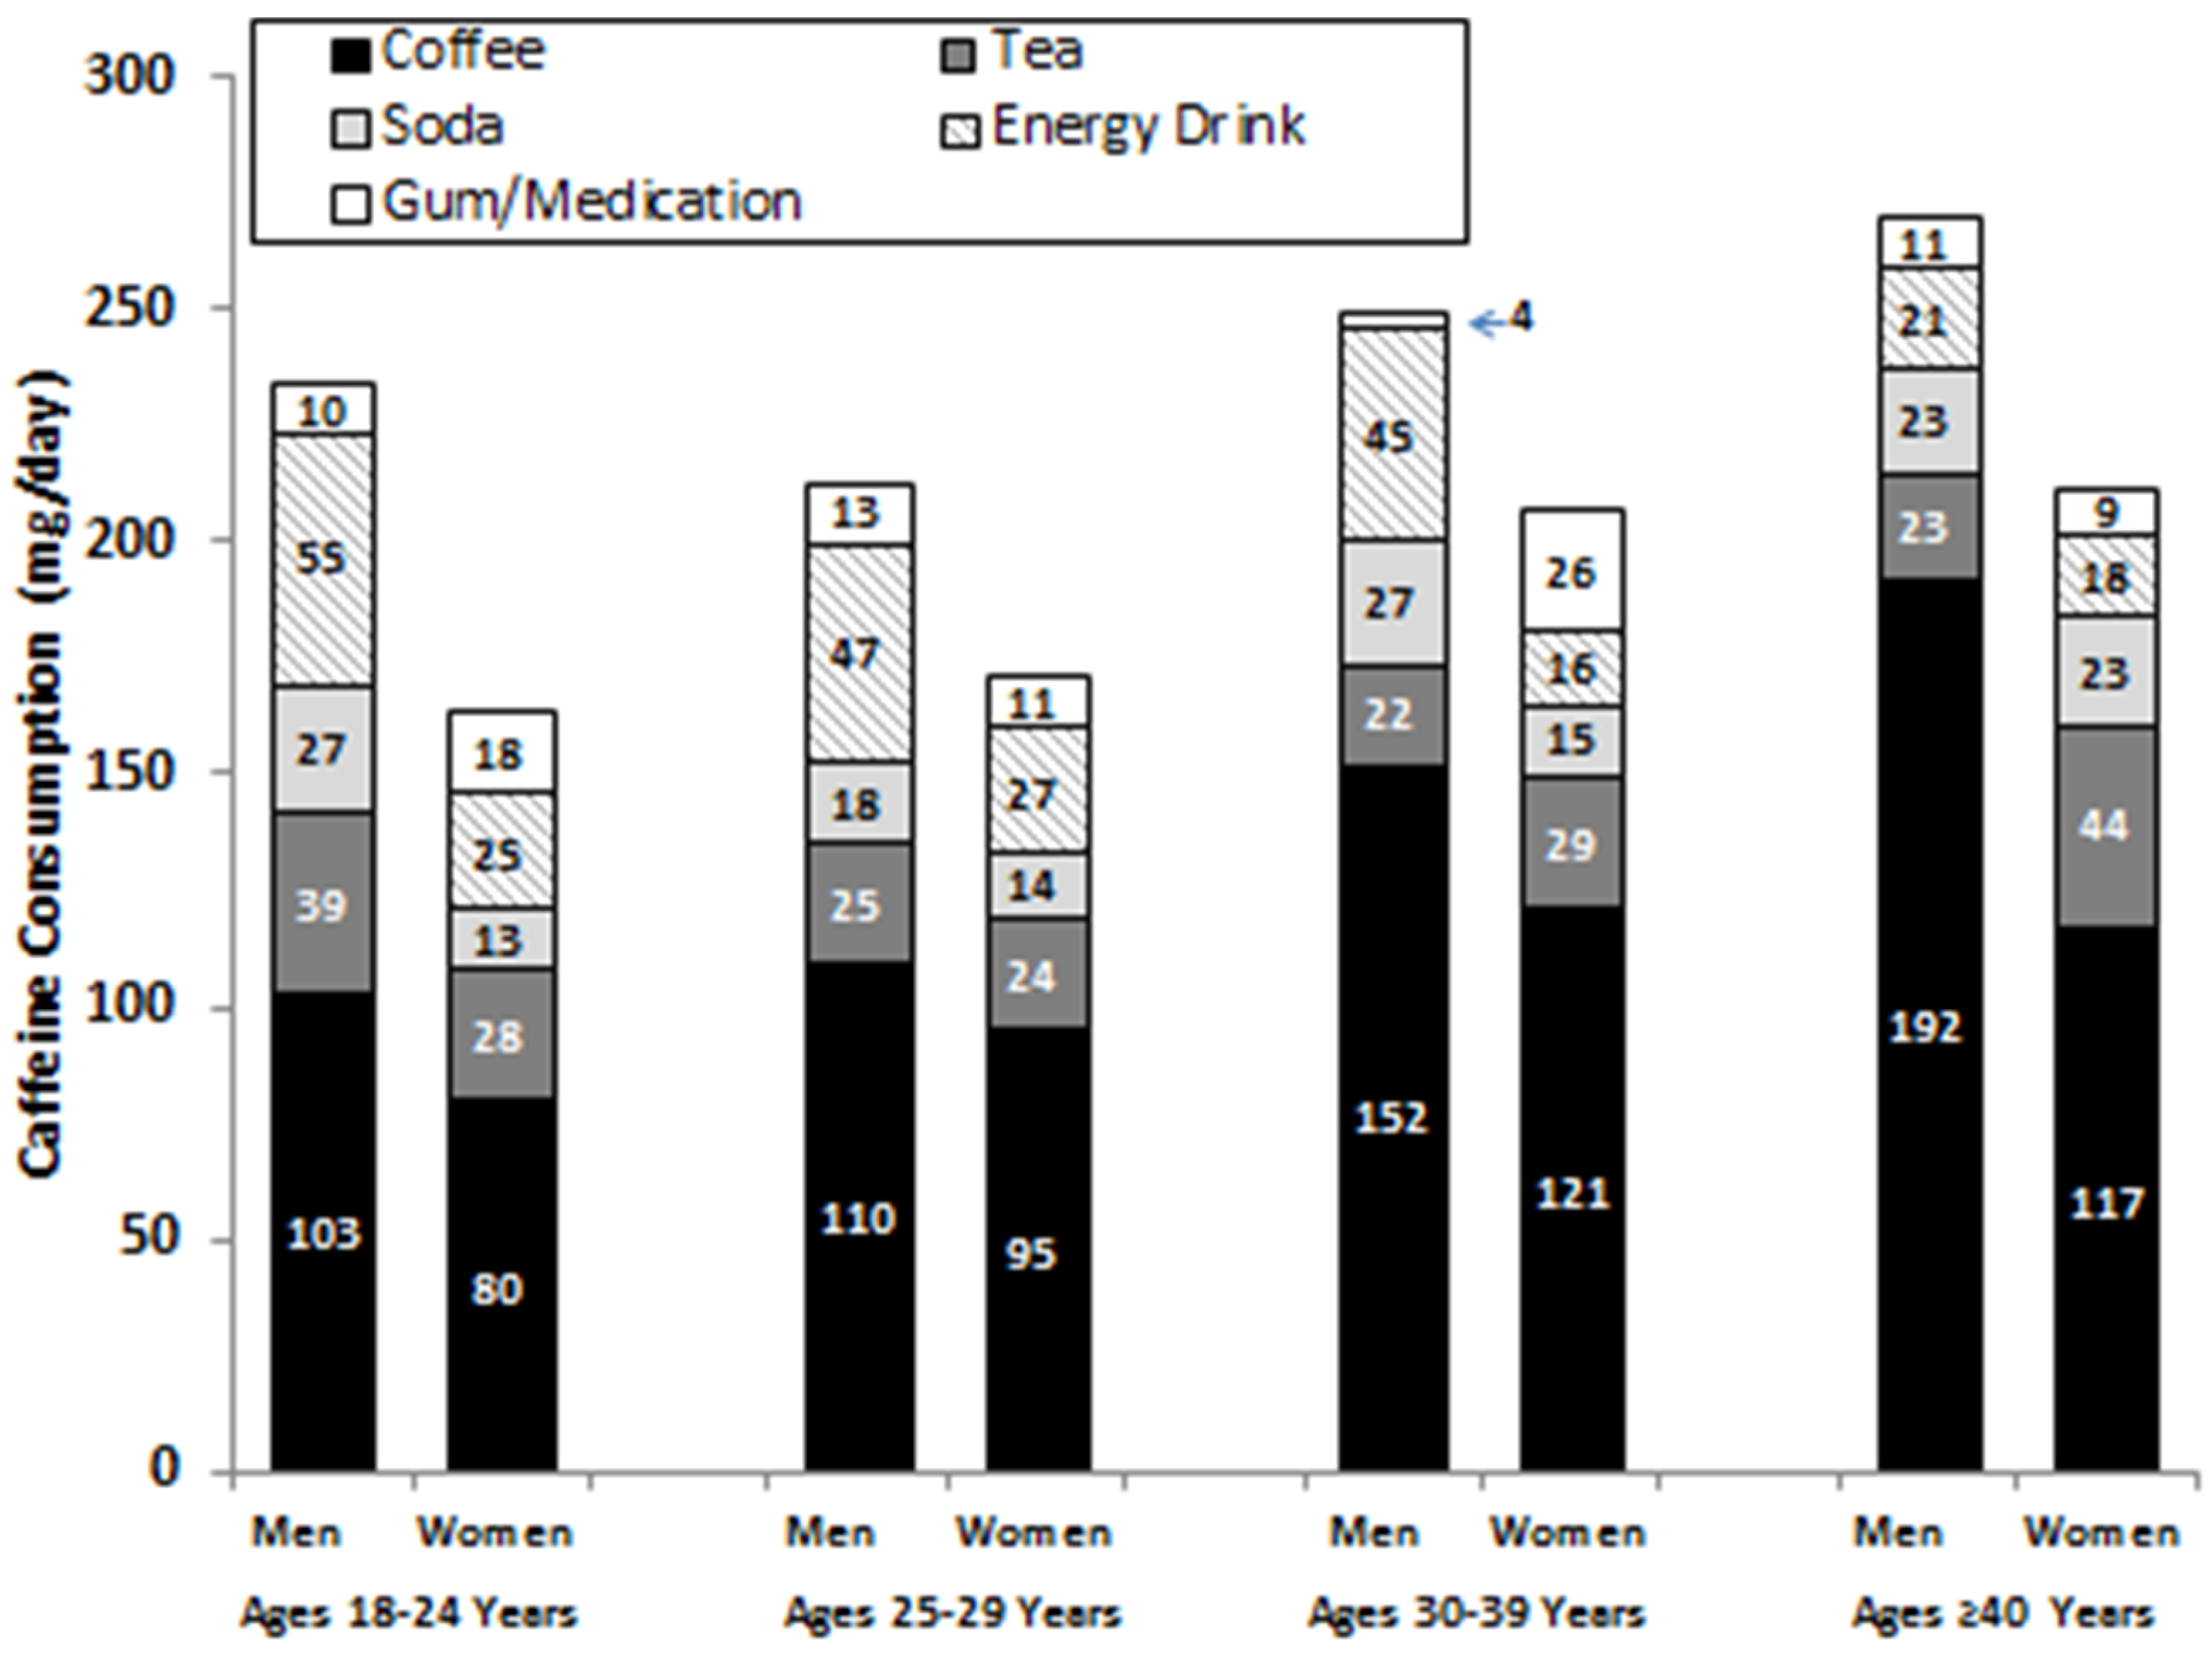
3.4. Caffeine Consumption by Age and Gender
3.5. Comparison of Navy and Marine Corps Personnel
4. Discussion
4.1. Caffeine Prevalence and Daily Consumption
4.2. Characteristics Associated with Caffeine Use
4.3. Limitations
5. Conclusions
Acknowledgments
Author Contributions
Conflicts of Interest
Disclaimers
References
- Fulgoni, V.L.F.; Keast, D.R.; Lieberman, H.R. Trends in intake and sources of caffeine in the diet of US adults: 2001–2010. Am. J. Clin. Nutr. 2015, 101, 1081–1087. [Google Scholar] [CrossRef] [PubMed]
- Mitchell, D.C.; Knight, C.A.; Hokenberry, J.; Teplansky, R.; Hartman, T.J. Beverage caffeine intakes in the U.S. Food Chem. Toxicol. 2014, 63, 136–142. [Google Scholar] [CrossRef] [PubMed]
- James, J.E. Critical review of dietary caffeine and blood pressure: A relationship that should be taken more seriously. Psychosom. Med. 2004, 66, 63–71. [Google Scholar] [CrossRef] [PubMed]
- Nurminen, M.L.; Niittynen, L.; Korpela, R.; Vapaatalo, H. Coffee, caffeine and blood pressure: A critical review. Europ. J. Clin. Nutr. 1999, 53, 831–839. [Google Scholar] [CrossRef]
- Cai, L.; Ma, D.; Zhang, Y.; Lui, Z.; Wang, P. The effect of coffee consumption on serum lipids: A meta-analysis of randomized controlled trials. Eur. J. Clin. Nutr. 2012, 66, 872–877. [Google Scholar] [CrossRef] [PubMed]
- Mostofsky, E.; Rice, M.S.; Levitan, E.B.; Mittleman, M.A. Habitual coffee consumption and risk of heart failure: A dose-response meta-analysis. Circ. Heart Fail. 2012, 5, 401–405. [Google Scholar] [CrossRef] [PubMed]
- Bohn, S.K.; Ward, N.C.; Hodgson, J.M.; Croft, K.D. Effects of tea and coffee on cardiovascular disease risk. Food Funct. 2012, 3, 575–591. [Google Scholar] [CrossRef] [PubMed]
- Wilson, P.W.F.; Bloom, H.L. Caffeine consumption and cardiovascular risk: Little cause for concern. J. Am. Heart Assoc. 2016, 5, e003089. [Google Scholar] [CrossRef] [PubMed]
- Eilat-Adar, S.; Sinai, T.; Yosefy, C.; Henkin, Y. Nutritional recommendations for cardiovascular disease prevention. Nutrients 2013, 5, 3646–3683. [Google Scholar] [CrossRef] [PubMed]
- Thong, F.S.L.; Graham, T.E. Caffeine-induced impairment of glucose tolerance is abolished by b-adrenergic receptor blockade in humans. J. Appl. Physiol. 2002, 92, 2347–2352. [Google Scholar] [CrossRef] [PubMed]
- Shearer, J.; Graham, T.E. Performance effects and metabolic consequences of caffeine and caffeinated energy drink consumption on glucose disposal. Nutr. Rev. 2014, 72, 121–136. [Google Scholar] [CrossRef] [PubMed]
- Ding, M.; Bhupathiraju, S.N.; Chen, M.; VanDam, R.M.; Hu, F.B. Caffeinated and decaffeinated coffee consumption and risk of Type 2 diabetes: A systematic review and a dose-response meta-analysis. Diabetes Care 2014, 37, 569–586. [Google Scholar] [CrossRef] [PubMed]
- VanDam, R.M.; Hu, F.B. Coffee consumption and risk of Type 2 diabetes. JAMA 2005, 294, 97–104. [Google Scholar] [CrossRef] [PubMed]
- Feld, J.J.; Lavoie, E.G.; Fausther, M.; Dranoff, J.A. I drink for my liver, doc: Emerging evidence that coffee prevents cirrhosis. F1000Research 2015, 4, 95. [Google Scholar] [CrossRef] [PubMed]
- Arab, L.; Khan, F.; Lam, H. Epidemiological evidence of a relationship between tea, coffee, or caffeine consumption and cognitive decline. Adv. Nutr. 2013, 4, 115–122. [Google Scholar] [CrossRef] [PubMed]
- Spriet, L.L. Exercise and sports performance with low doses of caffeine. Sports Med. 2014, 44, S175–S184. [Google Scholar] [CrossRef] [PubMed]
- Kim, J.; Lee, J. A review of nutritional intervention on delayed onset muscle soreness. Part 1. J. Exerc. Rehabil. 2014, 10, 349–356. [Google Scholar] [CrossRef] [PubMed]
- Nawrot, P.; Jordan, S.; Eastwood, J.; Rotstein, J.; Hugenholtz, A.; Feeley, M. Effects of caffeine on human health. Food Addit. Contam. 2003, 20, 1–30. [Google Scholar] [CrossRef] [PubMed]
- Frary, C.D.; Johnson, R.K.; Wang, M.Q. Food sources and intakes of caffeine in the diets of persons in the United States. J. Am. Diet. Assoc. 2005, 105, 110–113. [Google Scholar] [CrossRef] [PubMed]
- Lieberman, H.R.; Stavinoha, T.; McGraw, S.; White, A.; Hadden, L.; Marriott, B.P. Caffeine use among active duty US Army soldiers. J. Acad. Nutr. Diet. 2012, 112, 902–912. [Google Scholar] [CrossRef] [PubMed]
- Smith, T.C. The US Department of Defense Millennium Cohort Study: Career span and beyond longitudinal follow-up. J. Occup. Environ. Med. 2009, 51, 1193–1201. [Google Scholar] [CrossRef] [PubMed]
- CaffeineInformer. Caffeine Content of Drinks. Available online: http://www.caffeineinformer.com/the-caffeine-database (accessed on 12 December 2015).
- National Institute of Health. Rethinking Drinking. Alcohol & Your Health. Available online: http://rethinkingdrinking.niaaa.nih.gov/How-much-is-too-much/What-counts-as-a-drink/Whats-A-Standard-Drink.aspx (accessed on 22 December 2015).
- Ryan, M.A.; Smith, T.C.; Smith, B.; Amoroso, P.; Boyko, E.J.; Gray, G.C.; Gackstetter, D.G.; Riddle, J.R.; Wells, T.S.; Gumbs, G.; et al. Millennium cohort: Enrollment begins a 21-year contribution to understanding the impact of military service. J. Clin. Epidemiol. 2007, 60, 181–191. [Google Scholar] [CrossRef] [PubMed]
- Drewnowski, A.; Rehm, C.D. Sources of caffeine in diets of US children and adults: Trends by beverage type and purchase location. Nutrients 2016, 8, 154. [Google Scholar] [CrossRef] [PubMed]
- Ahuja, J.K.C.; Goldman, J.D.; Perloff, B.P. The effect of improved composition data on intake estimates in the United States of America. J. Food Compost. Anal. 2006, 19, S7–S13. [Google Scholar] [CrossRef]
- Cornelis, M.C.; Al-Sohemy, A.; Campos, H. Genetic polymorphism of the adenosine a2a receptor is associated with habitual caffeine consumption. Am. J. Clin. Nutr. 2007, 86, 240–244. [Google Scholar] [PubMed]
- Sachse, C.; Brockmoller, J.; Bauer, S.; Roots, I. Functional significance of a c to a polymorphism in intron 1 of the cytochrome p450 cyp1a2gene tested with caffeine. Br. J. Clin. Pharmacol. 1999, 47, 445–449. [Google Scholar] [CrossRef] [PubMed]
- Huang, Z.L.; Qu, W.M.; Eguchi, N.; Chen, J.F.; Schwarzschild, M.A.; Fredholm, B.B.; Urade, Y.; Hayaishi, O. Adenosine a2a but not a1 receptors mediate the arousal effect of caffeine. Nat. Neurosci. 2005, 8, 858–859. [Google Scholar] [CrossRef] [PubMed]
- Schmidt, R.M.; McIntire, L.K.; Caldwell, J.A.; Hallman, C. Prevalence of Energy-Drink and Supplement Usage in a Sample of Air Force Personnel; AFRL-RH-WP-TP-2010–0010; Air Force Research Laboratory: Wright-Patterson Air Force Base, OH, USA, 2008. [Google Scholar]
- Stephens, M.B.; Attipoe, A.S.; Jones, D.; Ledford, C.J.W.; Deuster, P.A. Energy drink and energy shot use in the military. Nutr. Rev. 2014, 72, 72–77. [Google Scholar] [CrossRef] [PubMed]
- Toblin, R.L.; Clarke-Walper, K.; Kok, B.C.; Sipos, M.L.; Thomas, J.L. Energy drink consumption and its association with sleep problems among U.S. Service members on a combat deployment—Afghanistan, 2010. MMWR 2012, 61, 895–898. [Google Scholar]
- Skewes, M.C.; Decou, C.R.; Gonzalez, V.M. Energy drink use, problem drinking and drinking motives in a diverse sample of Alaska college students. Int. J. Circumpolar Health 2013, 72, 21204. [Google Scholar] [CrossRef] [PubMed] [Green Version]
- Marczinski, C.A. Alcohol mixed with energy drinks: Consumption patterns and motivations for use in U.S. College students. Int. J. Environ. Res. Public Health 2011, 8, 3232–3245. [Google Scholar] [CrossRef] [PubMed]
- Hartley, T.R.; Lovallo, W.R.; Whitsett, T.L. Cardiovascular effects of caffeine in men and women. Am. J. Cardiol. 2004, 93, 1022–1026. [Google Scholar] [CrossRef] [PubMed]
- Farag, N.H.; Whitsett, T.L.; McKey, B.S.; Wilson, M.F.; Vincent, A.S.; Everson-Rose, S.A.L.; Lovallo, W.R. Caffeine and blood pressure response: Sex, age and hormonal status. J. Women’s Health 2010, 19, 1171–1176. [Google Scholar] [CrossRef] [PubMed]
- Amendola, C.A.; Gabrieli, J.D.E.; Lieberman, H.R. Caffeine’s effect on performance and mood are independent of age and gender. Nutr. Neurosci. 1998, 1, 269–280. [Google Scholar] [CrossRef] [PubMed]
- Heckman, M.A.; Sherry, K.; GonzalezDeMejia, E. Energy drinks: Assessment of their market size, consumer demographics, ingredient profile, functionality, and regulations in the United States. Comp. Rev. Food Sci. Food Saf. 2010, 9, 303–317. [Google Scholar] [CrossRef]
- Lal, G.G. Getting specific with functional beverages. Food Technol. 2007, 61, 25–31. [Google Scholar]
- Market Realist. Mintel Forecasts Strong Growth in the US Energy Drink Market. Available online: http://marketrealist.com/2015/06/mintel-forecasts-strong-growth-us-energy-drink-market/ (accessed on 14 January 2016).
- Hiza, H.A.B.; Casavale, K.O.; Guenther, P.M.; Davis, C.A. Diet quality of americans differ by age, sex, race/ethnicity, income and educational level. J. Acad. Nutr. Diet. 2013, 113, 297–306. [Google Scholar] [CrossRef] [PubMed]
- Wang, Y.; Chen, X. How much of racial/ethnic disparities in dietary intake, exercise, and weight status can be explained by nutrition- and health-related psychosocial factors and socioeconomic status among US adults. J. Am. Diet. Assoc. 2011, 111, 1904–1991. [Google Scholar] [CrossRef] [PubMed]
- Raffensperger, S.; Kuczmarski, M.F.; Hotchkiss, L.; Cotugna, N.; Evans, M.K.; Zonderman, A.B. The effect of race and predictors of socioeconomic status on diet quality in the in the healthy aging in neighborhoods of diversity across the life span (handls) study sample. J. Natl. Med. Assoc. 2010, 102, 923–930. [Google Scholar] [CrossRef]
- Bahr, P.R. Race and nutrition: An investigation of black-white differences in health-related nutrition behaviors. Soc. Health Illness 2007, 29, 831–856. [Google Scholar] [CrossRef] [PubMed]
- Istvan, J.; Matarazzo, J.D. Tobacco, alcohol, and caffeine use: A review of their interrelationships. Psychol. Bull. 1984, 95, 301–326. [Google Scholar] [CrossRef] [PubMed]
- Kozlowski, L.T.; Henningfield, J.E.; Keenan, R.M.; Lei, H.; Jelinek, L.C.; Leigh, G.; Pope, M.A.; Haertzen, C.A. Patterns of alcohol, cigarette, and caffeine and other drug use in two drug abusing populations. J. Subst. Abuse Treat. 1993, 10, 171–179. [Google Scholar] [CrossRef]
- Lund, H.G.; Reider, B.D.; Whiting, A.B.; Pritchard, J.R. Sleep patterns and predictors of disturbed sleep in a large population of college students. J. Adolesc. Health 2010, 46, 124–132. [Google Scholar] [CrossRef] [PubMed]
- Miller, K.E. Energy drinks, race, and problem behaviors among college students. J. Adolesc. Health 2008, 43, 490–497. [Google Scholar] [CrossRef] [PubMed]
- Velazquez, C.E.; Poulos, N.S.; Latimer, L.A.; Pasch, K.E. Associations between energy drink consumption and alcohol use behaviors among college students. Drug Alcohol Depend. 2012, 123, 167–172. [Google Scholar] [CrossRef] [PubMed]
- Swan, G.E.; Carmelli, D.; Cardon, L.R. The consumption of tobacco, alcohol, and coffee in Caucasian male twins: A multivariate genetic analysis. J. Subst. Abuse 1996, 8, 19–31. [Google Scholar] [CrossRef]
- Hettema, J.M.; Corey, L.A.; Kendler, K.S. A multivariate genetic analysis of the use of tobacco, alcohol and caffeine in a population based sample of male and female twins. Drug Alcohol Depend. 1999, 57, 69–78. [Google Scholar] [CrossRef]
- Kendler, K.S.; Schmitt, E.; Aggen, S.H.; Prescott, C.A. Genetic and environmental influences on alcohol, caffeine, cannabis and nicotine use from early adolescence to middle adulthood. Arch. Gen. Psychiatry 2008, 65, 674–682. [Google Scholar] [CrossRef] [PubMed]
- Lohsoonthorn, V.; Khidir, H.; Casillas, G.; Lertmaharit, S.; Tadesse, M.G.; Pensuksan, W.C.; Rattananupong, T.; Gelaye, B.; Williams, M.A. Sleep quality and sleep patterns in relation to consumption of energy drinks, caffeinated beverages and other stimulants among thai college students. Sleep Breath. 2013, 17, 1017–1028. [Google Scholar] [CrossRef] [PubMed]
- Brick, C.A.; Seely, D.L.; Palermo, T.M. Association between sleep hygiene and sleep quality in medical students. Behav. Sleep Med. 2010, 8, 113–121. [Google Scholar] [CrossRef] [PubMed]
- Sanchez-Ortuno, M.; Moore, N.; Taillard, J.; Valtat, C.; Leger, D.; Bioulac, B.; Philip, P. Sleep duration and caffeine consumption in a French middle-aged working population. Sleep Med. 2005, 6, 247–251. [Google Scholar] [CrossRef] [PubMed]
- Waits, W.M.; Ganz, M.B.; Schillreff, T.; Dell, P.J. Sleep and the use of energy products in a combat environment. US Army Med. Dep. J. 2014, Oct-Dec, 22–28. [Google Scholar]
- Jacobson, I.G.; Horton, J.L.; Smith, B.; Wells, T.S.; Boyko, E.J.; Lieberman, H.R.; Ryan, M.A.K.; Smith, T.C. Bodybuilding, energy, and weight loss supplements are associated with deployment and physical activity in U.S. Military personnel. Ann. Epidemiol. 2012, 22, 318–330. [Google Scholar] [CrossRef] [PubMed]
- Kant, A.K.; Graubard, B.I. Association between self-reported sleep duration with eating behaviors of American adults: NHANES 2005–2010. Am. J. Clin. Nutr. 2014, 100, 938–947. [Google Scholar] [CrossRef] [PubMed]
- Ribiro, J.A.; Sebastiao, A.M. Caffeine and adenosine. J. Alzheimer’s Dis. 2010, 20, S3–S15. [Google Scholar]
- Huang, Z.L.; Zhang, Z.; Qu, W.M. Roles of adenosine and its receptors in sleep-wake regulation. Int. Rev. Neurobiol. 2014, 119, 349–371. [Google Scholar] [PubMed]
- Urry, E.; Landolt, H.P. Adenosine, caffeine and performance: From cognitive neuroscience of sleep to sleep pharmacogenetics. Curr. Top. Behav. Neurosci. 2015, 25, 331–366. [Google Scholar] [PubMed]
- Landolt, H.P.; Werth, E.; Borbeely, A.A.; Dijk, D.J. Caffeine intake (200 mg) in the morning affects human sleep and EEG power spectra at night. Brain Res. 1995, 675, 67–74. [Google Scholar] [CrossRef]
- Drapeau, C.; Hamel-Herbrt, I.; Robillard, R.; Selmaoui, B.; Filipini, D.; Carrier, J. Challenging sleep in aging: The effect of 200 mg of caffeine during the evening in young and middle-aged moderate caffeine consumers. J. Sleep Res. 2006, 15, 133–141. [Google Scholar] [CrossRef] [PubMed]
- Drake, C.; Roehrs, T.; Shambroom, J.; Roth, T. Caffeine effects on sleep taken 0, 3, or 6 hours before going to bed. J. Clin. Sleep Med. 2013, 9, 1195–1200. [Google Scholar] [CrossRef] [PubMed]
- Knapik, J.J.; Trone, D.W.; Austin, K.G.; Steelman, R.A.; Farina, E.K.; Lieberman, H.R. Prevalence, adverse effects, and factors associated with dietary supplement and nutritional supplement use by United States Navy and Marine Corps personnel. J. Acad. Nutr. Diet. 2016, in press. [Google Scholar] [CrossRef] [PubMed]
- Gurley, B.J.; Steelman, S.C.; Thomas, S.L. Multi-ingredient, caffeine containing dietary supplements: History, safety, and efficacy. Clin. Ther. 2015, 37, 275–301. [Google Scholar] [CrossRef] [PubMed]
- Andrews, K.W.; Schweitzer, A.; Zhao, C.; Holden, J.M.; Roseland, J.M.; Brandt, M.; Dwyer, J.T.; Picciano, M.F.; Saldanha, L.G.; Fisher, K.D.; et al. The caffeine contents of dietary supplements commonly purchased in the US: Analysis of 53 products with caffeine-containing ingredients. Anal. Bioanal. Chem. 2007, 389, 231–239. [Google Scholar] [CrossRef] [PubMed]
- Hursel, R.; Westerterp-Plantenga, M.S. Thermogenic ingredients and body weight regulation. Int. J. Obes. 2010, 34, 659–669. [Google Scholar] [CrossRef] [PubMed]
- Lopez-Garcia, E.; VanDam, R.M.; Rajpathak, S.; Willett, W.C.; Manson, J.E.; Hu, F.B. Changes in caffeine intake and long-term weight change in men and women. Am. J. Clin. Nutr. 2006, 83, 674–680. [Google Scholar] [PubMed]
- Marine Corps. Marine Corps Body Composition and Military Appearance Program, Marine Corps Order 6110.3Headquarters; United States Marine Corps: Washington, DC, USA, 2008. [Google Scholar]
- OPNAV Instruction 6110.1j—Physical Readiness Program. Available online: http://navy-fitness.com/2011/07/opnavinst-6110-1j-physical-readiness-program-policy-changes/ (accessed on 1 August 2016).
- Podsakoff, P.M.; MacKenzie, S.B.; Lee, J.Y.; Podsakoff, N.P. Common method biases in behavioral research: A critical review of the literature and recommended remedies. J. Appl. Psychol. 2003, 88, 879–903. [Google Scholar] [CrossRef] [PubMed]
- Furnham, A. Response bias, social desirability and dissimulation. Person. Individ. Diff. 1985, 7, 385–400. [Google Scholar] [CrossRef]
- Hecimovic, I.; Belscak-Cvitanovic, A.; Horzic, D.; Komes, D. Comparative study of polyphenols and caffeine in different coffee varieties affected by the degree of roasting. Food Chem. 2011, 129, 991–1000. [Google Scholar] [CrossRef] [PubMed]
- Barone, J.J.; Roberts, H.R. Caffeine consumption. Food Chem. Toxicol. 1996, 34, 119–129. [Google Scholar] [CrossRef]
- Chin, J.M.; Merves, M.L.; Goldberg, B.A.; Sampson-Cone, A.; Cone, E.J. Caffeine content of brewed teas. J. Anal. Toxicol. 2008, 32, 702–704. [Google Scholar] [CrossRef] [PubMed]

| Category | Definition |
|---|---|
| Any caffeine | All caffeine-containing beverages, gums, and medications as listed below |
| Coffee | Hot or cold brewed coffee, espresso, cappuccino, frozen blended coffee drinks, and other coffee-based beverages that contain caffeine |
| Hot tea * | Hot brewed tea of any type that contains caffeine |
| Other tea * | Other teas including iced tea and cold tea blends that include caffeine |
| Cola † | All brands of cola-type beverages that contain caffeine |
| Other soda † | Sodas that are not colas but are carbonated and contain caffeine including root beers, orange soda, and other flavored sodas |
| Energy drink | All beverages labeled as energy drinks of any kind that contain caffeine |
| Gum or medication | Chewing gums, prescription medications, weight control aids, and other over-the-counter medications that contain caffeine |
| Other drink | Flavored waters, hot chocolate, chocolate milks, and derivatives that contain caffeine |
| Variable | Strata | Any Caffeine | Coffee | Hot Tea | Other Tea | Cola | Other Soda | Energy Drink | Other Drink | Gum/Medication |
|---|---|---|---|---|---|---|---|---|---|---|
| Group | All (n = 1683) | 87.0 ± 0.8 | 65.0 ± 1.2 | 16.8 ± 0.9 | 22.8 ± 1.0 | 39.6 ± 1.2 | 14.3 ± 0.9 | 27.5 ± 1.1 | 2.9 ± 0.4 | 8.4 ± 0.7 |
| Gender | Men (n = 1198) | 87.8 ± 0.9 | 66.0 ± 1.4 | 12.7 ± 1.0 | 23.0 ± 1.2 | 43.8 ± 1.4 | 15.2 ± 1.0 | 30.9 ± 1.3 | 2.4 ± 0.4 | 6.8 ± 0.7 |
| Women (n = 485) | 85.2 ± 1.6 | 62.5 ± 2.2 | 27.0 ± 2.0 | 22.1 ± 1.9 | 29.1 ± 2.1 | 12.0 ± 1.5 | 19.2 ± 1.8 | 3.9 ± 0.9 | 12.2 ± 1.5 | |
| p-value | 0.14 | 0.17 | <0.01 | 0.64 | <0.01 | 0.09 | <0.01 | 0.10 | <0.01 | |
| Age (years) | 18–24 (n = 443) | 76.7 ± 2.0 | 51.7 ± 2.4 | 17.4 ± 1.8 | 25.4 ± 2.1 | 30.7 ± 2.2 | 17.4 ± 1.8 | 29.6 ± 2.2 | 3.6 ± 0.9 | 9.9 ± 1.4 |
| 25–29 (n = 407) | 88.7 ± 1.6 | 63.1 ± 2.4 | 16.2 ± 1.8 | 21.1 ± 2.0 | 37.1 ± 2.4 | 12.5 ± 1.6 | 33.9 ± 2.3 | 2.2 ± 0.7 | 5.9 ± 1.2 | |
| 30–39 (n = 552) | 90.6 ± 1.2 | 72.8 ± 1.9 | 15.8 ± 1.6 | 22.1 ± 1.8 | 45.5 ± 2.1 | 14.1 ± 1.5 | 27.7 ± 1.9 | 2.9 ± 0.7 | 7.6 ± 1.1 | |
| ≥40 (n = 280) | 93.9 ± 1.4 | 73.6 ± 2.6 | 18.9 ± 2.3 | 22.5 ± 2.5 | 45.7 ± 3.0 | 11.8 ± 1.9 | 14.3 ± 2.1 | 2.5 ± 0.9 | 11.1 ± 1.9 | |
| p-value | <0.01 | <0.01 | 0.67 | 0.45 | <0.01 | 0.11 | <0.01 | 0.65 | 0.05 | |
| Education | Some high school/high school graduate (n = 393) | 79.1 ± 2.1 | 51.9 ± 2.5 | 13.7 ± 1.7 | 23.9 ± 2.2 | 35.6 ± 2.4 | 15.5 ± 1.8 | 30.3 ± 2.3 | 3.1 ± 0.9 | 8.4 ± 1.4 |
| Some college/Associate’s degree (n = 729) | 87.5 ± 1.2 | 64.6 ± 1.8 | 15.4 ± 1.3 | 23.9 ± 1.6 | 38.4 ± 1.8 | 16.3 ± 1.4 | 33.9 ± 1.8 | 2.7 ± 0.6 | 9.7 ± 1.1 | |
| Bachelor’s/Graduate degree (n = 561) | 92.0 ± 1.1 | 74.7 ± 1.8 | 20.9 ± 1.7 | 20.7 ± 1.7 | 43.9 ± 2.1 | 10.7 ± 1.3 | 17.3 ± 1.6 | 2.9 ± 0.7 | 6.6 ± 1.0 | |
| p-value | <0.01 | <0.01 | <0.01 | 0.34 | 0.03 | 0.01 | <0.01 | 0.96 | 0.13 | |
| Marital status | Single (n = 570) | 82.6 ± 1.6 | 58.4 ± 2.1 | 20.4 ± 1.7 | 23.0 ± 1.8 | 31.2 ± 1.9 | 17.4 ± 1.6 | 28.1 ± 1.9 | 3.5 ± 0.8 | 8.6 ± 1.2 |
| Married (n = 1113) | 89.3 ± 0.9 | 68.4 ± 1.4 | 15.0 ± 1.1 | 22.7 ± 1.3 | 43.8 ± 1.5 | 12.7 ± 1.0 | 27.2 ± 1.3 | 2.5 ± 0.5 | 8.3 ± 0.8 | |
| p-value | <0.01 | <0.01 | 0.01 | 0.91 | <0.01 | 0.01 | 0.71 | 0.25 | 0.82 | |
| Race/ethnicity | White (n = 1063) | 90.9 ± 0.9 | 69.5 ± 1.4 | 16.4 ± 1.1 | 23.4 ± 1.3 | 43.9 ± 1.5 | 15.0 ± 1.1 | 30.1 ± 1.4 | 3.0 ± 0.5 | 8.7 ± 0.9 |
| Black (n = 194) | 77.3 ± 3.0 | 45.4 ± 3.6 | 17.0 ± 2.7 | 21.1 ± 2.9 | 30.4 ± 3.3 | 14.9 ± 2.6 | 21.6 ± 3.0 | 3.1 ± 1.2 | 10.8 ± 2.2 | |
| Hispanic (n = 271) | 81.9 ± 2.3 | 64.6 ± 2.9 | 12.9 ± 2.0 | 21.4 ± 2.5 | 32.5 ± 2.8 | 10.7 ± 1.9 | 24.7 ± 2.6 | 2.2 ± 0.9 | 7.4 ± 1.6 | |
| Other (n = 155) | 81.9 ± 3.1 | 59.4 ± 3.9 | 26.5 ± 3.5 | 23.2 ± 3.4 | 33.5 ± 3.8 | 14.8 ± 2.9 | 21.9 ± 3.3 | 2.6 ± 1.3 | 5.2 ± 1.8 | |
| p-value | <0.01 | <0.01 | <0.01 | 0.84 | <0.01 | 0.34 | 0.02 | 0.90 | 0.26 | |
| Body mass index (kg/m2) | <25.0 (n = 659) | 85.9 ± 1.4 | 60.1 ± 1.9 | 20.5 ± 1.6 | 22.3 ± 1.6 | 36.7 ± 1.9 | 14.4 ± 1.4 | 23.1 ± 1.6 | 3.3 ± 0.7 | 7.0 ± 1.0 |
| 25.0–29.9 (n = 844) | 87.7 ± 1.1 | 69.1 ± 1.6 | 15.5 ± 1.2 | 23.0 ± 1.4 | 42.1 ± 1.7 | 14.1 ± 1.2 | 30.7 ± 1.6 | 2.4 ± 0.5 | 8.4 ± 1.0 | |
| ≥30.0 (n = 163) | 89.6 ± 2.4 | 65.6 ± 3.7 | 9.2 ± 2.3 | 24.5 ± 3.4 | 40.5 ± 3.8 | 16.0 ± 2.9 | 30.7 ± 3.6 | 3.7 ± 1.5 | 13.5 ± 2.7 | |
| p-value | 0.37 | <0.01 | <0.01 | 0.83 | 0.11 | 0.83 | <0.01 | 0.44 | 0.03 | |
| Alcohol consumption | None (n = 401) | 75.3 ± 2.2 | 46.4 ± 2.5 | 13.0 ± 1.7 | 20.0 ± 2.0 | 32.4 ± 2.3 | 15.7 ± 1.8 | 21.2 ± 2.0 | 4.0 ± 1.0 | 8.2 ± 1.4 |
| <1.33 g/day (n = 320) | 86.9 ± 1.9 | 61.6 ± 2.7 | 20.0 ± 2.2 | 21.6 ± 2.3 | 36.3 ± 2.7 | 17.2 ± 2.1 | 28.1 ± 2.5 | 3.8 ± 1.1 | 10.0 ± 1.7 | |
| 1.34–3.99 g/day (n = 320) | 91.6 ± 1.6 | 70.3 ± 2.6 | 15.0 ± 2.0 | 21.6 ± 2.3 | 41.9 ± 2.8 | 11.9 ± 1.8 | 27.8 ± 2.5 | 2.2 ± 0.8 | 8.4 ± 1.6 | |
| 4.00–8.93 g/day (n = 322) | 91.9 ± 1.5 | 75.5 ± 2.4 | 18.9 ± 2.2 | 25.2 ± 2.4 | 42.9 ± 2.8 | 11.5 ± 1.8 | 28.6 ± 2.5 | 0.9 ± 0.5 | 5.9 ± 1.3 | |
| >8.93 g/day (n = 320) | 92.5 ± 1.5 | 75.9 ± 2.4 | 18.1 ± 2.2 | 26.6 ± 2.5 | 46.3 ± 2.8 | 14.7 ± 2.0 | 33.4 ± 2.6 | 3.1 ± 1.0 | 9.4 ± 1.6 | |
| p-value | <0.01 | <0.01 | 0.07 | 0.20 | <0.01 | 0.17 | <0.01 | 0.10 | 0.39 | |
| Aerobic exercise duration | <101 min/week (n = 414) | 87.2 ± 1.6 | 64.5 ± 2.4 | 16.4 ± 1.8 | 24.4 ± 2.1 | 44.2 ± 2.4 | 12.3 ± 1.6 | 28.0 ± 2.2 | 1.9 ± 0.7 | 7.5 ± 1.3 |
| 101–180 min/week (n = 384) | 89.3 ± 1.6 | 66.7 ± 2.4 | 14.8 ± 1.8 | 19.8 ± 2.0 | 41.7 ± 2.5 | 17.4 ± 1.9 | 25.3 ± 2.2 | 1.8 ± 0.7 | 6.5 ± 1.3 | |
| 181–290 min/week (n = 462) | 88.3 ± 1.5 | 66.9 ± 2.2 | 18.4 ± 1.8 | 25.1 ± 2.0 | 39.2 ± 2.3 | 12.8 ± 1.6 | 28.6 ± 2.1 | 4.1 ± 0.9 | 8.2 ± 1.3 | |
| ≥291 min/week (n = 409) | 84.8 ± 1.8 | 63.1 ± 2.4 | 17.8 ± 1.9 | 22.2 ± 2.1 | 34.0 ± 2.3 | 15.4 ± 1.8 | 28.4 ± 2.2 | 3.4 ± 0.9 | 11.5 ± 1.6 | |
| p-value | 0.25 | 0.61 | 0.53 | 0.26 | 0.02 | 0.13 | 0.70 | 0.12 | 0.06 | |
| Resistance training duration | <46 min/week (n = 402) | 90.5 ± 1.5 | 67.9 ± 2.3 | 19.7 ± 2.0 | 23.9 ± 2.1 | 46.3 ± 2.5 | 14.9 ± 1.8 | 21.9 ± 2.1 | 2.7 ± 0.8 | 9.2 ± 1.4 |
| 46–135 min/week (n = 470) | 90.6 ± 1.3 | 70.6 ± 2.1 | 14.5 ± 1.6 | 25.3 ± 2.0 | 44.3 ± 2.3 | 14.7 ± 1.6 | 27.4 ± 2.1 | 3.0 ± 2.1 | 7.0 ± 1.2 | |
| 136–270 min/week (n = 395) | 86.6 ± 1.7 | 62.5 ± 2.4 | 16.7 ± 1.9 | 21.5 ± 2.1 | 36.5 ± 2.4 | 13.9 ± 1.7 | 27.6 ± 2.2 | 3.0 ± 0.9 | 8.1 ± 1.4 | |
| ≥271 min/week (n = 389) | 82.0 ± 1.9 | 59.6 ± 2.3 | 17.7 ± 1.9 | 21.6 ± 2.1 | 31.1 ± 2.3 | 14.4 ± 1.8 | 33.4 ± 2.4 | 2.8 ± 0.8 | 9.8 ± 1.5 | |
| p-value | <0.01 | <0.01 | 0.23 | 0.48 | <0.01 | 0.98 | 0.01 | 0.99 | 0.48 | |
| Sleep duration | ≤4 h/night (n = 65) | 90.7 ± 3.6 | 52.3 ± 6.2 | 12.3 ± 4.1 | 26.2 ± 5.5 | 38.5 ± 6.0 | 16.9 ± 4.6 | 49.2 ± 6.2 | 3.1 ± 2.1 | 16.9 ± 4.6 |
| 5–6 h/night (n = 817) | 89.4 ± 1.1 | 67.8 ± 1.6 | 15.9 ± 1.3 | 21.6 ± 1.4 | 42.5 ± 1.7 | 14.1 ± 1.2 | 32.2 ± 1.6 | 2.7 ± 0.6 | 9.8 ± 1.0 | |
| 7–8 h/night (n = 716) | 86.6 ± 1.3 | 64.5 ± 1.8 | 18.7 ± 1.5 | 23.7 ± 1.6 | 38.1 ± 1.8 | 14.1 ± 1.3 | 21.4 ± 1.5 | 2.8 ± 0.6 | 6.0 ± 0.9 | |
| ≥9 h/night (n = 28) | 75.0 ± 8.2 | 53.6 ± 9.4 | 10.7 ± 5.8 | 25.0 ± 8.2 | 25.0 ± 8.2 | 17.9 ± 7.2 | 21.4 ± 7.8 | 7.1 ± 4.9 | 10.7 ± 5.8 | |
| p-value | 0.05 | 0.03 | 0.26 | 0.72 | 0.12 | 0.87 | <0.01 | 0.58 | <0.01 | |
| Rank | Junior enlisted (n = 442) | 76.2 ± 2.0 | 50.0 ± 2.4 | 17.0 ± 1.8 | 25.9 ± 2.1 | 29.0 ± 2.2 | 17.2 ± 1.8 | 29.4 ± 2.2 | 3.8 ± 0.9 | 8.6 ± 1.3 |
| Senior enlisted (n = 786) | 89.7 ± 1.1 | 67.2 ± 1.7 | 15.1 ± 1.3 | 22.3 ± 1.5 | 41.1 ± 1.8 | 14.5 ± 1.3 | 32.6 ± 1.7 | 1.9 ± 0.5 | 9.7 ± 1.1 | |
| Warrant officer (n = 38) | 89.5 ± 5.0 | 65.8 ± 7.7 | 7.9 ± 4.4 | 18.4 ± 6.3 | 50.0 ± 8.1 | 13.2 ± 5.5 | 28.9 ± 7.4 | 7.9 ± 4.4 | 7.9 ± 4.4 | |
| Junior officer (n = 235) | 91.1 ± 1.9 | 77.4 ± 2.7 | 18.3 ± 2.5 | 19.1 ± 2.6 | 45.5 ± 3.2 | 11.1 ± 2.0 | 18.7 ± 2.5 | 2.1 ± 0.9 | 4.7 ± 1.4 | |
| Senior officer (n = 182) | 96.2 ± 1.4 | 75.8 ± 3.2 | 23.9 ± 3.2 | 24.2 ± 3.2 | 48.9 ± 3.7 | 10.4 ± 2.3 | 12.1 ± 2.4 | 4.4 ± 1.5 | 7.1 ± 1.9 | |
| p-value | <0.01 | <0.01 | 0.04 | 0.35 | <0.01 | 0.12 | <0.01 | 0.06 | 0.18 | |
| Special Operations | No (n = 1632) | 86.9 ± 0.8 | 65.1 ± 1.2 | 16.9 ± 0.9 | 22.6 ± 1.0 | 39.5 ± 1.2 | 14.3 ± 0.9 | 27.3 ± 1.1 | 2.8 ± 0.4 | 8.5 ± 0.7 |
| Yes (n = 41) | 97.6 ± 2.4 | 70.7 ± 7.1 | 12.2 ± 5.1 | 31.7 ± 7.3 | 46.3 ± 7.8 | 14.6 ± 5.5 | 41.5 ± 7.7 | 4.9 ± 3.4 | 2.4 ± 2.4 | |
| p-value | 0.04 | 0.46 | 0.43 | 0.17 | 0.38 | 0.95 | 0.05 | 0.44 | 0.17 | |
| Service | Navy (n = 700) | 88.4 ± 1.2 | 66.9 ± 1.8 | 20.6 ± 1.5 | 24.6 ± 1.6 | 41.6 ± 1.9 | 13.7 ± 1.3 | 21.1 ± 1.5 | 2.7 ± 0.6 | 9.1 ± 1.1 |
| Marine Corps (n = 983) | 86.1 ± 1.1 | 63.7 ± 1.5 | 14.1 ± 1.1 | 21.6 ± 1.3 | 38.1 ± 1.5 | 14.6 ± 1.1 | 32.0 ± 1.5 | 3.0 ± 0.5 | 7.8 ± 0.9 | |
| p-value | 0.15 | 0.18 | <0.01 | 0.15 | 0.16 | 0.59 | <0.01 | 0.77 | 0.34 |
| Variable | Strata | Any Caffeine | Coffee | Hot Tea | Other Tea | Cola | Other Soda | Energy Drink | Gum/Medication |
|---|---|---|---|---|---|---|---|---|---|
| Group | All (n = 1465) | 226 ± 5 | 130 ± 4 | 8 ± 1 | 18 ± 2 | 16 ± 1 | 5 ± 1 | 37 ± 2 | 11 ± 2 |
| Gender | Men (n = 1052) | 242 ± 7 | 142 ± 5 | 5 ± 1 | 21 ± 2 | 18 ± 1 | 6 ± 1 | 43 ± 2 | 9 ± 2 |
| Women (n = 413) | 183 ± 8 | 99 ± 6 | 17 ± 2 | 12 ± 2 | 11 ± 1 | 4 ± 1 | 23 ± 3 | 17 ± 3 | |
| p-value | <0.01 | <0.01 | <0.01 | 0.03 | <0.01 | 0.28 | <0.01 | 0.04 | |
| Age (years) | 18–24 (n = 340) | 203 ± 12 | 93 ± 8 | 10 ± 2 | 24 ± 5 | 12 ± 1 | 9 ± 2 | 42 ± 4 | 14 ± 3 |
| 25–29 (n = 361) | 201 ± 11 | 106 ± 7 | 8 ± 1 | 16 ± 4 | 13 ± 1 | 4 ± 1 | 41 ± 4 | 12 ± 6 | |
| 30–39 (n = 500) | 241 ± 8 | 146 ± 7 | 7 ± 1 | 17 ± 3 | 19 ± 2 | 5 ± 1 | 39 ± 3 | 9 ± 2 | |
| ≥40 (n = 263) | 261 ± 13 | 180 ± 11 | 10 ± 2 | 16 ± 3 | 19 ± 2 | 4 ± 1 | 21 ± 4 | 10 ± 3 | |
| p-value | <0.01 | <0.01 | 0.16 | 0.40 | <0.01 | 0.03 | <0.01 | 0.79 | |
| Education | Some high school/high school graduate (n = 311) | 213 ± 12 | 100 ± 9 | 9 ± 2 | 24 ± 5 | 14 ± 2 | 9 ± 2 | 46 ± 5 | 12 ± 3 |
| Some college/Associate’s degree (n = 638) | 226 ± 8 | 122 ± 6 | 8 ± 1 | 21 ± 3 | 15 ± 1 | 6 ± 1 | 43 ± 3 | 12 ± 2 | |
| Bachelor’s/Graduate degree (n = 516) | 233 ± 9 | 157 ± 7 | 9 ± 1 | 11 ± 2 | 19 ± 2 | 2 ± 1 | 24 ± 3 | 10 ± 2 | |
| p-value | 0.39 | <0.01 | 0.47 | 0.02 | 0.08 | <0.01 | <0.01 | 0.95 | |
| Marital status | Single (n = 471) | 209 ± 9 | 107 ± 7 | 12 ± 2 | 20 ± 4 | 13 ± 1 | 7 ± 1 | 37 ± 3 | 13 ± 3 |
| Married (n = 994) | 234 ± 6 | 140 ± 5 | 7 ± 1 | 17 ± 2 | 17 ± 1 | 5 ± 1 | 37 ± 3 | 10 ± 5 | |
| p-value | 0.03 | <0.01 | <0.01 | 0.41 | 0.03 | 0.16 | 0.99 | 0.57 | |
| Race/ethnicity | White (n = 966) | 249 ± 7 | 147 ± 5 | 8 ± 1 | 18 ± 2 | 19 ± 1 | 6 ± 1 | 40 ± 3 | 12 ± 3 |
| Black (n = 150) | 150 ± 14 | 69 ± 8 | 11 ± 2 | 15 ± 5 | 10 ± 2 | 5 ± 2 | 29 ± 5 | 10 ± 3 | |
| Hispanic (n = 222) | 196 ± 12 | 106 ± 7 | 7 ± 1 | 21 ± 6 | 11 ± 2 | 2 ± 1 | 36 ± 5 | 11 ± 3 | |
| Other (n = 127) | 189 ± 14 | 109 ± 12 | 14 ± 3 | 15 ± 3 | 11 ± 3 | 6 ± 2 | 27 ± 5 | 7 ± 5 | |
| p-value | <0.01 | <0.01 | 0.04 | 0.78 | <0.01 | 0.31 | 0.14 | 0.90 | |
| Body mass index (kg/m2) | <25.0 (n = 566) | 198 ± 8 | 112 ± 6 | 11 ± 1 | 17 ± 3 | 15 ± 1 | 7 ± 1 | 28 ± 3 | 7 ± 2 |
| 25.0–29.9 (n = 740) | 247 ± 8 | 143 ± 6 | 7 ± 1 | 19 ± 3 | 16 ± 1 | 4 ± 1 | 43 ± 3 | 13 ± 3 | |
| ≥30.0 (n = 146) | 230 ± 17 | 132 ± 13 | 4 ± 1 | 15 ± 3 | 19 ± 3 | 4 ± 1 | 43 ± 7 | 14 ± 4 | |
| p-value | <0.01 | <0.01 | <0.01 | 0.71 | 0.56 | 0.14 | <0.01 | 0.29 | |
| Alcohol consumption | None (n = 302) | 192 ± 12 | 93 ± 8 | 7 ± 1 | 16 ± 3 | 18 ± 2 | 7 ± 2 | 31 ± 4 | 19 ± 8 |
| <1.34 g/day (n = 278) | 208 ± 11 | 107 ± 8 | 13 ± 2 | 18 ± 4 | 15 ± 2 | 4 ± 1 | 35 ± 5 | 13 ± 3 | |
| 1.34–3.99 g/day (n = 293) | 229 ± 13 | 141 ± 11 | 5 ± 1 | 21 ± 5 | 14 ± 2 | 4 ± 2 | 36 ± 4 | 10 ± 3 | |
| 4.00–8.93 g/day (n = 296) | 237 ± 11 | 147 ± 8 | 8 ± 1 | 15 ± 3 | 15 ± 2 | 4 ± 1 | 38 ± 4 | 9 ± 3 | |
| >8.93 g/day (n = 296) | 263 ± 12 | 159 ± 9 | 9 ± 2 | 21 ± 4 | 18 ± 2 | 5 ± 1 | 47 ± 5 | 5 ± 2 | |
| p-value | <0.01 | <0.01 | <0.01 | 0.76 | 0.43 | 0.22 | 0.02 | 0.20 | |
| Aerobic exercise duration | <101 min/week (n = 361) | 225 ± 10 | 129 ± 8 | 8 ± 1 | 16 ± 3 | 19 ± 2 | 5 ± 2 | 40 ± 5 | 7 ± 2 |
| 101–180 min/week (n = 343) | 225 ± 10 | 131 ± 8 | 8 ± 2 | 18 ± 4 | 19 ± 2 | 6 ± 1 | 34 ± 4 | 9 ± 2 | |
| 181–290 min/week (n = 408) | 234 ± 10 | 139 ± 8 | 9 ± 1 | 21 ± 4 | 14 ± 1 | 5 ± 1 | 37 ± 4 | 10 ± 2 | |
| ≥291 min/week (n = 347) | 219 ± 12 | 119 ± 8 | 8 ± 1 | 17 ± 3 | 12 ± 1 | 5 ± 1 | 37 ± 4 | 19 ± 7 | |
| p-value | 0.79 | 0.39 | 0.95 | 0.71 | <0.01 | 0.88 | 0.79 | 0.11 | |
| Resistance training duration | <46 min/week (n = 364) | 255 ± 11 | 157 ± 10 | 10 ± 2 | 17 ± 3 | 21 ± 2 | 7 ± 2 | 33 ± 4 | 10 ± 2 |
| 46–135 min/week (n = 426) | 215 ± 9 | 126 ± 7 | 7 ± 1 | 19 ± 4 | 16 ± 1 | 5 ± 1 | 35 ± 4 | 7 ± 2 | |
| 136–270 min/week (n = 342) | 213 ± 10 | 128 ± 9 | 9 ± 2 | 15 ± 3 | 15 ± 2 | 4 ± 1 | 34 ± 4 | 9 ± 3 | |
| ≥271 min/week (n = 319) | 222 ± 12 | 106 ± 7 | 8 ± 1 | 22 ± 5 | 11 ± 1 | 6 ± 1 | 48 ± 5 | 21 ± 7 | |
| p-value | 0.02 | <0.01 | 0.60 | 0.60 | <0.01 | 0.45 | 0.03 | 0.06 | |
| Sleep duration | ≤4 h/night (n = 55) | 372 ± 46 | 149 ± 35 | 13 ± 6 | 67 ± 24 | 25 ± 6 | 10 ± 7 | 72 ± 13 | 35 ± 13 |
| 5–6 h/night (n = 730) | 243 ± 8 | 138 ± 6 | 8 ± 1 | 19 ± 3 | 16 ± 1 | 6 ± 1 | 43 ± 3 | 13 ± 2 | |
| 7–8 h/night (n = 620) | 191 ± 6 | 118 ± 5 | 8 ± 1 | 13 ± 2 | 16 ± 1 | 4 ± 1 | 28 ± 3 | 4 ± 1 | |
| ≥9 h/night (n = 21) | 148 ± 25 | 75 ± 20 | 11 ± 9 | 7 ± 2 | 9 ± 4 | 17 ± 8 | 28 ± 10 | 1 ± 1 | |
| p-value | <0.01 | 0.03 | 0.52 | <0.01 | 0.18 | 0.05 | <0.01 | <0.01 | |
| Rank | Junior enlisted (n = 337) | 197 ± 11 | 93 ± 8 | 10 ± 2 | 23 ± 5 | 11 ± 1 | 8 ± 2 | 39 ± 4 | 12 ± 3 |
| Senior enlisted (n = 705) | 235 ± 8 | 126 ± 6 | 8 ± 1 | 20 ± 3 | 16 ± 1 | 6 ± 1 | 44 ± 3 | 15 ± 4 | |
| Warrant officer (n = 34) | 263 ± 39 | 149 ± 26 | 5 ± 3 | 16 ± 9 | 24 ± 7 | 5 ± 3 | 40 ± 14 | 25 ± 17 | |
| Junior officer (n = 214) | 210 ± 11 | 145 ± 9 | 5 ± 1 | 7 ± 1 | 17 ± 2 | 2 ± 1 | 31 ± 6 | 3 ± 1 | |
| Senior officer (n = 175) | 256 ± 13 | 191 ± 12 | 14 ± 3 | 14 ± 3 | 22 ± 3 | 3 ± 2 | 10 ± 3 | 3 ± 1 | |
| p-value | <0.01 | <0.01 | <0.01 | 0.06 | <0.01 | 0.05 | <0.01 | 0.09 | |
| Special Operations | No (n = 1419) | 227 ± 5 | 130 ± 4 | 8 ± 1 | 18 ± 2 | 16 ± 1 | 5 ± 1 | 37 ± 2 | 11 ± 2 |
| Yes (n = 40) | 198 ± 23 | 120 ± 22 | 5 ± 2 | 10 ± 3 | 17 ± 5 | 1 ± 0 | 41 ± 10 | 4 ± 4 | |
| p-value | 0.38 | 0.69 | 0.49 | 0.45 | 0.82 | 0.22 | 0.72 | 0.52 | |
| Service | Navy (n = 619) | 217 ± 7 | 136 ± 6 | 10 ± 1 | 15 ± 2 | 17 ± 1 | 4 ± 1 | 29 ± 3 | 7 ± 1 |
| Marine Corps (n = 846) | 232 ± 7 | 125 ± 5 | 7 ± 1 | 21 ± 3 | 15 ± 1 | 6 ± 1 | 43 ± 2 | 14 ± 3 | |
| p-value | 0.14 | 0.17 | 0.09 | 0.09 | 0.42 | 0.06 | <0.01 | 0.07 |
| Variable | Strata | Caffeine Beverage or Gum/Medication Consumed ≥1 Time/Week | |||||
|---|---|---|---|---|---|---|---|
| Any Caffeine | Coffee | Tea * | Soda † | Energy Drink | Gum/Medication | ||
| (Model 1) | (Model 2) | (Model 3) | (Model 4) | (Model 5) | (Model 6) | ||
| Gender | Men | 1.00 | 1.00 | 1.00 | 1.00 | 1.00 | 1.00 |
| Women | 0.83 (0.57–1.20) | 0.72 (0.55–0.94) | 1.47 (1.14–1.91) | 0.60 (0.46–0.77) | 0.57 (0.42–0.78) | 2.60 (1.67–4.06) | |
| Age (years) | 18–24 | 1.00 | 1.00 | 1.00 | 1.00 | 1.00 | 1.00 |
| 25–29 | 2.01 (1.27–3.18) | 1.19 (0.86–1.65) | 0.96 (0.69–1.32) | 1.09 (0.79–1.49) | 1.28 (0.91–1.80) | 0.63 (0.35–1.13) | |
| 30–39 | 2.28 (1.40–3.70) | 1.76 (1.25–2.49) | 0.97 (0.70–1.35) | 1.47 (1.06–2.02) | 0.92 (0.64–1.32) | 1.00 (0.57–1.74) | |
| ≥40 | 3.30 (1.67–6.55) | 1.56 (1.02–2.40) | 1.06 (0.71–1.60) | 1.23 (0.83–1.82) | 0.43 (0.27–0.71) | 1.70 (0.88–3.28) | |
| Education | Some high school/high school graduate | 1.00 | 1.00 | 1.00 | 1.00 | 1.00 | 1.00 |
| Some college | 1.09 (0.74–1.61) | 1.29 (0.96–1.72) | 0.98 (0.73–1.31) | 0.87 (0.66–1.16) | 1.27 (0.93–1.73) | 1.21 (0.74–2.00) | |
| College degree | 1.18 (0.70–2.00) | 1.73 (1.21–2.48) | 0.86 (0.61–1.21) | 0.81 (0.58–1.13) | 0.62 (0.42–0.91) | 0.77 (0.41–1.43) | |
| Marital status | Single | 1.00 | 1.00 | 1.00 | 1.00 | 1.00 | 1.00 |
| Married | 1.20 (0.84–1.71) | 1.17 (0.91–1.52) | 0.99 (0.77–1.27) | 1.18 (0.93–1.50) | 0.90 (0.69–1.18) | 1.10 (0.72–1.68) | |
| Race/ethnicity | White | 1.00 | 1.00 | 1.00 | 1.00 | 1.00 | 1.00 |
| Black | 0.31 (0.20–0.49) | 0.34 (0.24–0.48) | 0.96 (0.68–1.36) | 0.70 (0.50–0.98) | 0.52 (0.35–0.79) | 0.86 (0.50–1.48) | |
| Hispanic | 0.56 (0.37–0.86) | 1.00 (0.72–1.36) | 0.89 (0.66–1.21) | 0.61 (0.46–0.83) | 0.56 (0.40–0.78) | 0.74 (0.43–1.28) | |
| Other | 0.47 (0.28–0.78) | 0.68 (0.47–1.00) | 1.39 (0.97–2.00) | 0.76 (0.53–1.09) | 0.62 (0.40–0.96) | 0.52 (0.24–1.11) | |
| Body mass index (kg/m2) | <25.0 | 1.00 | 1.00 | 1.00 | 1.00 | 1.00 | 1.00 |
| 25.0–29.9 | 0.94 (0.66–1.35) | 1.49 (1.16–1.91) | 0.94 (0.74–1.19) | 0.93 (0.73–1.17) | 1.40 (1.08–1.83) | 1.43 (0.93–2.21) | |
| ≥30.0 | 1.37 (0.70–2.68) | 1.40 (0.91–2.14) | 0.84 (0.56–1.26) | 0.81 (0.55–1.19) | 1.55 (1.00–2.41) | 2.22 (1.19–4.16) | |
| Alcohol consumption | None | 1.00 | 1.00 | 1.00 | 1.00 | 1.00 | 1.00 |
| <1.33 g/day | 1.73 (1.12–2.70) | 1.53 (1.11–2.13) | 1.22 (0.88–1.70) | 1.07 (0.78–1.47) | 1.75 (1.20–2.55) | 1.29 (0.74–2.25) | |
| 1.33–3.99 g/day | 2.52 (1.53–4.13) | 2.20 (1.57–3.09) | 1.15 (0.82–1.61) | 1.10 (0.80–1.52) | 1.40 (0.96–2.04) | 1.18 (0.66–2.09) | |
| 4.00–8.91 g/day | 2.46 (1.48–4.08) | 2.65 (1.86–3.76) | 1.52 (1.09–2.13) | 0.98 (0.71–1.35) | 1.60 (1.09–2.35) | 0.88 (0.47–1.65) | |
| ≥8.92 g/day | 3.26 (1.90–5.59) | 3.07 (2.14–4.39) | 1.33 (0.94–1.87) | 1.30 (0.94–1.80) | 1.82 (1.25–2.66) | 1.57 (0.89–2.76) | |
| Aerobic exercise duration | <101 min/week | 0.82 (0.54–1.33) | 0.82 (0.58–1.16) | 1.00 (0.72–1.38) | 1.17 (0.86–1.61) | 1.03 (0.72–1.47) | 0.57 (0.33–0.99) |
| 101–180 min/week | 0.95 (0.58–1.56) | 0.80 (0.57–1.13) | 0.84 (0.60–1.17) | 1.21 (0.88–1.66) | 0.94 (0.65–1.35) | 0.53 (0.30–0.94) | |
| 181–290 min/week | 0.92 (0.57–1.47) | 0.89 (0.64–1.24) | 1.11 (0.81–1.52) | 1.05 (0.77–1.42) | 0.99 (0.70–1.39) | 0.72 (0.43–1.19) | |
| ≥291 min/week | 1.00 | 1.00 | 1.00 | 1.00 | 1.00 | 1.00 | |
| Resistance training duration | <46 min/week | 1.69 (1.04–2.76) | 1.07 (0.74–1.53) | 0.99 (0.70–1.39) | 1.60 (1.14–2.23) | 0.78 (0.54–1.14) | 0.98 (0.55–1.75) |
| 46–135 min/week | 1.70 (1.05–2.77) | 1.39 (0.99–1.96) | 0.92 (0.66–1.27) | 1.55 (1.13–2.12) | 1.08 (0.76–1.53) | 0.75 (0.43–1.33) | |
| 136–270 min/week | 1.22 (0.77–1.93) | 0.99 (0.70–1.39) | 0.82 (0.59–1.15) | 1.14 (0.83–1.58) | 0.95 (0.67–1.36) | 0.88 (0.50–1.55) | |
| ≥271 min/week | 1.00 | 1.00 | 1.00 | 1.00 | 1.00 | 1.00 | |
| Sleep duration | ≤4 h/night | 1.51 (0.46–4.90) | 0.82 (0.31–2.16) | 1.48 (0.55–4.00) | 2.59 (0.96–7.00) | 3.18 (1.08–9.38) | 1.70 (0.41–7.04) |
| 5–6 h/night | 1.90 (0.72–5.01) | 1.30 (0.57–2.98) | 1.27 (0.54–2.97) | 2.14 (0.91–5.06) | 1.65 (0.63–4.30) | 0.98 (0.28–3.46) | |
| 7–8 h/night | 1.00 | 1.00 | 1.00 | 1.00 | 1.00 | 1.00 | |
| ≥9 h/night | 1.30 (0.49–3.43) | 1.06 (0.46–2.43) | 1.38 (0.59–3.24) | 1.70 (0.72–4.02) | 0.92 (0.35–2.41) | 0.56 (0.15–2.00) | |
| Service | Marine Corps | 1.02 (0.72–1.46) | 0.99 (0.78–1.27) | 0.80 (0.64–1.01) | 0.94 (0.75–1.17) | 1.71 (1.32–2.22) | 0.83 (0.56–1.24) |
| Navy | 1.00 | 1.00 | 1.00 | 1.00 | 1.00 | 1.00 | |
| Nagelkerke R2 | 0.15 | 0.16 | 0.03 | 0.08 | 0.16 | 0.09 | |
| Variable | Strata | Any Caffeine | Coffee | Hot Tea | Other Tea | Cola | Other Soda | Energy Drink | Gum/Medication |
|---|---|---|---|---|---|---|---|---|---|
| Group | All (n = 846) | 232 ± 7 | 125 ± 5 | 7 ± 1 | 21 ± 3 | 15 ± 1 | 6 ± 1 | 43 ± 3 | 14 ± 3 |
| Gender | Men (n = 605) | 251 ± 9 | 137 ± 6 | 5 ± 1 | 24 ± 4 | 18 ± 1 | 7 ± 1 | 49 ± 4 | 11 ± 4 |
| Women (n = 241) | 188 ± 12 | 93 ± 8 | 15 ± 2 | 14 ± 4 | 9 ± 1 | 6 ± 2 | 28 ± 4 | 22 ± 5 | |
| p-value | <0.01 | <0.01 | <0.01 | 0.10 | <0.01 | 0.75 | <0.01 | 0.10 | |
| Age (years) | 18–24 (n = 237) | 214 ± 14 | 94 ± 9 | 10 ± 2 | 26 ± 6 | 12 ± 2 | 10 ± 3 | 45 ± 5 | 16 ± 4 |
| 25–29 (n = 212) | 212 ± 16 | 109 ± 10 | 6 ± 2 | 19 ± 6 | 13 ± 2 | 3 ± 1 | 44 ± 6 | 17 ± 10 | |
| 30–39 (n = 285) | 248 ± 12 | 140 ± 9 | 6 ± 1 | 18 ± 4 | 19 ± 2 | 7 ± 2 | 49 ± 5 | 11 ± 3 | |
| ≥40 (n = 112) | 270 ± 20 | 181 ± 17 | 9 ± 3 | 21 ± 6 | 18 ± 3 | 4 ± 2 | 23 ± 7 | 13 ± 5 | |
| p-value | 0.04 | <0.01 | 0.19 | 0.64 | 0.08 | 0.07 | 0.04 | 0.89 | |
| Education | Some high school/high school graduate (n = 230) | 221 ± 15 | 101 ± 10 | 8 ± 2 | 29 ± 6 | 14 ± 2 | 10 ± 3 | 46 ± 5 | 13 ± 4 |
| Some college/Associate’s degree (n = 382) | 230 ± 11 | 119 ± 8 | 7 ± 1 | 21 ± 4 | 15 ± 2 | 7 ± 2 | 48 ± 4 | 13 ± 3 | |
| Bachelor’s/Graduate degree (n = 234) | 247 ± 15 | 158 ± 10 | 8 ± 2 | 12 ± 3 | 18 ± 2 | 2 ± 1 | 32 ± 6 | 17 ± 10 | |
| p-value | 0.44 | <0.01 | 0.93 | 0.07 | 0.43 | 0.02 | 0.07 | 0.89 | |
| Marital status | Single (n = 256) | 216 ± 13 | 104 ± 9 | 12 ± 2 | 25 ± 6 | 12 ± 2 | 7 ± 2 | 41 ± 5 | 15 ± 4 |
| Married (n = 590) | 240 ± 9 | 134 ± 6 | 5 ± 1 | 19 ± 3 | 17 ± 1 | 6 ± 1 | 45 ± 4 | 14 ± 4 | |
| p-value | 0.14 | <0.01 | <0.01 | 0.27 | 0.02 | 0.53 | 0.53 | 0.87 | |
| Race/ethnicity | White (n = 533) | 257 ± 10 | 143 ± 7 | 6 ± 1 | 20 ± 3 | 18 ± 36 | 7 ± 1 | 48 ± 4 | 14 ± 5 |
| Black (n = 80) | 178 ± 23 | 84 ± 13 | 8 ± 3 | 20 ± 9 | 10 ± 3 | 6 ± 5 | 35 ± 8 | 15 ± 6 | |
| Hispanic (n = 166) | 200 ± 14 | 104 ± 9 | 9 ± 2 | 24 ± 8 | 12 ± 2 | 2 ± 1 | 34 ± 5 | 14 ± 4 | |
| Other (n = 67) | 182 ± 17 | 80 ± 12 | 11 ± 3 | 21 ± 5 | 11 ± 3 | 10 ± 4 | 38 ± 8 | 12 ± 9 | |
| p-value | <0.01 | <0.01 | 0.43 | 0.94 | 0.02 | 0.25 | 0.18 | 0.99 | |
| Body mass index (kg/m2) | <25.0 (n = 355) | 202 ± 11 | 105 ± 8 | 9 ± 1 | 23 ± 4 | 15 ± 2 | 9 ± 2 | 33 ± 4 | 10 ± 3 |
| 25.0–29.9 (n = 440) | 259 ± 11 | 142 ± 7 | 6 ± 1 | 20 ± 4 | 16 ± 1 | 5 ± 1 | 51 ± 4 | 18 ± 6 | |
| ≥30.0 (n = 42) | 217 ± 32 | 109 ± 22 | 3 ± 1 | 18 ± 8 | 16 ± 5 | 1 ± 1 | 55 ± 16 | 15 ± 7 | |
| p-value | <0.01 | <0.01 | 0.21 | 0.88 | 0.95 | 0.10 | <0.01 | 0.47 | |
| Alcohol consumption | None (n = 195) | 190 ± 17 | 86 ± 10 | 4 ± 1 | 19 ± 5 | 17 ± 3 | 9 ± 2 | 30 ± 5 | 26 ± 12 |
| <1.34 g/day(n = 161) | 213 ± 15 | 103 ± 10 | 13 ± 3 | 20 ± 7 | 10 ± 2 | 8 ± 3 | 42 ± 7 | 16 ± 5 | |
| 1.34–3.99 g/day (n = 167) | 237 ± 18 | 138 ± 14 | 5 ± 1 | 24 ± 7 | 17 ± 3 | 5 ± 1 | 40 ± 6 | 10 ± 3 | |
| 4.00–8.93 g/day (n = 155) | 258 ± 17 | 145 ± 12 | 8 ± 2 | 21 ± 6 | 16 ± 3 | 6 ± 3 | 49 ± 6 | 14 ± 5 | |
| >8.93 g/day (n = 168) | 270 ± 15 | 159 ± 12 | 9 ± 2 | 21 ± 5 | 17 ± 3 | 4 ± 1 | 58 ± 8 | 2 ± 1 | |
| p-value | <0.01 | <0.01 | <0.01 | 0.99 | 0.21 | 0.51 | 0.02 | 0.14 | |
| Aerobic exercise duration | <101 min/week (n = 191) | 234 ± 15 | 126 ± 10 | 7 ± 2 | 17 ± 5 | 18 ± 2 | 8 ± 3 | 50 ± 7 | 6 ± 3 |
| 101–180 min/week (n = 192) | 237 ± 14 | 130 ± 11 | 5 ± 1 | 24 ± 8 | 16 ± 3 | 7 ± 2 | 42 ± 6 | 13 ± 4 | |
| 181–290 min/week (n = 230) | 238 ± 14 | 129 ± 11 | 9 ± 2 | 22 ± 5 | 16 ± 2 | 5 ± 2 | 44 ± 5 | 13 ± 4 | |
| ≥291 min/week (n = 229) | 224 ± 16 | 117 ± 10 | 8 ± 2 | 20 ± 5 | 12 ± 2 | 5 ± 2 | 39 ± 5 | 23 ± 10 | |
| p-value | 0.89 | 0.80 | 0.32 | 0.85 | 0.16 | 0.65 | 0.58 | 0.28 | |
| Resistance training duration | <46 min/week (n = 173) | 273 ± 19 | 155 ± 15 | 9 ± 2 | 23 ± 6 | 21 ± 3 | 11 ± 3 | 42 ± 7 | 12 ± 4 |
| 46–135 min/week (n = 222) | 225 ± 14 | 123 ± 10 | 5 ± 1 | 25 ± 7 | 14 ± 2 | 6 ± 2 | 43 ± 6 | 9 ± 3 | |
| 136–270 min/week (n = 219) | 208 ± 12 | 122 ± 10 | 8 ± 2 | 12 ± 2 | 15 ± 2 | 4 ± 1 | 35 ± 4 | 11 ± 3 | |
| ≥271 min/week (n = 224) | 235 ± 16 | 107 ± 8 | 9 ± 2 | 24 ± 6 | 12 ± 2 | 6 ± 2 | 52 ± 6 | 25 ± 11 | |
| p-value | 0.03 | 0.02 | 0.22 | 0.26 | 0.03 | 0.21 | 0.22 | 0.21 | |
| Sleep duration | ≤4 h/night (n = 41) | 378 ± 53 | 151 ± 41 | 15 ± 8 | 67 ± 26 | 23 ± 6 | 12 ± 9 | 71 ± 15 | 39 ± 17 |
| 5–6 h/night (n = 437) | 249 ± 10 | 132 ± 7 | 7 ± 1 | 22 ± 4 | 15 ± 1 | 7 ± 2 | 52 ± 4 | 15 ± 3 | |
| 7–8 h/night (n = 333) | 187 ± 9 | 111 ± 7 | 8 ± 1 | 14 ± 3 | 16 ± 2 | 4 ± 1 | 30 ± 4 | 4 ± 2 | |
| ≥9 h/night (n = 10) | 141 ± 44 | 63 ± 19 | 0 ± 0 | 7 ± 3 | 7 ± 5 | 27 ± 15 | 35 ± 10 | 3 ± 3 | |
| p-value | <0.01 | 0.08 | 0.14 | <0.01 | 0.36 | 0.05 | <0.01 | <0.01 | |
| Rank | Junior enlisted (n = 222) | 206 ± 15 | 89 ± 10 | 10 ± 2 | 30 ± 7 | 11 ± 2 | 9 ± 2 | 45 ± 5 | 13 ± 4 |
| Senior enlisted (n = 424) | 243 ± 11 | 124 ± 7 | 7 ± 1 | 21 ± 4 | 17 ± 2 | 7 ± 2 | 48 ± 4 | 19 ± 6 | |
| Warrant officer (n = 30) | 283 ± 43 | 163 ± 28 | 6 ± 4 | 15 ± 10 | 24 ± 8 | 5 ± 4 | 44 ± 16 | 27 ± 19 | |
| Junior officer (n = 104) | 217 ± 17 | 154 ± 14 | 5 ± 1 | 6 ± 1 | 13 ± 2 | 2 ± 1 | 37 ± 10 | 1 ± 1 | |
| Senior officer (n = 66) | 253 ± 20 | 187 ± 19 | 11 ± 5 | 14 ± 8 | 23 ± 5 | 1 ± 1 | 18 ± 60 | 1 ± 1 | |
| p-value | 0.13 | <0.01 | 0.30 | 0.12 | 0.02 | 0.25 | 0.08 | 0.23 | |
| Special Operations | No (n = 827) | 233 ± 8 | 125 ± 5 | 7 ± 1 | 21 ± 3 | 15 ± 1 | 6 ± 1 | 44 ± 3 | 14 ± 3 |
| Yes (n = 16) | 216 ± 48 | 154 ± 42 | 7 ± 5 | 9 ± 5 | 21 ± 7 | 1 ± 1 | 24 ± 10 | 0 ± 0 | |
| p-value | 0.75 | 0.45 | 0.99 | 0.54 | 0.50 | 0.43 | 0.36 | 0.53 |
| Variable | Strata | Any Caffeine | Coffee | Hot Tea | Other Tea | Cola | Other Soda | Energy Drink | Gum/Medication |
|---|---|---|---|---|---|---|---|---|---|
| Group | All (n = 619) | 217 ± 7 | 136 ± 6 | 10 ± 1 | 15 ± 1 | 17 ± 1 | 4 ± 1 | 29 ± 3 | 7 ± 1 |
| Gender | Men (n = 447) | 232 ± 9 | 148 ± 8 | 6 ± 1 | 16 ± 3 | 19 ± 2 | 5 ± 1 | 33 ± 3 | 6 ± 1 |
| Women (n = 172) | 176 ± 10 | 106 ± 8 | 20 ± 3 | 9 ± 2 | 12 ± 2 | 2 ± 1 | 16 ± 3 | 11 ± 3 | |
| p–value | <0.01 | <0.01 | <0.01 | 0.15 | 0.04 | 0.07 | <0.01 | 0.10 | |
| Age (years) | 18–24 (n = 103) | 179 ± 20 | 90 ± 13 | 11 ± 3 | 18 ± 8 | 11 ± 2 | 6 ± 2 | 34 ± 7 | 9 ± 3 |
| 25–29 (n = 149) | 184 ± 12 | 101 ± 9 | 10 ± 2 | 13 ± 3 | 13 ± 2 | 5 ± 2 | 37 ± 6 | 6 ± 3 | |
| 30–39 (n = 215) | 231 ± 12 | 153 ± 11 | 8 ± 2 | 15 ± 4 | 21 ± 3 | 2 ± 1 | 25 ± 4 | 6 ± 2 | |
| ≥40 (n = 151) | 217 ± 7 | 179 ± 15 | 11 ± 3 | 12 ± 2 | 20 ± 3 | 4 ± 2 | 19 ± 5 | 9 ± 3 | |
| p–value | <0.01 | <0.01 | 0.72 | 0.80 | 0.03 | 0.20 | 0.07 | 0.81 | |
| Education | Some high school/high school graduate (n = 81) | 188 ± 22 | 96 ± 17 | 12 ± 4 | 9 ± 2 | 15 ± 5 | 5 ± 2 | 43 ± 10 | 7 ± 3 |
| Some college/Associate’s degree (n = 256) | 220 ± 12 | 127 ± 10 | 8 ± 2 | 21 ± 5 | 15 ± 2 | 5 ± 1 | 36 ± 4 | 9 ± 2 | |
| Bachelor’s/Graduate degree (n = 282) | 222 ± 10 | 156 ± 9 | 11 ± 2 | 11 ± 1 | 19 ± 2 | 2 ± 1 | 17 ± 3 | 5 ± 2 | |
| p–value | 0.32 | <0.01 | 0.41 | 0.06 | 0.25 | 0.16 | <0.01 | 0.38 | |
| Marital status | Single (n = 215) | 201 ± 13 | 111 ± 10 | 12 ± 2 | 14 ± 4 | 15 ± 2 | 6 ± 2 | 33 ± 4 | 10 ± 3 |
| Married (n = 404) | 225 ± 9 | 150 ± 8 | 9 ± 1 | 15 ± 2 | 18 ± 2 | 3 ± 1 | 26 ± 3 | 6 ± 1 | |
| p–value | 0.12 | <0.01 | 0.15 | 0.92 | 0.35 | 0.04 | 0.20 | 0.10 | |
| Race/ethnicity | White (n = 433) | 240 ± 9 | 152 ± 8 | 9 ± 1 | 16 ± 3 | 19 ± 2 | 4 ± 1 | 30 ± 3 | 9 ± 2 |
| Black (n = 70) | 117 ± 12 | 52 ± 8 | 14 ± 4 | 10 ± 3 | 11 ± 3 | 5 ± 1 | 22 ± 6 | 4 ± 2 | |
| Hispanic (n = 56) | 184 ± 17 | 112 ± 14 | 3 ± 1 | 13 ± 3 | 10 ± 2 | 2 ± 1 | 40 ± 9 | 3 ± 2 | |
| Other (n = 60) | 197 ± 24 | 142 ± 21 | 18 ± 6 | 7 ± 2 | 12 ± 5 | 1 ± 1 | 15 ± 6 | 2 ± 2 | |
| p–value | <0.01 | <0.01 | 0.02 | 0.55 | 0.07 | 0.57 | 0.13 | 0.23 | |
| Body mass index (kg/m2) | <25.0 (n = 211) | 190 ± 12 | 123 ± 10 | 15 ± 3 | 8 ± 1 | 16 ± 3 | 4 ± 1 | 21 ± 4 | 4 ± 1 |
| 25.0–29.9 (n = 300) | 230 ± 11 | 143 ± 9 | 8 ± 1 | 19 ± 4 | 16 ± 2 | 3 ± 1 | 31 ± 4 | 7 ± 2 | |
| ≥30.0 (n = 104) | 234 ± 18 | 141 ± 16 | 4 ± 1 | 13 ± 3 | 20 ± 3 | 5 ± 2 | 38 ± 7 | 14 ± 5 | |
| p–value | 0.03 | 0.27 | <0.01 | 0.10 | 0.66 | 0.81 | 0.05 | 0.04 | |
| Alcohol consumption | None (n = 107) | 195 ± 16 | 107 ± 13 | 12 ± 3 | 11 ± 3 | 21 ± 4 | 4 ± 1 | 34 ± 7 | 6 ± 3 |
| <1.34 g/day(n = 117) | 201 ± 16 | 112 ± 14 | 13 ± 4 | 14 ± 3 | 21 ± 4 | 7 ± 3 | 25 ± 6 | 8 ± 3 | |
| 1.34–3.99 g/day (n = 126) | 217 ± 18 | 144 ± 15 | 6 ± 1 | 18 ± 7 | 12 ± 2 | 3 ± 2 | 24 ± 5 | 9 ± 4 | |
| 4.00–8.93 g/day (n = 141) | 213 ± 13 | 149 ± 12 | 8 ± 1 | 9 ± 2 | 13 ± 2 | 3 ± 1 | 27 ± 5 | 4 ± 2 | |
| >8.93 g/day (n = 128) | 252 ± 18 | 159 ± 15 | 10 ± 3 | 21 ± 7 | 19 ± 3 | 3 ± 1 | 32 ± 6 | 9 ± 3 | |
| p–value | 0.11 | 0.03 | 0.22 | 0.40 | 0.10 | 0.34 | 0.70 | 0.61 | |
| Aerobic exercise duration | <101 min/week (n = 170) | 216 ± 13 | 132 ± 11 | 9 ± 2 | 14 ± 2 | 21 ± 3 | 2 ± 1 | 29 ± 5 | 9 ± 3 |
| 101–180 min/week (n = 151) | 210 ± 13 | 132 ± 12 | 13 ± 3 | 11 ± 2 | 22 ± 4 | 5 ± 2 | 25 ± 5 | 4 ± 2 | |
| 181–290 min/week (n = 178) | 229 ± 15 | 152 ± 12 | 9 ± 2 | 20 ± 7 | 11 ± 2 | 4 ± 2 | 27 ± 5 | 6 ± 2 | |
| ≥291 min/week (n = 118) | 210 ± 18 | 124 ± 15 | 9 ± 2 | 12 ± 2 | 14 ± 2 | 5 ± 2 | 35 ± 6 | 12 ± 4 | |
| p–value | 0.78 | 0.43 | 0.55 | 0.41 | 0.02 | 0.50 | 0.62 | 0.17 | |
| Resistance training duration | <46 min/week (n = 191) | 238 ± 13 | 159 ± 12 | 10 ± 2 | 13 ± 2 | 21 ± 3 | 3 ± 1 | 23 ± 5 | 9 ± 3 |
| 46–135 min/week (n = 204) | 205 ± 11 | 129 ± 10 | 10 ± 2 | 13 ± 2 | 18 ± 2 | 5 ± 2 | 26 ± 4 | 4 ± 1 | |
| 136–270 min/week (n = 123) | 222 ± 20 | 137 ± 16 | 12 ± 3 | 20 ± 7 | 13 ± 3 | 2 ± 1 | 32 ± 6 | 7 ± 3 | |
| ≥271 min/week (n = 95) | 192 ± 18 | 104 ± 11 | 6 ± 2 | 16 ± 9 | 10 ± 2 | 6 ± 3 | 40 ± 7 | 10 ± 4 | |
| p–value | 0.14 | 0.03 | 0.44 | 0.66 | 0.04 | 0.28 | 0.16 | 0.46 | |
| Sleep duration | ≤4 h/night (n = 14) | 353 ± 93 | 143 ± 65 | 7 ± 7 | 69 ± 59 | 30 ± 13 | 3 ± 2 | 76 ± 29 | 24 ± 14 |
| 5–6 h/night (n = 293) | 234 ± 11 | 148 ± 10 | 10 ± 2 | 15 ± 3 | 19 ± 2 | 4 ± 1 | 29 ± 3 | 10 ± 2 | |
| 7–8 h/night (n = 287) | 197 ± 9 | 127 ± 8 | 9 ± 1 | 12 ± 2 | 15 ± 2 | 4 ± 1 | 25 ± 4 | 4 ± 1 | |
| ≥9 h/night (n = 11) | 155 ± 30 | 86 ± 34 | 20 ± 17 | 7 ± 3 | 10 ± 7 | 9 ± 6 | 22 ± 11 | 0 ± 0 | |
| p–value | <0.01 | 0.29 | 0.53 | <0.01 | 0.32 | 0.82 | 0.02 | 0.04 | |
| Rank | Junior enlisted(n = 115) | 179 ± 17 | 101 ± 13 | 10 ± 2 | 11 ± 2 | 12 ± 2 | 6 ± 2 | 29 ± 6 | 9 ± 4 |
| Senior enlisted (n = 281) | 223 ± 12 | 129 ± 9 | 9 ± 1 | 19 ± 4 | 16 ± 2 | 4 ± 1 | 38 ± 4 | 8 ± 2 | |
| Warrant officer (n = 4) | 112 ± 41 | 50 ± 43 | 0 ± 0 | 24 ± 23 | 24 ± 19 | 0 ± 0 | 3 ± 3 | 11 ± 11 | |
| Junior officer (n = 110) | 203 ± 15 | 137 ± 13 | 4 ± 1 | 8 ± 2 | 21 ± 4 | 1 ± 0 | 26 ± 6 | 6 ± 3 | |
| Senior officer (n = 109) | 257 ± 17 | 193 ± 16 | 16 ± 4 | 13 ± 3 | 21 ± 4 | 4 ± 2 | 6 ± 2 | 4 ± 2 | |
| p–value | <0.01 | <0.01 | 0.06 | 0.38 | 0.28 | 0.28 | <0.01 | 0.71 | |
| Special Operations | No (n = 592) | 217 ± 8 | 138 ± 6 | 9 ± 1 | 15 ± 2 | 17 ± 1 | 4 ± 1 | 28 ± 3 | 7 ± 1 |
| Yes (n = 24) | 187 ± 22 | 98 ± 24 | 4 ± 2 | 11 ± 4 | 15 ± 7 | 0 ± 0 | 52 ± 15 | 6 ± 6 | |
| p-value | 0.42 | 0.22 | 0.32 | 0.73 | 0.77 | 0.32 | 0.06 | 0.92 |
| Variable | Strata | Caffeine Beverage or Gum/Medication Consumed ≥1 Time/Week | |||||
|---|---|---|---|---|---|---|---|
| Any Caffeine | Coffee | Tea * | Soda † | Energy Drink | Gum/Medication | ||
| (Model 1) | (Model 2) | (Model 3) | (Model 4) | (Model 5) | (Model 6) | ||
| Gender | Men | 1.00 | 1.00 | 1.00 | 1.00 | 1.00 | 1.00 |
| Women | 0.69 (0.35–1.38) | 0.55 (0.35–0.86) | 1.56 (1.04–2.34) | 0.61 (0.41–0.91) | 0.43 (0.25–0.75) | 2.57 (1.31–5.06) | |
| Age (years) | 18–24 | 1.00 | 1.00 | 1.00 | 1.00 | 1.00 | 1.00 |
| 25–29 | 2.00 (0.82–4.87) | 1.27 (0.72–2.24) | 1.07 (0.63–1.83) | 1.29 (0.77–2.19) | 1.58 (0.84–2.96) | 0.82 (0.33–2.06) | |
| 30–39 | 2.23 (0.91–5.04) | 1.77 (0.98–3.18) | 1.14 (0.66–1.98) | 1.15 (0.67–1.96) | 0.86 (0.43–1.67) | 1.12 (0.45–2.79) | |
| ≥40 | 3.23 (1.01–5.45) | 1.52 (0.78–2.96) | 1.25 (0.67–2.32) | 1.03 (0.56–1.89) | 0.31 (0.18–0.98) | 1.91 (0.71–5.14) | |
| Education | Some high school/high school graduate | 1.00 | 1.00 | 1.00 | 1.00 | 1.00 | 1.00 |
| Some college | 1.40 (0.63–3.07) | 1.65 (0.96–2.84) | 0.88 (0.53–1.48) | 1.58 (0.95–2.64) | 1.49 (0.80–2.78) | 0.83 (0.36–1.88) | |
| College degree | 1.10 (0.42–2.46) | 1.79 (1.02–2.54) | 0.71 (0.41–1.25) | 1.36 (0.78–2.36) | 0.78 (0.39–1.57) | 0.57 (0.22–1.43) | |
| Marital status | Single | 1.00 | 1.00 | 1.00 | 1.00 | 1.00 | 1.00 |
| Married | 1.11 (0.59–2.07) | 1.13 (0.75–1.70) | 1.25 (0.86–1.83) | 1.13 (0.78–1.63) | 0.54 (0.34–0.84) | 0.90 (0.48–1.68) | |
| Race/ethnicity | White | 1.00 | 1.00 | 1.00 | 1.00 | 1.00 | 1.00 |
| Black | 0.14 (0.07–0.28) | 0.24 (0.14–0.40) | 0.73 (0.44–1.21) | 0.63 (0.39–1.03) | 0.34 (0.17–0.71) | 0.68 (0.30–1.53) | |
| Hispanic | 0.66 (0.27–1.60) | 1.13 (0.60–2.13) | 1.02 (0.58–1.80) | 0.82 (0.47–1.44) | 0.96 (0.48–1.89) | 0.42 (0.12–1.46) | |
| Other | 0.90 (0.29–2.80) | 0.87 (0.46–1.67) | 1.24 (0.71–2.20) | 0.73 (0.41–1.29) | 0.78 (0.36–1.68) | 0.58 (0.19–1.74) | |
| Body mass index (kg/m2) | <25.0 | 1.00 | 1.00 | 1.00 | 1.00 | 1.00 | 1.00 |
| 25.0–29.9 | 1.07 (0.57–2.00) | 1.41 (0.94–2.13) | 1.00 (0.69–1.45) | 1.05 (0.73–1.51) | 1.79 (1.11–2.91) | 1.19 (0.62–2.29) | |
| ≥30.0 | 1.93 (0.75–4.93) | 1.23 (0.71–2.16) | 0.85 (0.50–1.44) | 1.02 (0.61–1.68) | 2.21 (1.16–4.23) | 1.84 (0.80–4.23) | |
| Alcohol consumption | None | 1.00 | 1.00 | 1.00 | 1.00 | 1.00 | 1.00 |
| <1.33 g/day | 2.32 (1.08–4.97) | 1.08 (0.63–1.86) | 0.96 (0.56–1.64) | 1.11 (0.67–1.86) | 1.53 (0.77–3.05) | 1.49 (0.58–3.82) | |
| 1.33–3.99 g/day | 4.38 (1.82–10.56) | 1.86 (1.06–3.25) | 1.23 (0.72–2.10) | 0.93 (0.56–1.56) | 1.09 (0.54–2.18) | 2.00 (0.79–5.07) | |
| 4.00–8.91 g/day | 2.96 (1.28–6.86) | 2.49 (1.40–4.43) | 1.57 (0.93–2.65) | 0.83 (0.50–1.37) | 1.58 (0.81–3.09) | 0.82 (0.28–2.36) | |
| ≥8.92 g/day | 6.66 (2.35–18.90) | 2.66 (1.49–4.75) | 1.24 (0.73–2.11) | 1.24 (0.74–2.08) | 2.01 (1.05–3.86) | 2.68 (1.11–6.52) | |
| Aerobic exercise duration | <101 min/week | 0.63 (0.26–1.49) | 0.70 (0.40–1.24) | 0.91 (0.55–1.52) | 1.19 (0.72–1.96) | 0.89 (0.48–1.62) | 0.82 (0.37–1.81) |
| 101–180 min/week | 0.66 (0.26–1.69) | 0.60 (0.33–1.07) | 0.61 (0.36–1.05) | 0.96 (0.57–1.60) | 0.67 (0.35–1.30) | 0.43 (0.18–1.05) | |
| 181–290 min/week | 0.74 (0.31–1.78) | 0.88 (0.50–1.54) | 0.91 (0.55–1.50) | 1.00 (0.61–1.63) | 0.63 (0.34–1.16) | 0.55 (0.24–1.23) | |
| ≥291 min/week | 1.00 | 1.00 | 1.00 | 1.00 | 1.00 | 1.00 | |
| Resistance training duration | <46 min/week | 1.99 (0.80–5.00) | 1.31 (0.72–2.39) | 1.03 (0.59–1.80) | 1.36 (0.79–2.35) | 0.63 (0.32–1.23) | 1.10 (0.43–2.77) |
| 46–135 min/week | 1.80 (0.76–4.28) | 1.52 (0.85–2.72) | 1.26 (0.74–2.16) | 1.57 (0.93–2.65) | 1.15 (0.61–2.14) | 1.06 (0.43–2.60) | |
| 136–270 min/week | 1.45 (0.26–3.60) | 1.28 (0.69–2.36) | 1.07 (0.60–1.90) | 1.00 (0.58–1.76) | 1.08 (0.55–2.11) | 0.89 (0.34–2.33) | |
| ≥271 min/week | 1.00 | 1.00 | 1.00 | 1.00 | 1.00 | 1.00 | |
| Sleep duration | ≤4 h/night | 2.35 (0.26–21.56) | 0.45 (0.14–1.50) | 0.74 (0.22–2.50) | 0.98 (0.31–3.07) | 2.20 (0.66–7.33) | 2.53 (0.57–11.31) |
| 5–6 h/night | 1.68 (0.94–2.99) | 1.37 (0.94–1.99) | 0.97 (0.69–1.35) | 1.32 (0.95–1.82) | 1.31 (0.86–1.99) | 1.40 (0.79–2.49) | |
| 7–8 h/night | 1.00 | 1.00 | 1.00 | 1.00 | 1.00 | 1.00 | |
| ≥9 h/night | 2.24 (0.24–20.98) | 0.95 (0.27–3.40) | 0.88 (0.25–3.09) | 0.58 (0.16–2.08) | 2.02 (0.54–7.64) | 0.94 (0.10–8.61) | |
| Nagelkerke R2 | 0.23 | 0.18 | 0.04 | 0.07 | 0.18 | 0.11 | |
| Variable | Strata | Caffeine Beverage or Gum/Medication Consumed ≥1 Time/Week | |||||
|---|---|---|---|---|---|---|---|
| Any Caffeine | Coffee | Tea * | Soda † | Energy Drink | Gum/Medication | ||
| (Model 1) | (Model 2) | (Model 3) | (Model 4) | (Model 5) | (Model 6) | ||
| Gender | Men | 1.00 | 1.00 | 1.00 | 1.00 | 1.00 | 1.00 |
| Women | 1.08 (0.66–1.77) | 1.17 (0.82–1.68) | 1.45 (1.02–2.07) | 0.58 (0.41–0.82) | 0.64 (0.43–0.93) | 3.15 (1.66–5.99) | |
| Age (years) | 18–24 | 1.00 | 1.00 | 1.00 | 1.00 | 1.00 | 1.00 |
| 25–29 | 1.93 (1.11–3.38) | 1.11 (0.74–1.67) | 0.93 (0.62–1.41) | 0.98 (0.65–1.47) | 1.13 (0.74–1.72) | 0.49 (0.22–1.09) | |
| 30–39 | 3.59 (1.85–6.96) | 1.76 (1.13–2.73) | 0.91 (0.59–1.40) | 1.81 (1.19–2.74) | 0.93 (0.60–1.44) | 0.77 (0.37–1.62) | |
| ≥40 | 3.15 (1.22–8.11) | 1.61 (0.88–2.93) | 0.98 (0.55–1.75) | 1.51 (0.87–2.62) | 0.32 (0.17–0.62) | 1.60 (0.62–4.13) | |
| Education | Some high school/high school graduate | 1.00 | 1.00 | 1.00 | 1.00 | 1.00 | 1.00 |
| Some college | 0.97 (0.61–1.55) | 1.16 (0.82–1.65) | 1.01 (0.71–1.45) | 0.65 (0.46–0.92) | 1.29 (0.90–1.87) | 1.65 (0.87–3.15) | |
| College degree | 1.39 (0.66–2.92) | 1.83 (1.14–2.94) | 0.93 (0.59–1.47) | 0.64 (0.41–0.99) | 0.58 (0.36–0.94) | 0.88 (0.36–2.16) | |
| Marital status | Single | 1.00 | 1.00 | 1.00 | 1.00 | 1.00 | 1.00 |
| Married | 1.32 (0.84–2.07) | 1.22 (0.87–1.71) | 0.86 (0.61–1.20) | 1.22 (0.88–1.70) | 1.24 (0.87–1.77) | 1.56 (0.83–2.92) | |
| Race/ethnicity | White | 1.00 | 1.00 | 1.00 | 1.00 | 1.00 | 1.00 |
| Black | 0.59 (0.35–0.96) | 0.44 (0.27–0.73) | 1.27 (0.77–2.08) | 0.74 (0.44–1.21) | 0.54 (0.31–0.89) | 1.05 (0.48–2.29) | |
| Hispanic | 0.77 (0.37–1.58) | 0.95 (0.65–1.38) | 0.87 (0.60–1.27) | 0.54 (0.38–0.78) | 0.46 (0.31–0.70) | 0.89 (0.47–1.68) | |
| Other | 0.40 (0.22–0.75) | 0.56 (0.34–0.93) | 1.44 (0.88–2.35) | 0.76 (0.47–1.24) | 0.56 (0.32–0.96) | 0.41 (0.13–1.24) | |
| Body mass index (kg/m2) | <25.0 | 1.00 | 1.00 | 1.00 | 1.00 | 1.00 | 1.00 |
| 25.0–29.9 | 0.77 (0.49–1.23) | 1.40 (1.02–1.95) | 0.86 (0.62–1.19) | 0.81 (0.59–1.11) | 1.21 (0.87–1.70) | 1.64 (0.89–3.02) | |
| ≥30.0 | 1.04 (0.35–3.04) | 1.83 (0.88–3.81) | 0.82 (0.41–1.67) | 0.61 (0.31–1.18) | 1.31 (0.66–2.59) | 3.48 (1.24–9.74) | |
| Alcohol consumption | None | 1.00 | 1.00 | 1.00 | 1.00 | 1.00 | 1.00 |
| <1.33 g/day | 1.57 (0.89–2.76) | 1.87 (1.23–2.86) | 1.42 (0.92–2.18) | 1.08 (0.71–1.64) | 1.95 (1.23–3.10) | 1.21 (0.58–2.49) | |
| 1.33–3.99 g/day | 2.13 (1.14–3.98) | 2.48 (1.59–3.84) | 1.15 (0.73–1.80) | 1.30 (0.85–1.98) | 1.65 (1.03–2.63) | 0.84 (0.38–1.84) | |
| 4.00–8.91 g/day | 2.25 (1.16–4.37) | 2.75 (1.75–4.35) | 1.49 (0.95–2.34) | 1.45 (0.74–1.77) | 1.65 (1.02–2.67) | 1.07 (0.48–2.36) | |
| ≥8.92 g/day | 2.27 (1.18–4.39) | 3.37 (2.12–5.36) | 1.45 (0.92–2.27) | 1.44 (0.94–2.21) | 1.82 (1.13–2.92) | 1.05 (0.46–2.36) | |
| Aerobic exercise duration | <101 min/week | 0.92 (0.50–1.68) | 0.81 (0.52–1.26) | 1.01 (0.65–1.55) | 1.10 (0.73–1.67) | 1.09 (0.70–1.72) | 0.35 (0.15–0.83) |
| 101–180 min/week | 1.19 (0.64–2.19) | 0.90 (0.58–1.40) | 1.01 (0.65–1.55) | 1.42 (0.94–2.15) | 1.17 (0.75–1.83) | 0.63 (0.29–1.37) | |
| 181–290 min/week | 0.99 (0.56–1.79) | 0.83 (0.54–1.26) | 1.20 (0.80–1.80) | 1.07 (0.72–1.58) | 1.26 (0.82–1.93) | 0.93 (0.48–1.81) | |
| ≥291 min/week | 1.00 | 1.00 | 1.00 | 1.00 | 1.00 | 1.00 | |
| Resistance training duration | <46 min/week | 1.35 (0.70–2.60) | 1.02 (0.64–1.62) | 1.09 (0.70–1.71) | 1.81 (1.15–2.82) | 0.87 (0.54–1.39) | 0.84 (0.38–1.86) |
| 46–135 min/week | 1.56 (0.83–2.91) | 1.39 (0.89–2.16) | 0.76 (0.50–1.18) | 1.42 (0.94–2.15) | 0.98 (0.63–1.52) | 0.53 (0.24–1.16) | |
| 136–270 min/week | 0.98 (0.56–1.71) | 0.88 (0.58–1.35) | 0.74 (0.49–1.12) | 1.17 (0.78–1.74) | 0.87 (0.57–1.34) | 0.83 (0.40–1.69) | |
| ≥271 min/week | 1.00 | 1.00 | 1.00 | 1.00 | 1.00 | 1.00 | |
| Sleep duration | ≤4 h/night | 0.85 (0.37–1.96) | 0.82 (0.42–1.58) | 1.15 (0.60–2.21) | 1.80 (0.94–3.43) | 4.17 (2.14–8.14) | 4.16 (1.51–11.47) |
| 5–6 h/night | 1.36 (0.88–2.11) | 1.16 (0.85–1.59) | 0.91 (0.68–1.23) | 1.22 (0.91–1.63) | 2.17 (1.57–3.00) | 2.38 (1.30–4.36) | |
| 7–8 h/night | 1.00 | 1.00 | 1.00 | 1.00 | 1.00 | 1.00 | |
| ≥9 h/night | 0.41 (0.13–1.29) | 0.92 (0.30–2.77) | 0.60 (0.18–1.94) | 0.53 (0.16–1.72) | 0.54 (0.11–2.53) | 2.67 (0.52–13.96) | |
| Nagelkerke R2 | 0.17 | 0.16 | 0.04 | 0.11 | 0.16 | 0.13 | |
© 2016 by the authors; licensee MDPI, Basel, Switzerland. This article is an open access article distributed under the terms and conditions of the Creative Commons Attribution (CC-BY) license (http://creativecommons.org/licenses/by/4.0/).
Share and Cite
Knapik, J.J.; Trone, D.W.; McGraw, S.; Steelman, R.A.; Austin, K.G.; Lieberman, H.R. Caffeine Use among Active Duty Navy and Marine Corps Personnel. Nutrients 2016, 8, 620. https://doi.org/10.3390/nu8100620
Knapik JJ, Trone DW, McGraw S, Steelman RA, Austin KG, Lieberman HR. Caffeine Use among Active Duty Navy and Marine Corps Personnel. Nutrients. 2016; 8(10):620. https://doi.org/10.3390/nu8100620
Chicago/Turabian StyleKnapik, Joseph J., Daniel W. Trone, Susan McGraw, Ryan A. Steelman, Krista G. Austin, and Harris R. Lieberman. 2016. "Caffeine Use among Active Duty Navy and Marine Corps Personnel" Nutrients 8, no. 10: 620. https://doi.org/10.3390/nu8100620