Chicken Essence for Cognitive Function Improvement: A Systematic Review and Meta-Analysis

Abstract
:1. Introduction
2. Materials and Methods
2.1. Protocol and Registration
2.2. Data Sources and Search Strategy
2.3. Study Selection
2.4. Data Extraction
2.5. Study Quality Assessment
2.6. Data Analysis
2.7. Quality of Evidence
2.8. Sensitivity Analysis
3. Results
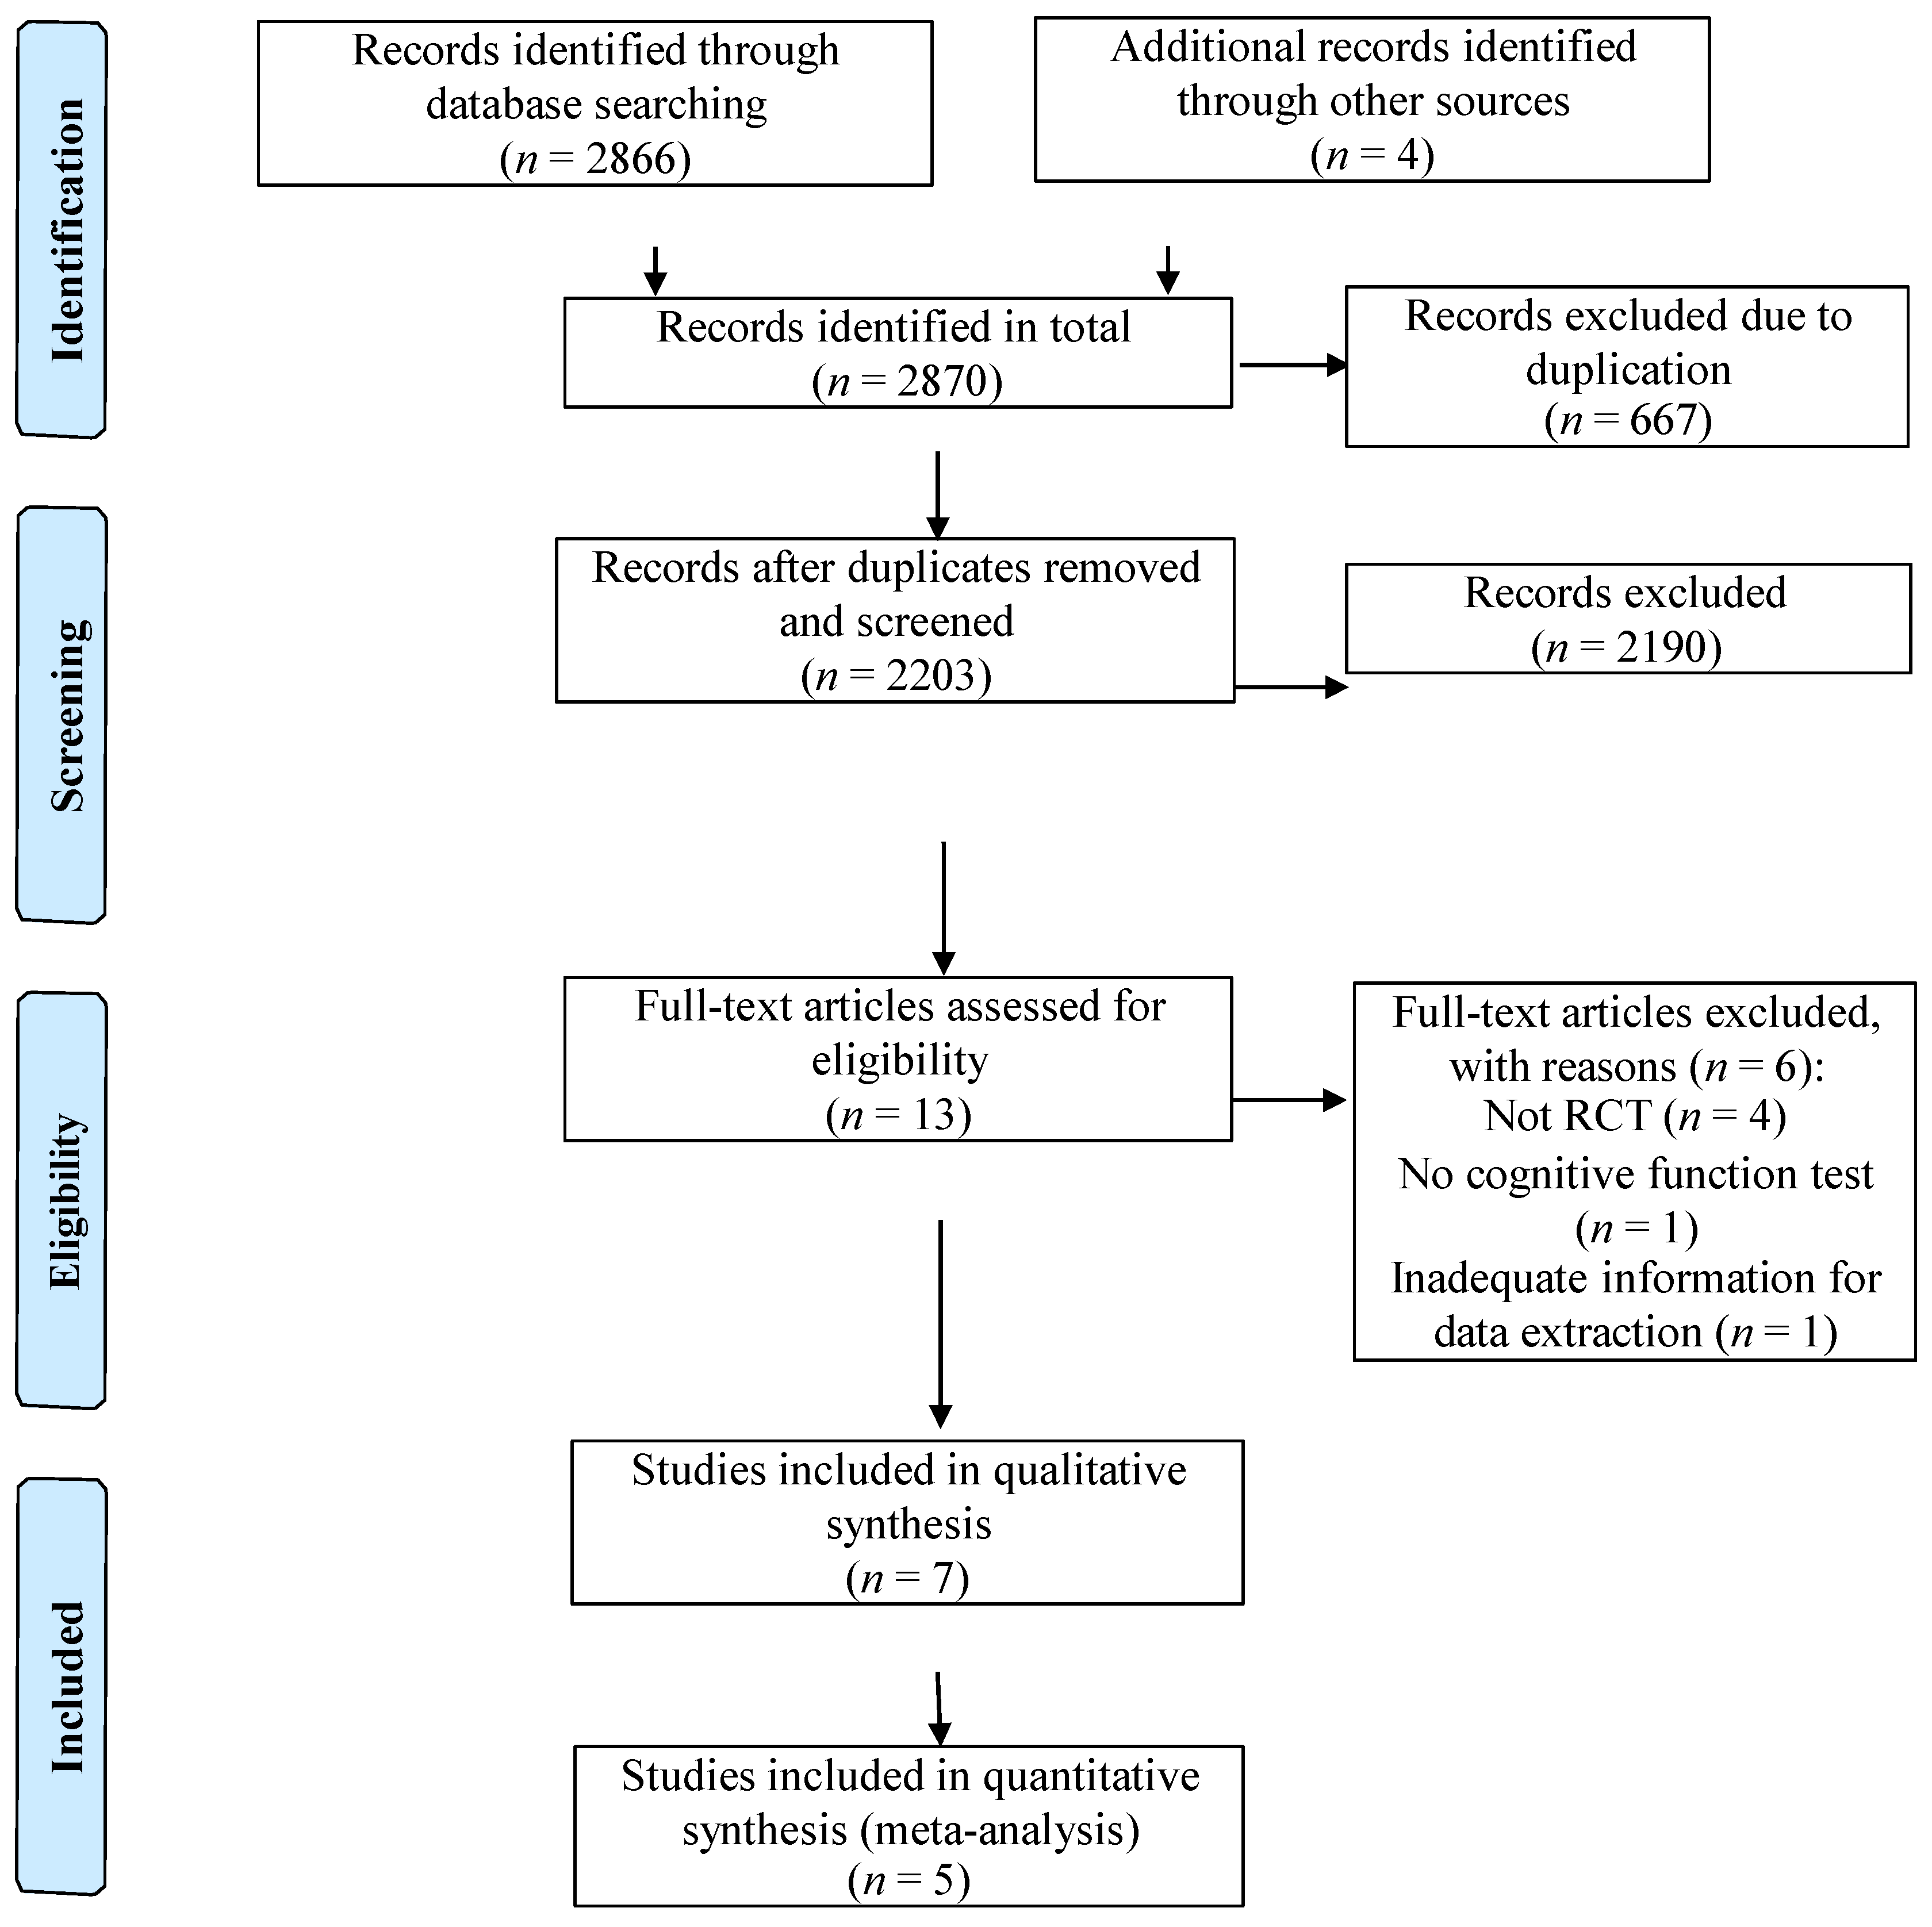
3.1. Study Selection
3.2. Study Characteristics

| Author | RCT Design | Blinding Status (Stated by Author) | No. of Participants (Chicken Essence Group) ITT; Completed | No. of Participants (Placebo Group) ITT; Completed | Participants’ Condition | Participants’ Age Mean (Range) | Chicken Essence and Placebo’s Form | Placebo | Test to Check Placebo’s Similarity | Quantity | Intake Duration (Days) | Interval Assessed (Days) | Risk of Bias; Jadad Score |
|---|---|---|---|---|---|---|---|---|---|---|---|---|---|
| Nagai 1996, [4] | Cross-over | - | Total = 20; 16 # | Healthy volunteer | 21.1 (18–24) | Liquid ~ | Gelatin, caramel | - | 140 mL | 7 | 0,7 | High; 1 | |
| Azhar 2003, [14] | Parallel | Double-blinded | 60; 56 | 57; 52 | Healthy volunteer § | −(23–24) | Liquid | Water, caramel | - | 70 mL | 14 | 0, 14 | High; 1 |
| Azhar 2008, [15] | Parallel | Double-blinded | Total ITT= 102 `; 38; 31 | Healthy volunteer § | 23 (22–24) | Liquid | Milk protein | - | 70 mL | 14 | 0, 14 | High; 1 | |
| Azhar 2013, [2] ^ | Parallel | Double-blinded | Total ITT= 46 `; 10; 10 | Walk-in or general practitioner referred patients with poorer cognitive function | 47.5 (35–65) | Tablet * | Microcrystalline cellulose | - | 670 mg | 42 | 0, 42, 56 | High; 2 | |
| Konagai 2013, [3] | Cross-over | Double-blinded | Total = 12; 12 # | Healthy, elderly volunteer | 62.3 (60–68) | Liquid * | Milk casein, caramel | - | 140 mL | 7 | 0,7 | High; 1 | |
| Yamano 2013, [13] ^ | Cross-over | - | Total = 20; 20 # | Healthy volunteer, male | 34.7 (33–35) | Liquid * | Milk casein, caramel | - | 140 mL | 28 | 0, 7, 28 | High; 1 | |
| Yamano 2015, [5] ^ | Parallel | Double-blinded | 24; 24 | 22; 22 | Healthy volunteer | 21.5–22.2 (-) | Liquid * | Milk casein, caramel | Yes | 70 mL | 10 | 0, 10 | Unclear; 3 |
| Author | Paired/Unpaired Analysis | For Paired Analysis, within-Subject Comparison Performed? | For Unpaired Analysis, First or Second Period Used? |
|---|---|---|---|
| Nagai 1996, [4] | Paired | Yes | Not applicable |
| Konagai 2013, [3] | Unpaired | Not applicable | Not reported |
| Yamano 2013, [13] | Paired | Not reported | Not applicable |
3.3. Study Quality Assessment
| Sequence Generation | Allocation Concealment | Blinding | Incomplete Outcome Data | Selective Reporting | Other Sources of Bias | Overall | |
|---|---|---|---|---|---|---|---|
| Nagai 1996, [4] | High | Unclear | High | Low | Low | Unclear | High |
| Azhar 2003, [14] | Unclear | Unclear | High | Low | Low | Unclear | High |
| Azhar 2008, [15] | Unclear | Unclear | High | High | Low | Unclear | High |
| Azhar 2013, [2] | Unclear | Unclear | Unclear | High | High | High | High |
| Konagai 2013, [3] | Unclear | Unclear | High | Unclear | Low | High | High |
| Yamano 2013, [13] | Unclear | Unclear | High | Unclear | Low | Unclear | High |
| Yamano 2015, [5] | Unclear | Unclear | Unclear | Low | Low | Low | Unclear |
3.4. Effects of Chicken Essence in Cognitive Function Improvement
| Cognitive Function Domain | Cognitive Function Test | Study | Outcome Measure (Scale) | Additional Information of Outcome Measure/Scale | Range of Score Reported | Mean Difference (95% CI) |
|---|---|---|---|---|---|---|
| Attention | Simple Reaction Task | Konagai 2013, [3] | Oxy-hemoglobin concentration (NA) | The presence of oxy-hemoglobin in brain during cognitive function test | NR | NR |
| EE-Arrow Flankers Test (Congruent) | Yamano 2015, [5] | Score (Error) $ | Number of incorrect answer of cognitive function test | −2.8–1.3 | −0.33 (−0.91, 0.26) | |
| EE-Arrow Flankers Test (Neutral) | Yamano 2015, [5] | Score (Error) $ | Number of incorrect answer of cognitive function test | −2.8–1.3 | −0.24 (−0.82, 0.34) | |
| EE-Arrow Flankers Test (Incongruent) | Yamano 2015, [5] | Score (Error) $ | Number of incorrect answer of cognitive function test | −2.8–1.3 | −0.47 (−1.06, 0.11) | |
| EE-Arrow Flankers Test (Congruent) | Yamano 2015, [5] | Reaction time (NR ~) $ | Time used to complete cognitive function test | 470.9–1184.6 | −0.001 (−0.58,0.58) | |
| EE-Arrow Flankers Test (Neutral) | Yamano 2015, [5] | Reaction time (NR ~) $ | Time used to complete cognitive function test | 470.9–1184.6 | −0.10 (−0.68, 0.48) | |
| EE-Arrow Flankers Test (Incongruent) | Yamano 2015, [5] | Reaction time (NR ~) $ | Time used to complete cognitive function test | 470.9–1184.6 | 0.13 (−0.45, 0.71) | |
| Jensen-Simple and Choice Reaction Time | Yamano 2015, [5] | Reaction time (Decision time ~) $ | Time used to complete cognitive function test | 122.4–671.1 | −0.36 (−0.92, 0.24) | |
| Jensen-Simple and Choice Reaction Time | Yamano 2015, [5] | Reaction time (Movement time ~) $ | Time used to complete cognitive function test | 132.1–661.8 | −0.51 (−1.10, 0.08) | |
| Executive Function | Nagai’s Mental Arithmetic Test | Nagai 1996, [4] | Score (Error rate) $ | Percentage of incorrect answer out of the filled answer | NR | −0.76 (−1.64, 0.12) |
| The Three Minute Memory Test | Azhar 2003, [14] | Score (NR ~) $ | NR | 1.1–8.7 | 0.16 (−0.22, 0.54) | |
| WAIS-Digit Span | Azhar 2003, [14] | Score (Longest list ~) $ | Longest list of digits remembered | 11.3–32.7 | 0.23 (−0.15, 0.61) | |
| Mental Arithmetic Test | Azhar 2003, [14] | Score (NR ~) $ | NR | 2.8–14.7 | 0.98 (0.34, 1.62) * | |
| WAIS-Arithmetic Test | Azhar 2008, [15] | Score (NR ~) $ | NR | 9.6–26.8 | 0.73 (−1.27, 2.73) * | |
| WAIS-Digit Backward | Azhar 2008, [15] | Score (Longest list ~) $ | Longest list of digits remembered | 5.2–10.7 | 0.47 (−0.57, 1.51) | |
| WAIS-Digit Backward | Azhar 2013, [2] | Score (Longest list ~) $ | Longest list of digits remembered | 24.2–28.3 | 2.00 (1.14, 2.86) * | |
| Letter Number Sequencing | Azhar 2008, [15] | Score (Longest list ~) $ | Longest list of letters and digits remembered | 8.9–16.1 | 0.31 (−0.17, 0.78) | |
| Letter Number Sequencing | Azhar 2013, [2] | Score (Longest list ~) $ | Longest list of letters and digits remembered | 17.2–19.6 | 6.25 (4.03, 8.47) * | |
| RAVLT-Delayed Recall | Azhar 2013, [2] | Score (Longest list ~) $ | Longest list of words remembered | 17.7–6.4 | 3.33 (1.94, 4.73) * | |
| RAVLT-Recall | Azhar 2013, [2] | Score (Longest list ~) $ | Longest list of words remembered | 6.6–17.7 | 2.81 (1.54, 4.08) * | |
| RAVLT-Retroactive Interference | Azhar 2013, [2] | Score (Longest list ~) $ | Longest list of words remembered | 5.9–19.2 | 4.06 (2.47, 5.65) * | |
| Working Memory Test | Konagai 2013, [3] | Oxy-Hemoglobin Concentration (NA) $ | The presence of oxy-hemoglobin in brain during cognitive function test | NR | 0.20 (0.06, 0.34) * | |
| Traffic Light’s Test | Yamano 2013, [13] | Reaction time (NR ~) | Time used to complete cognitive function test | NR | NR | |
| Stroop Test | Yamano 2013, [13] | Reaction time (NR ~) | Time used to complete cognitive function test | NR | NR | |
| Serial Sevens | Yamano 2015, [5] | Score (Error) $ | Number of incorrect answer of cognitive function test, time used to complete cognitive function test | −3.8 | −0.46 (−1.05, 0.13) | |
| Serial Sevens | Yamano 2015, [5] | Reaction time (NR ~) $ | Time used to complete cognitive function test | 705.7–3032.9 | 0.32 (−0.27, 0.90) | |
| Long-term Memory | Non-Stroop Test | Yamano 2013, [13] | Reaction time (NR ~) | Time used to complete cognitive function test | NR | NR |
| Short-term Memory | Short-term Memory Test | Nagai 1996 [4] | Score (Error rate) | Percentage of incorrect answer out of the filled answer | NR | NR |
| Mental Comprehension Test | Azhar 2003, [14] | Score (NR ~) $ | NR | 0.6–11.4 | 0.64 (0.25, 1.02) * | |
| WAIS-Digit Forward | Azhar 2008, [15] | Score (NR ~) $ | Longest list of digits remembered | 8.4–20.7 | −0.10 (−0.57, 0.37) | |
| RAVLT-Proactive Interference | Azhar 2013, [2] | Score (NR ~) $ | Longest list of words remembered | 7.5–19.1 | 3.75 (2.24, 5.26) * | |
| RAVLT-Immediate Memory | Azhar 2013, [2] | Score (NR ~) $ | NR | 8.0–20.4 | 3.92 (2.37, 5.47) * | |
| RAVLT-Best Learning | Azhar 2013, [2] | Score (NR ~) $ | NR | 8.5–21.4 | 1.70 (0.66, 2.74) * | |
| RAVLT-Total Learning | Azhar 2013, [2] | Score (NR ~) $ | NR | 43.8–105.6 | 6.50 (2.66, 10.34) * | |
| Visuospatial Skills | Figures Construction Test | Azhar 2003, [14] | Score (NR ~) $ | NR | 1.2–7.9 | 0.28 (−0.10, 0.66) |
| Milner and Snyder-Groton Maze Learning Test | Konagai 2013, [3] | Oxy-hemoglobin concentration (NA) | The presence of oxy-hemoglobin in brain during cognitive function test | NR | NR | |
| (Subdomain) Information Processing Speed | Traffic Light’s Test | Yamano 2013, [13] | Reaction time (NR ~) | Time used to complete cognitive function test | NR | NR |
| Stroop Test | Yamano 2013, [13] | Reaction time (NR ~) | Time used to complete cognitive function test | NR | NR | |
| Non-Stroop Test | Yamano 2013, [13] | Reaction time (NR ~) | Time used to complete cognitive function test | NR | NR | |
| EE-Arrow Flankers Test (Congruent) | Yamano 2015, [5] | Reaction time (NR ~) | Time used to complete cognitive function test | 470.9–1184.6 | −0.00 (−0.58,0.58) | |
| EE-Arrow Flankers Test (Neutral) | Yamano 2015, [5] | Reaction time (NR ~) | Time used to complete cognitive function test | 470.9–1184.6 | −0.10 (−0.68, 0.48) | |
| EE-Arrow Flankers Test (Incongruent) | Yamano 2015, [5] | Reaction time (NR ~) | Time used to complete cognitive function test | 470.9–1184.6 | 0.13 (−0.45, 0.71) | |
| Jensen-Simple and Choice Reaction Time | Yamano 2015, [5] | Reaction time (Decision time ~) $ | Time used to complete cognitive function test | 122.4–671.1 | −0.36 (−0.92, 0.24) | |
| Jensen-Simple and Choice Reaction Time | Yamano 2015, [5] | Reaction time (Movement time ~) $ | Time used to complete cognitive function test | 132.1–661.8 | −0.51 (−1.10, 0.08) | |
| Serial Sevens | Yamano 2015, [5] | Reaction time (NR ~) | Time used to complete cognitive function test | 705.7–3032.9 | 0.32 (−0.27, 0.90) |
| Cognitive Area | Study | ROB | Test | Outcome Measure | Pooled SMD (95% CI) |
|---|---|---|---|---|---|
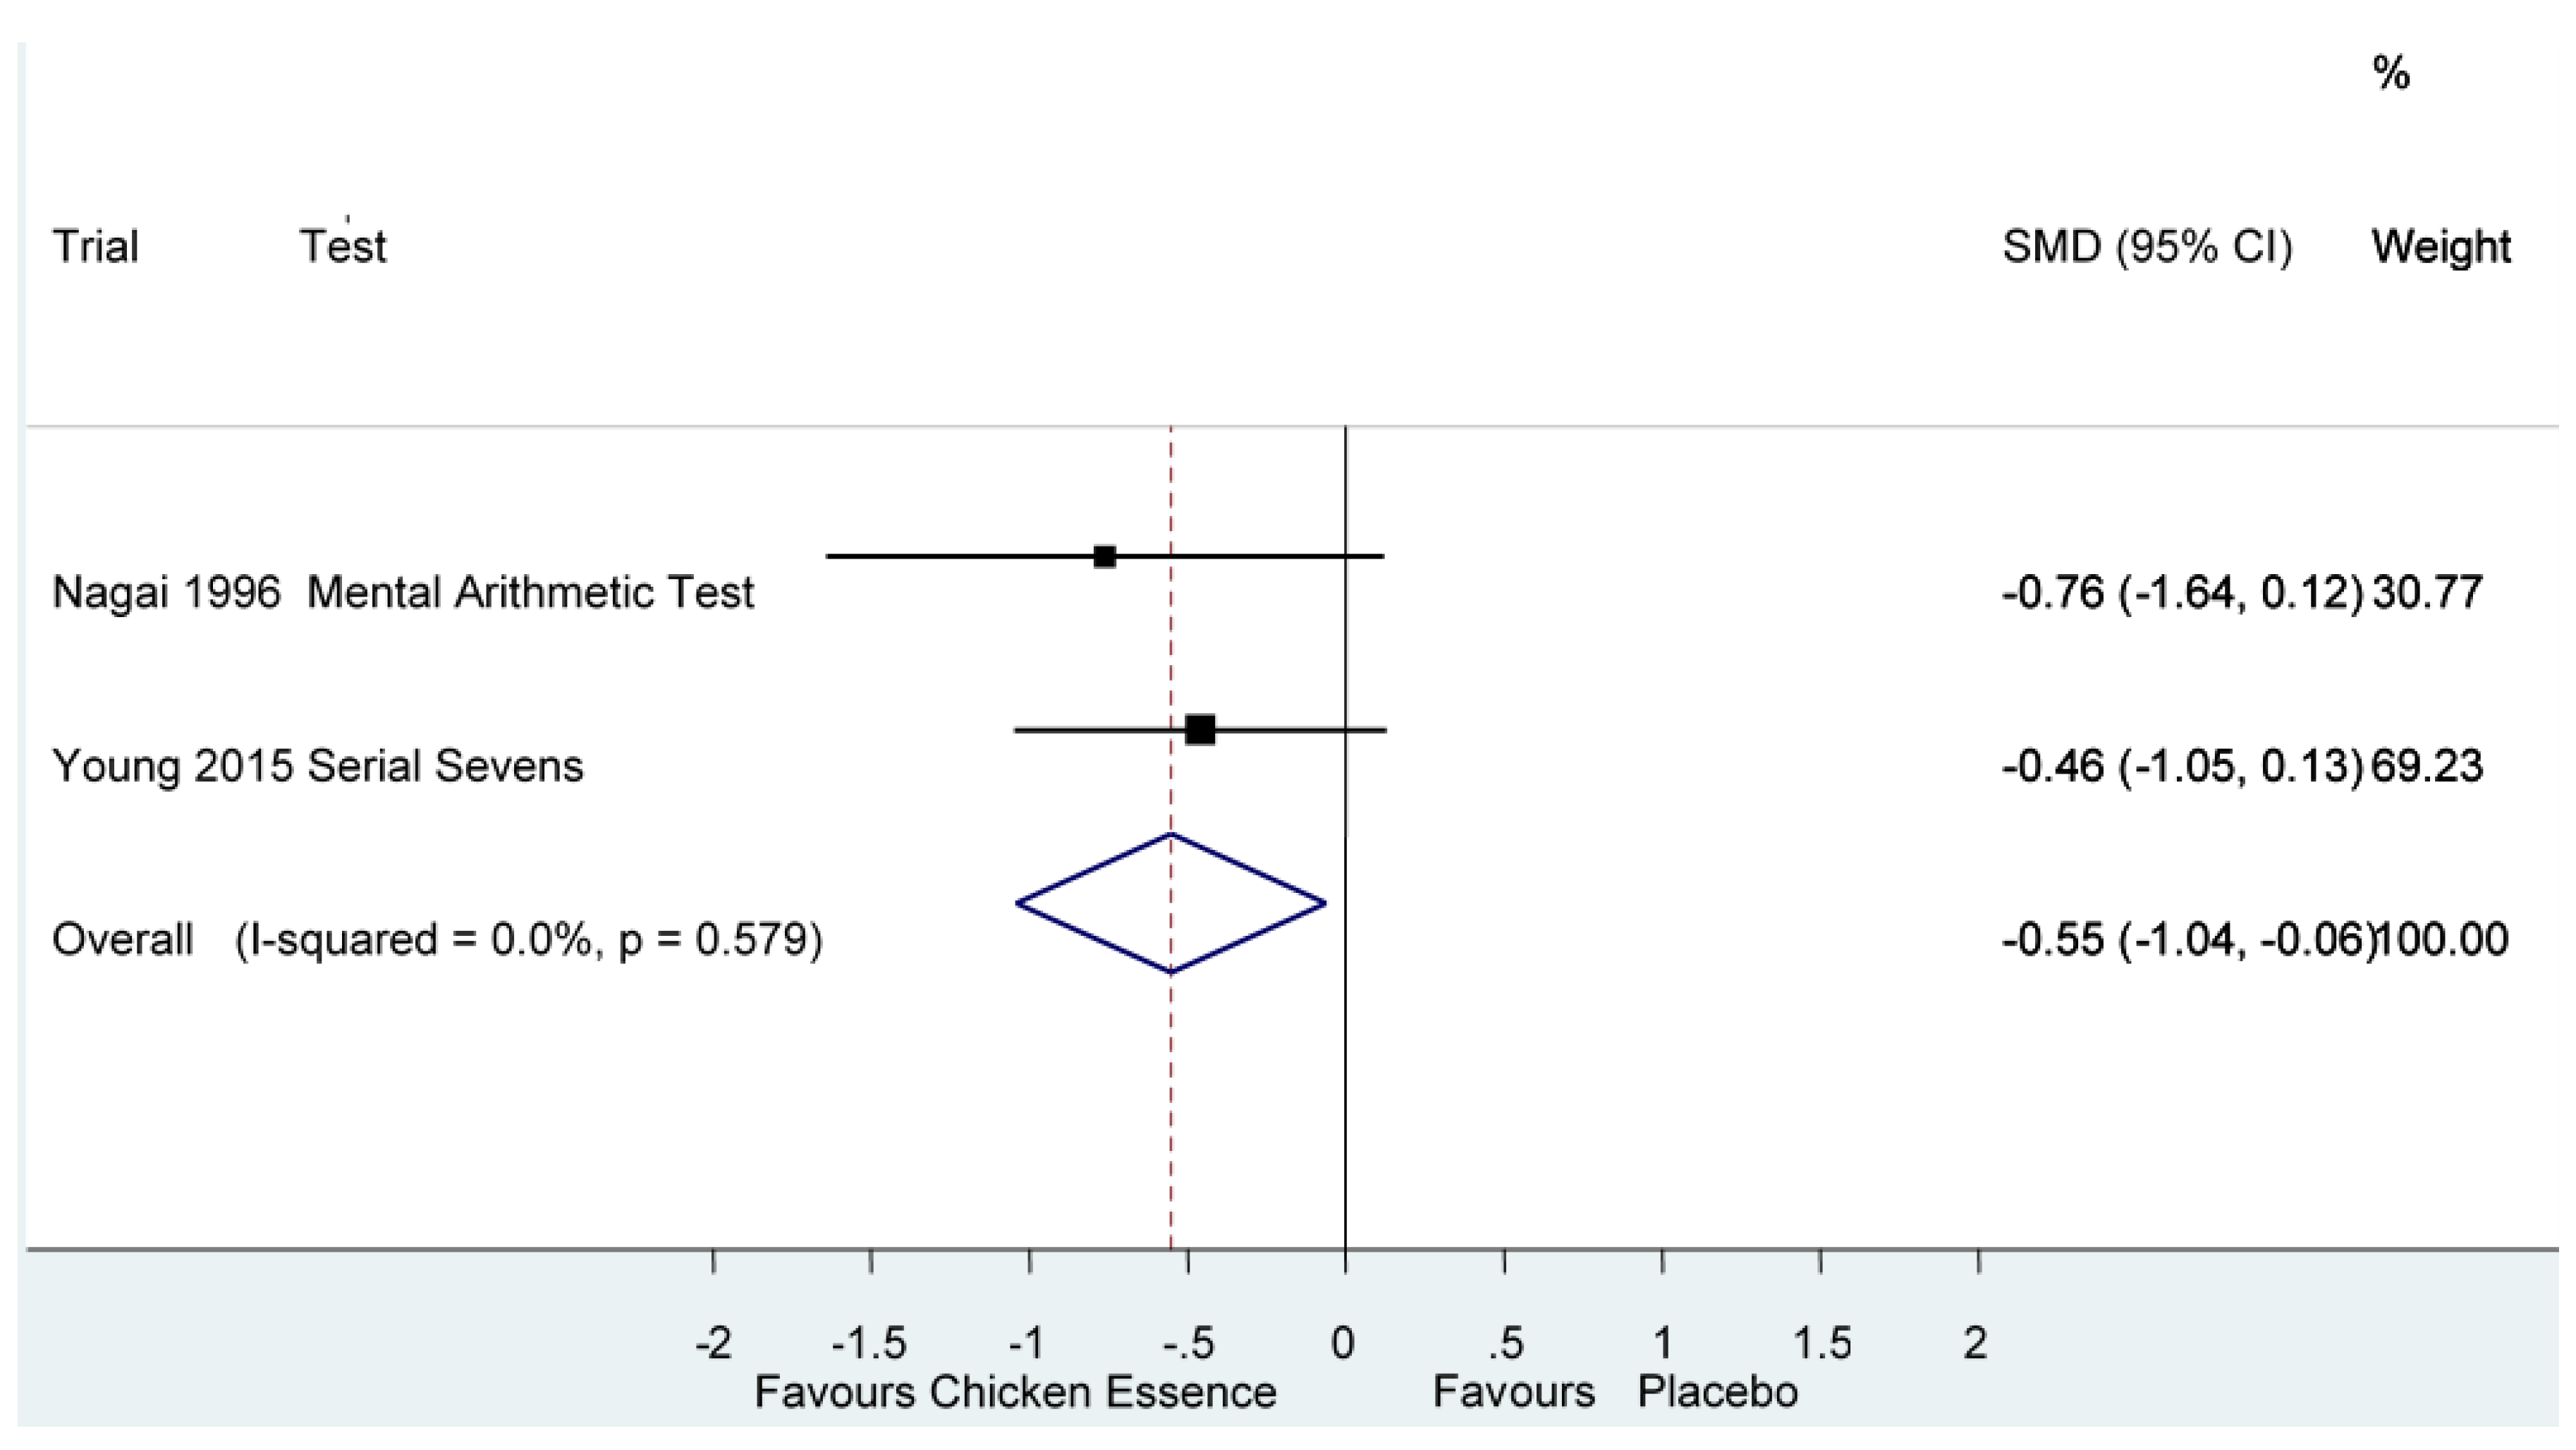
| Executive Functions | Nagai 1996, [4] | High | Nagai’s Mental Arithmetic Test | Score (Error rate) | −0.55 (−1.04, −0.06) * I2 = 0%, p = 0.58 |
| Yamano 2015, [5] | Unclear | Serial Sevens | Score (Error) | ||
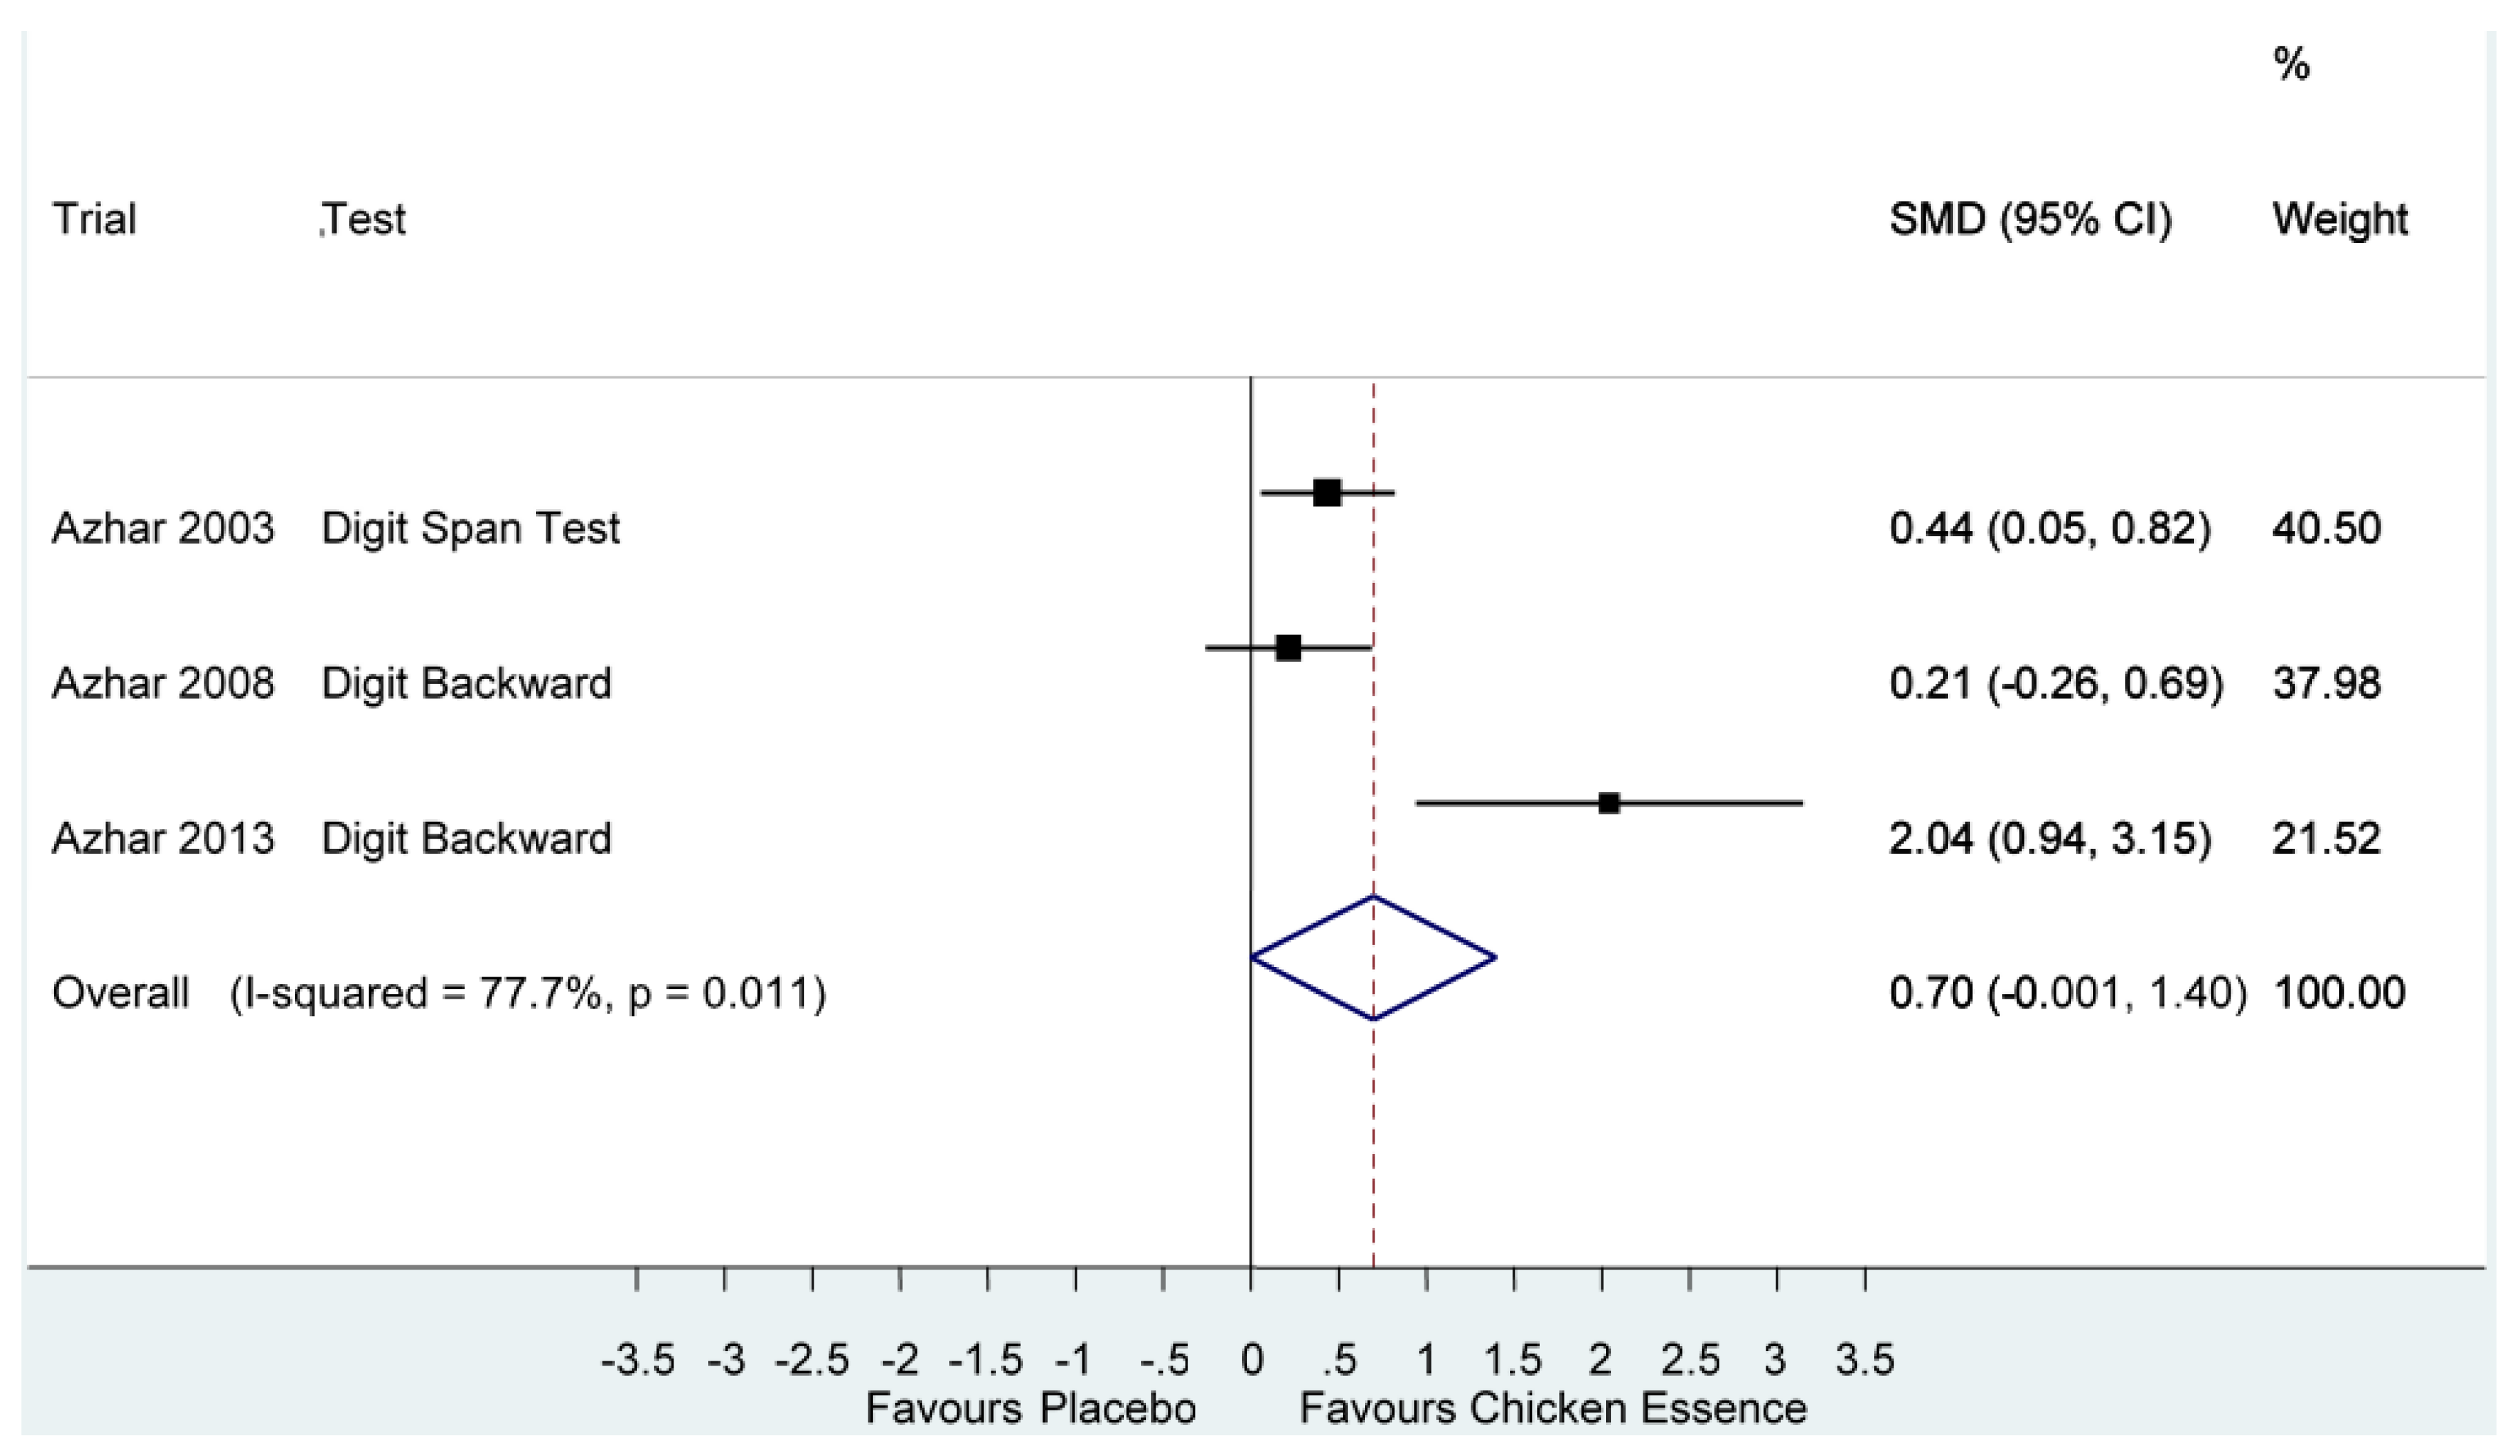
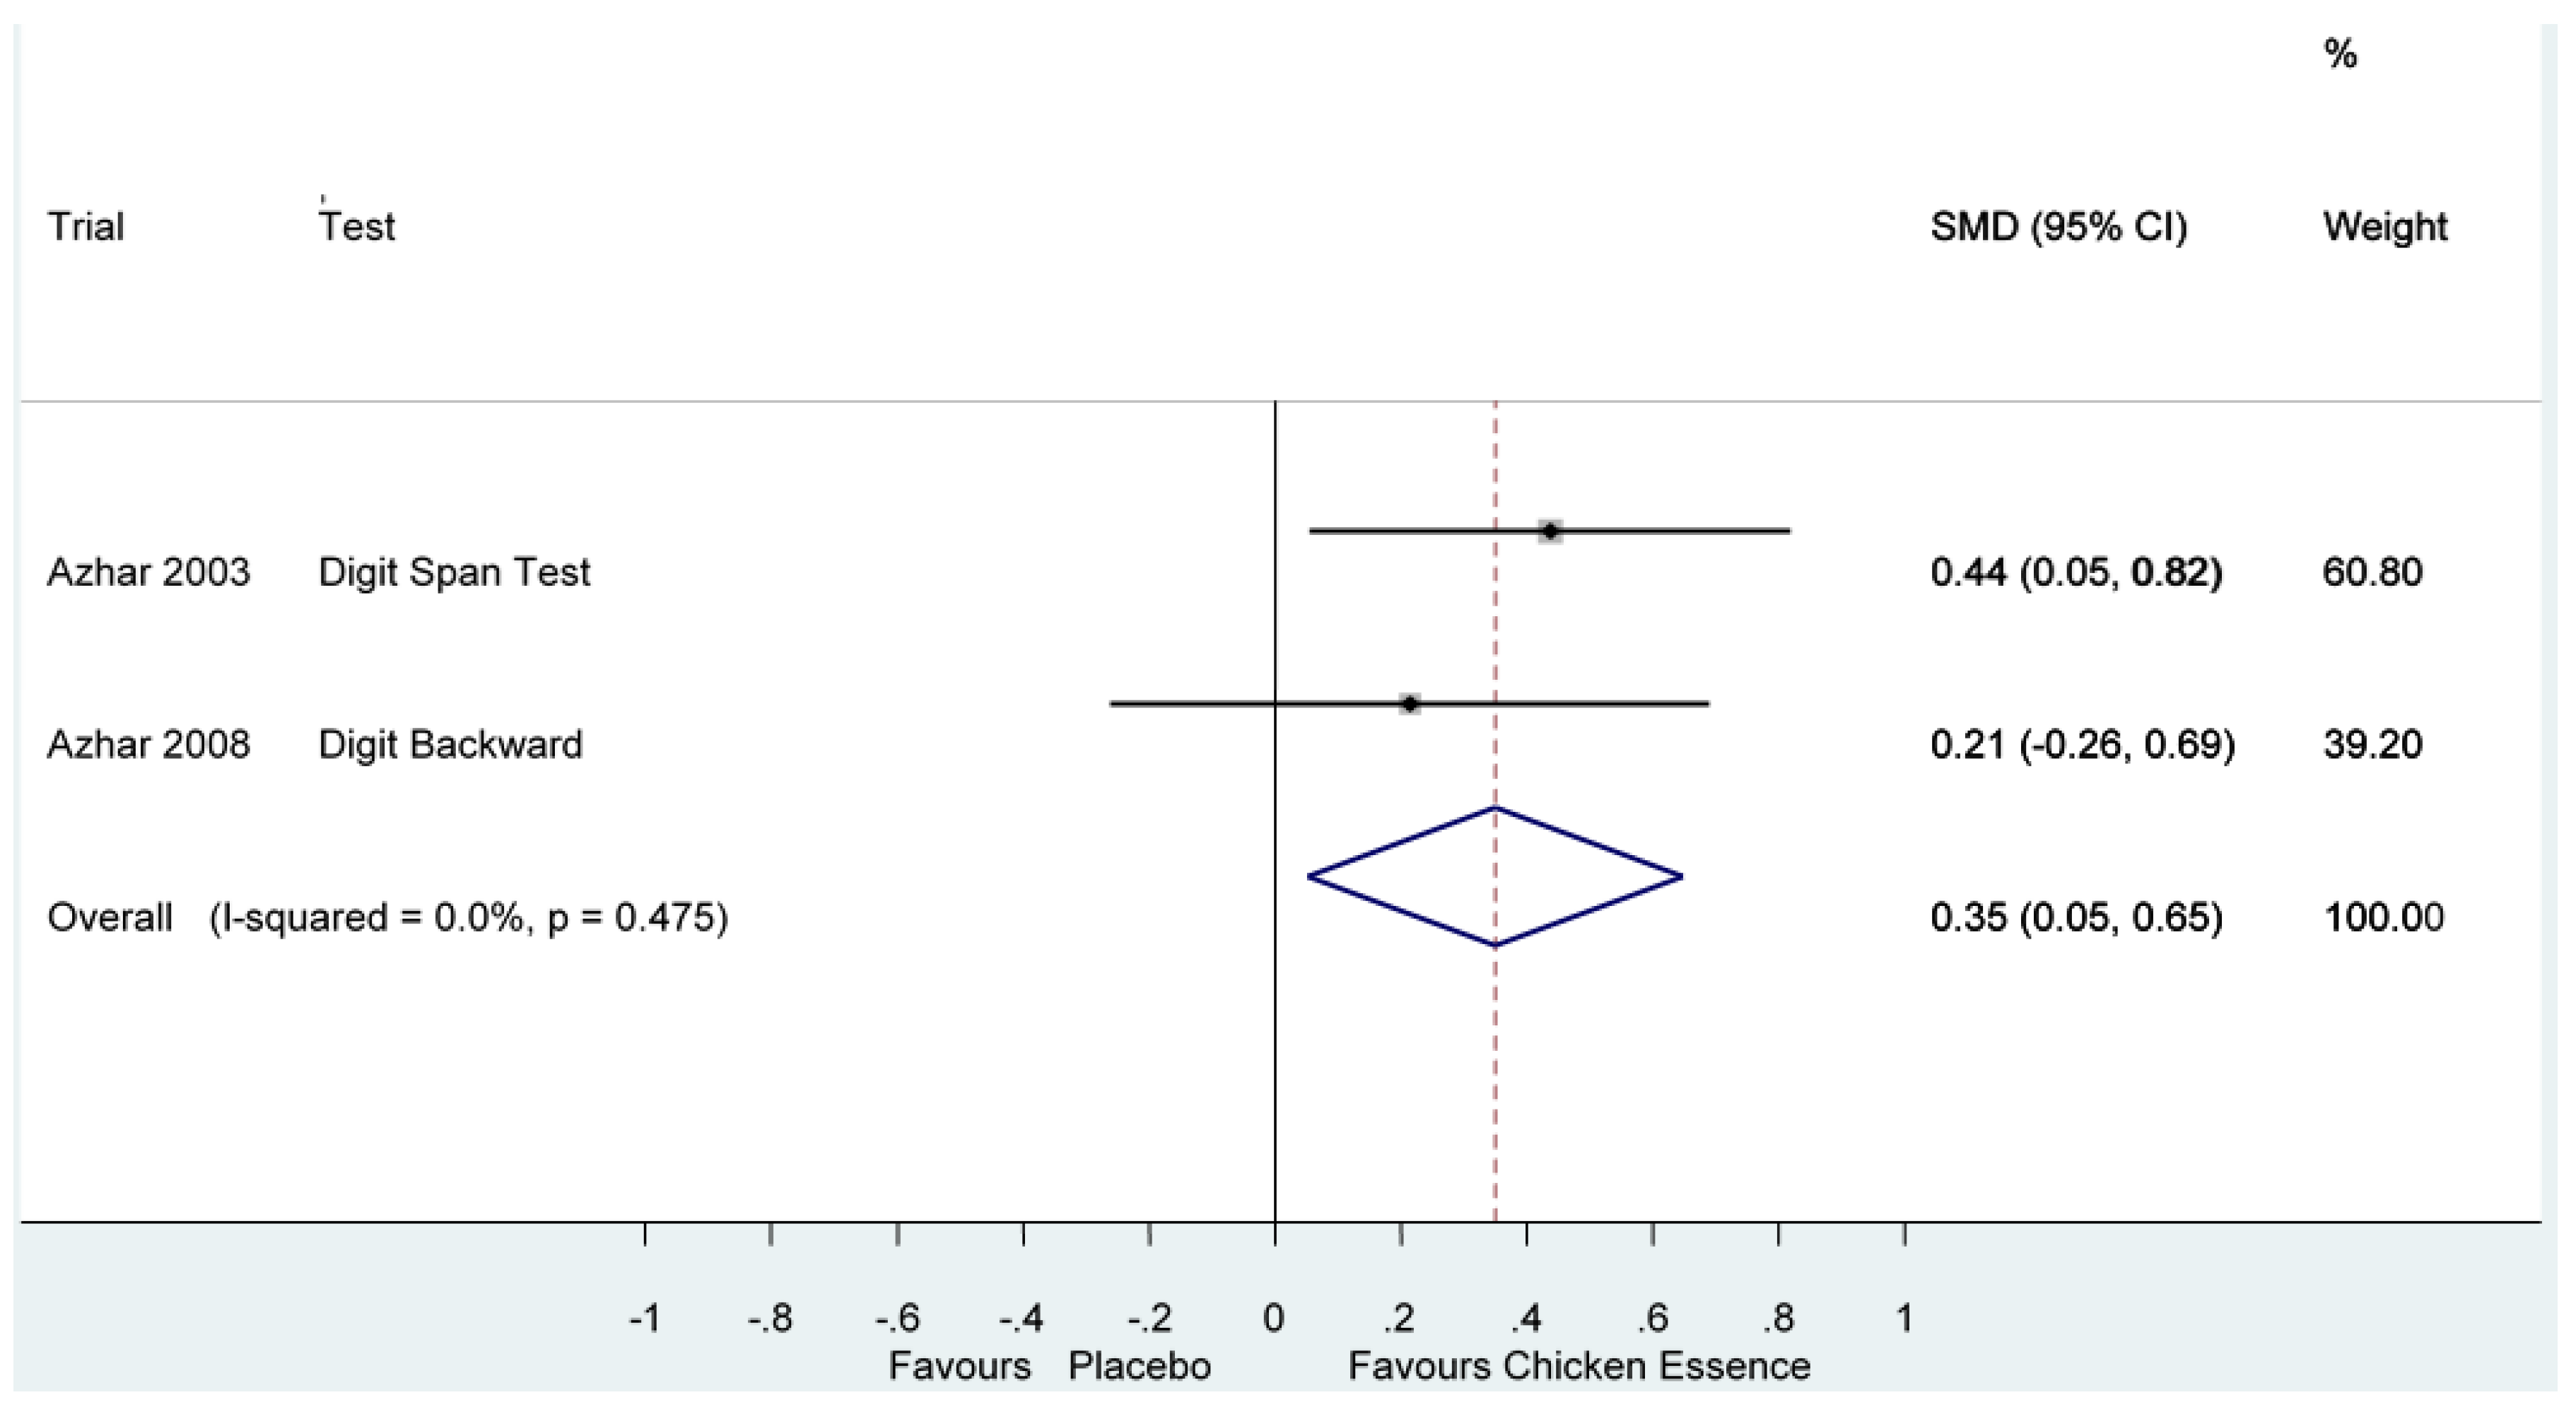
| Azhar 2003, [14] | High | Digit Span Test | Score (Longest list) | 0.70 (−0.001, 1.40) I2 =77.7%, p = 0.01 | |
| Azhar 2008, [15] | High | Digit Backward | Score (Longest list) | ||
| Azhar 2013, [2] | High | Digit Backward | Score (Longest list) | ||
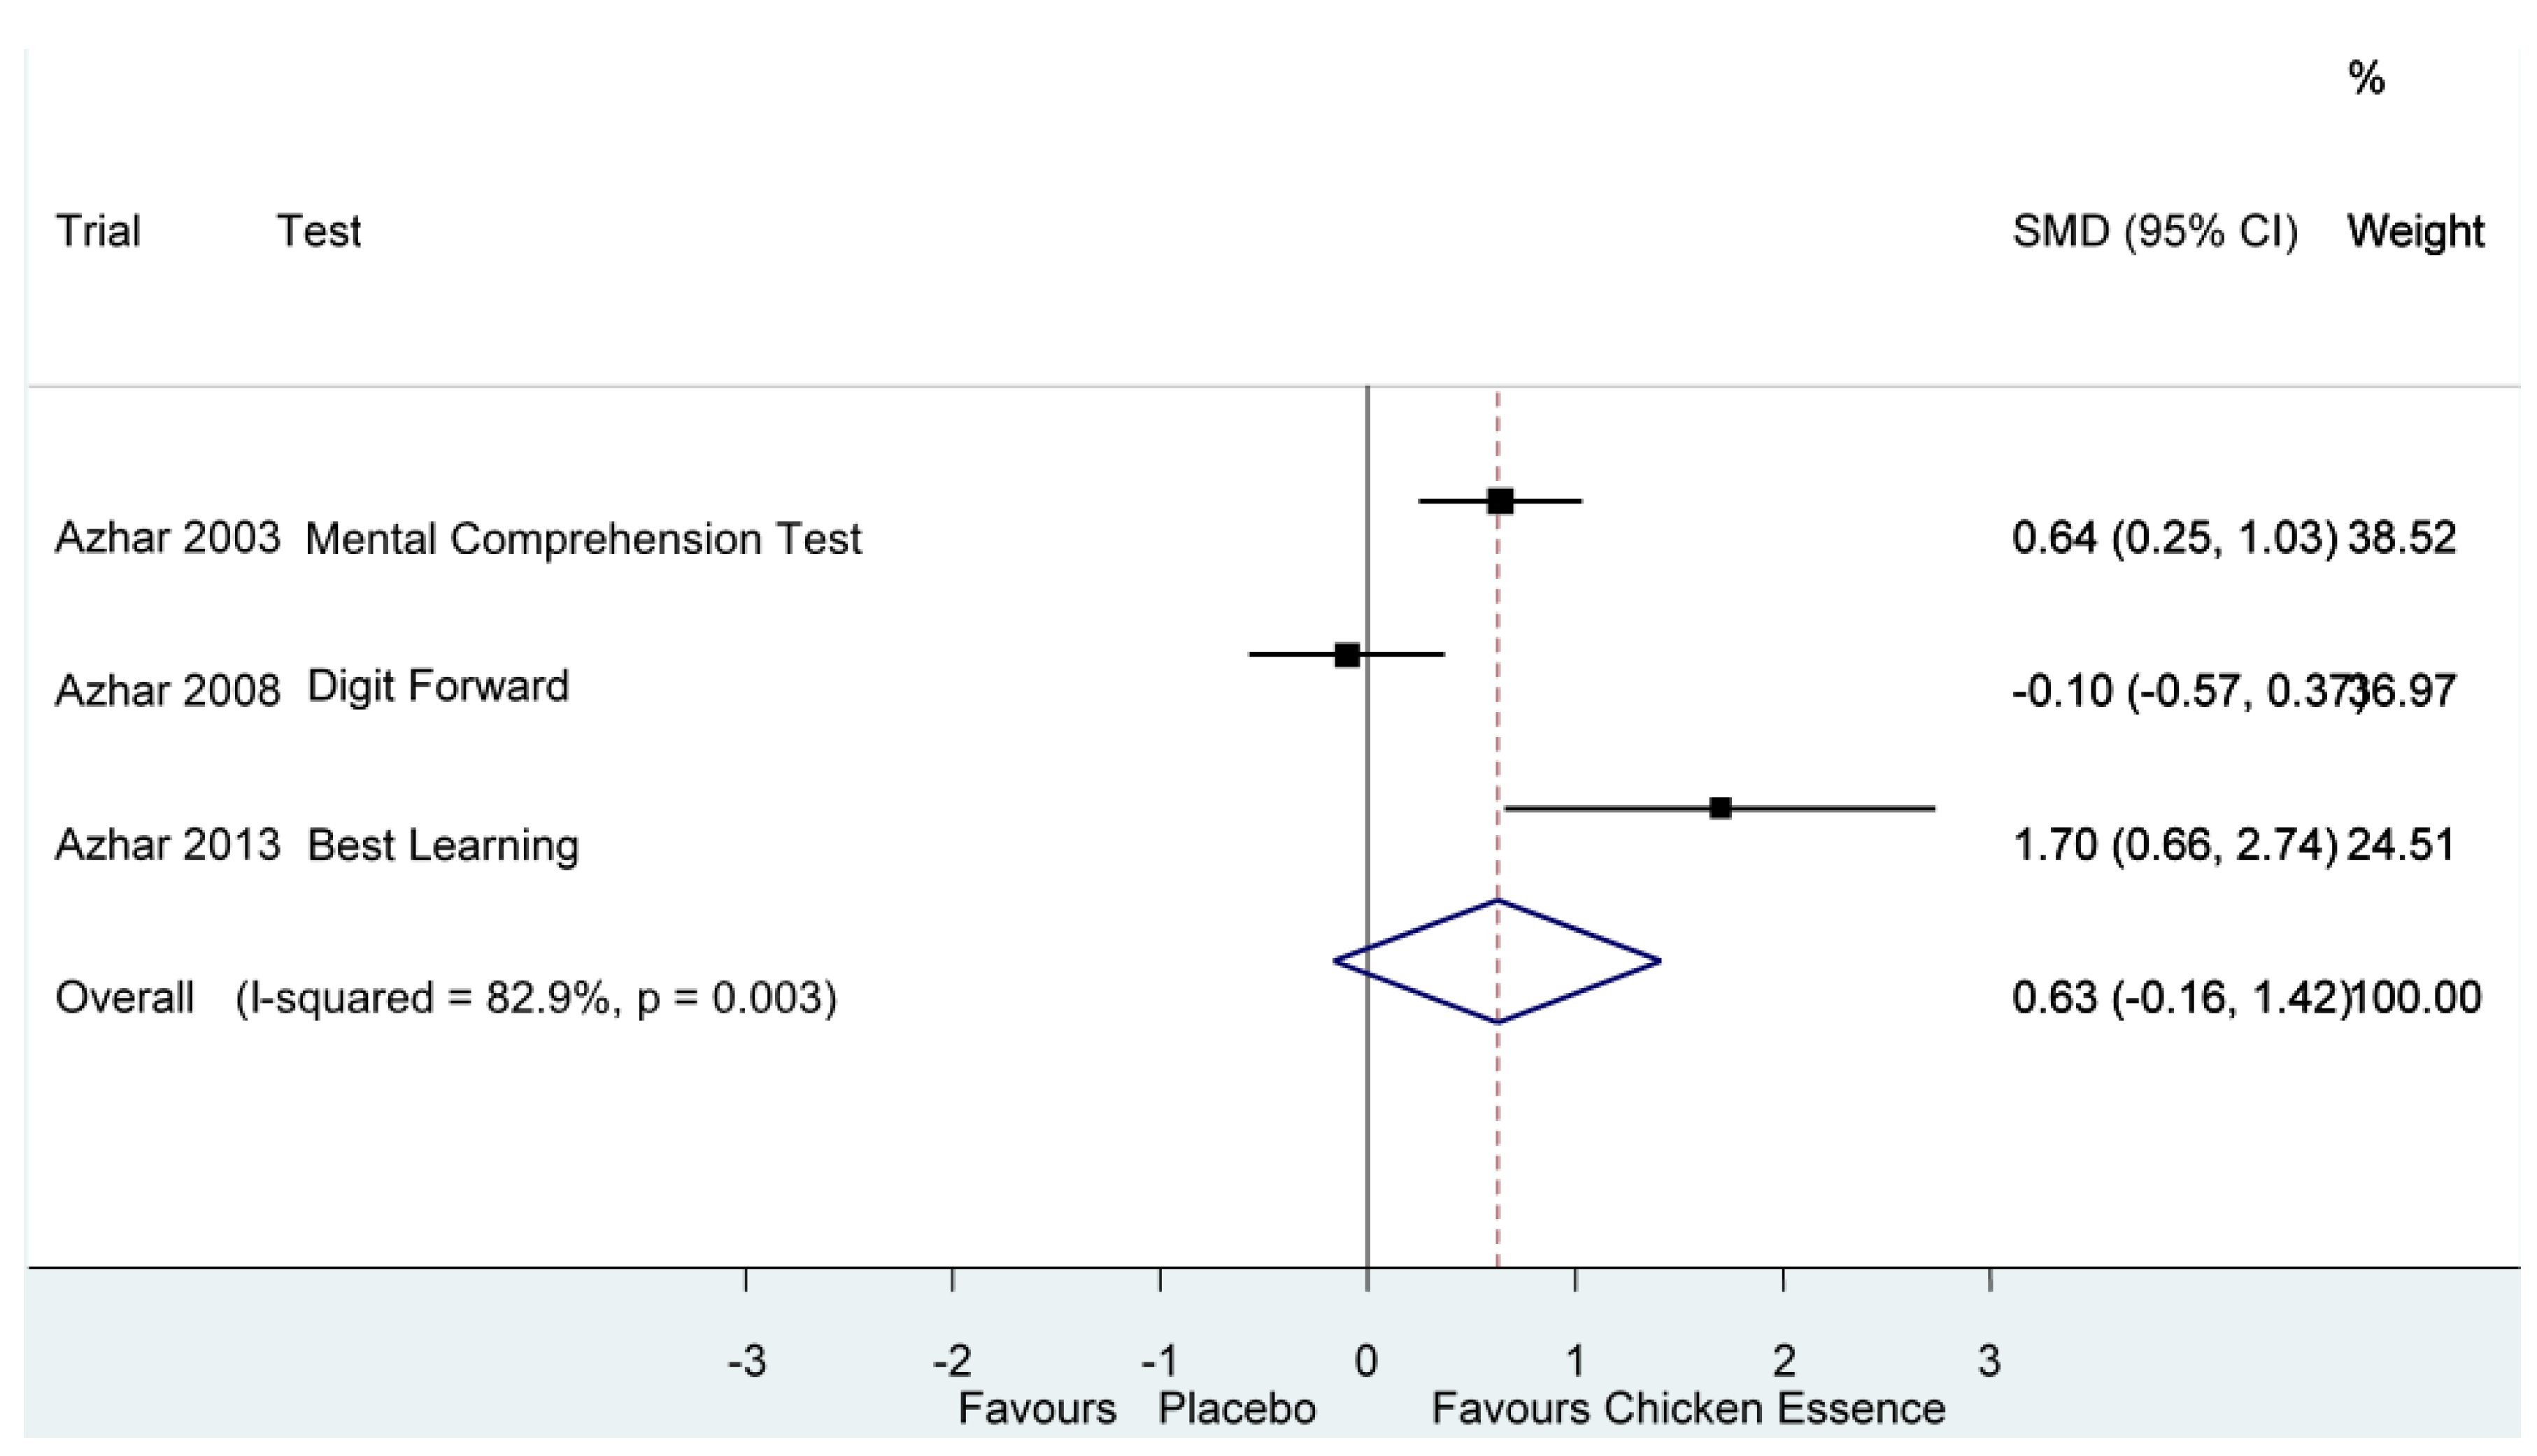
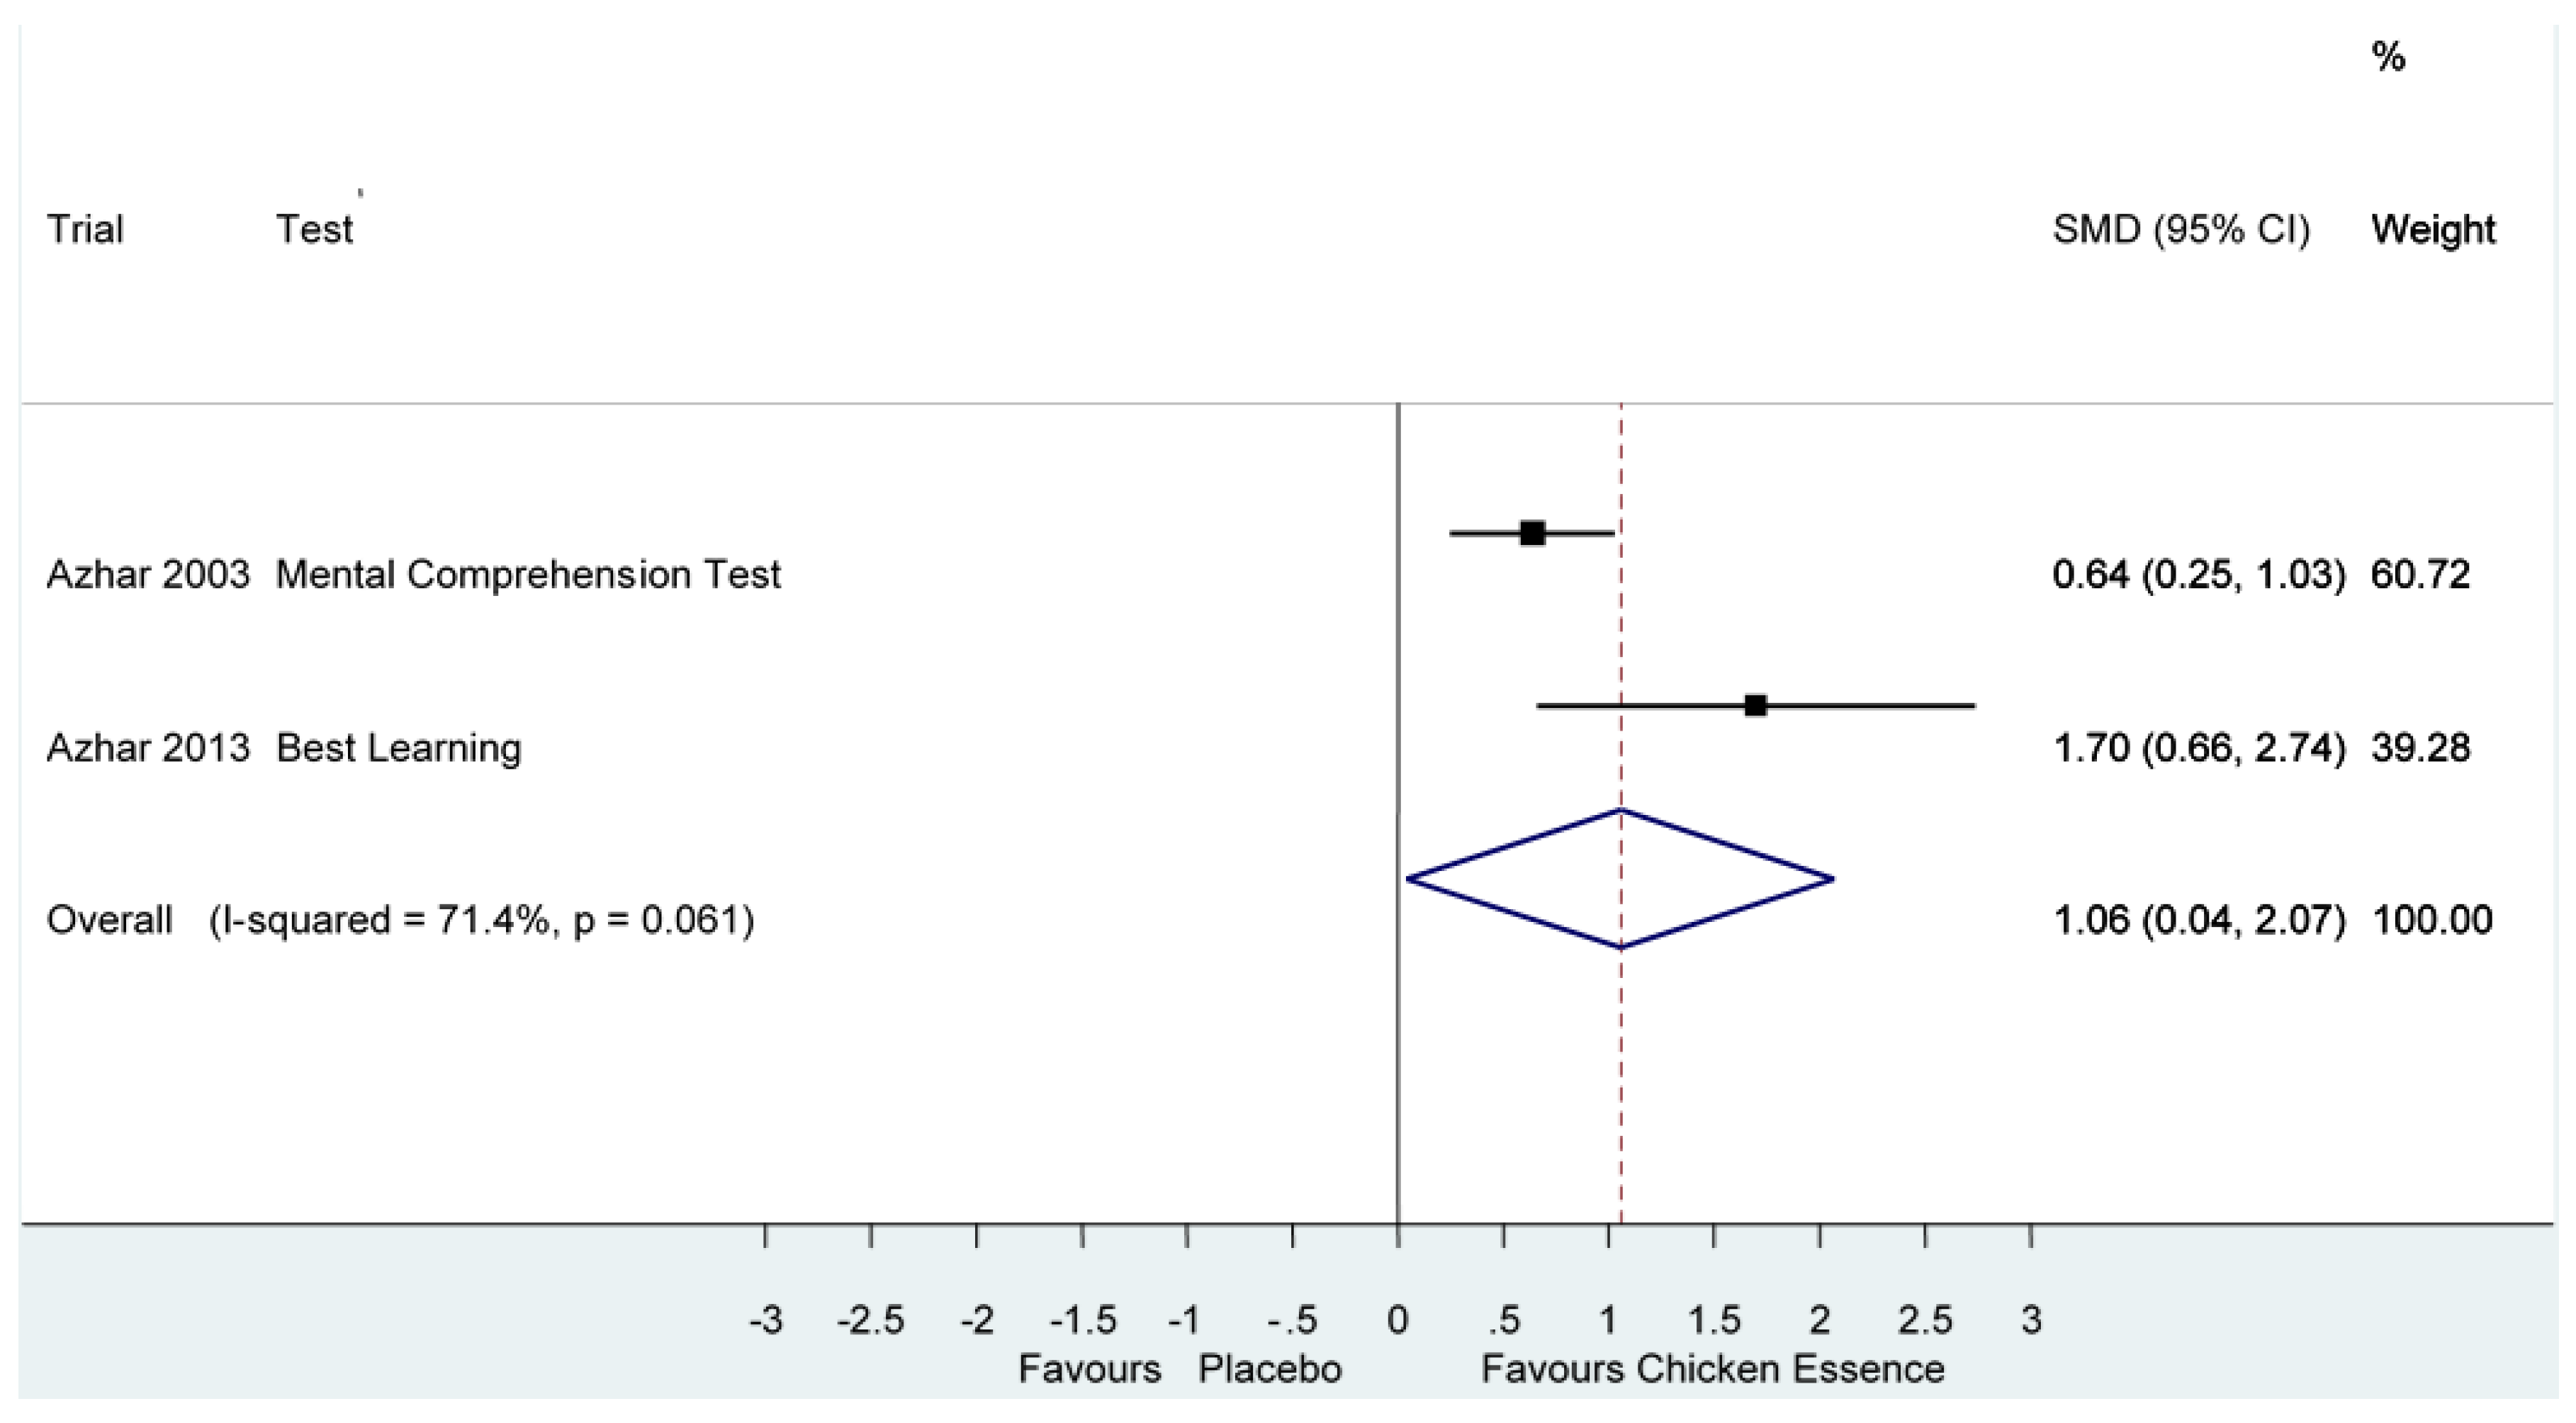
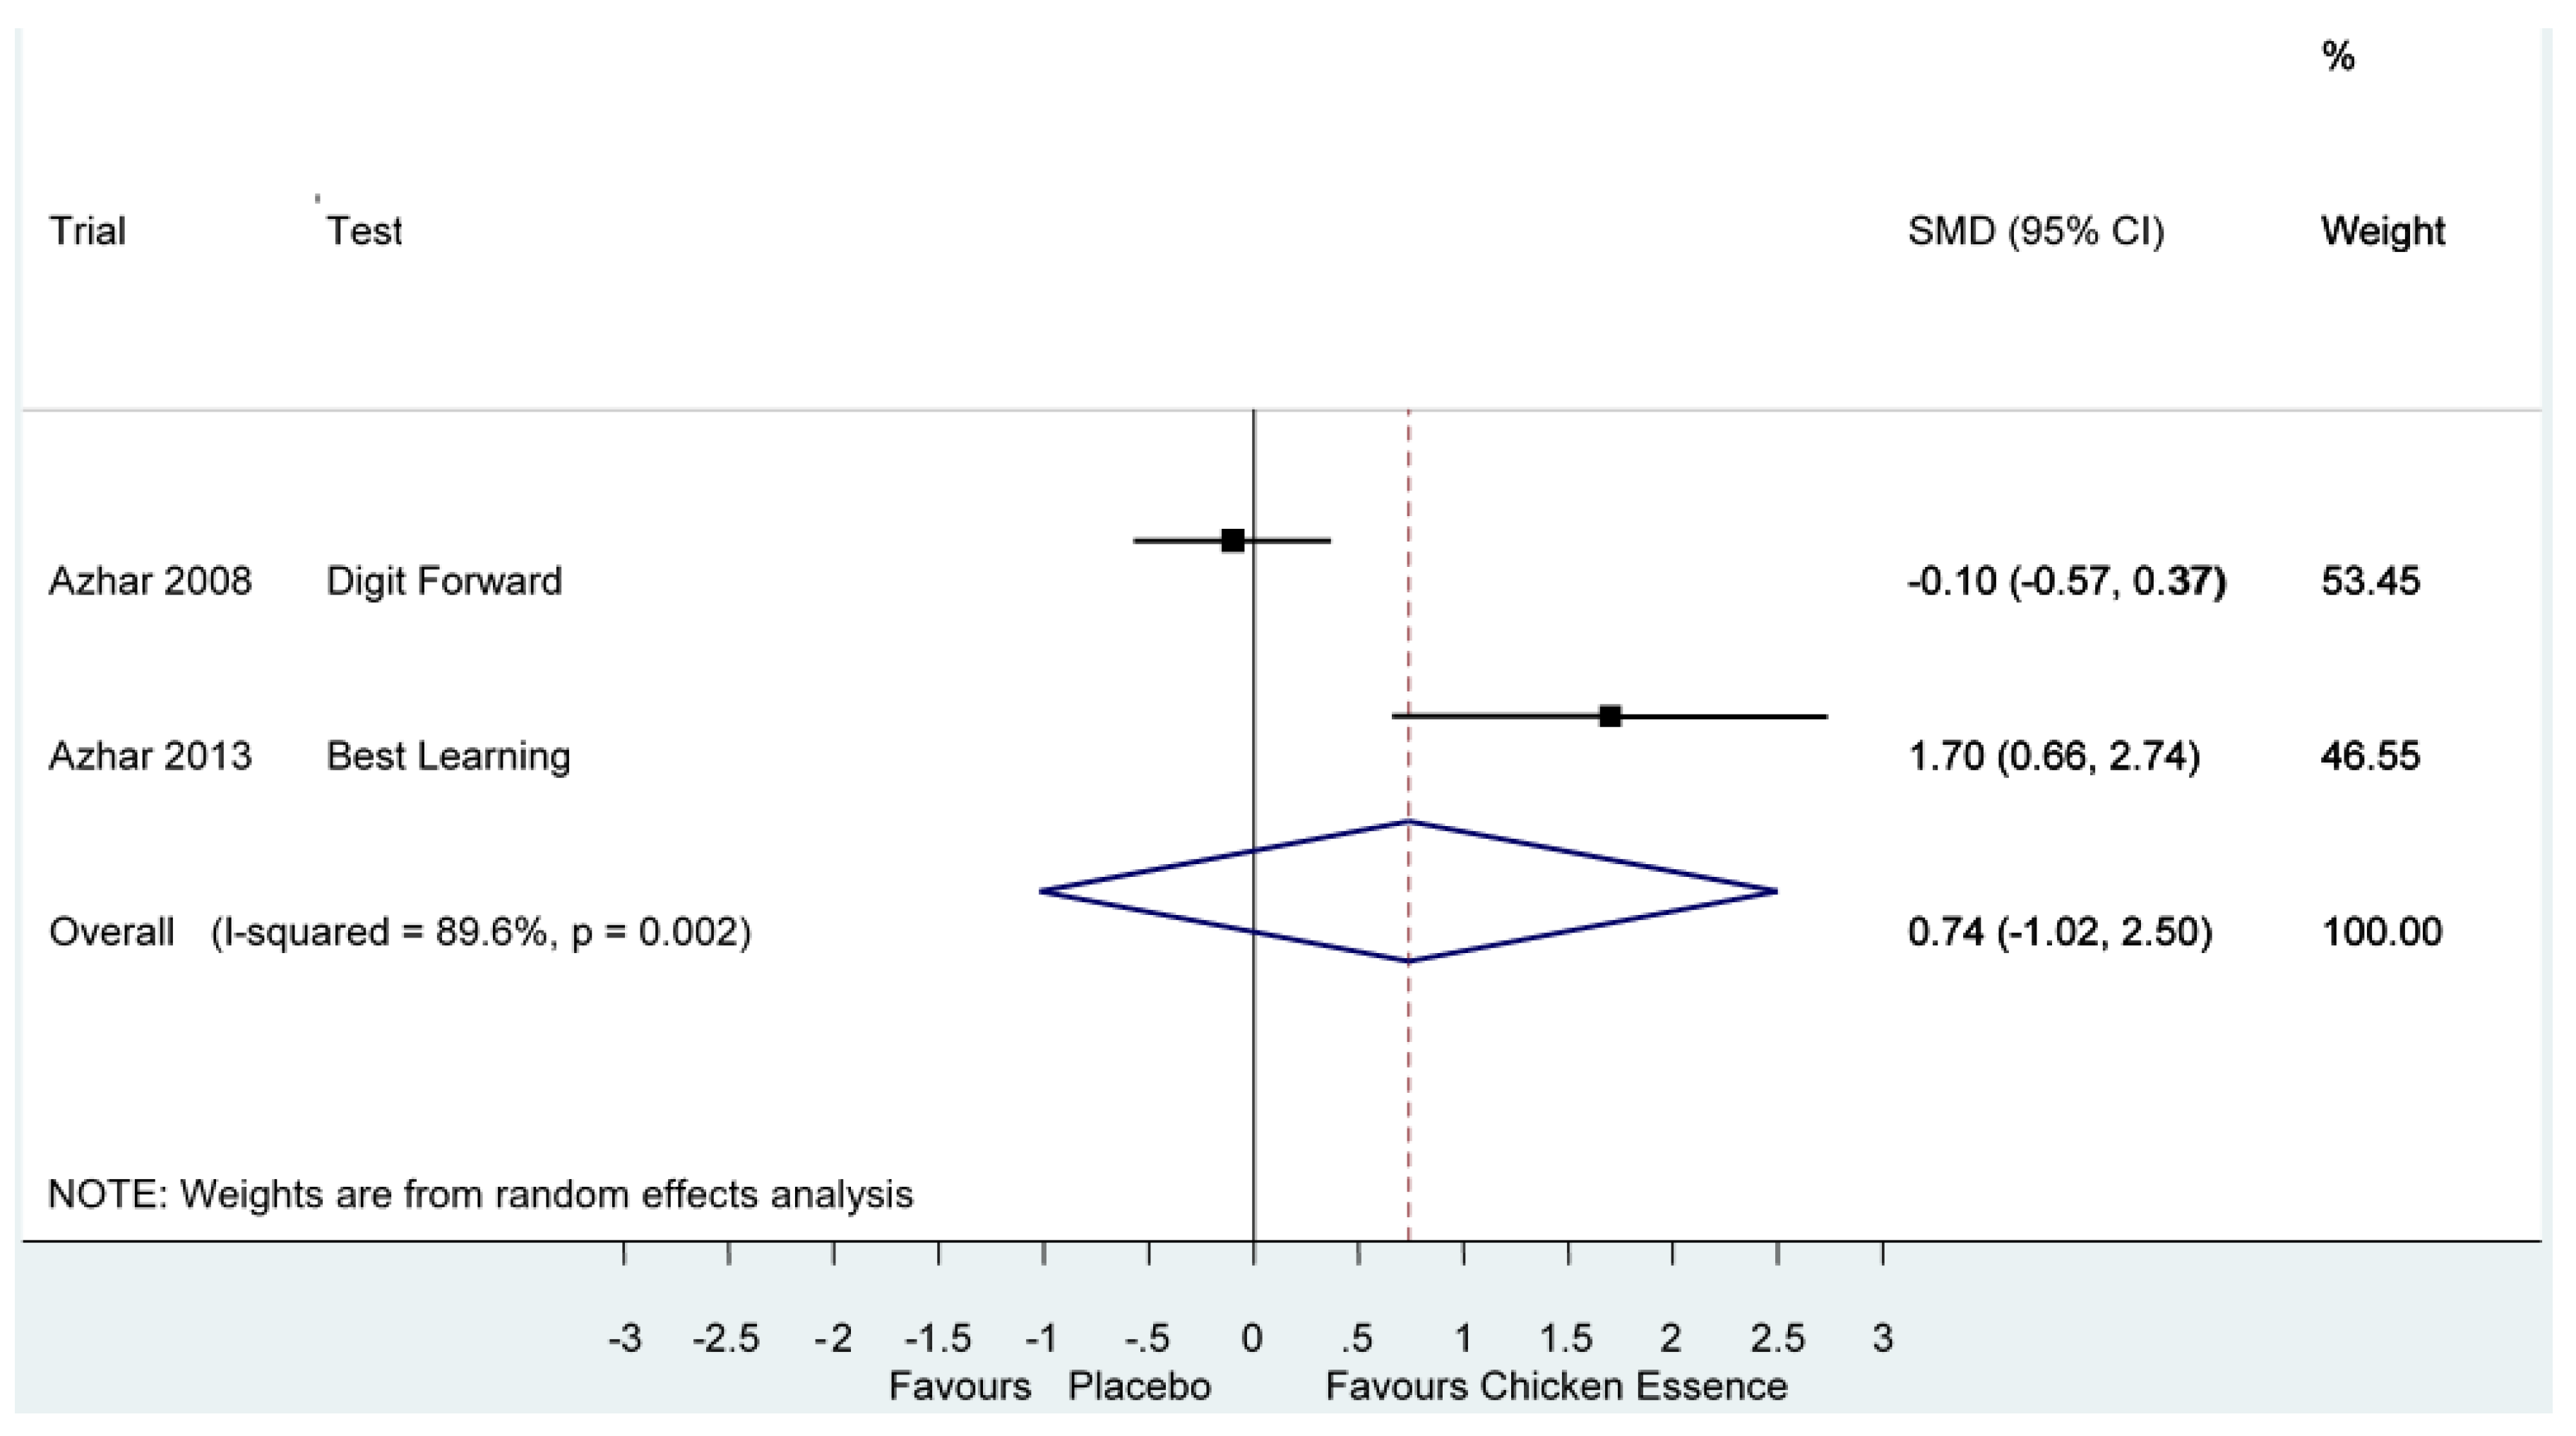
| Short-term Memory | Azhar 2003, [14] | High | Mental Comprehension Test | Score (NR ~) | 0.63 (−0.16, 1.42) I2 = 82.9%, p = 0.00 |
| Azhar 2008, [15] | High | Digit Forward | Score (NR ~) | ||
| Azhar 2013, [2] | High | Best Learningβ | Score (NR ~) |
3.5. Adverse Effects
3.6. Quality of Evidence
3.7. Sensitivity Analysis
| Outcomes | Relative Effect (95% CI) | No of Participants (Studies) | Quality of the Evidence (GRADE) |
|---|---|---|---|
| Executive Functions Error Rate Follow-up: 7–10 days | The mean executive functions in the intervention groups was 0.55 standard deviations lower (1.04 to 0.06 lower) | 62 (2 studies) | ⊕⊕⊝⊝ low 1 |
| Executive Functions Performance Score Follow-up: 2–8 weeks | The mean executive functions in the intervention groups was 0.70 standard deviations higher (0.001 lower to 1.4 higher) | 197 (3 studies) | ⊕⊝⊝⊝ very low 2,3 |
| Short-term Memory Performance Score Follow-up: 2–8 weeks | The mean short-term memory in the intervention groups was 0.63 standard deviations higher (0.16 lower to 1.42 higher) | 197 (3 studies) | ⊕⊝⊝⊝ very low 2,4 |
4. Discussion
5. Conclusions
Acknowledgments
Author Contributions
Conflicts of Interest
Appendix A. Assessment of quality of trials using Risk of Bias (ROB) tool.
| Items | Judgement | Specifics |
|---|---|---|
| Sequence Generation | High | Quote: “according to a pre-arithmetic calculation test to equalize in both groups the abilities to perform tasks“. Comment: A non-random approach was employed. Review authors believe this can introduce bias. |
| Allocation Concealment | Unclear | There was no description of allocation concealment. |
| Blinding | High | Quote: “same appearance and caloric content” Comment: The smell and taste of the placebo can differ from chicken essence (CE). Review authors believe this can introduce bias. |
| Incomplete Outcome Data | Low | Quote: “4/20 dropouts. (refused to continue the test)” Comment: Review authors believe no bias was introduced. |
| Selective Reporting | Low | Review authors believe no bias was introduced as all the pre-specified outcomes were adequately reported. |
| Other sources of bias | Unclear | There was no mention of funding, or declaration of conflict of interest. |
| Overall | High |
| Items | Judgement | Specifics |
|---|---|---|
| Sequence Generation | Unclear | Quote: “subjects were randomly divided”. Comment: Method of sequence generation was not specified. |
| Allocation Concealment | Unclear | There was no description of allocation concealment. |
| Blinding | High | Quote: “double-blind”; “taste difference between test samples”; “all subjects had not previously taken CEC”; “Investigator 1 who conducted the tests were blinded to the samples”; “Investigator 2 kept a record of all the samples”. Comment: The smell and taste of the placebo can differ from CE. Review authors believe this can introduce bias. |
| Incomplete Outcome Data | Low | Quote: “5/57 dropouts in placebo group, 4/60 dropouts in CE group, 3/58 dropouts in carrageenan group (due to personal reasons, non-compliance); 1/176 missing data”. Comment: Review authors believe no bias was introduced. |
| Selective Reporting | Low | Review authors believe no bias was introduced as all the pre-specified outcomes were adequately reported. |
| Other sources of bias | Unclear | There was no mention of funding, or declaration of conflict of interest. |
| Overall | High |
| Items | Judgement | Specifics |
|---|---|---|
| Sequence Generation | Unclear | Quote: “subjects were randomly divided”. Comment: Method of sequence generation was not specified. |
| Allocation Concealment | Unclear | There was no description of allocation concealment. |
| Blinding | High | Quote: “double-blind”; “placebo made up of milk protein (casein), as a comparison test sample”; “potential taste differences”; “most subject had not taken CEC previously, those who had taken it more than 10 years ago indicated they have no significant recollections”; “Investigator 1 who conducted the tests were blinded to the samples”; “Investigator 2 maintained a record of all the samples”. Comment: The smell and taste of the placebo can differ from CE. Review authors believe this can introduce bias. |
| Incomplete Outcome Data | High | Quote: “25/102 excluded (due to technical errors); 8/102 missing data”. Comment: One-third of the initial sample size (33/102) was excluded. Review authors believe this can introduce bias. |
| Selective Reporting | Low | Review authors believe no bias was introduced as all the pre-specified outcomes were adequately reported. |
| Other sources of bias | Unclear | There was no mention of funding, or declaration of conflict of interest. |
| Overall | High |
| Items | Judgement | Specifics |
|---|---|---|
| Sequence Generation | Unclear | Quote: “subjects were randomly divided”. Comment: Method of sequence generation was not specified. |
| Allocation Concealment | Unclear | Quote: “investigator did not know their group allocation” Comment: Method of allocation concealment was not specified. |
| Blinding | Unclear | Quote: “double-blind”; “placebo tablets contain microcrystalline cellulose”; “Investigator who conducted the tests were blinded to the information about the group allocation and samples provided”; “Independent investigator who has no information about the assessment maintained the record of all the samples and group allocation”. Comment: It is unclear whether the placebo had similar appearance and taste as CE tablet. Hence it is unclear whether if the study design was single- or double-blinded. |
| Incomplete Outcome Data | High | Quote: 26/40 excluded from data analysis due to either non-compliance of supplementation or withdrawal from the study. Comment: More than half of the initial sample size (26/40) was excluded. Review authors believe this can introduce bias. |
| Selective Reporting | High | One of the outcomes (DS Forward test) as mentioned in protocol was not reported. Review authors believe this can introduce bias. |
| Other sources of bias | High | The trial clearly mentioned that it was funded by CE company. In addition, it was clearly mentioned that three of the authors were affiliated with CE company where they were involved with study conduct, data analysis, and preparation of the manuscript. Review author believes this can introduce bias. |
| Overall | High |
| Items | Judgement | Description |
|---|---|---|
| Sequence Generation | Unclear | Quote: “volunteers were divided randomly”. Comment: Method of sequence generation was not specified. |
| Allocation Concealment | Unclear | There was no description on allocation concealment. |
| Blinding | High | Quote: “double-blind”; “placebo contained milk casein, caramel, and flavoring to yield proteins, calories, and color similar to CE”; “no subjects had previously taken CE”. Comment: Even placebo was reported to be prepared in a way to have proteins, calories, and color similar to CEC, placebo can still have different taste and smell compared to CE. Review authors believe this can introduce bias. |
| Incomplete Outcome Data | Unclear | There was no description of dropouts or withdrawals. |
| Selective Reporting | Low | Review authors believe no bias was introduced as all the pre-specified outcomes were adequately reported. |
| Other sources of bias | High | Three authors were affiliated with CE company and there was no mention of funding, or declaration of conflict of interest. Review authors believe this can introduce bias. |
| Overall | High |
| Items | Judgement | Specifics |
|---|---|---|
| Sequence Generation | Unclear | Quote: “randomly assigned”. Comment: Method of sequence generation was not specified. |
| Allocation Concealment | Unclear | There was no description of allocation concealment. |
| Blinding | High | Quote: “protein content, caloric content and color similar to CE” Comment: Even placebo was reported to be prepared in a way to have proteins, calories, and color similar to CEC, placebo can still have different taste and smell compared to CE. Review authors believe this can introduce bias. |
| Incomplete Outcome Data | Unclear | There was no description of dropouts or withdrawals. |
| Selective Reporting | Low | Review authors believe no bias was introduced as all the pre-specified outcomes were adequately reported. |
| Other sources of bias | Unclear | The trial clearly mentioned that it was funded by CE company. In addition, it was clearly mentioned that two of the authors were affiliated with CE company where they were involved with study design and conduct, data analysis, and data interpretation. Review author believes this can introduce bias. |
| Overall | High |
| Items | Judgement | Specifics |
|---|---|---|
| Sequence Generation | Unclear | Quote: “randomly allocated” Comment: Method of sequence generation was not specified. |
| Allocation Concealment | Unclear | There was no description of allocation concealment. |
| Blinding | Unclear | Quote: “double-blind”, “blind was successful” Comment: Patients-blinding was checked by test. However, there was no description on the blinding of personnel and outcome assessors. |
| Incomplete Outcome Data | Low | Quote: “4/50 dropouts where 3 were in placebo arm and 1 in CE arm”. Comment: Review authors believe no bias was introduced. |
| Selective Reporting | Low | Review authors believe no bias was introduced as all the pre-specified outcomes were adequately reported. |
| Other sources of bias | Low | The study clearly mentioned it was funded by CE company. However, authors declared no conflict of interest where the funding sponsors had no role in study design, or any part of study design and conduct, or data analysis, or preparation and publication of the study. Review authors believe no risk was introduced. |
| Overall | Unclear |
Appendix B
| Items | Nagai 1996, [4] | Azhar 2003 | Azhar 2008 | Azhar 2013 | Konagai 2013, [3] | Yamano 2013 | Young 2015 |
|---|---|---|---|---|---|---|---|
| Was the study described as randomized? | 0 | 1 | 1 | 1 | 1 | 1 | 1 |
| Was the method used to generate the sequence of randomization described and appropriate? | 0 | 0 | 0 | 0 | 0 | 0 | 0 |
| Was the study described as double blind? | 0 | 1 | 1 | 1 | 1 | 0 | 1 |
| Was the method of double blinding described and appropriate? | 0 | 0 | 0 | 0 | 0 | 0 | 0 |
| Was there a description of withdrawals and dropouts? | 1 | 0 | 0 | 1 | 0 | 0 | 1 |
| Deduct 1 point if the method used to generate sequence of randomization was described and it was inappropriate. | 0 | 0 | 0 | 0 | 0 | 0 | 0 |
| Deduct 1 point if the study was described as double blind but the method of blinding was inappropriate. | 0 | −1 | −1 | −1 | −1 | 0 | 0 |
| Total Jadad scores | 1 | 1 | 1 | 2 | 1 | 1 | 3 |
Appendix C. Pooled results using a random-effects model.


Appendix D. Pooled results with removal of test which possibly caused heterogeneity.


References
- Li, Y.F.; He, R.R.; Tsoi, B.; Kurihara, H. Bioactivities of chicken essence. J. Food Sci. 2012, 77, R105–R110. [Google Scholar] [CrossRef] [PubMed]
- Azhar, Z.M.; Zubaidah, J.O.; Norjan, K.O.; Zhuang, C.Y.; Tsang, F. A pilot placebo-controlled, double-blind, and randomized study on the cognition-enhancing benefits of a proprietary chicken meat ingredient in healthy subjects. Nutr. J. 2013, 12, 121. [Google Scholar] [CrossRef] [PubMed]
- Konagai, C.; Watanabe, H.; Abe, K.; Tsuruoka, N.; Koga, Y. Effects of essence of chicken on cognitive brain function: A near-infrared spectroscopy study. Biosci. Biotechnol. Biochem. 2013, 77, 178–181. [Google Scholar] [CrossRef] [PubMed]
- Nagai, H.; Harada, M.; Nakagawa, M.; Tanaka, T.; Gunadi, B.; Setiabudi, M.L.; Uktolseja, J.L.; Miyata, Y. Effects of chicken extract on the recovery from fatigue caused by mental workload. Appl. Hum. Sci. J. Physiol. Anthropol. 1996, 15, 281–286. [Google Scholar] [CrossRef]
- Young, H.; Benton, D.; Carter, N. The effect of chicken extract on mood, cognition and heart rate variability. Nutrients 2015, 7, 887–904. [Google Scholar] [CrossRef] [PubMed]
- Tsi, D.; Nah, A.K.; Kiso, Y.; Moritani, T.; Ono, H. Clinical study on the combined effect of capsaicin, green tea extract and essence of chicken on body fat content in human subjects. J. Nutr. Sci. Vitaminol. 2003, 49, 437–441. [Google Scholar] [CrossRef] [PubMed]
- Tomonaga, S.; Hayakawa, T.; Yamane, H.; Maemura, H.; Sato, M.; Takahata, Y.; Morimatsu, F.; Furuse, M. Oral administration of chicken breast extract increases brain carnosine and anserine concentrations in rats. Nutr. Neurosci. 2007, 10, 181–186. [Google Scholar] [CrossRef] [PubMed]
- Geissler, C.; Boroumand-Naini, M.; Harada, M.; Iino, T.; Hirai, K.; Suwa, Y.; Tanaka, T.; Iwata, S. Chicken extract stimulates haemoglobin restoration in iron deficient rats. Intern. J. Food Sci. Nutri. 1996, 47, 351–360. [Google Scholar] [CrossRef]
- Brand’s. Brand’s Essence of Chicken. Available online: http://www.brandsworld.com.sg/Our-Products/Essence-of-Chicken (accessed on 12 August 2015).
- New Moon. New Moon Essence of Chicken. Available online: http://www.newmoon.com.sg/product.asp?id=43&mID=10&sID= (accessed on 12 August 2015).
- Eu Yan Sang. Essence of Chicken and Fish. Available online: http://www.euyansang.com.sg/food-essence-of-chicken-fish/ (accessed on 12 August 2015).
- Taiwan Trade. Urn Drop Chicken Essence, Taiwan Native Chicken. Available online: http://www.taiwantrade.com.tw/EP/koyaka/products-detail/en_US/881667/Urn_Drop_Chicken_Essence,Taiwan_Native_Chicken/ (accessed on 12 August 2015).
- Yamano, E.; Tanaka, M.; Ishii, A.; Tsuruoka, N.; Abe, K.; Watanabe, Y. Effects of chicken essence on recovery from mental fatigue in healthy males. Med. Sci. Monit. 2013, 19, 540–547. [Google Scholar] [PubMed]
- Azhar, M.; Syedsahiljamalulail, S. Effect of taking chicken essence on stress and cognition of human volunteers. Malays. J. Nutr. 2003, 9, 19–29. [Google Scholar]
- Azhar, M.; Zubaidah, J.; Norjan, K. Effect of taking chicken essence on cognitive functioning of normal stressed human volunteers. Malays. J. Med. Health Sci. 2008, 4, 57–68. [Google Scholar]
- Moher, D.; Liberati, A.; Tetzlaff, J.; Altman, D.G. Preferred reporting items for systematic reviews and meta-analyses: The prisma statement. Ann. Intern. Med. 2009, 151, 264–269. [Google Scholar] [CrossRef] [PubMed]
- De Jager, C.A.; Dye, L.; de Bruin, E.A.; Butler, L.; Fletcher, J.; Lamport, D.J.; Latulippe, M.E.; Spencer, J.P.; Wesnes, K. Criteria for validation and selection of cognitive tests for investigating the effects of foods and nutrients. Nutr. Rev. 2014, 72, 162–179. [Google Scholar] [CrossRef] [PubMed]
- Jansen, C.E.; Miaskowski, C.; Dodd, M.; Dowling, G.; Kramer, J. A metaanalysis of studies of the effects of cancer chemotherapy on various domains of cognitive function. Cancer 2005, 104, 2222–2233. [Google Scholar] [CrossRef] [PubMed]
- Higgins, J.P.; Green, S. Cochrane Handbook for Systematic Reviews of Interventions; Wiley Online Library: Chichester, England, 2008; Volume 5. [Google Scholar]
- Jadad, A.R.; Moore, R.A.; Carroll, D.; Jenkinson, C.; Reynolds, D.J.M.; Gavaghan, D.J.; McQuay, H.J. Assessing the quality of reports of randomized clinical trials: Is blinding necessary? Control. Clin. Trials 1996, 17, 1–12. [Google Scholar] [CrossRef]
- DerSimonian, R.; Laird, N. Meta-analysis in clinical trials. Control. Clin. Trials 1986, 7, 177–188. [Google Scholar] [CrossRef]
- Andrews, J.; Guyatt, G.; Oxman, A.D.; Alderson, P.; Dahm, P.; Falck-Ytter, Y.; Nasser, M.; Meerpohl, J.; Post, P.N.; Kunz, R.; et al. Grade guidelines: 14. Going from evidence to recommendations: The significance and presentation of recommendations. J. Clin. Epidemiol. 2013, 66, 719–725. [Google Scholar] [CrossRef] [PubMed]
- Borenstein, M.; Hedges, L.V.; Higgins, J.; Rothstein, H.R. A basic introduction to fixed-effect and random-effects models for meta-analysis. Res. Synth. Method. 2010, 1, 97–111. [Google Scholar] [CrossRef] [PubMed]
- Chengappa, K.N.; Turkin, S.R.; DeSanti, S.; Bowie, C.R.; Brar, J.S.; Schlicht, P.J.; Murphy, S.L.; Hetrick, M.L.; Bilder, R.; Fleet, D. A preliminary, randomized, double-blind, placebo-controlled trial of l-carnosine to improve cognition in schizophrenia. Schizophr. Res. 2012, 142, 145–152. [Google Scholar] [CrossRef] [PubMed]
- Baraniuk, J.N.; el-Amin, S.; Corey, R.; Rayhan, R.; Timbol, C. Carnosine treatment for gulf war illness: A randomized controlled trial. Glob. J. Health Sci. 2013, 5, 69–81. [Google Scholar] [CrossRef] [PubMed]
- Wesnes, K.A. Evaluation of techniques to identify beneficial effects of nutrition and natural products on cognitive function. Nutr. Rev. 2010, 68 (Suppl. 1), S22–S28. [Google Scholar] [CrossRef] [PubMed]
- Tan, K.Y.; van der Beek, E.M.; Chan, M.Y.; Zhao, X.; Stevenson, L. Health claims on food products in southeast asia: Regulatory frameworks, barriers, and opportunities. Nutr. Rev. 2015, 73, 634–641. [Google Scholar] [CrossRef] [PubMed]
© 2016 by the authors; licensee MDPI, Basel, Switzerland. This article is an open access article distributed under the terms and conditions of the Creative Commons by Attribution (CC-BY) license (http://creativecommons.org/licenses/by/4.0/).
Share and Cite
Teoh, S.L.; Sudfangsai, S.; Lumbiganon, P.; Laopaiboon, M.; Lai, N.M.; Chaiyakunapruk, N. Chicken Essence for Cognitive Function Improvement: A Systematic Review and Meta-Analysis. Nutrients 2016, 8, 57. https://doi.org/10.3390/nu8010057
Teoh SL, Sudfangsai S, Lumbiganon P, Laopaiboon M, Lai NM, Chaiyakunapruk N. Chicken Essence for Cognitive Function Improvement: A Systematic Review and Meta-Analysis. Nutrients. 2016; 8(1):57. https://doi.org/10.3390/nu8010057
Chicago/Turabian StyleTeoh, Siew Li, Suthinee Sudfangsai, Pisake Lumbiganon, Malinee Laopaiboon, Nai Ming Lai, and Nathorn Chaiyakunapruk. 2016. "Chicken Essence for Cognitive Function Improvement: A Systematic Review and Meta-Analysis" Nutrients 8, no. 1: 57. https://doi.org/10.3390/nu8010057