Article

Plasma Free Amino Acid Responses to Intraduodenal Whey Protein, and Relationships with Insulin, Glucagon-Like Peptide-1 and Energy Intake in Lean Healthy Men

by
Natalie D. Luscombe-Marsh
1,2,*,
Amy T. Hutchison
1,
Stijn Soenen
1,
Robert E. Steinert
1,
Peter M. Clifton
1,3,
Michael Horowitz
1 and
Christine Feinle-Bisset
1
1
NHMRC Centre of Research Excellence in Translating Nutritional Science to Good Health, The University of Adelaide Discipline of Medicine, Adelaide 5000, Australia
2
CSIRO Food and Nutrition, PO Box 10041 Adelaide BC, Adelaide SA 5000, Australia
3
School of Pharmacology and Medical Sciences, University of South Australia, Adelaide 5001, Australia
*
Author to whom correspondence should be addressed.
Nutrients 2016, 8(1), 4; https://doi.org/10.3390/nu8010004
Submission received: 21 October 2015 / Revised: 11 December 2015 / Accepted: 14 December 2015 / Published: 4 January 2016
(This article belongs to the Special Issue Dairy Products and Human Health)

Abstract

:
This study determined the effects of increasing loads of intraduodenal (ID) dairy protein on plasma amino acid (AA) concentrations, and their relationships with serum insulin, plasma glucagon-like peptide-1 (GLP-1) and energy intake. Sixteen healthy men had concentrations of AAs, GLP-1 and insulin measured in response to 60-min ID infusions of hydrolysed whey protein administered, in double-blinded and randomised order, at 2.1 (P2.1), 6.3 (P6.3) or 12.5 (P12.5) kJ/min (encompassing the range of nutrient emptying from the stomach), or saline control (C). Energy intake was quantified immediately afterwards. Compared with C, the concentrations of 19/20 AAs, the exception being cysteine, were increased, and this was dependent on the protein load. The relationship between AA concentrations in the infusions and the area under the curve from 0 to 60 min (AUC0–60 min) of each AA profile was strong for essential AAs (R2 range, 0.61–0.67), but more variable for non-essential (0.02–0.54) and conditional (0.006–0.64) AAs. The AUC0–60 min for each AA was correlated directly with the AUC0–60 min of insulin (R2 range 0.3–0.6), GLP-1 (0.2–0.6) and energy intake (0.09–0.3) (p < 0.05, for all), with the strongest correlations being for branched-chain AAs, lysine, methionine and tyrosine. These findings indicate that ID whey protein infused at loads encompassing the normal range of gastric emptying increases plasma concentrations of 19/20 AAs in a load-dependent manner, and provide novel information on the close relationships between the essential AAs, leucine, valine, isoleucine, lysine, methionine, and the conditionally-essential AA, tyrosine, with energy intake, insulin and GLP-1.

1. Introduction

Calorie-controlled diets with moderately increased protein content are effective in the management of obesity due to their capacity to (i) suppress appetite [1] and, under ad-libitum feeding conditions, reduce energy intake [2]; (ii) promote loss of fat while preserving muscle mass [3,4]; (iii) increase insulin release and reduce postprandial glycemic excursions [1,3]; and (iv) improve lipid metabolism and blood pressure [1,3]. These benefits, however, are often not sustained for more than 12 months, and hence, greater understanding of the mechanisms underlying these benefits is required.
Oral and intraduodenal (ID) administration of dietary protein, including whey protein isolate (in both un-hydrolysed and hydrolysed form), like lipid and carbohydrate, modulates gastrointestinal (GI) motor activity and hormone release in a nutrient load-dependent manner [5,6,7]. In turn, these GI factors influence gastric emptying [8], postprandial glycaemia [9] and energy intake [5,6,7]. While whey protein isolate, co-ingested with carbohydrate, improves glycaemia by slowing gastric emptying and stimulating the release of glucagon-like peptide-1 (GLP-1) and/or glucose-dependent insulinotropic polypeptide (GIP) as well as insulin [10], our recent observations indicate that the effects of lipid–protein combinations on these gut hormones are related directly to the amount of lipid, and the effects on insulin and glucagon are related to the amount of protein, whereas the effects on energy intake appear dependent on a threshold load of ~12.5 kJ/min (or 3 kcal/min) of either nutrient being delivered to the duodenum [11]. This study also demonstrated that the effects of ID infused hydrolysed whey protein isolate (which did not contain fat or carbohydrate and was delivered at 12.5 kJ/min) on the GI factors were weaker than those of isocaloric lipid [11] suggesting the suppression of energy intake by protein may be dependent on additional mechanisms.
Several studies have reported modest associations between increased postprandial plasma essential amino acid (AA) concentrations, particularly the branched chain AAs, leucine, isoleucine and valine, with either an increased release of some gut hormones (particularly GLP-1 and GIP), insulin, or reduced energy intake [12,13,14]. Moreover, there is some evidence that other essential AAs, including lysine, threonine, phenylalanine, tryptophan, histidine, the conditionally-essential AAs, glutamine, arginine and tyrosine, and the non-essential AA, glutamate, may activate peripheral and central mechanisms involved in the regulation of energy intake and glucose homeostasis, although information is limited [15].
The aims of this study were to determine: (1) the effects of increasing loads of hydrolysed whey protein administered ID (thus mimicking the entry of the nutrient into the duodenum and bypassing any orosensory influences and inter-individual variations in gastric emptying), at rates reflective of the normal range of gastric emptying, on plasma concentrations of free AAs that were present within the whey; and (2) the relationships between plasma AA concentrations with insulin and GLP-1 concentrations and energy intake, outcomes that we have previously reported [7]. We hypothesised that hydrolysed whey protein infused ID at loads lower than (2.1 kJ/min (P2.1)), similar to (6.3 kJ/min (P6.3)), and toward the upper end (12.5 kJ/min (P12.5)), of normal gastric emptying rates would modulate the release of free AAs into the blood in a load-related manner, and leucine, isoleucine, valine, and potentially other AAs, would be related to the insulin and GLP-1 responses and energy intake.

2. Subjects and Methods

2.1. Subjects

Sixteen healthy lean men (mean age 27 ± 3 years, range 19–54 years; BMI 22.1 ± 0.6 kg/m2; range 18.5–24.8 kg/m2) participated in the study, as described [7]. In addition to the original power calculation [7], we calculated that n = 16 would allow us to detect relationships of r ≥ 0.5 between increasing loads of protein with total plasma AAs, and increasing plasma total AA concentrations with energy intake, plasma insulin and GLP-1 [5,6]. The Royal Adelaide Hospital Research Ethics Committee approved the study protocol, and the study was registered as a clinical trial with the Australia and New Zealand Clinical Trial Registry (www.anzctr.org.au, registration number 12610000376044). All subjects provided written, informed consent, prior to their inclusion.

2.2. Study Outline

While the aim of the original study was to evaluate the effects of increasing loads of ID infusion of hydrolysed whey protein at loads of (i) 2.1 kJ/min “P2.1”; (ii) 6.3 kJ/min “P6.3”; or (iii) 12.5 kJ/min “P12.5”; or (iv) a saline control “C”, at a rate of 4 mL/min for 60 min, on antropyloroduodenal motility (APD), and gut hormone, insulin, glucose, appetite and energy intake responses [7], we have now evaluated the effects on plasma free AAs to determine their relationships with GLP-1, insulin, and energy intake [7].

2.3. Intraduodenal Infusions

The infusion solutions were prepared as described [7]. In brief, hydrolysed whey protein (Whey Protein Hydrolysate 821, Fonterra Co-Operative Group Ltd, Auckland, New Zealand) was dissolved in varying amounts of saline and water to achieve the desired loads (i.e., 2.1, 6.3 and 12.5 kJ/min, which equated to 8, 24 and 48 g of protein over 60 min) and to ensure they were all a total volume of 240 mL and equi-osmolar (~640–676 mOsmol/L). As a component of dairy products, whey protein is common in the diet and has been shown to be the most satiating protein source when consumed orally [16,17]. We have used whey protein in our previous studies evaluating the role of macronutrients on GI function and appetite [7,10,11]. Hydrolysed whey was selected because it contains di- and tri-peptide fractions as well as larger peptides and some amino acids, and hence, more closely resembles partially digested protein, that would be entering the small intestine following oral protein ingestion [18,19]. Infusions were prepared on the morning of each study by an investigator who was not involved in the data analysis. The infusion apparatus was covered at all times so that both the primary investigator and the subject were blinded to the treatment. Table 1 depicts the specific AA composition of the hydrolysed whey protein.
Table 1. The amino acid (AA) composition of the whey protein infusion solutions a,b,c.
AATreatment
P2.1P6.3P12.5
g (mol/L)
Glutamic acid1.3 (36.3)3.8 (108.9)7.7 (217.8)
Leucine0.9 (29.7)2.8 (89.1)5.6 (178.2)
Aspartic acid0.8 (26.5)2.5 (79.3)5.1 (158.7)
Lysine0.8 (23.4)2.5 (70.3)5.0 (140.5)
Alanine0.4 (20.8)1.3 (62.4)2.7 (124.8)
Valine0.4 (14.7)1.2 (44.2)2.5 (88.4)
Proline0.4 (14.5)1.2 (43.4)2.4 (86.9)
Isoleucine0.4 (14.1)1.3 (42.4)2.7 (84.8)
Threonine0.4 (13.2)1.1 (39.5)2.3 (79.1)
Serine0.3 (9.9)0.8 (29.6)1.5 (59.2)
Phenylalanine0.3 (7.8)0.9 (23.4)1.9 (46.7)
Tyrosine0.3 (7.3)0.9 (21.9)1.9 (43.7)
Arginine0.3 (5.9)0.8 (17.8)1.5 (35.7)
Glycine0.2 (10.5)0.6 (31.4)1.1 (62.8)
Cysteine0.2 (6.5)0.6 (19.5)1.1 (38.9)
Methionine0.2 (4.9)0.5 (14.5)1.0 (29.1)
Histidine0.2 (4.7)0.5 (14.0)1.0 (28.0)
Tryptophan0.2 (3.9)0.6 (11.6)1.1 (23.1)
GlutamineNot reported
AsparagineNot reported
Total8.0 (254)24.0 (763)48.0 (1526)
a The amino acid (AA) composition of “Hydrolysed Whey Protein 821” was provided by Fonterra Co-Operative Group Ltd, Auckland, New Zealand, and glutamine and asparagine were not reported in protein product specification; b The infusions (total volume 240 mL) consisted of 2.1 kJ/min (P2.1), 6.5 kJ/min (P6.3), or 12.5 kJ/min (P12.5) of whey protein, each infused at 4 mL/min for 60 min; c The AAs are presented in order of most to least abundant g present within the protein infusions and glutamic acid and aspartic acid include the contribution from asparagines and glutamine in this product specification.
Subjects were studied on four occasions, each separated by 3–10 days, in a randomized, double-blind, cross-over design. Randomisation was performed by an investigator not involved in the assessments using the free software “Research Randomiser”, and the investigator performing the assessments was blinded to the randomisation and preload conditions. Subjects were provided with a standardised evening meal to consume the night prior to each study day, and were instructed to abstain from all food and drinks and to refrain from strenuous physical activity, until attending the laboratory at the Discipline of Medicine at 8:30 a.m. Upon arrival, a small-diameter (OD: 3.5 mm) manometric catheter (total length: 100 cm, Dentsleeve International, Mui Scientific, Mississauga, ON, Canada) was inserted into the stomach through an anesthetised nostril and allowed to pass into the duodenum by peristalsis. The catheter contained 16 side-holes spaced at 1.5 cm intervals, with an additional channel used for ID infusions located 11.75 cm distal to the end of the sleeve sensor (14.5 cm from the pylorus), and was positioned as described previously [7]. Once the catheter was positioned correctly (which took between 15 and 45 min), fasting motility was monitored until the occurrence of a phase III of the interdigestive migrating motor complex. Immediately after cessation of phase III activity, an intravenous cannula was placed in a right forearm vein for blood sampling. At t = −15 min (during motor quiescence, i.e., phase I of the migrating motor complex), a baseline blood sample (14 mL) was taken and a visual analogue scale questionnaire (VAS) to assess appetite perceptions and GI symptoms completed by the subject. Baseline measurement of APD motility also commenced. At t = 0 min, the 60-min ID infusion of one of the treatments commenced. During the infusion, APD motility was monitored continuously, and VAS ratings and blood samples were obtained at 15-min intervals. At t = 60 min, the infusion was terminated and the ID catheter removed. Subjects were then presented with a standardised cold, buffet-style meal, in excess of what they would be expected to consume, and instructed to eat freely for up to 30 min (t = 60–90 min) until comfortably full [20]. The composition of the buffet meal has been described [20].

2.4. Measurements

Plasma free AA and GLP-1 and serum insulin concentrations: 10-mL venous blood samples were collected in ice-chilled EDTA-treated tubes for plasma AA and GLP-1 analysis, and 4-mL samples in serum-Z tubes containing clotting beads (Sarstedt Australia Pty Ltd, Adelaide, Australia) for insulin. Plasma/serum was separated by centrifugation at 3200 rpm for 15 min at 4 °C, and stored at −70 °C for later analysis. Plasma free AAs concentrations (mmol/L) of asparagine, aspartic acid, alanine, arginine, cysteine, glutamine, glutamic acid, glycine, histidine, isoleucine, leucine, lysine, methionine, phenylalanine, proline, serine, threonine, tryptophan, tyrosine and valine, were analysed using precolumn derivatization with 6-aminoquinolyl-N hydroxysuccmimidyl carbamate (AQC). The derivatives were then separated and quantified by reversed-phase high-performance liquid chromatography (HPLC). The AAs (with the exception of tryptophan) were detected by fluorescence, whereas tryptophan required UV detection. Before derivatisation, 100 µL of plasma samples were diluted 1:1 with internal standard solution (Norvaline) and deproteinised by ultra-filtration through a membrane with 10 kDa nominal molecular weight cut-off (Ultrafree MC with PL-10 membrane, Millipore, MA, USA). AAs contained in the filtrate (100 µL) were labelled using the Waters AccQTag™ chemistry and analysed using a Waters Acquity™ UPLC system (Waters Corporation, MA, USA) [21]. Only single analysis of each AA was conducted. The analysis was performed at the Australian Proteome Analysis’s Facility established under the Australian Government’s National Collaborative Research Infrastructure Strategy (NCRIS). All analyses were performed by the same technician. Plasma GLP-1 (pmol/L) and serum insulin (mU/L) were measured, as described [7].
Energy intake: The amount eaten (g) was quantified by weighing the buffet meal before and after consumption, and energy (kJ) was then calculated using commercially available software (Foodworks, Xyris Software, version 3.01, Highgate Hill, Australia).

2.5. Data and Statistical Analyses

Statistical analyses were performed using SPSS software (version 19.0; SPSS Inc, IBM, New York, NY, USA). Baseline plasma AA concentrations were analysed using one-way ANOVA with protein load as the within-subject factor. The effect of protein load on the net incremental area under the curve (AUC0–60 min) for each AA (calculated using the trapezoidal rule) was analysed by one-way ANOVA with protein load as the fixed factor. Post-hoc comparisons, adjusted for multiple comparisons using Bonferroni’s correction, were performed when ANOVAs revealed significant effects. The effects of increasing loads of protein on insulin and GLP-1 concentrations and on energy intake at a subsequent meal have been reported [7], and additional analyses of the AUC for insulin and GLP-1 were done to determine relationships between these outcomes with the AUC for each of the 20 AAs. Relationships between the AUC for each AA and either protein load, total AA concentration within the infusion, energy intake or AUC for insulin and GLP-1, respectively, were evaluated using linear within-subject correlations (r) with AUC for each AA profile as the dependent, subject as a fixed factor and the other variable as a covariate. Relationships between each AA with energy intake and AUCs for insulin and GLP-1, respectively, were ranked in order of strongest to weakest, using R square values. Statistical significance was accepted at p < 0.05; all data are presented as mean ± SEM.

3. Results

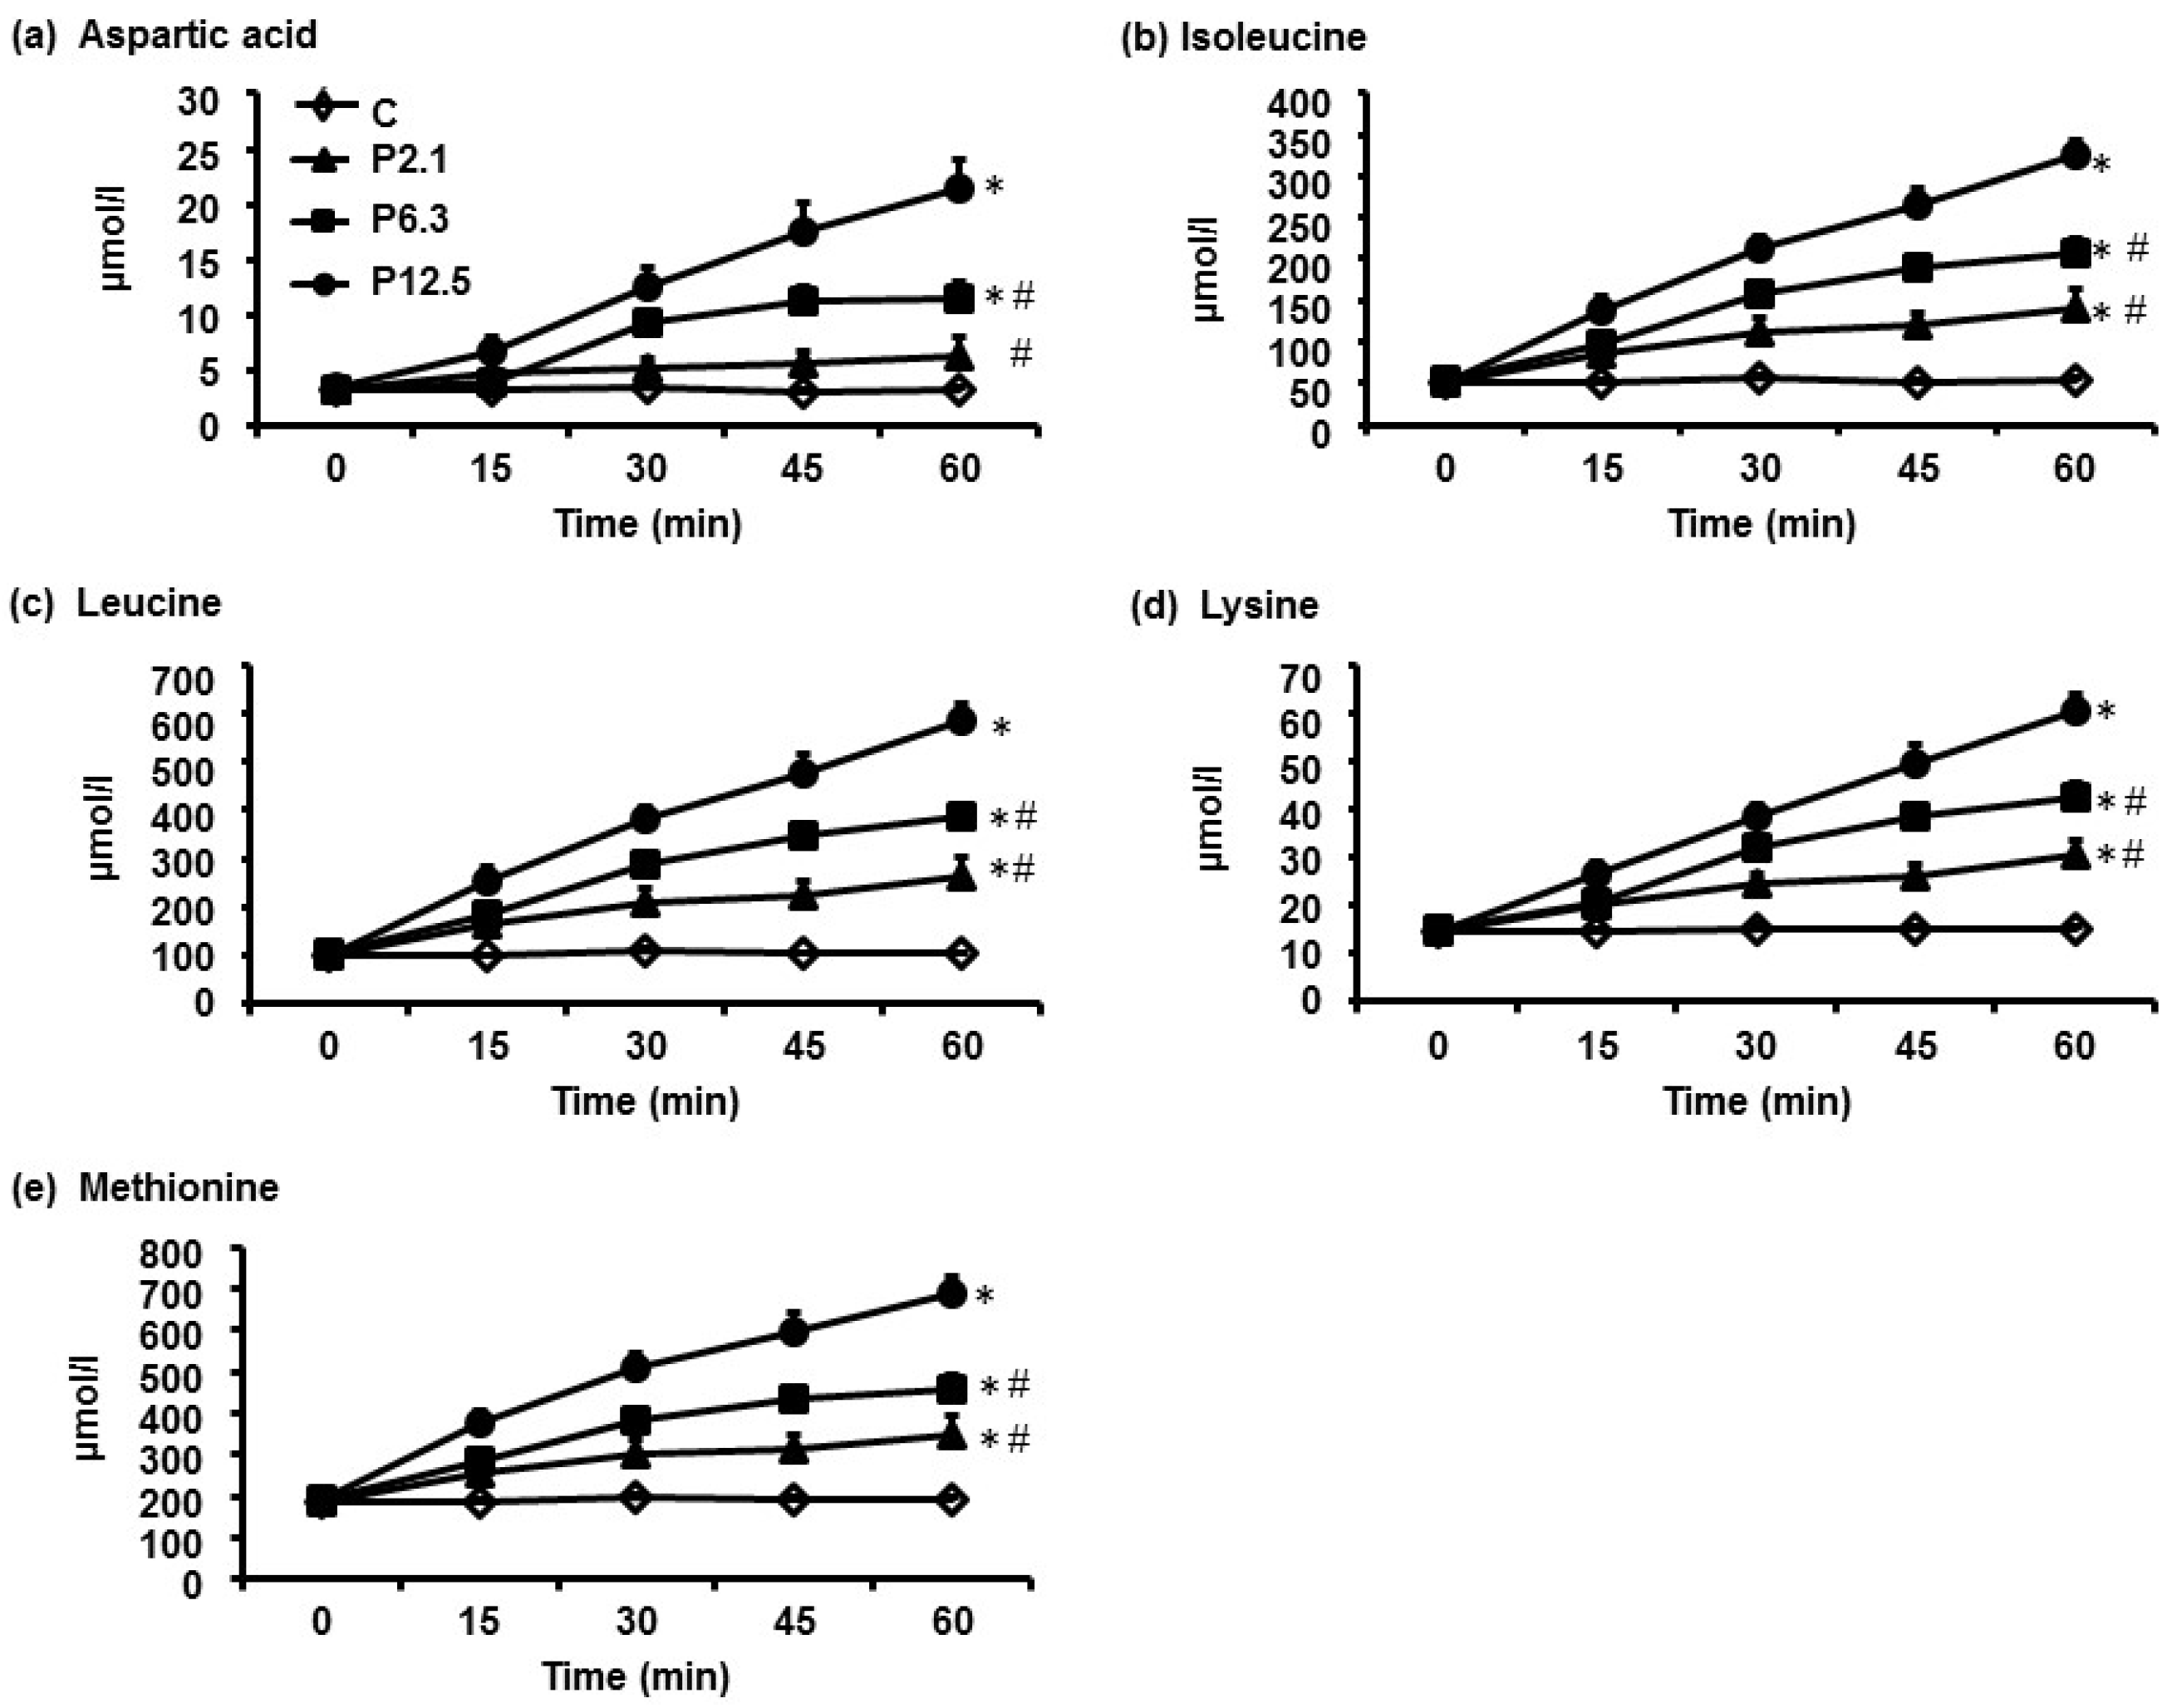
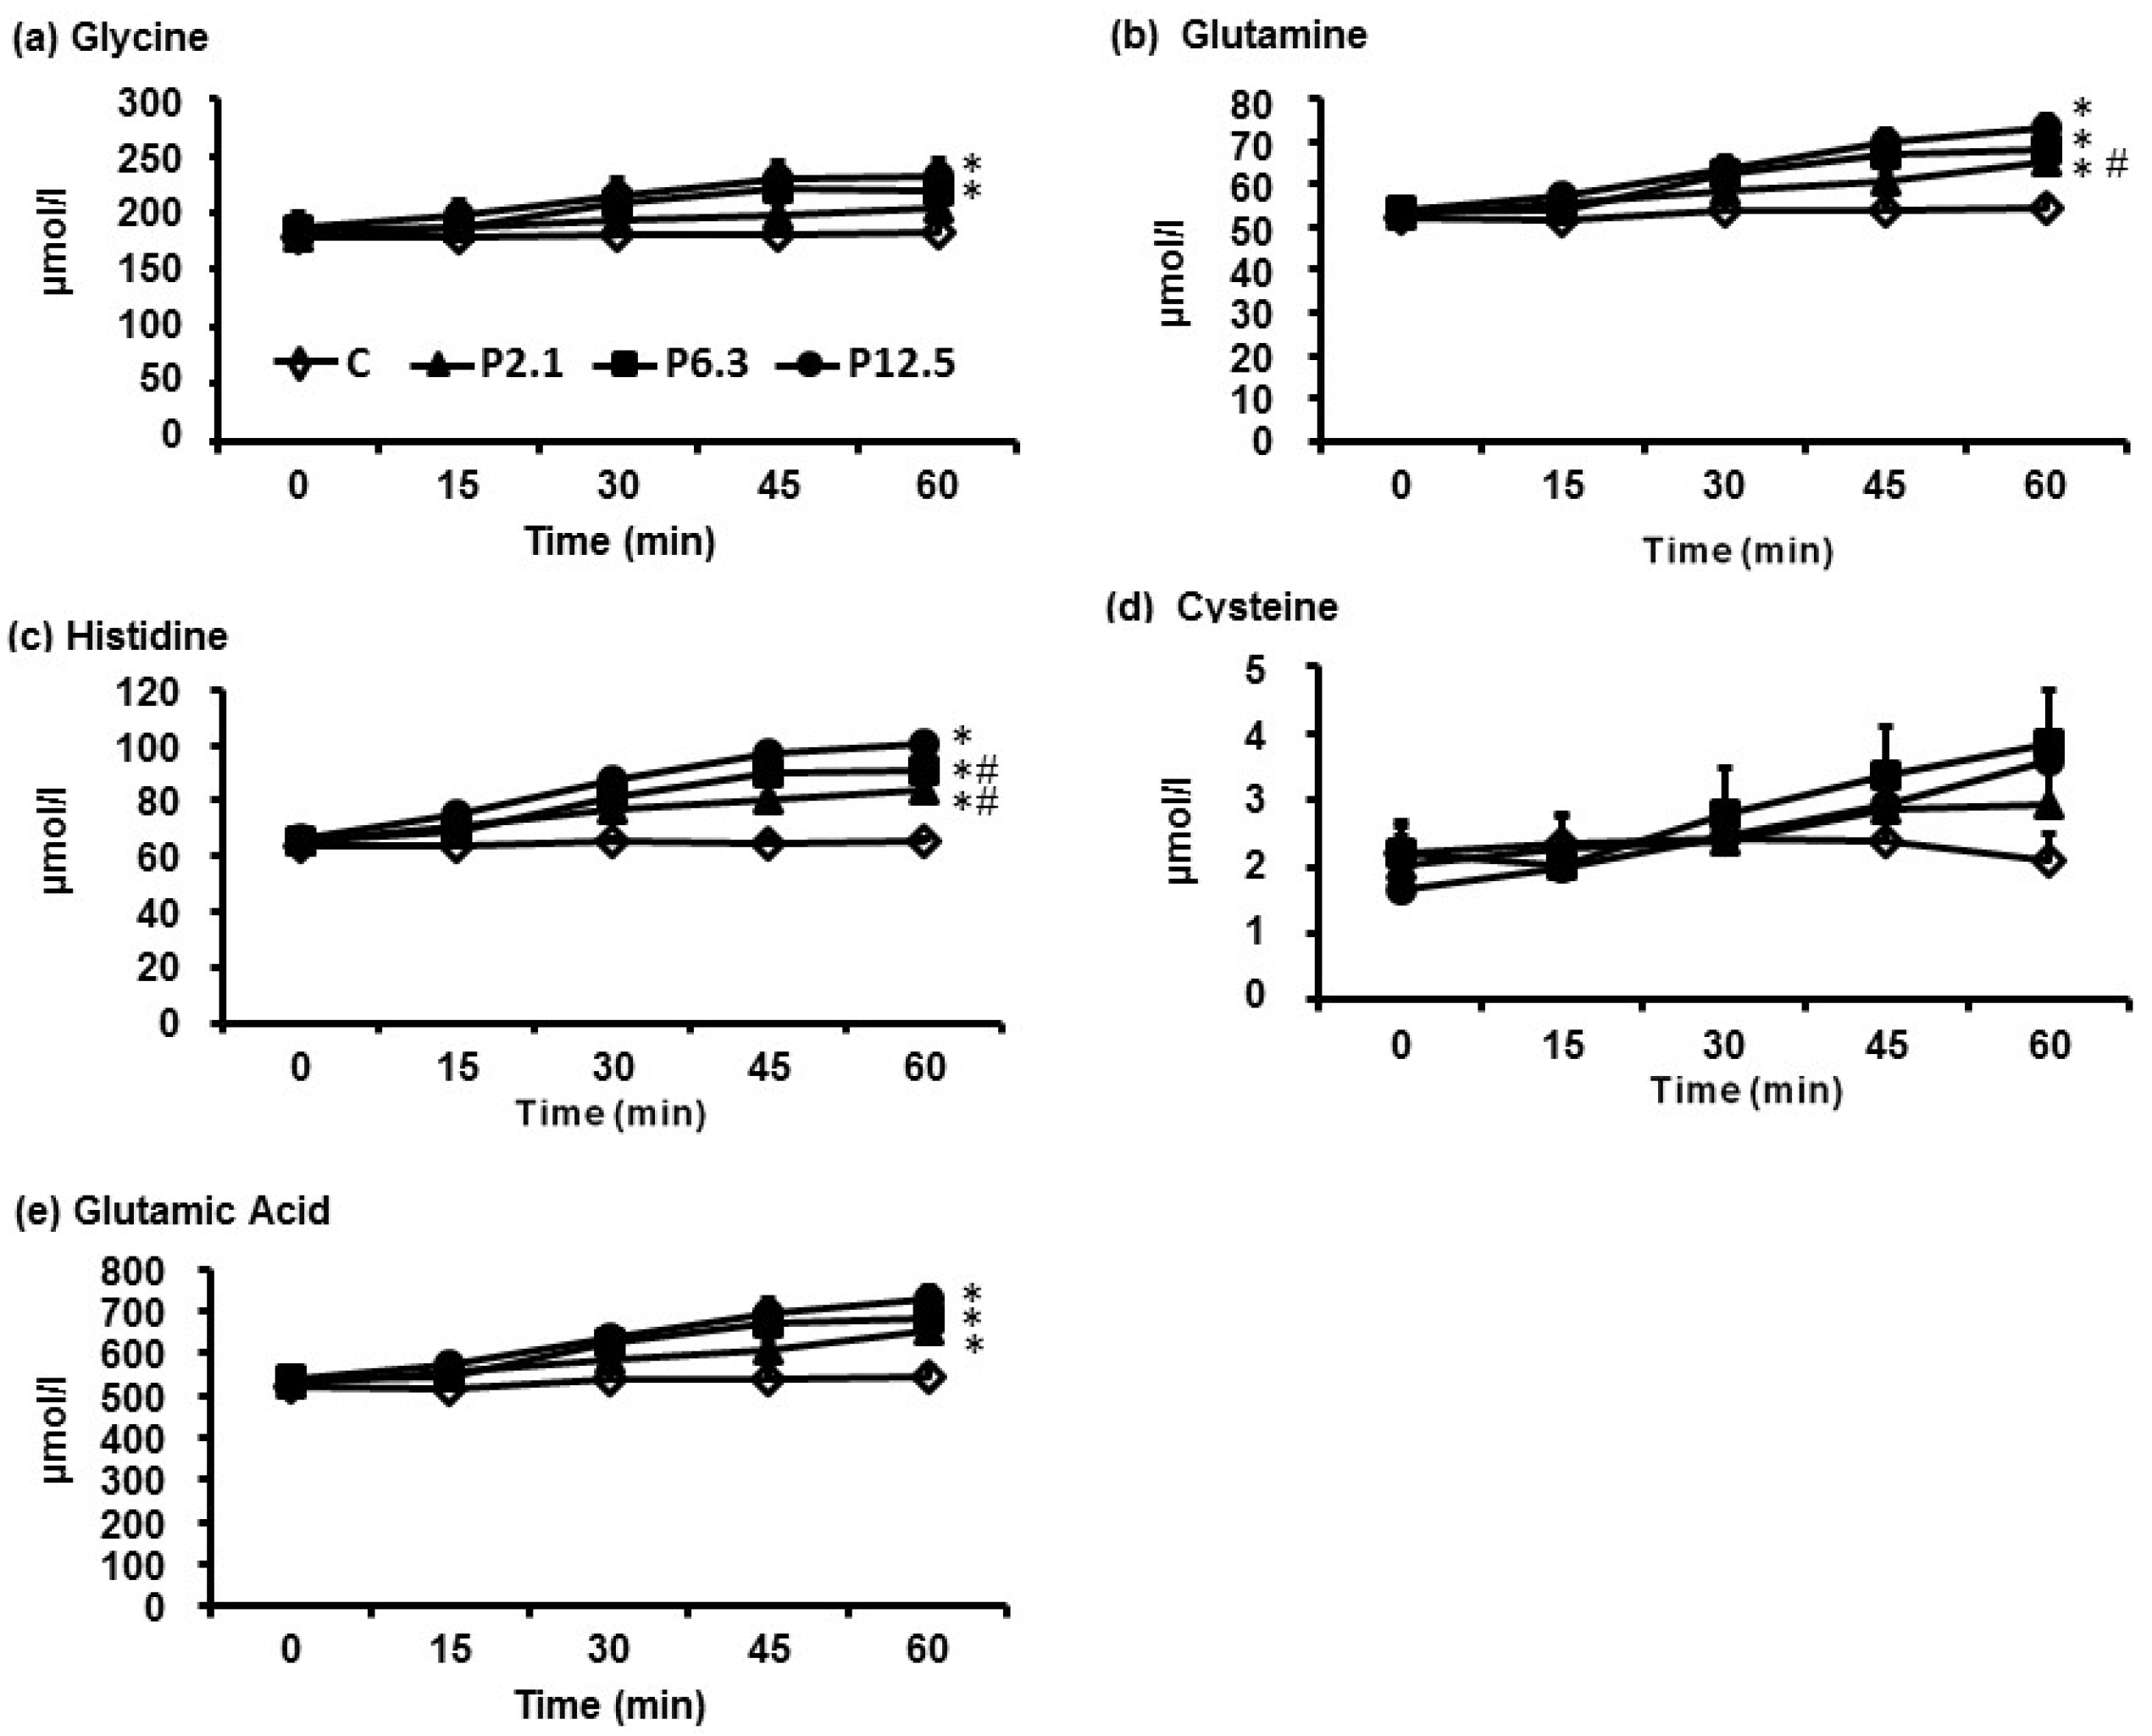
3.1. Plasma AA Concentrations

Baseline concentrations of individual and total AAs did not differ between test days (Table 2).
Table 2. Plasma amino acid (AA) concentrations at baseline prior to commencing each infusion a,b,c.
AACTreatmentp Value c
P2.1P6.3P12.5
µmol/L
Glutamine520530540540>0.05
Alanine240240240270>0.05
Valine190190200190>0.05
Glycine180180190190>0.05
Proline150150150160>0.05
Lysine150150150150>0.05
Threonine200100100100>0.05
Leucine100100100100>0.05
Serine90909090>0.05
Glutamic acid80909090>0.05
Arginine80808080>0.05
Histidine60707070>0.05
Isoleucine50505050>0.05
Tyrosine50505050>0.05
Asparagine40505050>0.05
Phenylalanine40404040>0.05
Methionine020202020>0.05
Aspartic acid3333>0.05
Tryptophan3333>0.05
Cysteine2222>0.05
Total2130220022002230>0.05
a Data are means, and the amino acids (AAs) have been presented in order of most to least concentrated, n = 16; b The infusions consisted of either saline (C), or of 2.1 kJ/min (P2.1), 6.5 kJ/min (P6.3), or 12.5 kJ/min (P12.5) of hydrolysed whey protein, each infused at 4 mL/min for 60 min; c Main effect of protein load was determined by one-way ANOVA and post-hoc comparisons between two loads of protein were done using Bonferroni’s correction; statistical significance was accepted at p < 0.05.
In response to increasing loads of ID whey protein, the greatest increases in plasma concentrations over the 60-min infusion were observed for aspartic acid, isoleucine, leucine, lysine and methionine (Figure 1), whereas the smallest increases were observed for glycine, glutamine, histidine, glutamic acid and cysteine (Figure 2). The AUC0–60min of each of the 20 AA profiles in response to increasing protein loads are depicted in Table 3. There was a significant main effect of protein load on plasma concentrations of 19/20 AAs (p < 0.001), with the exception of cysteine. Post hoc-analyses revealed that the AUC0–60min of plasma concentrations of 16/20 AAs (p < 0.05 for all), except tryptophan, alanine, glycine and cysteine, were greater during P2.1 compared with C. While the AUC0–60min of the plasma concentrations of each of the 20 AAs did not differ between P2.1 and P6.3, the AUC0–60min of all AA profiles, apart from glutamic acid, glycine and cysteine, were greater during P12.5 than during P2.1 (p < 0.05 for all). In addition, the AUC0–60min of 11/20 AAs, the exceptions being aspartic acid, threonine, asparagine, alanine, serine, glutamic acid, glutamine, glycine and cysteine, were greater during P12.5 than during P6.3 (p < 0.05 for all).
Table 3. Plasma amino acid (AA) responses (AUC0–60 min) ordered from the strongest to weakest response following the infusions, relative to control a,b,c.
AACTreatmentp Value c
P2.1P6.3P12.5
µmol.60 min/L
Aspartic acid200300 d,e500 d7000 d<0.001
Isoleucine32006200 d,e8600 d,e12,100 d<0.001
Leucine610011,700 d,e15,900 d,e21,900 d<0.001
Lysine900014,000 d,e18,000 d,e22,800 d<0.001
Methionine11001700 d,e2100 d,e2900 d<0.001
Tryptophan2000300 e300 d,e4000 d<0.001
Tyrosine28003800 d,e4500 d,e5800 d<0.001
Valine11,30014,600 d,e17,500 d,e20,800 d<0.001
Phenylalanine25003200 d,e3600 d,e4500 d<0.001
Threonine58007600 d,e9100 d10,500 d<0.001
Asparagine27003500 d,e4200 d4800 d<0.001
Proline880010,700 d,e12,100 d,e14,800 d<0.001
Alanine14,50017,000 e19,200 d23,100 d<0.001
Arginine46006100 d,e700 d,e8400 d<0.001
Serine52006500 d,e7400 d8000 d<0.001
Glutamic acid49006100 d6200 d7100 d<0.001
Histidine39004500 d,e4800 d,e5100 d<0.001
Glutamine31,90035,100 d,e36,700 d38,100 d<0.001
Glycine10,80011,60012,300 d12,800 d<0.001
Cysteine100100200100>0.05
Total129,000165,000 d,e190,000 d,e225,000 d<0.001
a Data are means, and the amino acids (AAs) have been presented in order of most to least concentrated, n = 16; b The infusions consisted of either saline (C), or of 2.1 kJ/min (P2.1), 6.5 kJ/min (P6.3), or 12.5 kJ/min (P12.5) of hydrolysed whey protein, each infused at 4 mL/min for 60 min; c Main effect of protein load was determined by one-way ANOVA, and post-hoc comparisons between two loads were done using Bonferroni’s correction; statistical significance was accepted at p < 0.05; d Significantly different from C (p < 0.05); e Significantly different from P12.5 (p < 0.05).
Figure 1. The temporal profiles of (a) aspartic acid; (b) isoleucine; (c) leucine; (d) lysine; and (e) methionine, the five amino acids whose plasma concentrations increased the most in response to increasing loads of ID protein. Data are means ± SEM, n = 16. The infusions consisted of either saline (C), or of 2.1 kJ/min (P2.1), 6.5 kJ/min (P6.3), or 12.5 kJ/min (P12.5) of hydrolysed whey protein, each infused at 4 mL/min for 60 min. Main effect of protein load was determined by one-way ANOVA and post-hoc comparisons between two loads were done using Bonferroni’s correction; statistical significance was accepted at p < 0.05. * Significantly different from C. # Significantly different from P12.5 (p < 0.05).
Nutrients 08 00004 g001
Figure 2. The temporal profiles of (a) glycine; (b) glutamine; (c) histidine; (d) cysteine; and (e) glutamic acid, the five amino acids whose plasma concentrations increased the least in response to increasing loads of ID protein. Data are means ± SEM, n = 16; The infusions consisted of either saline (C), or of 2.1 kJ/min (P2.1), 6.5 kJ/min (P6.3), or 12.5 kJ/min (P12.5) of hydrolysed whey protein, each infused at 4 mL/min for 60 min; Main effect of protein load was determined by one-way ANOVA and post-hoc comparisons between two loads were done using Bonferroni’s correction; statistical significance was accepted at p < 0.05. * Significantly different from C. # Significantly different from P12.5 (p < 0.05).
Nutrients 08 00004 g002
Strong positive relationships between protein load and the resultant AUC0–60min of the plasma concentrations of all essential AAs were evident (i.e., range of R2 values was 0.58–0.69; p < 0.001 for all), whereas the strength of the relationships was more variable for non-essential (i.e., 0.28–0.55; p < 0.05 for all) and conditional (i.e., 0.01–0.66; p < 0.05 for all) AAs. In addition, plasma concentrations of essential AAs reflected closely their concentrations in the infused whey protein (i.e., range of R2 values was 0.61–0.67; p < 0.001 for all), whereas the relationships were more variable for non-essential (i.e., 0.02–0.54; p < 0.001 for all) and conditional (i.e., 0.006–0.64; p < 0.01 for all; the exception being cysteine which was not related) AAs.

3.2. Serum Insulin and Plasma GLP-1 Concentrations, and Energy Intake and Amount of Food Consumed at the Buffet Meal

For the purpose of the current analysis, the temporal profiles of insulin and GLP-1 that were reported previously [7] have been expressed as AUCs. Table 4 depicts the AUCs0–60min of the serum insulin, and plasma GLP-1, concentrations, and energy intake and the amount of food consumed at the buffet meal, in response to increasing loads of protein.
Table 4. Serum insulin and plasma GLP-1 responses (AUCs0–60 min), and energy intake and amount of food consumed at the buffet meal, in response to increasing loads of ID protein a,b,c.
Hormone and Food Intake ResponseCP2.1P6.3P12.5p Value c
Insulin (mU.60min/L)150 ± 19354 ± 94 d721 ± 99 d1087 ± 145 d,e<0.05
GLP-1 ( mmol.60min/L)1489±1131698 ± 1422053 ± 159 d,f2147 ± 171 d,f<0.05
Energy intake (buffet; kJ)5173 ± 4644981 ± 4734504 ± 523 g3814 ± 502 d,e,f<0.05
Amount of food eaten (g)1261 ± 1021196 ± 1041109 ± 1181009 ± 1070.08
a Data are means, and the amino acids (AAs) have been presented in order of most to least concentrated, n = 16; b The infusions consisted of either saline (C), or of 2.1 kJ/min (P2.1), 6.3 kJ/min (P6.3), or 12.5 kJ/min (P12.5) of hydrolysed whey protein, each infused at 4 mL/min for 60 min; c Main effect of protein load was determined by one-way ANOVA and post-hoc comparisons between two loads were done using Bonferroni’s correction; statistical significance was accepted at p < 0.05; d Significantly different from C (p < 0.05); e Significantly different from P6.5 (p < 0.05); f Significantly different from P2.1 (p < 0.05); g Trend for significant difference from P2.1 (p < 0.05).

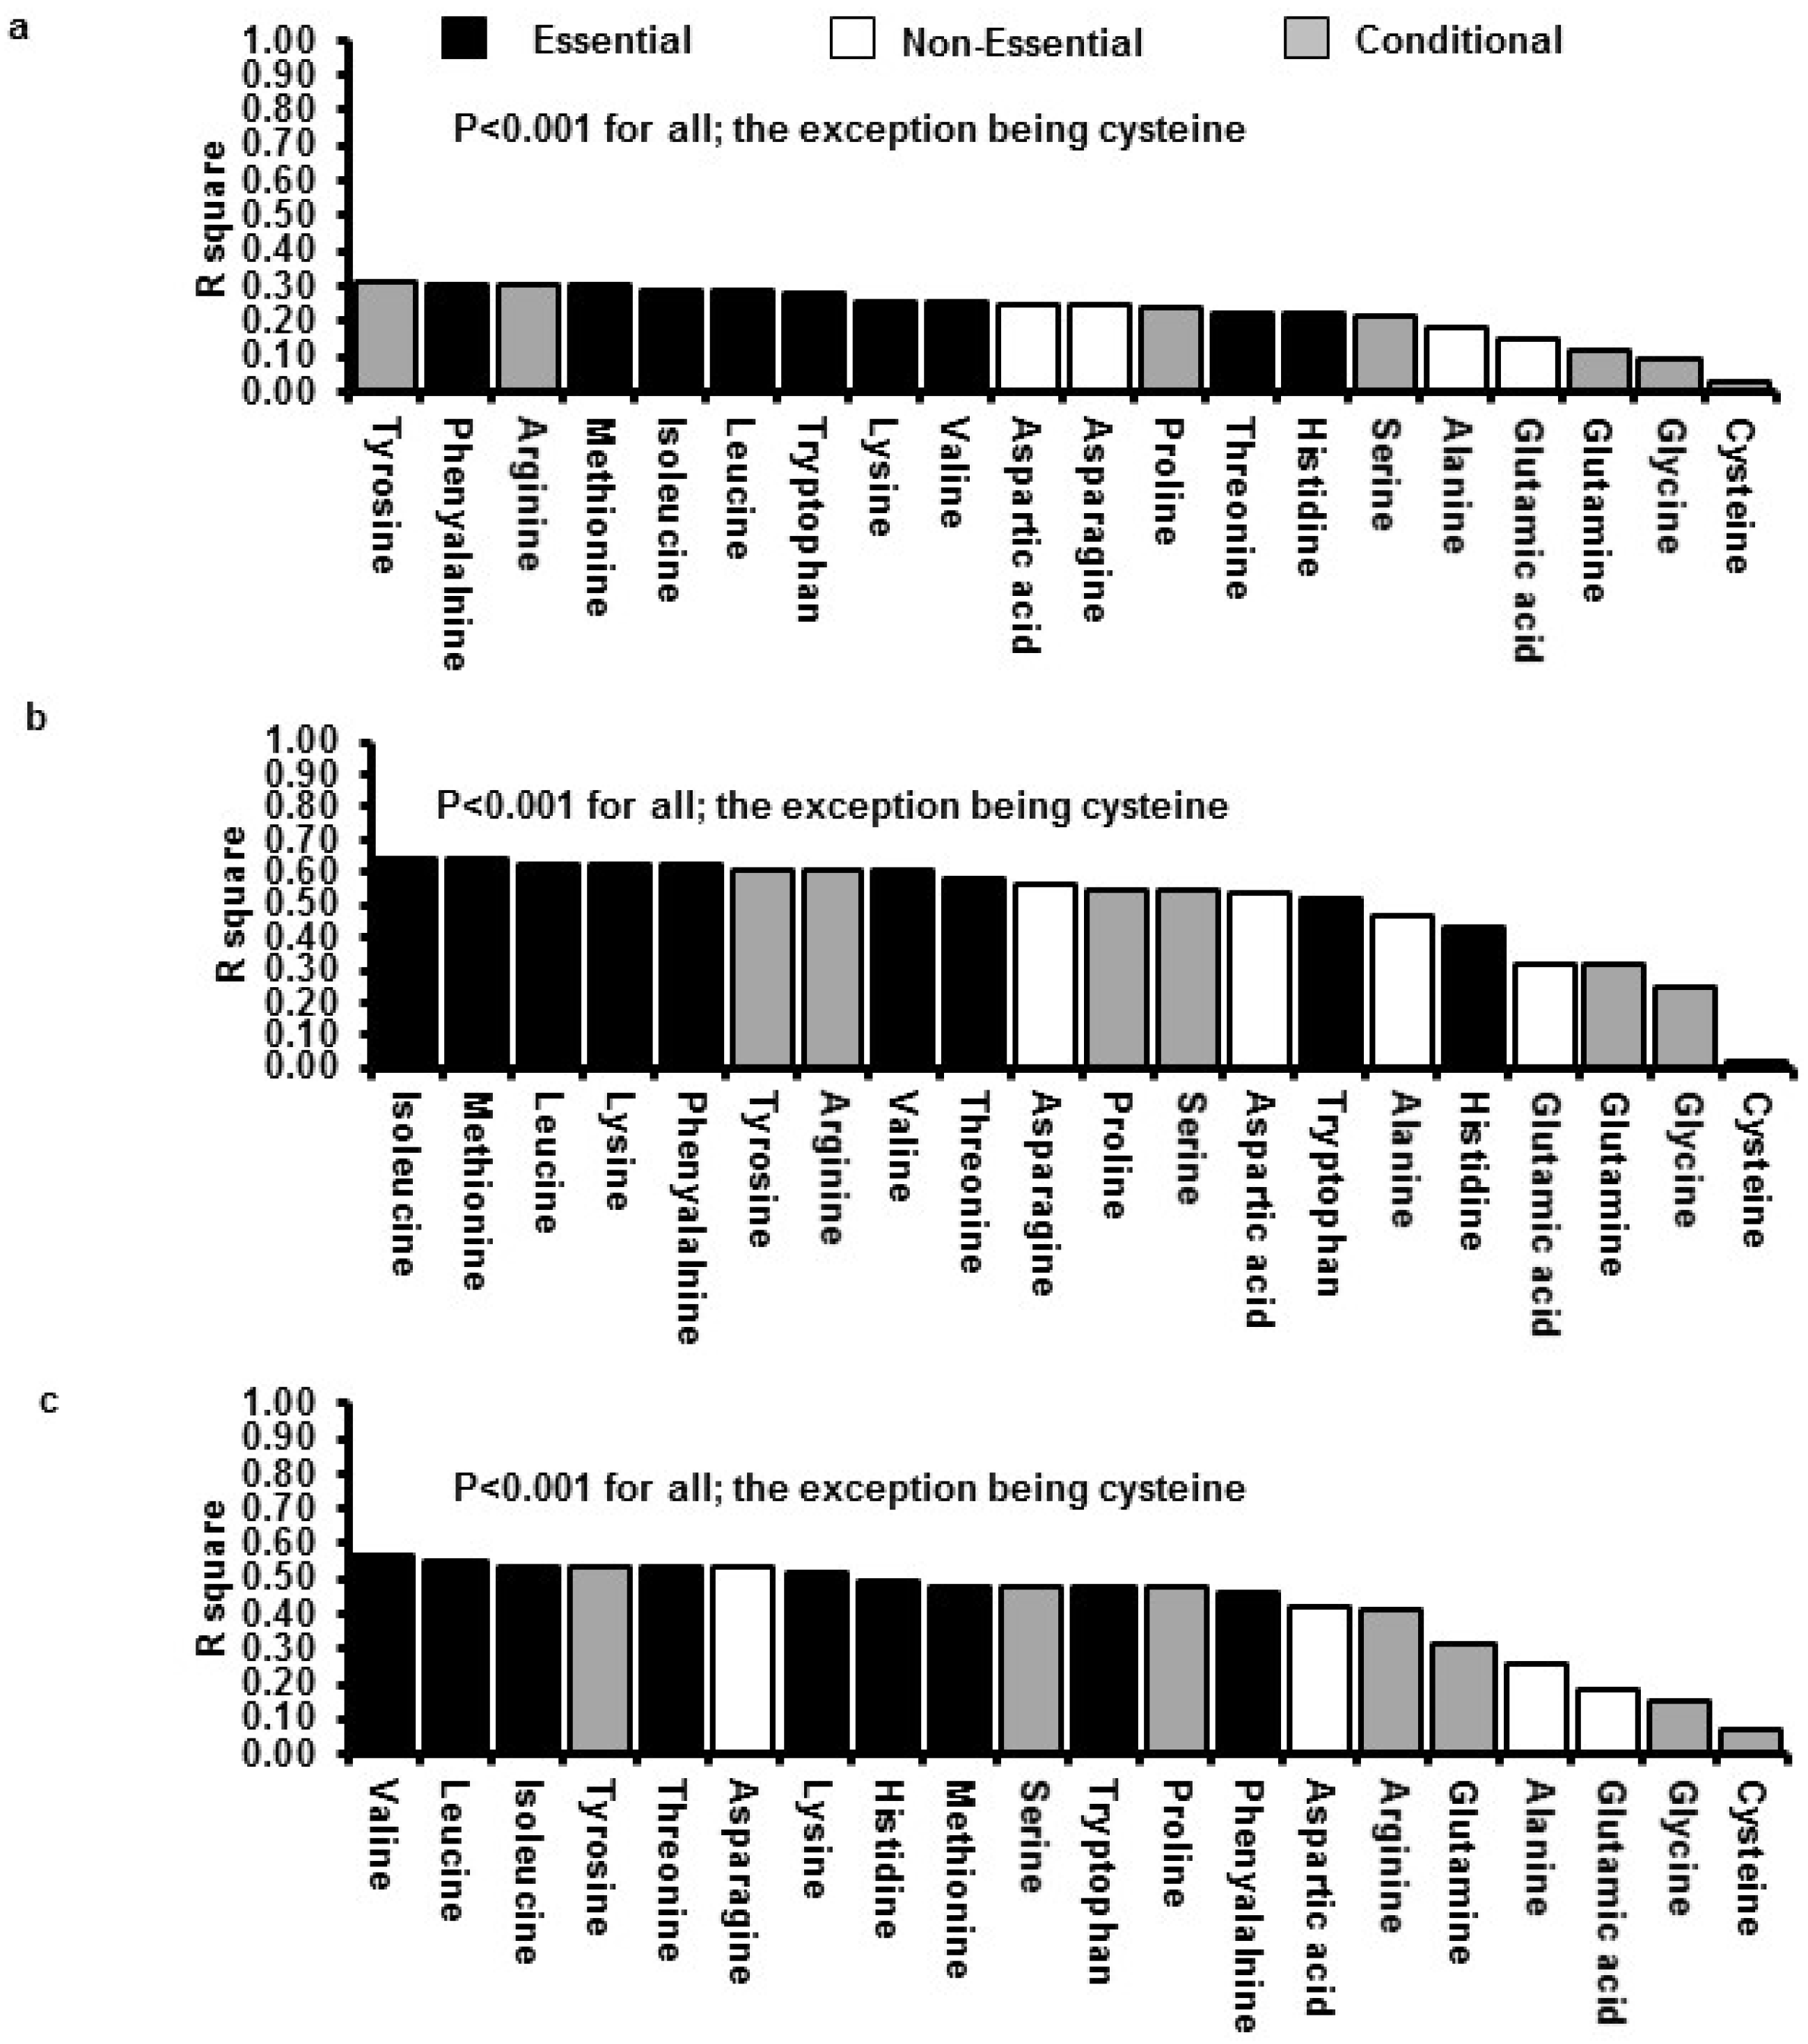
3.3. Relations between Insulin GLP-1 and Energy Intake with Plasma AA Concentrations

AUCs0–60min of plasma concentrations for 19/20 AAs (the exception being cysteine) were related inversely to energy intake (R2 ranged between 0.09 and 0.3, p < 0.05), and directly to AUCs0–60min of the serum/plasma concentrations of insulin (R2 ranged between 0.3 and 0.6, p < 0.01) and GLP-1 (R2 ranged between 0.2 and 0.6, p < 0.05), respectively. Figure 3 illustrates the strength of the relationships between the AUCs of each of the 20 AA profiles with energy intake as well as the AUCs of the insulin and GLP-1 profiles. The essential AAs, leucine, valine, isoleucine, lysine, methionine, and the conditionally-essential AA, tyrosine, yielded the strongest correlations with all three outcomes.
Figure 3. Relationships (ranked in order of strongest to weakest using R2 values) between the AUC for each of the 20 amino acids with the AUC for (a) energy intake; (b) insulin; and (c) glucagon-like peptide-1 (GLP-1) following the 12.5 kJ/min (P12.5) infusion of whey protein, administered at 4 mL/min for 60 min. Data are correlation coefficients for n = 16 subjects. Statistical significance was accepted at p < 0.05.
Nutrients 08 00004 g003

4. Discussion

This study has established that (i) increasing loads of ID whey protein hydrolysate led to load-dependent increases in the plasma concentrations of 19/20 free AAs over a 60-min period; (ii) plasma concentrations of the essential AAs reflected closely their concentrations in the infused whey protein, whereas the relationships were more variable for the non-essential and conditional AAs; and (iii) changes in plasma concentrations of the essential AAs, leucine, valine, isoleucine, methionine and lysine, and the conditionally-essential AA, tyrosine, were most closely associated with changes in energy intake, serum insulin and plasma GLP-1.
The first aim of this study was to determine the plasma concentrations of the 20 free AAs reaching the peripheral circulation in response to increasing loads of ID 18.1% hydrolysed whey protein. The findings in this study indicate that whey protein delivered to the duodenum at rates lower than (2.1 kJ/min), comparable to (6.3 kJ/min), and towards the upper end (12.5 kJ/min) of the normal range for gastric emptying, increased, in a load-dependent manner, the plasma concentrations of 19/20 AAs. While plasma concentrations of the majority of AAs were increased by a whey protein load as low as 2.1 kJ/min, a load of ≥6.3 kJ/min was required to increase alanine, glycine and tryptophan above control concentrations. Notably, cysteine was the only AA that was not increased by any load, confirming previous reports from studies using pig models indicating that cysteine is readily catabolised in the GI tract [22].
A limited number of studies have reported that concentrations of specific AAs reaching the peripheral circulation closely resemble their concentrations in the ingested protein source [23,24]. In contrast, other studies have found no relationships with any AA [25,26,27], or strong relationships only for the branched-chained AAs [13,14,28,29]. These discrepant observations may be accounted for by the use of high-protein drinks that included additional macronutrients, differing protein sources (i.e., dairy vs. plant protein, and also un-hydrolysed vs. hydrolysed proteins), oral administration (affecting gastric emptying), differences in the load of protein administered between individuals (e.g., prescription based on a g per kg total body weight or, per kg of fat free mass), and lack of standardisation of the meal immediately preceding the study. While our findings establish strong within-subject relationships between plasma concentrations of all essential AAs with their concentration in the infused protein load, there were also strong relationships with the conditional AAs, arginine, tyrosine and proline, while relationships for the non-essential AAs, aspartic acid, alanine and glutamic acid, or the conditional AAs, serine, glutamine, and glycine, were weak to moderate. Taken together, our observations highlight existing, although poorly appreciated, knowledge that plasma AA concentrations are modulated simultaneously by many factors including (i) the rates at which “free” AAs and di- and tri-peptides are taken up by the intestinal mucosa; (ii) the digestion and absorption of endogenous small intestinal protein; (iii) metabolic transformation during absorption (which is particularly extensive for the dicarboxylic AAs, glutamic and aspartic acids); and (iv) rates of uptake and release of AAs by the liver and other tissues [30].
A further aim of this study was to determine the relationships between plasma concentrations of the 20 free AAs with the changes in serum insulin and plasma glucagon-like peptide-1 concentrations as well as energy intake in response to ID whey protein hydrolysate, reported previously [7]. Several studies have found modest associations between increased postprandial plasma concentrations for the essential AAs with either an increased release of some gut hormone (particularly GLP-1 and GIP) and/or insulin, and/or with a reduced energy intake [12,13,14]. A major strength of the current study was that the relationships of all 20 AAs with all three outcomes were assessed concurrently. This analysis was performed based on emerging evidence, in both rodents and humans, that leucine, glutamate, tryptophan, tyrosine and histidine (glutamate is a neurotransmitter and the latter three are all precursors of neurotransmitters), as well as lysine, threonine, phenylalanine, arginine and glutamine, can directly stimulate GLP-1 and insulin, and/or indirectly activate vagal pathways connecting the gut with the brain [31,32,33]. We have demonstrated that postprandial concentrations of all AAs, apart from cysteine, were correlated moderately with protein-induced suppression of energy intake, and strongly with postprandial concentrations of insulin and GLP-1. In addition, after ranking each AA based on the strength of their relationship with energy intake and AUCs of insulin and GLP-1 profiles, respectively, we observed that the essential AAs, leucine, valine, isoleucine, methionine and lysine, and the conditionally-essential AA, tyrosine, were the AAs that were most strongly correlated to all of these outcomes. While we recognise that relationships do not imply causality, our findings strongly indicate the need for further investigation of the role of these select AAs in the regulation of glucose homeostasis and energy intake using a study design that can directly determine the effects of isolated AAs.
Several aspects of our study design should be recognised when interpreting our results. Only healthy, lean males were included, and hence, the findings should not be generalised to females and obese people because they tend to be less sensitive to dietary manipulation [34], and insulin and GLP-1 concentrations and energy intake are affected by the menstrual cycle [35]. Although the total loads of protein delivered (i.e., 8, 24 and 48 g, respectively) are representative of loads consumed in a snack or within a main meal, the observed findings may be different for other dairy or non-dairy protein sources, or if the protein was consumed orally or infused intragastrically. In addition, the effects of hydrolysed whey protein isolate are not necessarily generalizable to whole dairy and non-dairy protein foods which contain varying amounts of fat and carbohydrate and other dairy, or non-dairy, bioactives.

5. Conclusions

In conclusion, this study provides new insights into the concentrations of 20 amino acids reaching the peripheral circulation following defined loads of whey protein that were infused intraduodenally to reflect the lower, middle and upper rate of the normal gastric emptying range for nutrients in human subjects. In addition, the study has identified relationships between the concentrations of some of these amino acids (particularly leucine, valine, isoleucine, lysine, methionine and tyrosine) with specific GI and gluco-regulatory functions, as well as energy intake. Collectively, these findings make an important contribution to a comprehensive understanding of the glycaemic and satiety effects of dietary protein for the management of obesity.

Acknowledgments

We thank Fonterra Research and Development Centre, Palmerston North, New Zealand, for providing the whey protein, and Kylie Lange and Judith Wishart, National Health and Medical Research Council of Australia Centre of Clinical Research Excellence in Translating Nutritional Science to Good Health, University of Adelaide, for statistical support and for performing the biochemical assays for insulin and glucagon like peptide-1, respectively. ND Luscombe-Marsh was supported by an NHMRC (National Health and Medical Research Council of Australia) New Investigator Project Grant (grant 627118, 2010–2014), AT Hutchison (formerly Ryan) by a Postgraduate Scholarship provided by the Faculty of Health Sciences, The University of Adelaide, S Soenen by a Royal Adelaide Hospital Mary Overton Fellowship (2011–2013), RE Steinert by a Royal Adelaide Hospital Mary Overton Fellowship (2012–2014), PM Clifton by a NMHRC Principal Research Fellowship (grant 1020594 2012–2016), and C Feinle-Bisset by NHMRC Senior Research Fellowships (grant 627002, 2010–2015; grant 1103020, 2016–2020). The research was funded by an NHMRC project grant to ND Luscombe-Marsh (grant 627118, 2010–2014).

Author Contributions

ND Luscombe-Marsh, PM Clifton, M Horowitz, and C Feinle-Bisset designed research; ND Luscombe-Marsh and AT Hutchison conducted research; ND Luscombe-Marsh analysed data, performed statistical analysis and wrote the manuscript; AT Hutchison, S Soenen, RE Steinert, PM Clifton, M Horowitz and C Feinle-Bisset contributed to data interpretation and manuscript revision; and ND Luscombe-Marsh had primary responsibility for the final content of the manuscript. All authors read and approved the final manuscript.

Conflicts of Interest

The authors declare no conflict of interest.

Abbreviations

ID
intraduodenalGI: Gastrointestinal
GLP-1
glucagon-like peptide-1
CCK
cholecystokinin
GIP
glucose-dependent insulinotropic polypeptide
PYY
peptide YY
AA
area amino acids
AUC0–60 min
area under the curve from 0 to 60 min
P2.1
protein load 2.1 kJ/min
P6.3
protein load 6.3 kJ/min
P12.5
protein load 12.5 kJ/min
C
saline control
APD
antropyloroduodenal motility
VAS
visual analog scale questionnaire

References

  1. Luscombe-Marsh, N.D.; Noakes, M.; Wittert, G.A.; Keogh, J.B.; Foster, P.; Clifton, P.M. Carbohydrate-restricted diets high in either monounsaturated fat or protein are equally effective at promoting fat loss and improving blood lipids. Am. J. Clin. Nutr. 2005, 81, 762–772. [Google Scholar] [PubMed]
  2. Weigle, D.S.; Breen, P.A.; Matthys, C.C.; Callahan, H.S.; Meeuws, K.E.; Burden, V.R.; Purnell, J.Q. A high-protein diet induces sustained reductions in appetite, ad libitum caloric intake, and body weight despite compensatory changes in diurnal plasma leptin and ghrelin concentrations. Am. J. Clin. Nutr. 2005, 82, 41–48. [Google Scholar] [PubMed]
  3. Clifton, P.M.; Bastiaans, K.; Keogh, J.B. High protein diets decrease total and abdominal fat and improve CVD risk profile in overweight and obese men and women with elevated triacylglycerol. Nutr. Metab. Cardiovasc. Dis. 2009, 19, 548–554. [Google Scholar] [CrossRef] [PubMed]
  4. Parker, B.; Noakes, M.; Luscombe, N.; Clifton, P. Effect of a high-protein, high-monounsaturated fat weight loss diet on glycemic control and lipid levels in type 2 diabetes. Diabetes Care 2002, 25, 425–430. [Google Scholar] [CrossRef] [PubMed]
  5. Pilichiewicz, A.N.; Papadopoulos, P.; Brennan, I.M.; Little, T.J.; Meyer, J.H.; Wishart, J.M.; Horowitz, M.; Feinle-Bisset, C. Load-dependent effects of duodenal lipid on antropyloroduodenal motility, plasma CCK and PYY, and energy intake in healthy men. Am. J. Physiol. Regul. Integr. Comp. Physiol. 2007, 293, R2170–R2178. [Google Scholar] [CrossRef] [PubMed]
  6. Pilichiewicz, A.N.; Chaikomin, R.; Brennan, I.M.; Wishart, J.M.; Rayner, C.K.; Jones, K.L.; Smout, A.J.; Horowitz, M.; Feinle-Bisset, C. Load-dependent effects of duodenal glucose on glycemia, gastrointestinal hormones, antropyloroduodenal motility, and energy intake in healthy men. Am. J. Physiol. Endocrinol. Metab. 2007, 293, E743–E753. [Google Scholar] [CrossRef] [PubMed]
  7. Ryan, A.T.; Feinle-Bisset, C.; Kallas, A.; Wishart, J.M.; Clifton, P.M.; Horowitz, M.; Luscombe-Marsh, N.D. Intraduodenal protein modulates antropyloroduodenal motility, hormone release, glycemia, appetite, and energy intake in lean men. Am. J. Clin. Nutr. 2012, 96, 474–482. [Google Scholar] [CrossRef] [PubMed]
  8. Houghton, L.A.; Read, N.W.; Heddle, R.; Horowitz, M.; Collins, P.J.; Chatterton, B.; Dent, J. Relationship of the motor activity of the antrum, pylorus, and duodenum to gastric emptying of a solid-liquid mixed meal. Gastroenterology 1988, 94, 1285–1291. [Google Scholar] [PubMed]
  9. Horowitz, M.; Edelbroek, M.A.L.; Wishart, J.M.; Straathof, J.W. Relationship between oral glucose-tolerance and gastric-emptying in normal healthy-subjects. Diabetologia 1993, 36, 857–862. [Google Scholar] [CrossRef] [PubMed]
  10. Ma, J.; Stevens, J.E.; Cukier, K.; Maddox, A.F.; Wishart, J.M.; Jones, K.L.; Clifton, P.M.; Horowitz, M.; Rayner, C.K. Effects of a protein preload on gastric emptying, glycemia, and gut hormones after a carbohydrate meal in diet-controlled type 2 diabetes. Diabetes Care 2009, 32, 1600–1602. [Google Scholar] [CrossRef] [PubMed]
  11. Ryan, A.T.; Luscombe-Marsh, N.D.; Saies, A.A.; Little, T.J.; Standfield, S.; Horowitz, M.; Feinle-Bisset, C. Effects of intraduodenal lipid and protein on gut motility and hormone release, glycemia, appetite, and energy intake in lean men. Am. J. Clin. Nutr. 2013, 98, 300–311. [Google Scholar] [CrossRef] [PubMed]
  12. Floyd, J.C., Jr.; Fajans, S.S.; Conn, J.W.; Knopf, R.F.; Rull, J. Insulin secretion in response to protein ingestion. J. Clin. Investig. 1966, 45, 1479–1486. [Google Scholar] [CrossRef] [PubMed]
  13. Veldhorst, M.A.; Nieuwenhuizen, A.G.; Hochstenbach-Waelen, A.; Westerterp, K.R.; Engelen, M.P.; Brummer, R.J.; Deutz, N.E.; Westerterp-Plantenga, M.S. Effects of complete whey-protein breakfasts versus whey without GMP-breakfasts on energy intake and satiety. Appetite 2009, 52, 388–395. [Google Scholar] [CrossRef] [PubMed]
  14. Nilsson, M.; Holst, J.J.; Bjorck, I.M. Metabolic effects of amino acid mixtures and whey protein in healthy subjects: Studies using glucose-equivalent drinks. Am. J. Clin. Nutr. 2007, 85, 996–1004. [Google Scholar] [PubMed]
  15. Fromentin, G.; Darcel, N.; Chaumontet, C.; Marsset-Baglieri, A.; Nadkarni, N.; Tome, D. Peripheral and central mechanisms involved in the control of food intake by dietary amino acids and proteins. Nutr. Res. Rev. 2012, 25, 29–39. [Google Scholar] [CrossRef] [PubMed]
  16. Anderson, G.H.; Tecimer, S.N.; Shah, D.; Zafar, T.A. Protein source, quantity, and time of consumption determine the effect of proteins on short-term food intake in young men. J. Nutr. 2004, 134, 3011–3015. [Google Scholar] [PubMed]
  17. Pal, S.; Ellis, V. The acute effects of four protein meals on insulin, glucose, appetite and energy intake in lean men. Br. J. Nutr. 2010, 104, 1241–1248. [Google Scholar] [CrossRef] [PubMed]
  18. Silk, D.B.; Grimble, G.K.; Rees, R.G. Protein digestion and amino acid and peptide absorption. Proc. Nutr. Soc. 1985, 44, 63–72. [Google Scholar] [CrossRef] [PubMed]
  19. Stanton, C.; Fitz Gerald, R.J.; Donnelly, W.J.; O’Connor, P. Development of technologies for separation and functional improvement of individual milk protein fractions. Available online: http://www.teagasc.ie/research/reports/dairyproduction/4216/eopr-4216.asp (accessed on 30 November 2015).
  20. Nair, N.S.; Brennan, I.M.; Little, T.J.; Gentilcore, D.; Hausken, T.; Jones, K.L.; Wishart, J.M.; Horowitz, M.; Feinle-Bisset, C. Reproducibility of energy intake, gastric emptying, blood glucose, plasma insulin and cholecystokinin responses in healthy young males. Br. J. Nutr. 2009, 101, 1094–1102. [Google Scholar] [CrossRef] [PubMed]
  21. Cohen, S.A. Amino Acid Analysis Using Precolumn Derivatisation with 6-Aminoquino lyl-n-Hydroxysuccinimidyl Carbamate; Humana Press: Totowa, NJ, USA, 2001; pp. 39–47. [Google Scholar]
  22. Shoveller, A.K.; Stoll, B.; Ball, R.O.; Burrin, D.G. Nutritional and functional importance of intestinal sulfur amino acid metabolism. J. Nutr. 2005, 135, 1609–1612. [Google Scholar] [PubMed]
  23. Adibi, S.A.; Gray, S.J. Intestinal absorption of essential amino acids in man. Gastroenterology 1967, 52, 837–845. [Google Scholar] [PubMed]
  24. Hegarty, J.E.; Fairclough, P.D.; Moriarty, K.J.; Clark, M.L.; Kelly, M.J.; Dawson, A.M. Comparison of plasma and intraluminal amino acid profiles in man after meals containing a protein hydrolysate and equivalent amino acid mixture. Gut 1982, 23, 670–674. [Google Scholar] [CrossRef] [PubMed]
  25. Frame, E.G. The levels of individual free amino acids in the plasma of normal man at various intervals after a high-protein meal. J. Clin. Investig. 1958, 37, 1710–1723. [Google Scholar] [CrossRef] [PubMed]
  26. Yearick, E.S.; Nadeau, R.G. Serum amino acid response to isocaloric test meals. Am. J. Clin. Nutr. 1967, 20, 338–344. [Google Scholar] [PubMed]
  27. Longenecker, J.B.; Hause, N.L. Relationship between plasma amino acids and composition of the ingested protein. II. A shortened procedure to determine plasma amino acid (PAA) ratios. Am. J. Clin. Nutr. 1961, 9, 356–362. [Google Scholar] [PubMed]
  28. Calbet, J.A.; MacLean, D.A. Plasma glucagon and insulin responses depend on the rate of appearance of amino acids after ingestion of different protein solutions in humans. J. Nutr. 2002, 132, 2174–2182. [Google Scholar] [PubMed]
  29. Hall, W.L.; Millward, D.J.; Long, S.J.; Morgan, L.M. Casein and whey exert different effects on plasma amino acid profiles, gastrointestinal hormone secretion and appetite. Br. J. Nutr. 2003, 89, 239–248. [Google Scholar] [CrossRef] [PubMed]
  30. Matthews, D.M. Intestinal absorption of amino acids and peptides. Proc. Nutr. Soc. 1972, 31, 171–177. [Google Scholar] [CrossRef] [PubMed]
  31. Uneyama, H.; Niijima, A.; San Gabriel, A.; Torii, K. Luminal amino acid sensing in the rat gastric mucosa. Am. J. Physiol. Gastrointest. Liver Physiol. 2006, 291, G1163–G1170. [Google Scholar] [CrossRef] [PubMed]
  32. Morrison, C.D.; Reed, S.D.; Henagan, T.M. Homeostatic regulation of protein intake: In search of a mechanism. Am. J. Physiol. Regul. Integr. Comp. Physiol. 2012, 302, R917–R928. [Google Scholar] [CrossRef] [PubMed]
  33. Greenfield, J.R.; Farooqi, I.S.; Keogh, J.M.; Henning, E.; Habib, A.M.; Blackwood, A.; Reimann, F.; Holst, J.J.; Gribble, F.M. Oral glutamine increases circulating glucagon-like peptide 1, glucagon, and insulin concentrations in lean, obese, and type 2 diabetic subjects. Am. J. Clin. Nutr. 2009, 89, 106–113. [Google Scholar] [CrossRef] [PubMed]
  34. Rolls, B.J.; Kim-Harris, S.; Fischman, M.W.; Foltin, R.W.; Moran, T.H.; Stoner, S.A. Satiety after preloads with different amounts of fat and carbohydrate: Implications for obesity. Am. J. Clin. Nutr. 1994, 60, 476–487. [Google Scholar] [PubMed]
  35. Brennan, I.M.; Feltrin, K.L.; Nair, N.S.; Hausken, T.; Little, T.J.; Gentilcore, D.; Wishart, J.M.; Jones, K.L.; Horowitz, M.; Feinle-Bisset, C. Effects of the phases of the menstrual cycle on gastric emptying, glycemia, plasma GLP-1 and insulin, and energy intake in healthy lean women. Am. J. Physiol. Gastrointest. Liver Physiol. 2009, 297, G602–G610. [Google Scholar] [CrossRef] [PubMed]

