Using Short Dietary Questions to Develop Indicators of Dietary Behaviour for Use in Surveys Exploring Attitudinal and/or Behavioural Aspects of Dietary Choices

 , and
, and
Abstract
:1. Introduction
2. Experimental Section
2.1. Diet Questions
2.2. Sociodemographic Indicators
2.3. Developing the Dietary Guideline Indicator

| Australian Dietary Guidelines 2013 Using Data Collected in the NMSS 2012 | Indication and Description a,b | Criteria for Maximum Score (10) | Criteria for Minimum Score (0) | Difference with DGI _2008 c |
|---|---|---|---|---|
| Enjoy a wide variety of nutritious foods | The number of different types of core foods eaten on the previous day. The following made up the variety score: vegetables; fruit; dairy and cereals | Eats four types of vegetables (4 was the median); any fruit; consumes one of milk, yoghurt or cheese; eats three types of cereal foods( breads, bread substitutes, breakfast cereals, rice or pasta) | Eats none of the foods | Used proportion of foods for each food group eaten at least once a week |
| Enjoy plenty of vegetables, including different types and colours, and legumes/beans | Serves of vegetables usually eaten. This question did not specify “yesterday” | For men aged 19–50,at least six serves; for all others at least 5 serves | Eats none | Serves of vegetables & legumes per day |
| Enjoy fruit | Serves of fruit eaten yesterday | All groups, at least 2 serves | Eats none | Serves of fruit eaten per day |
| Enjoy grain (cereal) foods | Serves of cereals eaten yesterday | Men & women aged 18, at least 7 serves; men aged 19–64, at least 6 serves; women aged 19–50, at least 6 serves; women aged 51–64, at least 4 serves. | Eats less than recommended | Frequency of consumption |
| Mostly wholegrain and/or high cereal fibre varieties | Serves of wholegrain or wholemeal cereals eaten yesterday | Full score if all types of cereals eaten yesterday were wholemeal or wholegrain | No cereal foods were wholemeal or wholegrain | Only wholemeal bread was used |
| Enjoy milk, yoghurt, cheese and/or alternatives, mostly reduced fat d | Serves of dairy foods used/consumed yesterday | Men & women aged 18, at least 3½; men aged 19–64 and women aged 19–50, at least 2½ serves; women aged 51–64, at least 4 serves | Used/consumed no dairy foods yesterday | Frequency of consumption of dairy foods per day |
| Enjoy lean meats and poultry, fish, eggs, tofu, nuts and seeds, and legumes/beans | Serves of meat or fish eaten yesterday e | Men & women aged 18, at least 2½ serves; Men aged 19–50, 3 or more serves; Women aged 19–50, 2 ½ or more serves; women aged 51–64, 2 or more serves. | Eats less than recommended | Frequency of consumption of meats and alternatives the previous day with proportion of lean. |
| Limit intake of foods high in saturated fat | Ate full fat dairy food or sausages or biscuits | The numbers of foods eaten were converted to a score out of ten and those who ate none got a score of 10 | Ate all foods high in saturated fats | Used type of milk usually consumed as well as trimming fat from meat. |
| Drink plenty of water f | Litres of fluids - proportion of water to total fluids set at 66% d | Drank at least 8 (250) mL, cups (women) or 10 (250) mL, cups (men) of any fluid yesterday | Drank less than suggested | Used 8 cups (250 mL) |
| Limit intake of foods and drinks containing added sugars | Number of foods high in added sugar consumed yesterday including biscuits, soft drinks, crumpets, scones, muffins (cake type) and sugary breakfast cereals | No such foods eaten yesterday | Ate three types yesterday | Used frequency of consumption of cordial, fruit juice, soft drinks, jam, chocolate or confectionary |
| To achieve and maintain a healthy weight, be physically active and choose amounts of nutritious food and drinks to meet your energy needs g | Extra serves of any foods except fruit and vegetables consumed which were above the additional serves guidelines | No additional serves eaten | Any additional serves above upper limit | Used a combination of added sugar and extra foods. |
2.4 Analysis
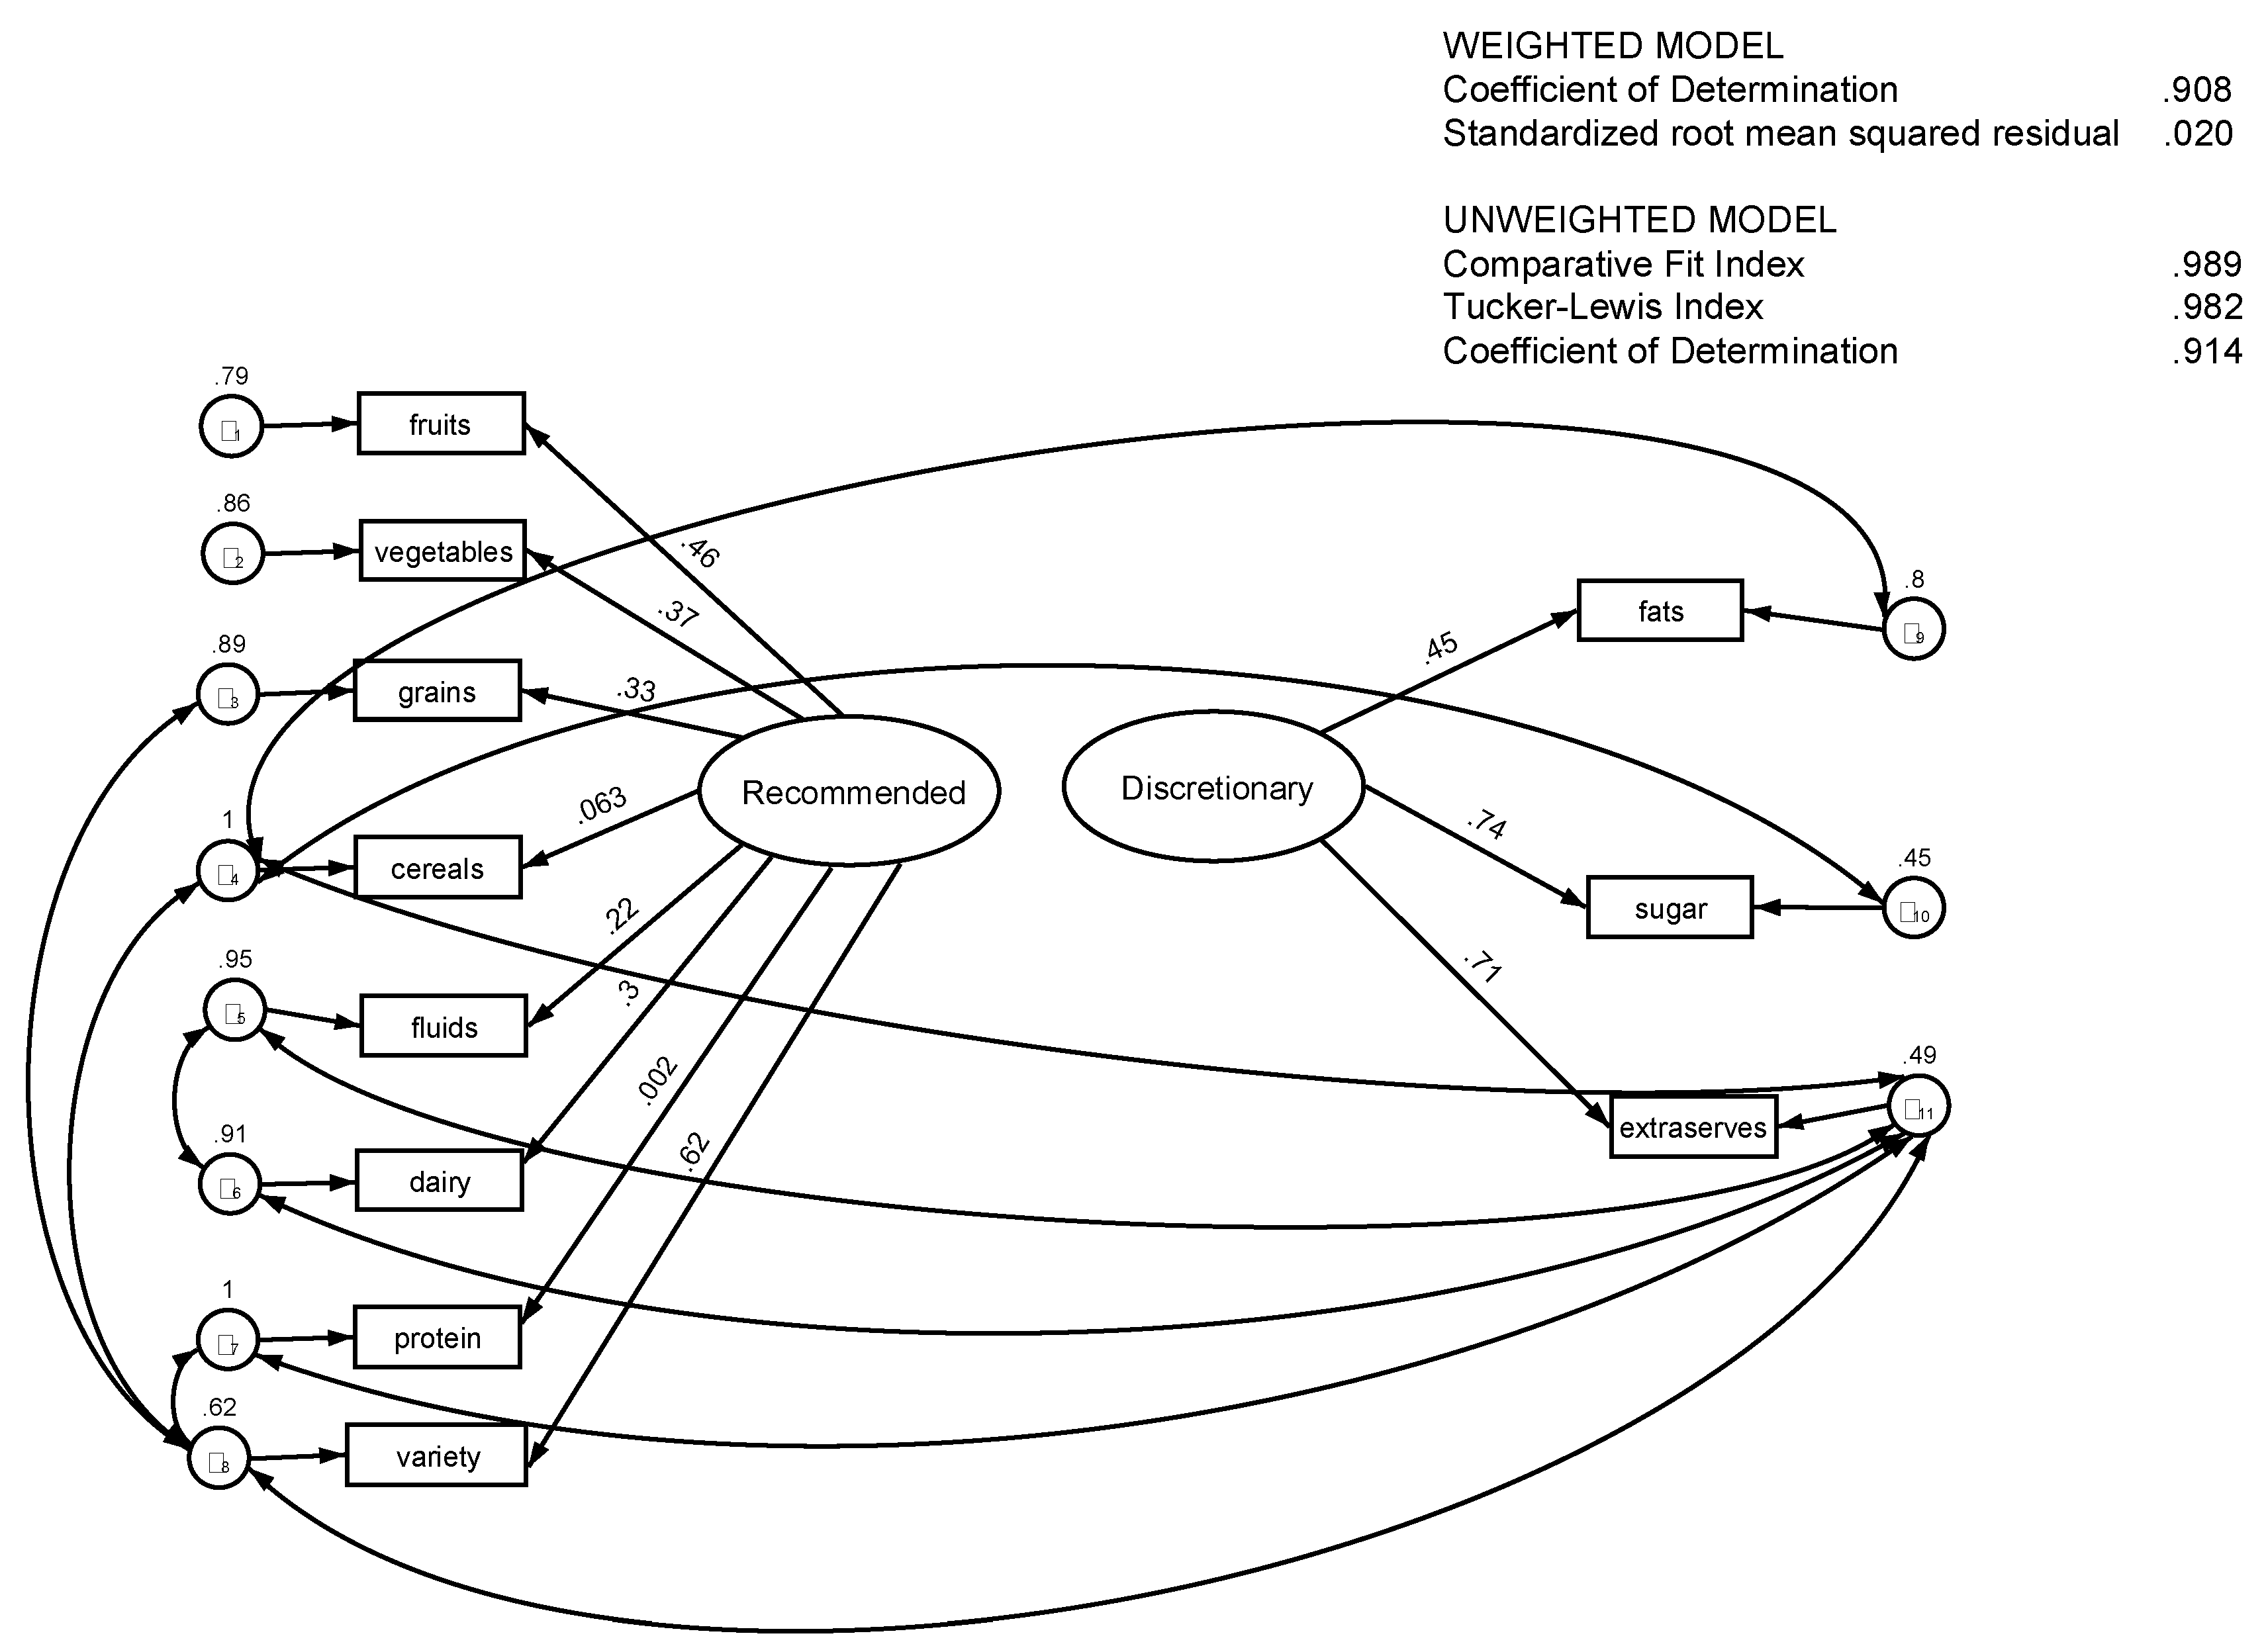
3. Results
| Fit Statistic | Value | Description |
|---|---|---|
| Likelihood Ratio * | ||
| chi2_ms (33) | 51.37 | model vs. saturated |
| p > chi2 | 0.02 | - |
| chi2_bs (55) | 1749.51 | baseline vs. saturated |
| p > chi2 | 0 | - |
| Population Error | ||
| RMSEA | 0.02 | Root mean squared error of approximation |
| 90% CI, lower bound | 0.01 | - |
| 90% CI, upper bound | 0.03 | - |
| pclose | 1 | Probability RMSEA ≤ 0.05 |
| Baseline Comparison | ||
| CFI | 0.99 | Comparative fit index |
| TLI | 0.98 | Tucker-Lewis index |
| Size of Residuals | ||
| SRMR | 0.02 | Standardized root mean squared residual |
| CD | 0.91 | Coefficient of determination |

| Males | Females | |||||
|---|---|---|---|---|---|---|
| Dietary Score Component | RFI 1 | Diff >1 § with DGI_2008 | % Meeting RFI 2 | RFI 1 | Diff >1 § with DGI_2008 | % Meeting RFI 2 |
| Food variety | 4.96 ± 0.15 | - | 5.58 | 5.33 ± 0.10 | - | 7.00 |
| Vegetables | 4.97 ± 0.14 | - | 8.39 | 5.66 ± 0.11 | - | 14.73 |
| Fruit | 6.88 ± 0.23 | - | 58.52 | 7.74 ± 0.14 | - | 68.06 |
| Cereals | 6.78 ± 0.19 | y | 38.48 | 5.98 ± 0.13 | - | 27.50 |
| Wholemeal/grains | 4.64 ± 0.27 | y | 43.76 | 4.95 ± 0.19 | y | 47.35 |
| Protein (meat/fish) | 3.54 ± 0.19 | y | 9.48 | 3.14 ± 0.13 | y | 6.79 |
| Dairy | 5.00 ± 0.16 | - | 10.32 | 4.88 ± 0.12 | - | 11.37 |
| Fluids 3 | 6.17 ± 0.14 | - | 15.29 | 6.11 ± 0.10 | y | 23.92 |
| Dietary Score Component | DFI 1 | Diff >1 § with DGI_2008 | % Meeting DFI 2 | DFI 1 | Diff >1 § with DGI_2008 | % Meeting DFI 2 |
| Fats | 7.00 ± 0.14 | y | 24.49 | 7.12 ± 0.10 | - | 29.38 |
| Sugar | 6.20 ± 0.2 | - | 46.07 | 7.12 ± 0.10 | y | 58.10 |
| Extra serves | 4.01 ± 0.22 | - | 22.22 | 4.93 ± 0.17 | y | 33.83 |
| Selected Descriptive Variables | RF_HEI | DF_HEI |
|---|---|---|
| Gender | Mean (95% CI) | Mean (95% CI) |
| Male | 44.11 (42.50, 45.73) | 16.64 (15.77, 17.50) |
| Female | 47.61 (46.46, 48.76) | 18.77 (18.10, 19.43) |
| Age Group in Years | ||
| 18–44 | 44.86 (43.30, 46.43) | 16.66 (15.82, 17.50) |
| 45–64 | 47.16 (46.13, 48.20) | 17.53 (16.92, 18.14) |
| Highest Level of Education Attained | ||
| Up to Year 12 | 42.07 (39.50, 44.64) | 18.07 (16.67, 19.47) |
| Year 12 | 43.40 (40.38, 46.43) | 17.00 (15.45, 18.54) |
| TAFE/Trade | 45.98 (44.36, 47.60) | 17.89 (17.01, 18.77) |
| Tertiary | 47.89 (46.33, 49.44) | 17.70 (16.76, 18.64) |
| Annual Household Income | ||
| Up to $40,000 | 46.29 (45.26, 47.32) | 17.75 (17.16, 18.34) |
| More than $40,000 | 41.39 (37.73, 45.05) | 17.15 (15.53, 18.78) |
| Perceived Discretional Income | ||
| Can’t save | 41.88 (39.69, 44.08) | 17.10 (15.96, 18.23) |
| Can save | 47.16 (46.07, 48.26) | 17.89 (17.25, 18.53) |
| SEIFA * | - | - |
| SEIFA Quintile 1 (most disadvantaged) | 43.64 (40.13, 47.15) | 14.98 (13.36, 16.59) |
| SEIFA Quintile 5 (least disadvantaged) | 46.96 (45.13, 48.78) | 18.25 (17.02, 19.48) |
| Current Employment Status | ||
| Employed | 46.35 (45.23, 47.48) | 17.94 (17.31, 18.57) |
| Unemployed | 38.28 (31.73, 44.84) | 17.78 (13.49, 22.07) |
| Home Duties | 48.32 (46.19, 50.45) | 17.28 (15.71, 18.85) |
| Student | 40.85 (36.12, 45.58) | 15.66 (13.09, 18.23) |
| Retired | 48.90 (46.38, 51.43) | 18.53 (16.88, 20.19) |
| Unable to work | 36.38 (29.35, 43.40) | 17.33 (13.23, 21.43) |
| Living Arrangements | ||
| Living with family/partner | 45.99 (44.93, 47.04) | 17.67 (17.09, 18.25) |
| Living alone | 42.30 (39.24, 45.37) | 19.41 (17.82, 21.00) |
| Other | 46.45 (40.25, 52.66) | 16.64 (13.02, 20.26) |
| Residential Area | - | - |
| Metropolitan Perth | 45.80 (44.58, 47.02) | 17.67 (16.98, 18.36) |
| Rest of State | 46.00 (44.33, 47.67) | 17.76 (16.88, 18.64) |
| Country of Birth | ||
| Australia | 45.81 (44.11, 47.52) | 17.35 (16.43, 18.27) |
| Other country | 45.87 (44.64, 47.11) | 17.86 (17.16, 18.56) |
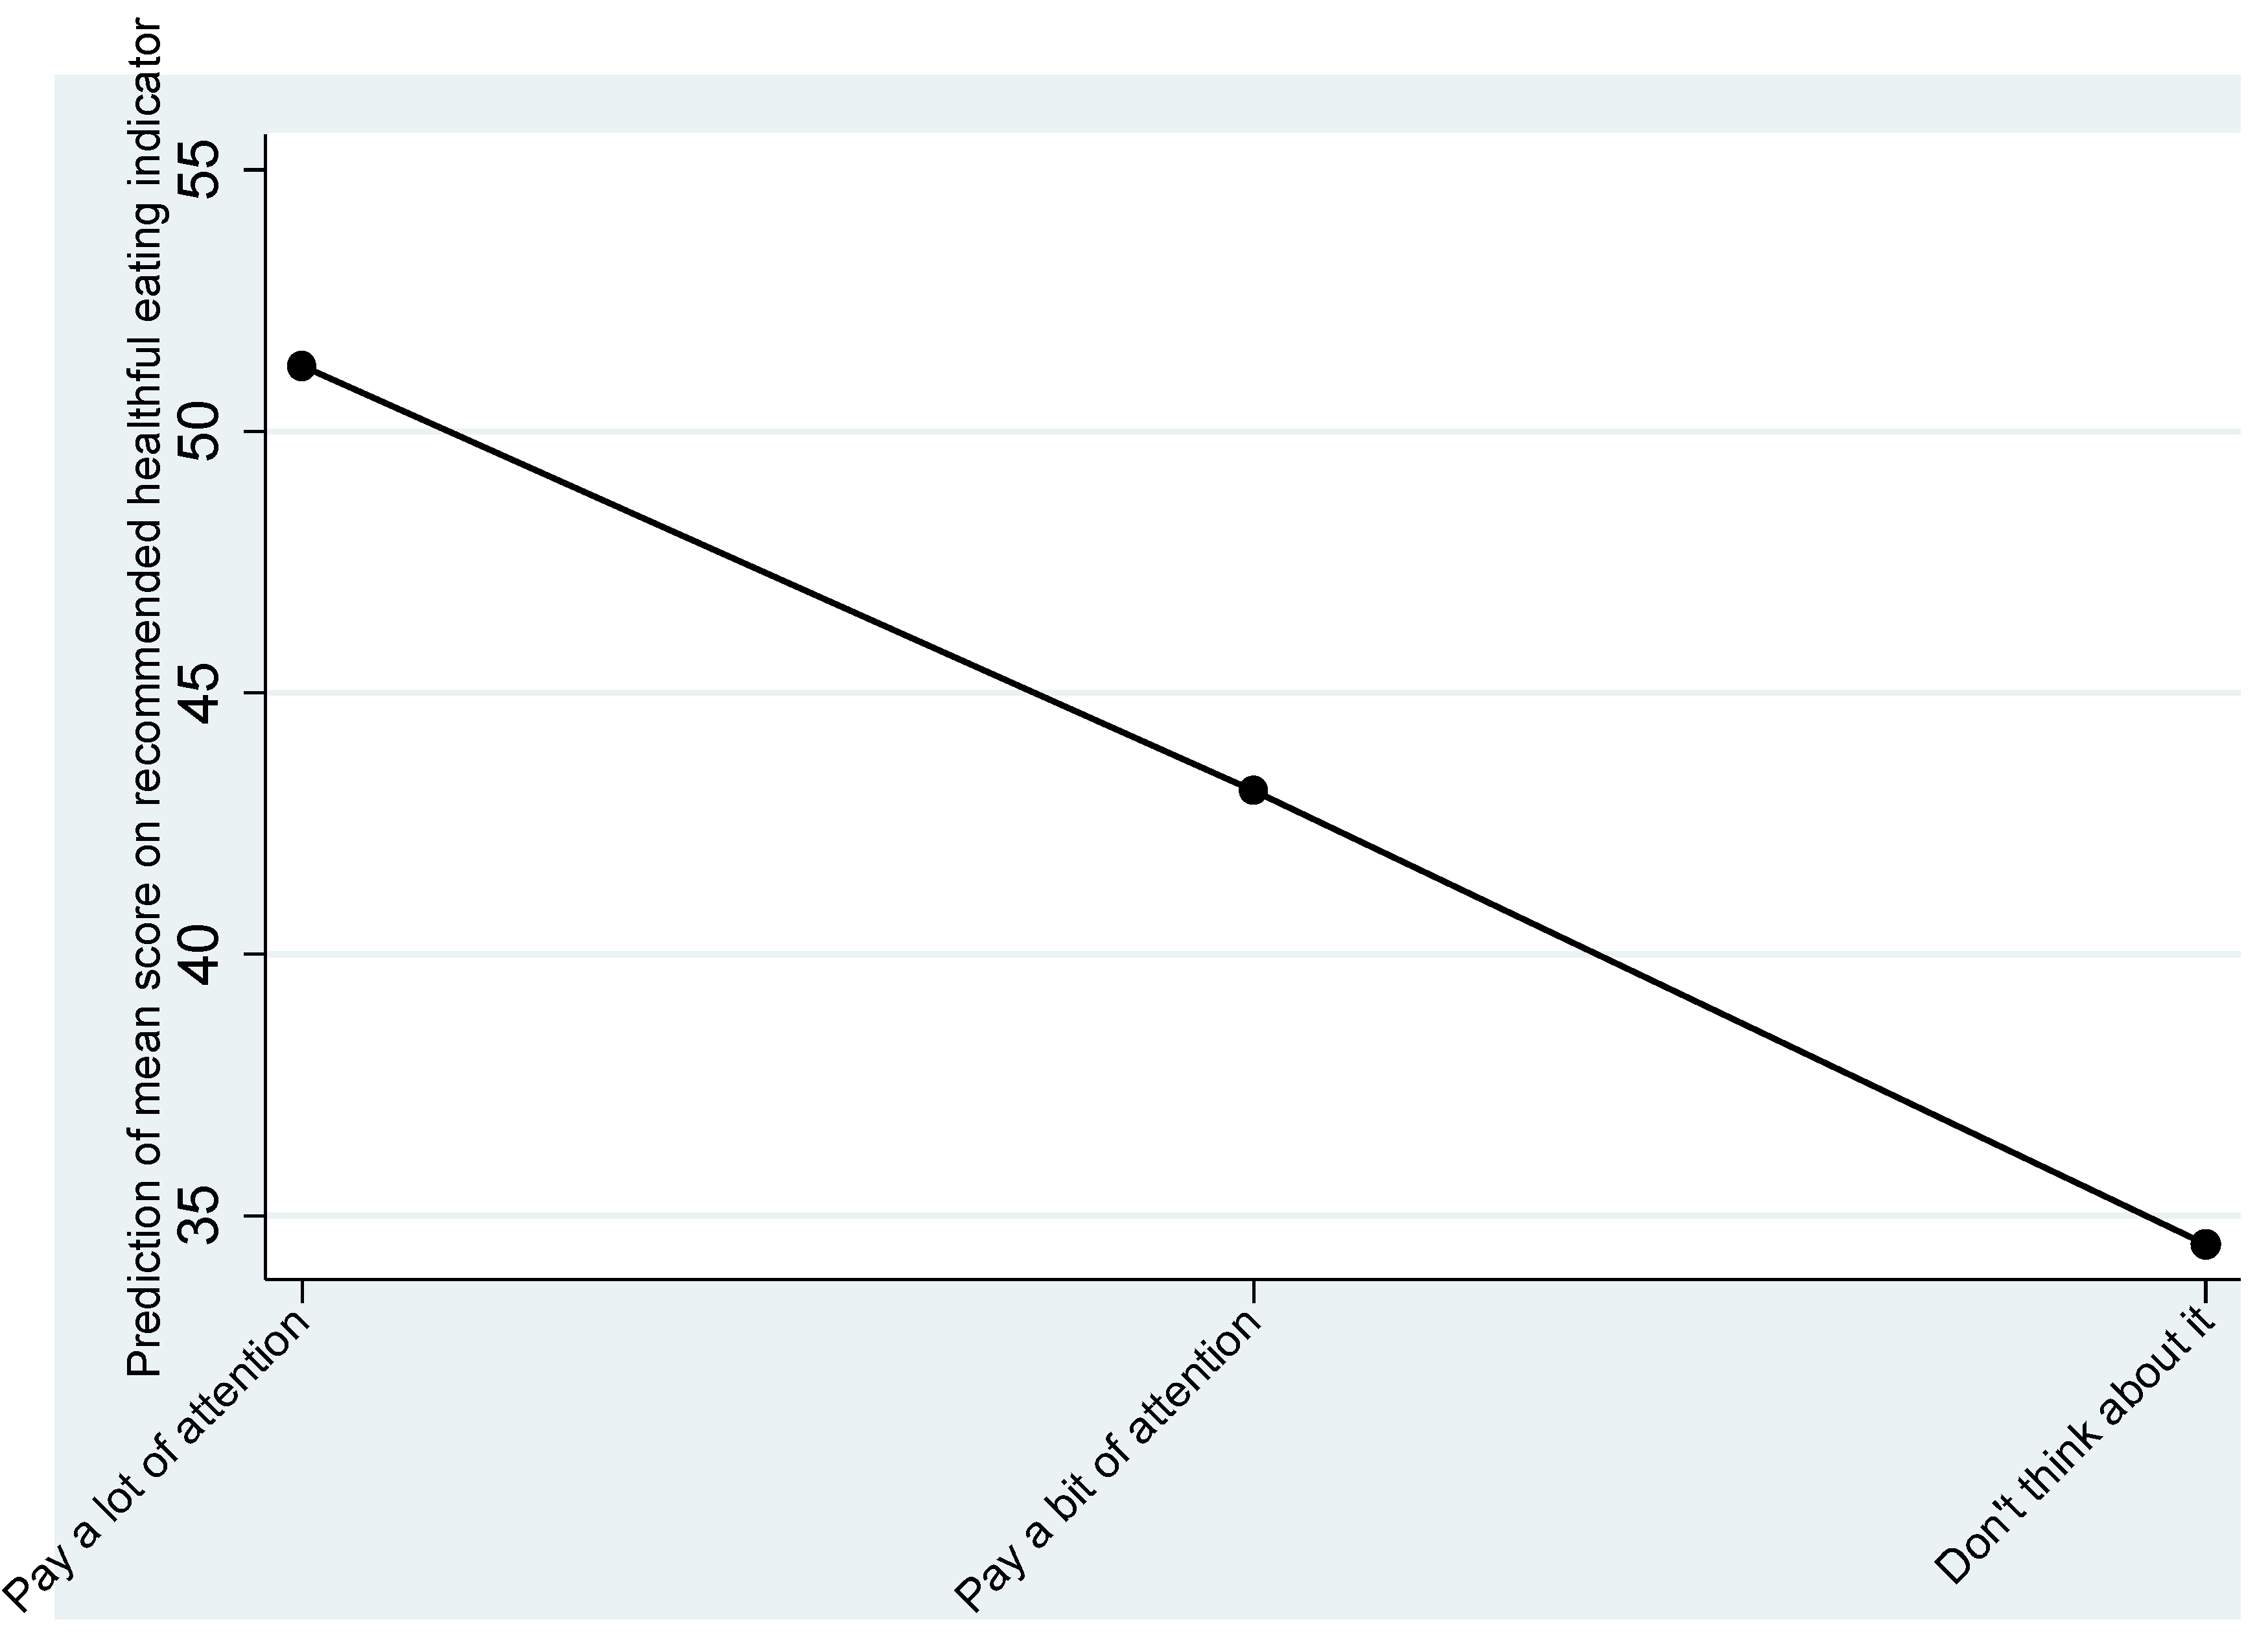
| Attention to Health Aspects of Diet | ||
| Pay a lot of attention | 51.47 (50.21, 52.72) | 19.23 (18.46, 20.00) |
| Take a bit of notice | 43.17 (41.86, 44.49) | 16.68 (15.86, 17.49) |
| Don’t really think much about it | 33.13 (28.93, 37.33) | 16.00 (13.98, 18.02) |

4. Discussion
5. Conclusions
Acknowledgments
Author Contributions
Conflicts of Interest
References
- Belin, R.J.; Greenland, P.; Allison, M.; Martin, L.; Shikany, J.M.; Larson, J.; Tinker, L.; Howard, B.V.; Lloyd-Jones, D.; van Horn, L. Diet quality and the risk of cardiovascular disease: The women’s health initiative (whi). Am. J. Clin. Nutr. 2011, 94, 49–57. [Google Scholar] [CrossRef] [PubMed]
- Barker, D.J.P. The developmental origins of adult disease. J. Am. Coll. Nutr. 2004, 23, 588S–595S. [Google Scholar] [CrossRef] [PubMed]
- Barker, D.; Eriksson, J.; Forsén, T.; Osmond, C. Fetal origins of adult disease: Strength of effects and biological basis. Int. J. Epidemiol. 2002, 31, 1235–1239. [Google Scholar] [CrossRef] [PubMed]
- Vaiserman, A.M. Early-life nutritional programming of longevity. J. Dev. Orig. Health Dis. 2014, 5, 325–338. [Google Scholar] [CrossRef] [PubMed]
- National Health and Medical Research Council. Australian Dietary Guidelines Incorporating the Australian Guide to Healthy Eating 2013; National Health and Medical Research Council: Canberra, Australia, 2013. [Google Scholar]
- Australian Bureau of Statistics. Australian health survey: Nutrition first results—Foods and nutrients, 2011-12. In Cat No 4364.0.55.007; Australian Bureau of Statistics: Canberra: Australia, 2014. [Google Scholar]
- Brambila Macias, J.; Shankar, B.; Capacci, S.; Mazzocchi, M.; Perez-Cueto, F.J.A.; Verbeke, W.; Traill, W.B. Policy interventions to promote healthy eating: A review of what works, what does not, and what is promising. Food Nutr. Bull. 2011, 32, 365–375. [Google Scholar] [PubMed]
- Buttriss, J.; Stanner, S.; McKevith, B.; Nugent, A.P.; Kelly, C.; Phillips, F.; Theobald, H.E. Successful ways to modify food choice: Lessons from the literature. Nutr. Bull. 2004, 29, 333–343. [Google Scholar] [CrossRef]
- Baranowski, T.; Cullen, K.W.; Baranowski, J. Psychosocial correlates of dietary intake: Advancing dietary intervention. Ann. Rev. Nutr. 1999, 19, 17–40. [Google Scholar] [CrossRef] [PubMed]
- Bergea, J.M.; Wall, M.; Larson, N.J.; Forsythd, A.; Bauere, K.W.; Neumark-Sztainer, D. Youth dietary intake and weight status: Healthful neighborhood food environments enhance the protective role of supportive family home environments. Health Place 2013, 26, 69–77. [Google Scholar] [CrossRef] [PubMed]
- Larson, N.; Laska, M.N.; Story, M.; Neumark-Sztainer, D. Predictors of fruit and vegetable intake in young adulthood. J. Acad. Nutr. Diet. 2012, 112, 1216–1222. [Google Scholar] [CrossRef] [PubMed]
- Beydoun, M.A.; Wang, Y. How do socio-economic status, perceived economic barriers and nutritional benefits affect quality of dietary intake among us adults? Eur. J. Clin. Nutr. 2007, 62, 303–313. [Google Scholar] [CrossRef] [PubMed]
- Loth, K.A.; MacLehose, R.; Bucchianeri, M.; Crow, S.; Neumark-Sztainer, D. Predictors of dieting and disordered eating behaviors from adolescence to young adulthood. J. Adolesc. Health 2014, 55, 705–712. [Google Scholar] [CrossRef] [PubMed]
- Traill, W.B.; Chambers, S.A.; Butler, L. Attitudinal and demographic determinants of diet quality and implications for policy targeting. J. Hum. Nutr. Diet. 2012, 25, 87–94. [Google Scholar] [CrossRef] [PubMed]
- Pot, G.K.; Richards, M.; Prynne, C.J.; Stephen, A.M. Development of the eating choices index (eci): A four-item index to measure healthiness of diet. Public Health Nutr. 2014, 17, 2660–2666. [Google Scholar] [CrossRef] [PubMed]
- Marks, G.C.; Webb, K.; Rutishauser, I.H.E.; Riley, M. Monitoring Food Habits in the Australian Population Using Short Questions; Australian Food and Nutrition Monitoring Unit, Queensland University: Queensland, Australia, 2001. [Google Scholar]
- Riley, M.; Rutishauser, I.H.E.; Webb, K. Comparison of Short Questions with Weighed Dietary Records; Commonwealth Department of Health and Aged Care: Canberra, Australia, 2001. [Google Scholar]
- Rutishauser, I.H.E.; Webb, K.; Abraham, B.; Allsopp, R. Comparison of short questions with weighed dietary records. In Australian Food and Nutrition Monitoring Unit; Commonwealth Department of Health and Aged Care: Canberra, Australia, 2001. [Google Scholar]
- Australian Bureau of Statistics. Socio-Economic Indexes for Areas (Seifa) 2011; Australian Bureau of Statistics: Canberra, Australia, 2013. [Google Scholar]
- Australian Institute of Health and Welfare. Australian Diet Quality Index Project; Cat No: PHE85; AIHW: Canberra, Australia, 2007. [Google Scholar]
- McNaughton, S.A.; Ball, K.; Crawford, D.; Mishra, G.D. An index of diet and eating patterns is a valid measure of diet quality in an australian population. J. Nutr. 2008, 138, 86–93. [Google Scholar] [PubMed]
- National Health and Medical Research Council. Australian guidelines summary dietary. In Eat for Health; National Health and Medical Research Council: Canberra, Australia, 2014. [Google Scholar]
- Oyebode, O.; Gordon-Dseagu, V.; Walker, A.; Mindell, J.S. Fruit and vegetable consumption and all-cause, cancer and cvd mortality: Analysis of health survey for England data. J. Epidemiol. Community Health 2014, 68, 856–862. [Google Scholar] [CrossRef] [PubMed]
- National Health and Medical Research Council. Eat for health. In Educators Guide; National Health and Medical Research Council: Canberra, Australia, 2013. [Google Scholar]
- Imamura, F.; Jacques, P.F. Invited commentary: Dietary pattern analysis. Am. J. Epidemiol. 2011, 173, 1105–1108. [Google Scholar] [CrossRef] [PubMed]
- Schreiber, J.B. Core reporting practices in structural equation modeling. Res. Soc. Adm. Pharm 2008, 4, 83–97. [Google Scholar] [CrossRef] [PubMed]
- Iacobucci, D. Everything you always wanted to know about sem (structural equations modeling) but were afraid to ask. J. Consum. Psychol. 2009, 19, 673–680. [Google Scholar] [CrossRef]
- Muthen, B.O.; Satorra, A. Complex sample data in structural equation modeling. Sociol. Methodol. 1995, 25, 267–316. [Google Scholar] [CrossRef]
- StataCorp. Stata glossary and index release 13®. In Statistical Software; StataCorp LP: College Station, TX, USA, 2013. [Google Scholar]
- Hu, F.B.; Bentler, P.M. Cut off criteria for fit indexes in covariant structure analysis: Conventional criteria versus new alternative. Struct. Equ. Model. 1999, 6, 1–55. [Google Scholar] [CrossRef]
- Grieger, J.A.; Scott, J.; Cobiac, L. Cluster analysis and food group consumption in a national sample of Australian girls. J. Hum. Nutr. Diet. 2012, 25, 75–86. [Google Scholar] [CrossRef] [PubMed]
- Moeller, S.M.; Reedy, J.; Millen, A.E.; Dixon, L.B.; Newby, P.K.; Tucker, K.L.; Krebs-Smith, S.M.; Guenther, P.M. Dietary patterns: Challenges and opportunities in dietary patterns research: An experimental biology workshop, 1 April 2006. J. Am. Diet. Assoc. 2007, 107, 1233–1239. [Google Scholar] [CrossRef] [PubMed]
- Li, W.-Q.; Park, Y.; Wu, J.W.; Goldstein, A.M.; Taylor, P.R.; Hollenbeck, A.R.; Freedman, N.D.; Abnet, C.C. Index-based dietary patterns and risk of head and neck cancer in a large prospective study. Am. J. Clin. Nutr. 2014, 99, 559–566. [Google Scholar] [CrossRef] [PubMed]
- Amini, M.; Shafaeizadeh, S.; Zare, M.; Boroujeni, H.K.; Esmaillzadeh, A. A cross-sectional study on food patterns and adiposity among individuals with abnormal glucose homeostasis. Arch. Iran. Med. 2012, 15, 131–135. [Google Scholar] [PubMed]
- Xu, B.; Houston, D.; Locher, J.L.; Zizza, C. The association between healthy eating index-2005 scores and disability among older Americans. Age Ageing 2012, 41, 365–371. [Google Scholar] [CrossRef] [PubMed]
- Elstgeest, L.E.M.; Mishra, G.D.; Dobson, A.J. Transitions in living arrangements are associated with changes in dietary patterns in young women. J. Nutr. 2012, 142, 1561–1567. [Google Scholar] [CrossRef] [PubMed]
- Kant, A.K. Dietary patterns and health outcomes. J. Am. Diet. Assoc. 2004, 104, 615–635. [Google Scholar] [CrossRef] [PubMed]
- Pachucki, M.A. Food pattern analysis over time: Unhealthful eating trajectories predict obesity. Int. J. Obes. 2012, 36, 686–694. [Google Scholar] [CrossRef] [PubMed]
- Kant, A.K.; Schatzkin, A.; Graubard, B.I.; Schairer, C. A prospective study of diet quality and mortality in women. J. Am. Med. Assoc. 2000, 283, 2109–2115. [Google Scholar] [CrossRef]
- Lê, J.; Dallongeville, J.; Wagner, A.; Arveiler, D.; Haas, B.; Cottel, D.; Simon, C.; Dauchet, L. Attitudes toward healthy eating: A mediator of the educational level-diet relationship. Eur. J. Clin. Nutr. 2013, 67, 808–814. [Google Scholar] [CrossRef] [PubMed]
- Grunert, K.G.; Shepherd, R.; Traill, W.B.; Wold, B. Food choice, energy balance and its determinants: Views of human behaviour in economics and psychology. Trends Food Sci. Technol. 2012, 28, 132–142. [Google Scholar] [CrossRef]
- Galea, S.; Tracy, M. Participation rates in epidemiologic studies. Ann. Epidemiol. 2007, 17, 643–653. [Google Scholar] [CrossRef] [PubMed]
© 2015 by the authors; licensee MDPI, Basel, Switzerland. This article is an open access article distributed under the terms and conditions of the Creative Commons Attribution license (http://creativecommons.org/licenses/by/4.0/).
Share and Cite
Daly, A.; Pollard, C.M.; Kerr, D.A.; Binns, C.W.; Phillips, M. Using Short Dietary Questions to Develop Indicators of Dietary Behaviour for Use in Surveys Exploring Attitudinal and/or Behavioural Aspects of Dietary Choices. Nutrients 2015, 7, 6330-6345. https://doi.org/10.3390/nu7085287
Daly A, Pollard CM, Kerr DA, Binns CW, Phillips M. Using Short Dietary Questions to Develop Indicators of Dietary Behaviour for Use in Surveys Exploring Attitudinal and/or Behavioural Aspects of Dietary Choices. Nutrients. 2015; 7(8):6330-6345. https://doi.org/10.3390/nu7085287
Chicago/Turabian StyleDaly, Alison, Christina M. Pollard, Deborah A. Kerr, Colin W. Binns, and Michael Phillips. 2015. "Using Short Dietary Questions to Develop Indicators of Dietary Behaviour for Use in Surveys Exploring Attitudinal and/or Behavioural Aspects of Dietary Choices" Nutrients 7, no. 8: 6330-6345. https://doi.org/10.3390/nu7085287