Metabolomics to Explore Impact of Dairy Intake


Abstract
:1. Introduction
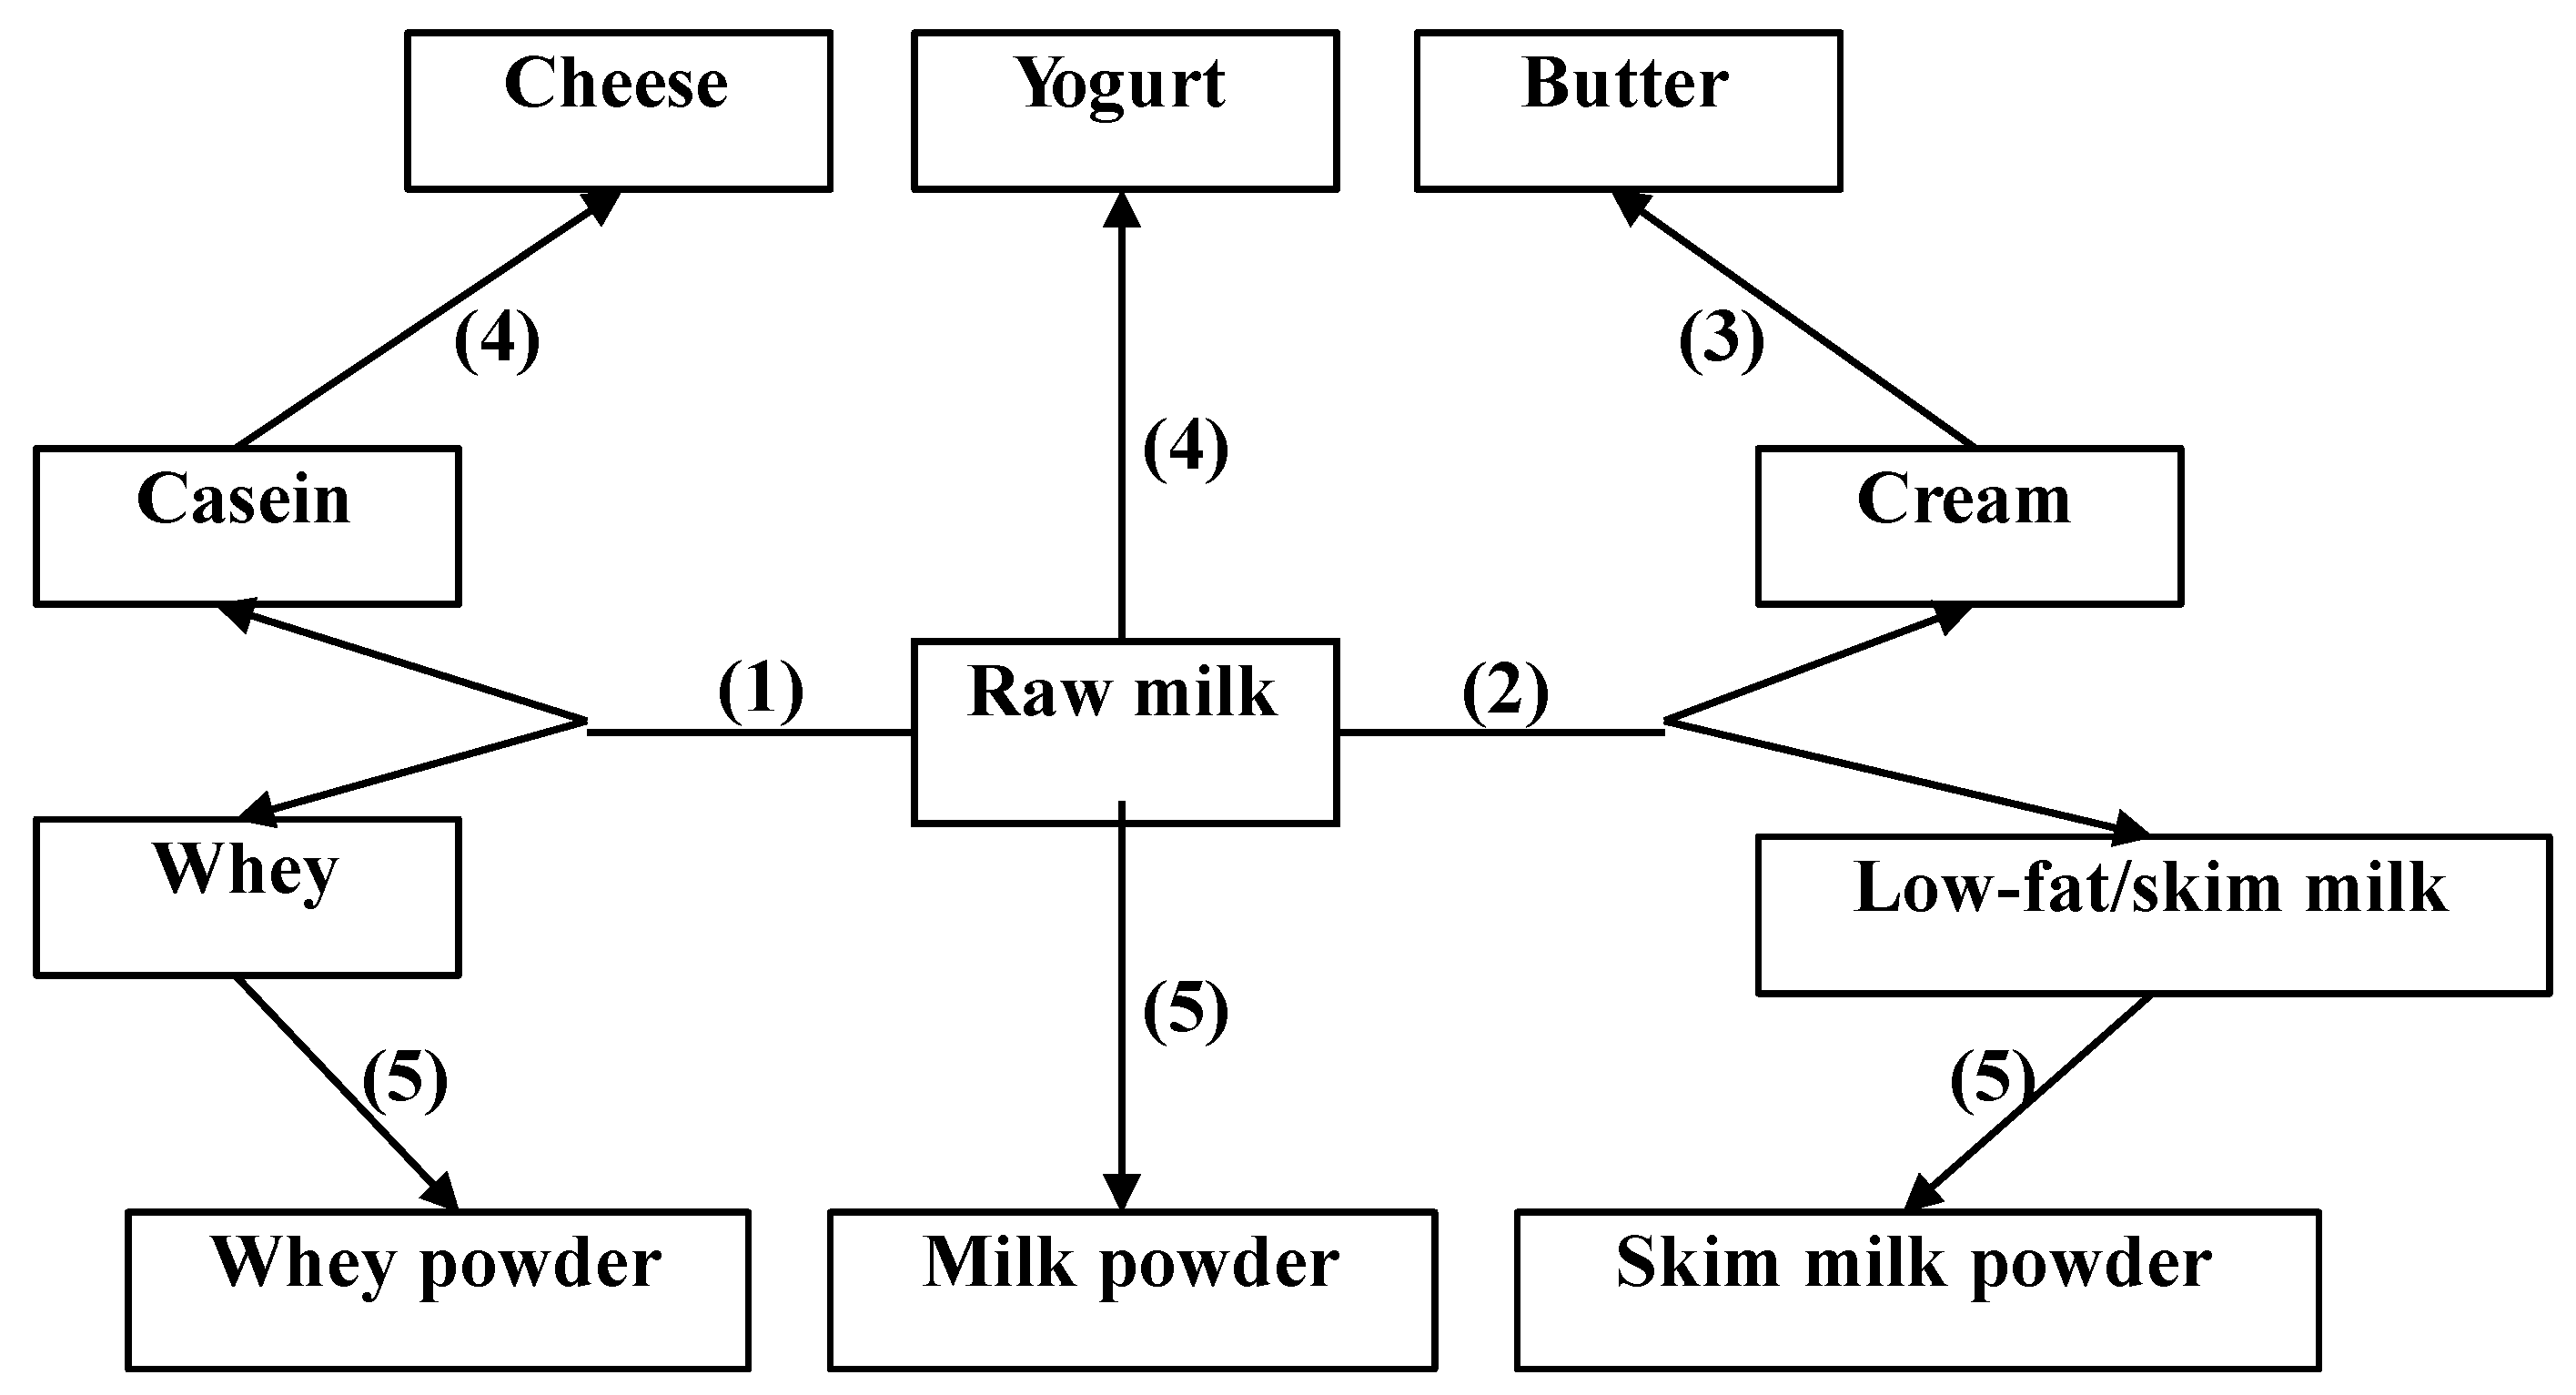
2. Dairy Products and Composition
3. Dairy Intake and Human Health
3.1. Overweight and Obesity
3.2. Diabetes
3.3. Hypertension
3.4. Cancer
3.5. Stroke
3.6. Bone Health
4. Dairy Intake Assessment
4.1. Significance of Dairy Intake Assessment
4.2. Assessment of Dairy Fat Intake
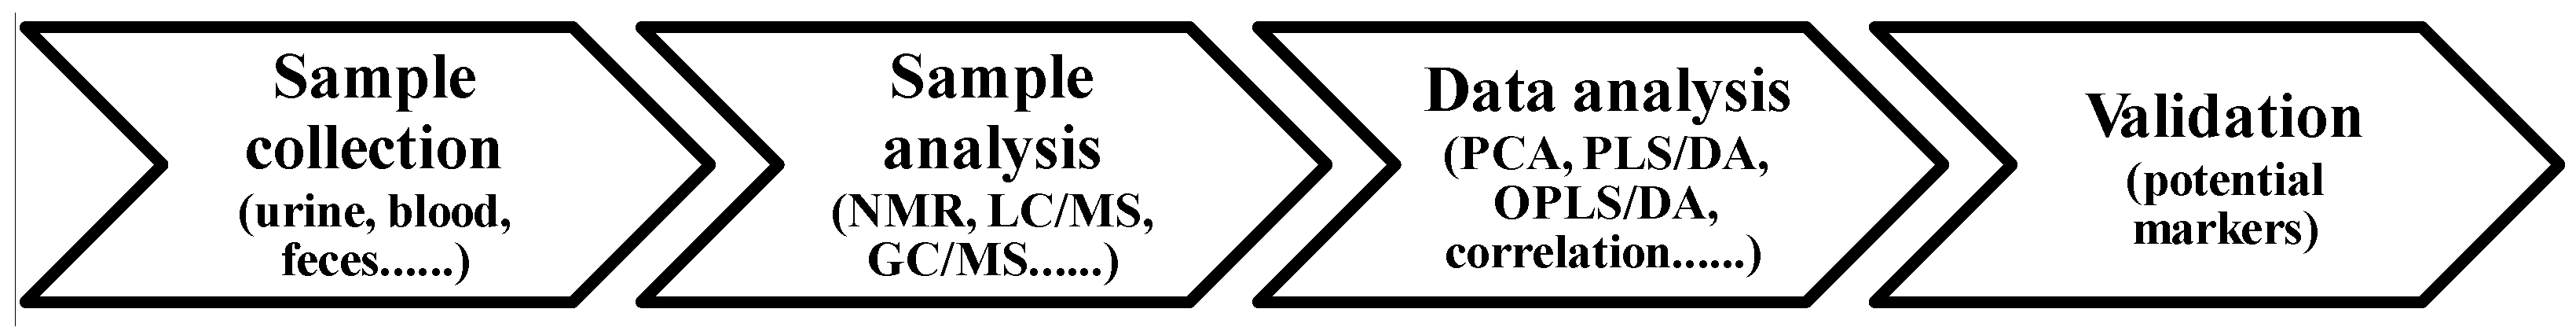
4.3. Principle in Assessment of Dairy Intake by Metabolomics
4.4. Metabolomics Applied to Identify Biomarkers Related to Dairy Intake
4.5. Metabolomics Applied to Elucidate Metabolic Impact of Dairy Intake

| Reference | Dairy Product | Design | Subject | N | Age | Time | Sample | Technique | Metabolite | ||
|---|---|---|---|---|---|---|---|---|---|---|---|
| Guertin et al. [98] | Butter | E a | Women (44%) | 502 | 64 ± 5 | 1 year | Serum | UPLC/GC-MS | Methyl palmitate (16:0)↑; 15:0↑; 10-undecenoate↑ | ||
| Bertram et al. [99] | Milk | R b | Boy (100%) | 24 | 8 | 7 days | Urine, plasma | NMR | Urinary hippurate↑; plasma SCFA↑ | ||
| Pedersen et al. [100] | Probiotic/non-probiotic acidified milk | R | Women (74%) | 61 | 19–79 | 8 weeks | Serum | NMR | Lactate↑; 3-hydroxybutyrate↑ | ||
| Pedersen et al. [101] | Probiotic/non-probiotic acidified milk | R | Women (74%) | 61 | 19–79 | 8 weeks | Serum | GC-MS | Lactate↑; glutamine↑; proline↑; creatinine/creatine↑; aspartic acid↑; glucose↓ | ||
| Zheng et al. [102] | Casein, whey, skim milk | R | Overweight adolescents (Girl, 62%) | 192 | 12–15 | 12 weeks | Urine | NMR | Casein/skim milk: urea↑ | ||
| Piccolo et al. [103] | Whey | R | Obese women (100%) | 27 | - | 8 weeks | Plasma | GC-MS | Whey vs. gelatin protein: Pro-/Cys-related metabolites↓ | ||
| Zheng et al. [104] | Low or high dairy product | R | Women (100%) | 38 | 18–60 | 24 weeks | Urine | NMR | High vs. low dairy intake: citrate↑; TMAO↓ | ||
| Hjerpsted et al. [105] | Cheese, butter | C c | Women (43%) | 23 | 22–70 | 6 weeks | Urine | UPLC-MS | Cheese: indoxyl sulfate↑; xanthurenic acid↑; tyramine sulfate↑; 4-hydroxyphenylacetic acid↑; isovalerylglutamic acid↑; isovalerylglycine↑; tiglylglycine↑; isobutyrylglycine↑ | ||
| Zheng et al. [106] | Cheese, milk | C | Men (100%) | 15 | 18–50 | 2 weeks | Urine | NMR | Cheese vs. control: creatine↓; creatinine↓; prolinebetaine↑; choline↓; TMAO↓; tyrosine↑ Milk vs. control: citrate↑; prolinebetaine↓; TMAO↓; hippurate↓; urea↑ Cheese vs. milk: citrate↓; creatine↓; creatinine↓; prolinebetaine↑; tyrosine↑; hippurate↑ | ||
| Zheng et al. [106] | Cheese, milk | C | Men (100%) | 15 | 18–50 | 2 weeks | Feces | NMR | Cheese vs. control: propionate↑; butyrate↑; malonate↓; fecal lipid↑ Milk vs. control: propionate↑; acetate↑; glycerol↑; malonate↓; choline↓; fecal lipid↑ Cheese vs. milk: butyrate↑; malonate↑; glycerol↓ | ||
| Yde et al. [107] | Whey, calcium caseinate | C | Men (100%) | 12 | 28 ± 2 | Postexercise 70–330 min | Plasma | NMR | Whey: VLDL↑; LDL↓ Caseinate: VLDL↑; LDL↑ | ||
| Stanstrup et al. [108] | Whey isolate (WI), whey hydrolysate (WH), α-lactalbumin, caseinoglycomacropeptide | C | Obese, nondiabetic subjects | 11 | 44–74 | Postprandial 1–8 h | Plasma | LC-MS | WH: methionine sulfoxide↑; cyclo(Pro-Thr)↑; cyclo(Phe-Val)↑; cyclo(Ile-Val)/cyclo(Leu-Val)↑; β-Asp-Leu↑; pGlu-Pro↑; Cyclo(Ala-Ile)↑; pGlu-Leu↑; pGlu-Val↑; N-phenylacetylmethionine↑; methionine↓; hydroxyphenyllactic acid↓; N-phenylacetylmethionine sulfoxide↑; glutamic acid↑ WI: threonine↓; indolelactic acid↑; γ-glutamyl-leucine↑; phenylalanine↑; γ-glutamyl-leucine↑; kynurenine↑ | ||
| Stanstrup et al. [109] | Whey isolate (WI), casein | C | Obese, nondiabetic subjects | 11 | 40–68 | Postprandial 1–8 h | Plasma | LC-MS | WI: leucine/isoleucine↑; γ-glutamyl-leucine↑; tryptophan↑; isoleucine↑; paracetamol↓; threonine↑; γ-glutamyl-methionine↑; lysine↑; β-hydroxyisobutyric acid↑; methionine↑; γ-glutamyl-valine↑; paracetamol sulfate↓; kynurenine↑; paracetamol glucuronide↓; α-keto-3-methylvaleric acid↑; valine↑; citrulline↑; 3-hydroxy-2-methylbutyric acid↑; glutamic acid↑; propionylcarnitine↑; α-hydroxydecanoic acid↓; lauric acid↓; myristic acid↓; hydroxybutyric acid↑ Casein: methionine sulfoxide↑; N-phenylacetyl-methionine↑ | ||
5. Conclusions
Acknowledgments
Author Contributions
Conflicts of Interest
References
- Miller, G.D.; Jarvis, J.K.; McBean, L.D. Handbook of Dairy Foods and Nutrition, 3rd ed.; CRC Press: Boca Raton, FL, USA, 2007. [Google Scholar]
- Visioli, F.; Strata, A. Milk, dairy products, and their functional effects in humans: A narrative review of recent evidence. Adv. Nutr. 2014, 5, 131–143. [Google Scholar] [CrossRef] [PubMed]
- O’Sullivan, A.; Gibney, M.J.; Brennan, L. Dietary intake patterns are reflected in metabolomic profiles: Potential role in dietary assessment studies. Am. J. Clin. Nutr. 2011, 93, 314–321. [Google Scholar] [CrossRef] [PubMed]
- O’Gorman, A.; Gibbons, H.; Brennan, L. Metabolomics in the identification of biomarkers of dietary intake. Comput. Struct. Biotechnol. J. 2013, 4, 1–7. [Google Scholar] [CrossRef] [PubMed]
- Favé, G.; Beckmann, M.E.; Draper, J.H.; Mathers, J.C. Measurement of dietary exposure: A challenging problem which may be overcome thanks to metabolomics? Genes Nutr. 2009, 4, 135–141. [Google Scholar] [CrossRef] [PubMed]
- Walstra, P.; Wouters, J.T.M.; Geurts, T.J. Dairy Science and Technology, 2nd ed.; CRC Press: Boca Raton, FL, USA, 2006. [Google Scholar]
- Henning, D.R.; Baer, R.J.; Hassan, A.N.; Dave, R. Major advances in concentrated and dry milk products, cheese, and milk fat-based spreads 1. J. Dairy Sci. 2006, 89, 1179–1188. [Google Scholar] [CrossRef]
- Adolfsson, O.; Meydani, S.N.; Russell, R.M. Yogurt and gut function. Am. J. Clin. Nutr. 2004, 80, 245–256. [Google Scholar] [PubMed]
- Stevens, G.A.; Singh, G.M.; Lu, Y.; Danaei, G.; Lin, J.K.; Finucane, M.M.; Bahalim, A.N.; McIntire, R.K.; Gutierrez, H.R.; Cowan, M.; et al. National, regional, and global trends in adult overweight and obesity prevalences. Popul. Health Metr. 2012, 10, 22. [Google Scholar] [CrossRef] [PubMed]
- Louie, J.C.Y.; Flood, V.M.; Hector, D.J.; Rangan, A.M.; Gill, T.P. Dairy consumption and overweight and obesity: A systematic review of prospective cohort studies. Obes. Rev. 2011, 12, e582–e592. [Google Scholar] [CrossRef] [PubMed]
- Abargouei, A.S.; Janghorbani, M.; Salehi-Marzijarani, M.; Esmaillzadeh, A. Effect of dairy consumption on weight and body composition in adults: A systematic review and meta-analysis of randomized controlled clinical trials. Int. J. Obes. 2012, 36, 1485–1493. [Google Scholar] [CrossRef] [PubMed]
- Chen, M.; Pan, A.; Malik, V.S.; Hu, F.B. Effects of dairy intake on body weight and fat: A meta-analysis of randomized controlled trials. Am. J. Clin. Nutr. 2012, 96, 735–747. [Google Scholar] [CrossRef] [PubMed]
- Kratz, M.; Baars, T.; Guyenet, S. The relationship between high-fat dairy consumption and obesity, cardiovascular, and metabolic disease. Eur. J. Nutr. 2013, 52, 1–24. [Google Scholar] [CrossRef] [PubMed]
- Zemel, M.B. The role of dairy foods in weight management. J. Am. Coll. Nutr. 2005, 24, 537S–546S. [Google Scholar] [CrossRef] [PubMed]
- Christensen, R.; Lorenzen, J.K.; Svith, C.R.; Bartels, E.M.; Melanson, E.L.; Saris, W.H.; Tremblay, A.; Astrup, A. Effect of calcium from dairy and dietary supplements on faecal fat excretion: A meta-analysis of randomized controlled trials. Obes. Rev. 2009, 10, 475–486. [Google Scholar] [CrossRef] [PubMed]
- Melanson, E.L.; Sharp, T.A.; Schneider, J.; Donahoo, W.T.; Grunwald, G.K.; Hill, J.O. Relation between calcium intake and fat oxidation in adult humans. Int. J. Obes. Relat. Metab. Disord. 2003, 27, 196–203. [Google Scholar] [CrossRef] [PubMed]
- Nielsen, S.D.; Young, J.F.; Mortensen, G.; Petersen, R.K.; Kristiansen, K.; Dalsgaard, T.K. Activation of the angiopoietin-like 4 (ANGPLT4) gene by milk fat and casein. Int. Dairy J. 2014, 36, 136–142. [Google Scholar] [CrossRef]
- Nielsen, S.D.; Amer, B.; Young, J.F.; Mortensen, G.; Petersen, R.K.; Kristiansen, K.; Dalsgaard, T.K. Medium chain fatty acids from milk induce angiopoietin-like 4 (ANGPTL4) gene expression. Int. Dairy J. 2015, 42, 34–41. [Google Scholar] [CrossRef]
- Mattijssen, F.; Alex, S.; Swarts, H.J.; Groen, A.K.; van Schothorst, E.M.; Kersten, S. Angptl4 serves as an endogenous inhibitor of intestinal lipid digestion. Mol. Metable 2014, 3, 135–144. [Google Scholar] [CrossRef] [PubMed]
- Luhovyy, B.L.; Akhavan, T.; Anderson, G.H. Whey proteins in the regulation of food intake and satiety. J. Am. Coll. Nutr. 2007, 26, 704S–712S. [Google Scholar] [CrossRef] [PubMed]
- Brehm, B.J.; Spang, S.E.; Lattin, B.L.; Seeley, R.J.; Daniels, S.R.; D’Alessio, D.A. The role of energy expenditure in the differential weight joss in obese women on low-fat and low-carbohydrate diets. J. Clin. Endocrinol. Metable 2005, 90, 1475–1482. [Google Scholar] [CrossRef] [PubMed]
- Morifuji, M.; Sakai, K.; Sanbongi, C.; Sugiura, K. Dietary whey protein down regulates fatty acid synthesis in the liver, but up regulates it in skeletal muscle of exercise-trained rats. Nutrition 2005, 21, 1052–1058. [Google Scholar] [CrossRef] [PubMed]
- St-Onge, M.P.; Farnworth, E.R.; Jones, P.J. Consumption of fermented and nonfermented dairy products: Effects on cholesterol concentrations and metabolism. Am. J. Clin. Nutr. 2000, 71, 674–681. [Google Scholar] [PubMed]
- DiBaise, J.K.; Zhang, H.; Crowell, M.D.; Krajmalnik-Brown, R.; Decker, G.A.; Rittmann, B.E. Gut microbiota and its possible relationship with obesity. Mayo Clin. Proc. 2008, 83, 460–469. [Google Scholar] [CrossRef] [PubMed]
- Pittas, A.G.; Lau, J.; Hu, F.B.; Dawson-Hughes, B. The role of vitamin D and calcium in type 2 diabetes. A systematic review and meta-analysis. J. Clin. Endocrinol. Metable 2007, 92, 2017–2029. [Google Scholar] [CrossRef] [PubMed]
- Elwood, P.C.; Givens, D.I.; Beswick, A.D.; Fehily, A.M.; Pickering, J.E.; Gallacher, J. The survival advantage of milk and dairy consumption: An overview of evidence from cohort studies of vascular diseases, diabetes and cancer. J. Am. Coll. Nutr. 2008, 27, 723S–734S. [Google Scholar] [CrossRef] [PubMed]
- Tong, X.; Dong, J.Y.; Wu, Z.W.; Li, W.; Qin, L.Q. Dairy consumption and risk of type 2 diabetes mellitus: A meta-analysis of cohort studies. Eur. J. Clin. Nutr. 2011, 65, 1027–1031. [Google Scholar] [CrossRef] [PubMed]
- Aune, D.; Norat, T.; Romundstad, P.; Vatten, L.J. Dairy products and the risk of type 2 diabetes: A systematic review and dose-response meta-analysis of cohort studies. Am. J. Clin. Nutr. 2013. [Google Scholar] [CrossRef] [PubMed]
- Gao, D.; Ning, N.; Wang, C.; Wang, Y.; Li, Q.; Meng, Z.; Liu, Y.; Li, Q. Dairy products consumption and risk of type 2 diabetes: Systematic review and dose-response meta-analysis. PLoS ONE 2013, 8, e73965. [Google Scholar] [CrossRef] [PubMed]
- Chen, M.; Sun, Q.; Giovannucci, E.; Mozaffarian, D.; Manson, J.E.; Willett, W.C.; Hu, F.B. Dairy consumption and risk of type 2 diabetes: 3 cohorts of US adults and an updated meta-analysis. BMC Med. 2014, 12, 215. [Google Scholar] [CrossRef] [PubMed]
- Turner, K.M.; Keogh, J.B.; Clifton, P.M. Dairy consumption and insulin sensitivity: A systematic review of short-and long-term intervention studies. Nutr. Metab. Cardiovasc. Dis. 2015, 25, 3–8. [Google Scholar] [CrossRef] [PubMed]
- Ma, B.; Lawson, A.B.; Liese, A.D.; Bell, R.A.; Mayer-Davis, E.J. Dairy, magnesium, and calcium intake in relation to insulin sensitivity: approaches to modeling a dose-dependent association. Am. J. Epidemiol. 2006, 164, 449–458. [Google Scholar] [CrossRef] [PubMed]
- Larsson, S.C.; Wolk, A. Magnesium intake and risk of type 2 diabetes: A meta-analysis. J. Intern. Med. 2007, 262, 208–214. [Google Scholar] [CrossRef] [PubMed]
- George, P.S.; Pearson, E.R.; Witham, M.D. Effect of vitamin D supplementation on glycaemic control and insulin resistance: A systematic review and meta-analysis. Diabetic Med. 2012, 29, e142–e150. [Google Scholar] [CrossRef] [PubMed]
- Jakubowicz, D.; Froy, O. Biochemical and metabolic mechanisms by which dietary whey protein may combat obesity and Type 2 diabetes. J. Nutr. Biochem. 2013, 24, 1–5. [Google Scholar] [CrossRef] [PubMed]
- Itoh, Y.; Kawamata, Y.; Harada, M.; Kobayashi, M.; Fujii, R.; Fukusumi, S.; Ogi, K.; Hosoya, M.; Tanaka, Y.; Uejima, H.; et al. Free fatty acids regulate insulin secretion from pancreatic β cells through GPR40. Nature 2003, 422, 173–176. [Google Scholar] [CrossRef] [PubMed]
- Mozaffarian, D.; de Oliveira Otto, M.C.; Lemaitre, R.N.; Fretts, A.M.; Hotamisligil, G.; Tsai, M.Y.; Siscovick, D.S.; Nettleton, J.A. trans-Palmitoleic acid, other dairy fat biomarkers, and incident diabetes: The Multi-Ethnic Study of Atherosclerosis (MESA). Am. J. Clin. Nutr. 2013, 97, 854–861. [Google Scholar] [CrossRef] [PubMed]
- Ralston, R.A.; Lee, J.H.; Truby, H.; Palermo, C.E.; Walker, K.Z. A systematic review and meta-analysis of elevated blood pressure and consumption of dairy foods. J. Hum. Hypertens. 2012, 26, 3–13. [Google Scholar] [CrossRef] [PubMed]
- Soedamah-Muthu, S.S.; Verberne, L.D.; Ding, E.L.; Engberink, M.F.; Geleijnse, J.M. Dairy consumption and incidence of hypertension a dose-response meta-analysis of prospective cohort studies. Hypertension 2012, 60, 1131–1137. [Google Scholar] [CrossRef] [PubMed]
- Dong, J.Y.; Szeto, I.M.Y.; Makinen, K.; Gao, Q.; Wang, J.; Qin, L.Q.; Zhao, Y. Effect of probiotic fermented milk on blood pressure: A meta-analysis of randomised controlled trials. Br. J. Nutr. 2013, 110, 1188–1194. [Google Scholar] [CrossRef] [PubMed]
- Neter, J.E.; Stam, B.E.; Kok, F.J.; Grobbee, D.E.; Geleijnse, J.M. Influence of weight reduction on blood pressure a meta-analysis of randomized controlled trials. Hypertension 2003, 42, 878–884. [Google Scholar] [CrossRef] [PubMed]
- Allender, P.S.; Cutler, J.A.; Follmann, D.; Cappuccio, F.P.; Pryer, J.; Elliott, P. Dietary calcium and blood pressure: A meta-analysis of randomized clinical trials. Ann. Intern. Med. 1996, 124, 825–831. [Google Scholar] [CrossRef] [PubMed]
- Bucher, H.C.; Cook, R.J.; Guyatt, G.H.; Lang, J.D.; Cook, D.J.; Hatala, R.; Hunt, D.L. Effects of dietary calcium supplementation on blood pressure: A meta-analysis of randomized controlled trials. JAMA 1996, 275, 1016–1022. [Google Scholar] [CrossRef] [PubMed]
- Mizushima, S.; Cappuccio, F.P.; Nichols, R.; Elliott, P. Dietary magnesium intake and blood pressure: A qualitative overview of the observational studies. J. Hum. Hypertens. 1998, 12, 447–453. [Google Scholar] [CrossRef] [PubMed]
- Griffith, L.E.; Guyatt, G.H.; Cook, R.J.; Bucher, H.C.; Cook, D.J. The influence of dietary and nondietary calcium supplementation on blood pressure: An updated metaanalysis of randomized controlled trials. Am. J. Hypertens. 1999, 12, 84–92. [Google Scholar] [CrossRef]
- Geleijnse, J.M.; Kok, F.J.; Grobbee, D.E. Blood pressure response to changes in sodium and potassium intake: A metaregression analysis of randomised trials. J. Hum. Hypertens. 2003, 17, 471–480. [Google Scholar] [CrossRef] [PubMed]
- Nakamura, T.; Mizutani, J.; Sasaki, K.; Yamamoto, N.; Takazawa, K. Beneficial potential of casein hydrolysate containing Val-Pro-Pro and Ile-Pro-Pro on central blood pressure and hemodynamic index: A preliminary study. J. Med. Food 2009, 12, 1221–1226. [Google Scholar] [CrossRef] [PubMed]
- Nakamura, T.; Mizutani, J.; Ohki, K.; Yamada, K.; Yamamoto, N.; Takeshi, M.; Takazawa, K. Casein hydrolysate containing Val-Pro-Pro and Ile-Pro-Pro improves central blood pressure and arterial stiffness in hypertensive subjects: A randomized, double-blind, placebo-controlled trial. Atherosclerosis 2011, 219, 298–303. [Google Scholar] [CrossRef] [PubMed]
- Ishida, Y.; Shibata, Y.; Fukuhara, I.; Yano, Y.; Takehara, I.; Kaneko, K. Effect of an excess intake of casein hydrolysate containing Val-Pro-Pro and Ile-Pro-Pro in subjects with normal blood pressure, high-normal blood pressure, or mild hypertension. Biosci. Biotechnol. Biochem. 2011, 75, 427–433. [Google Scholar] [CrossRef] [PubMed]
- Meisel, H.; Schlimme, E. Inhibitors of angiotensinconverting-enzyme derived from bovine casein (casokinins). In β-Casomorphins and Related Peptides: Recent Developments; Wiley-Blackwell: Weinheim, Germany, 1994. [Google Scholar]
- Cadée, J.A.; Chang, C.Y.; Chen, C.W.; Huang, C.N.; Chen, S.L.; Wang, C.K. Bovine casein hydrolysate (C12 peptide) reduces blood pressure in prehypertensive subjects. Am. J. Hypertens. 2007, 20, 1–5. [Google Scholar] [CrossRef] [PubMed]
- Cicero, A.F.G.; Gerocarni, B.; Laghi, L.; Borghi, C. Blood pressure lowering effect of lactotripeptides assumed as functional foods: A meta-analysis of current available clinical trials. J. Hum. Hypertens. 2011, 25, 425–436. [Google Scholar] [CrossRef] [PubMed]
- FitzGerald, R.J.; Meisel, H. Lactokinins: Whey protein-derived ACE inhibitory peptides. Food/Nahrung 1999, 43, 165–167. [Google Scholar] [CrossRef]
- Maes, W.; van Camp, J.; Vermeirssen, V.; Hemeryck, M.; Ketelslegers, J.M.; Schrezenmeir, J.; Oostveldt, P.V.; Huyghebaert, A. Influence of the lactokinin Ala-Leu-Pro-Met-His-Ile-Arg (ALPMHIR) on the release of endothelin-1 by endothelial cells. Reg. Peptides 2004, 118, 105. [Google Scholar] [CrossRef] [PubMed]
- Alonso, A.; Nettleton, J.A.; Ix, J.H.; de Boer, I.H.; Folsom, A.R.; Bidulescu, A.; Kestenbaum, B.R.; Chambless, L.E.; Jacobs, D.R., Jr. Dietary phosphorus, blood pressure, and incidence of hypertension in the atherosclerosis risk in communities study and the multi-ethnic study of atherosclerosis. Hypertension 2010, 55, 776–784. [Google Scholar] [CrossRef] [PubMed]
- Aune, D.; Lau, R.; Chan, D.S.M.; Vieira, R.; Greenwood, D.C.; Kampman, E.; Norat, T. Dairy products and colorectal cancer risk: A systematic review and meta-analysis of cohort studies. Ann. Oncol. 2012, 23, 37–45. [Google Scholar] [CrossRef] [PubMed]
- Aune, D.; Navarro Rosenblatt, D.A.; Chan, D.S.; Vieira, A.R.; Vieira, R.; Greenwood, D.C.; Vatten, L.J.; Norat, T. Dairy products, calcium, and prostate cancer risk: A systematic review and meta-analysis of cohort studies. Am. J. Clin. Nutr. 2015. [Google Scholar] [CrossRef] [PubMed]
- Dong, J.Y.; Zhang, L.; He, K.; Qin, L.Q. Dairy consumption and risk of breast cancer: A meta-analysis of prospective cohort studies. Breast Cancer Res. Treat. 2011, 127, 23–31. [Google Scholar] [CrossRef] [PubMed]
- Genkinger, J.M.; Wang, M.; Li, R.; Albanes, D.; Anderson, K.E.; Bernstein, L.; van den Brandt, P.A.; English, D.R.; Freudenheim, J.L.; Fuchs, C.S.; et al. Dairy products and pancreatic cancer risk: A pooled analysis of 14 cohort studies. Ann. Oncol. 2014, 25, 1106–1115. [Google Scholar] [CrossRef] [PubMed]
- Liu, J.; Tang, W.; Sang, L.; Dai, X.; Wei, D.; Luo, Y.; Zhang, J. Milk, yogurt, and lactose intake and ovarian cancer risk: A meta-analysis. Nutr. Cancer 2014, 67, 68–72. [Google Scholar] [CrossRef] [PubMed]
- Li, F.; An, S.L.; Zhou, Y.; Liang, Z.K.; Jiao, Z.J.; Jing, Y.M.; Wan, P.; Shi, X.J.; Tan, W.L. Milk and dairy consumption and risk of bladder cancer: A meta-analysis. Urology 2011, 78, 1298–1305. [Google Scholar] [CrossRef] [PubMed]
- Mao, Q.Q.; Dai, Y.; Lin, Y.W.; Qin, J.; Xie, L.P.; Zheng, X.Y. Milk consumption and bladder cancer risk: A meta-analysis of published epidemiological studies. Nutr. Cancer 2011, 63, 1263–1271. [Google Scholar] [CrossRef] [PubMed]
- Gallagher, E.J.; LeRoith, D. Minireview: IGF, insulin, and cancer. Endocrinology 2011, 152, 2546–2551. [Google Scholar] [CrossRef] [PubMed]
- Cohen, D.H.; LeRoith, D. Obesity, type 2 diabetes, and cancer: The insulin and IGF connection. Endocr. Relat. Cancer 2012, 19, F27–F45. [Google Scholar] [CrossRef] [PubMed]
- Qin, L.Q.; He, K.; Xu, J.Y. Milk consumption and circulating insulin-like growth factor-I level: A systematic literature review. Int. J. Food Sci. Nutr. 2009, 60, 330–340. [Google Scholar] [CrossRef] [PubMed]
- Peterlik, M.; Grant, W.B.; Cross, H.S. Calcium, vitamin D and cancer. Anticancer Res. 2009, 29, 3687–3698. [Google Scholar] [PubMed]
- Parodi, P.W. A role for milk proteins and their peptides in cancer prevention. Curr. Pharm. Des. 2007, 13, 813–828. [Google Scholar] [CrossRef] [PubMed]
- Tsuda, H.; Sekine, K.; Ushida, Y.; Kuhara, T.; Takasuka, N.; Iigo, M.; Han, B.S.; Moore, M.A. Milk and dairy products in cancer prevention: Focus on bovine lactoferrin. Mutation Res. 2000, 462, 227–233. [Google Scholar] [CrossRef]
- Lee, K.W.; Lee, H.J.; Cho, H.Y.; Kim, Y.J. Role of the conjugated linoleic acid in the prevention of cancer. Crit. Rev. Food Sci. Nutr. 2005, 45, 135–144. [Google Scholar] [CrossRef] [PubMed]
- Lampe, J.W. Dairy products and cancer. J. Am. Coll. Nutr. 2011, 30, 464S–470S. [Google Scholar] [CrossRef] [PubMed]
- Hu, D.; Huang, J.; Wang, Y.; Zhang, D.; Qu, Y. Dairy foods and risk of stroke: A meta-analysis of prospective cohort studies. Nutr. Metab. Cardiovasc. Dis. 2014, 24, 460–469. [Google Scholar] [CrossRef] [PubMed]
- Strazzullo, P.; D’Elia, L.; Cairella, G.; Garbagnati, F.; Cappuccio, F.P.; Scalfi, L. Excess body weight and incidence of stroke meta-analysis of prospective studies with 2 million participants. Stroke 2010, 41, e418–e426. [Google Scholar] [CrossRef] [PubMed]
- Massey, L.K. Dairy food consumption, blood pressure and stroke. J. Nutr. 2001, 131, 1875–1878. [Google Scholar] [PubMed]
- Caroli, A.; Poli, A.; Ricotta, D.; Banfi, G.; Cocchi, D. Invited review: Dairy intake and bone health: A viewpoint from the state of the art. J. Dairy Sci. 2011, 94, 5249–5262. [Google Scholar] [CrossRef] [PubMed]
- Rizzoli, R. Dairy products, yogurts, and bone health. Am. J. Clin. Nutr. 2014, 99, 1256S–1262S. [Google Scholar] [CrossRef] [PubMed]
- Hedrick, V.E.; Dietrich, A.M.; Estabrooks, P.A.; Savla, J.; Serrano, E.; Davy, B.M. Dietary biomarkers: Advances, limitations and future directions. Nutr. J. 2012, 11, 109. [Google Scholar] [CrossRef] [PubMed]
- Strimbu, K.; Tavel, J.A. What are biomarkers? Curr. Opin. HIV/AIDS 2010, 5, 463–466. [Google Scholar] [CrossRef] [PubMed]
- Wolk, A.; Vessby, B.; Ljung, H.; Barrefors, P. Evaluation of a biological marker of dairy fat intake. Am. J. Clin. Nutr. 1998, 68, 291–295. [Google Scholar] [PubMed]
- Smedman, A.E.; Gustafsson, I.B.; Berglund, L.G.; Vessby, B.O. Pentadecanoic acid in serum as a marker for intake of milk fat: Relations between intake of milk fat and metabolic risk factors. Am. J. Clin. Nutr. 1999, 69, 22–29. [Google Scholar] [PubMed]
- Wolk, A.; Furuheim, M.; Vessby, B. Fatty acid composition of adipose tissue and serum lipids are valid biological markers of dairy fat intake in men. J. Nutr. 2001, 131, 828–833. [Google Scholar] [PubMed]
- Brevik, A.; Veierod, M.B.; Drevon, C.A.; Andersen, L.F. Evaluation of the odd fatty acids 15:0 and 17:0 in serum and adipose tissue as markers of intake of milk and dairy fat. Eur. J. Clin. Nutr. 2005, 59, 1417–1422. [Google Scholar] [CrossRef] [PubMed]
- Biong, A.S.; Berstad, P.; Pedersen, J.I. Biomarkers for intake of dairy fat and dairy products. Eur. J. Lipid Sci. Technol. 2006, 108, 827–834. [Google Scholar] [CrossRef]
- Sun, Q.; Ma, J.; Campos, H.; Hu, F.B. Plasma and erythrocyte biomarkers of dairy fat intake and risk of ischemic heart disease. Am. J. Clin. Nutr. 2007, 86, 929–937. [Google Scholar] [PubMed]
- Warensjö, E.; Jansson, J.H.; Cederholm, T.; Boman, K.; Eliasson, M.; Hallmans, G.; Johansson, I.; Sjögren, P. Biomarkers of milk fat and the risk of myocardial infarction in men and women: A prospective, matched case-control study. Am. J. Clin. Nutr. 2010, 92, 194–202. [Google Scholar] [CrossRef] [PubMed]
- Aslibekyan, S.; Campos, H.; Baylin, A. Biomarkers of dairy intake and the risk of heart disease. Nutr. Metab. Cardiovasc. Dis. 2012, 22, 1039–1045. [Google Scholar] [CrossRef] [PubMed]
- de Oliveira Otto, M.C.; Nettleton, J.A.; Lemaitre, R.N.; M. Steffen, L.; Kromhout, D.; Rich, S.S.; Tsai, M.Y.; Jacobs, D.R.; Mozaffarian, D. Biomarkers of dairy fatty acids and risk of cardiovascular disease in the multi-ethnic study of atherosclerosis. J. Am. Heart Assoc. 2013, 2, e000092. [Google Scholar] [CrossRef] [PubMed]
- Santaren, I.D.; Watkins, S.M.; Liese, A.D.; Wagenknecht, L.E.; Rewers, M.J.; Haffner, S.M.; Lorenzo, C.; Hanley, A.J. Serum pentadecanoic acid (15:0), a short-term marker of dairy food intake, is inversely associated with incident type 2 diabetes and its underlying disorders. Am. J. Clin. Nutr. 2014, 100, 1532–1540. [Google Scholar] [CrossRef] [PubMed]
- Yakoob, M.Y.; Shi, P.; Hu, F.B.; Campos, H.; Rexrode, K.M.; Orav, E.J.; Willett, W.C.; Mozaffarian, D. Circulating biomarkers of dairy fat and risk of incident stroke in U.S. men and women in 2 large prospective cohorts. Am. J. Clin. Nutr. 2014, 100, 1437–1447. [Google Scholar] [CrossRef] [PubMed]
- Ratnayake, W.N. Concerns about the use of 15:0, 17:0, and trans-16:1n-7 as biomarkers of dairy fat intake in recent observational studies that suggest beneficial effects of dairy food on incidence of diabetes and stroke. Am. J. Clin. Nutr. 2015, 101, 1102–1103. [Google Scholar] [CrossRef] [PubMed]
- Lankinen, M.; Schwab, U. Biomarkers of dairy fat. Am. J. Clin. Nutr. 2015, 101, 1101–1102. [Google Scholar] [CrossRef] [PubMed]
- Tholstrup, T.; Høy, C.E.; Andersen, L.N.; Christensen, R.D.K.; Sandström, B. Does fat in milk, butter and cheese affect blood lipids and cholesterol differently? J. Am. Coll. Nutr. 2004, 23, 169–176. [Google Scholar] [CrossRef] [PubMed]
- Hjerpsted, J.; Leedo, E.; Tholstrup, T. Cheese intake in large amounts lowers LDL-cholesterol concentrations compared with butter intake of equal fat content. Am. J. Clin. Nutr. 2011, 94, 1479–1484. [Google Scholar] [CrossRef] [PubMed]
- Gibney, M.J.; Walsh, M.; Brennan, L.; Roche, H.M.; German, B.; van Ommen, B. Metabolomics in human nutrition: Opportunities and challenges. Am. J. Clin. Nutr. 2005, 82, 497–503. [Google Scholar] [PubMed]
- Zheng, H.; Yde, C.C.; Arnberg, K.; Mølgaard, C.; Michaelsen, K.F.; Larnkjær, A.; Bertram, H.C. NMR-based metabolomic profiling of overweight adolescents: An elucidation of the effects of inter-/intraindividual differences, gender, and pubertal development. BioMed. Res. Int. 2014. [Google Scholar] [CrossRef] [PubMed]
- PubMed. Available online: http://www.ncbi.nlm.nih.gov-pubmed (accessed on 7 May 2015).
- EMBASE. Available online: http://www.embase.com (accessed on 7 May 2015).
- SCOPUS. Available online: http://www.scopus.com (accessed on 7 May 2015).
- Guertin, K.A.; Moore, S.C.; Sampson, J.N.; Huang, W.Y.; Xiao, Q.; Stolzenberg-Solomon, R.Z.; Sinha, R.; Cross, A.J. Metabolomics in nutritional epidemiology: Identifying metabolites associated with diet and quantifying their potential to uncover diet-disease relations in populations. Am. J. Clin. Nutr. 2014. [Google Scholar] [CrossRef] [PubMed]
- Bertram, H.C.; Hoppe, C.; Petersen, B.O.; Duus, J.Ø.; Mølgaard, C.; Michaelsen, K.F. An NMR-based metabonomic investigation on effects of milk and meat protein diets given to 8-year-old boys. Br. J. Nutr. 2007, 97, 758–763. [Google Scholar] [CrossRef] [PubMed]
- Pedersen, S.M.; Nielsen, N.C.; Andersen, H.J.; Olsson, J.; Simrén, M.; Öhman, L.; Svensson, U.; Malmendal, A.; Bertram, H.C. The serum metabolite response to diet intervention with probiotic acidified milk in irritable bowel syndrome patients is indistinguishable from that of non-probiotic acidified milk by 1H NMR-based metabonomic analysis. Nutrients 2010, 2, 1141–1155. [Google Scholar] [CrossRef] [PubMed]
- Pedersen, S.M.M.; Nebel, C.; Nielsen, N.C.; Andersen, H.J.; Olsson, J.; Simrén, M.; Öhman, L.; Svensson, U.; Bertram, H.C.; Malmendal, A. A GC-MS-based metabonomic investigation of blood serum from irritable bowel syndrome patients undergoing intervention with acidified milk products. Eur. Food Res. Technol. 2011, 233, 1013–1021. [Google Scholar] [CrossRef]
- Zheng, H.; Yde, C.C.; Dalsgaard, T.K.; Arnberg, K.; Mølgaard, C.; Michaelsen, K.; Larnkjær, A.; Bertram, H.C. Nuclear magnetic resonance-based metabolomics reveals that dairy protein fractions affect urinary urea excretion differently in overweight adolescents. Eur. Food Res. Technol. 2015, 240, 489–497. [Google Scholar] [CrossRef]
- Piccolo, B.D.; Comerford, K.B.; Karakas, S.E.; Knotts, T.A.; Fiehn, O.; Adams, S.H. Whey protein supplementation does not alter plasma branched-chained amino acid profiles but results in unique metabolomics patterns in obese women enrolled in an 8-week weight loss trial. J. Nutr. 2015, 145, 691–700. [Google Scholar] [CrossRef] [PubMed]
- Zheng, H.; Lorenzen, J.K.; Astrup, A.; Larsen, L.H.; Yde, C.C.; Clausen, M.R.; Bertram, H.C.; Aarhus University, Aarslev, Denmark. Unpublished work. 2015.
- Hjerpsted, J.; Ritz, C.; Schou, S.; Tholstrup, T.; Dragsted, L. Effect of cheese and butter intake on metabolites in urine using an untargeted metabolomics approach. Metabolomics 2014, 10, 1176–1185. [Google Scholar] [CrossRef]
- Zheng, H.; Yde, C.C.; Clausen, M.R.; Kristensen, M.; Lorenzen, J.; Astrup, A.; Bertram, H.C. Metabolomics investigation to shed light on cheese as a possible piece in the French paradox puzzle. J. Agric. Food Chem. 2015, 63, 2830–2839. [Google Scholar] [CrossRef] [PubMed]
- Yde, C.C.; Ditlev, D.B.; Reitelseder, S.; Bertram, H.C. Metabonomic response to milk proteins after a single bout of heavy resistance exercise elucidated by 1H nuclear magnetic resonance spectroscopy. Metabolites 2013, 3, 33–46. [Google Scholar] [CrossRef] [PubMed]
- Stanstrup, J.; Rasmussen, J.; Ritz, C.; Holmer-Jensen, J.; Hermansen, K.; Dragsted, L. Intakes of whey protein hydrolysate and whole whey proteins are discriminated by LC-MS metabolomics. Metabolomics 2014, 10, 719–736. [Google Scholar] [CrossRef]
- Stanstrup, J.; Schou, S.S.; Holmer-Jensen, J.; Hermansen, K.; Dragsted, L.O. Whey protein delays gastric emptying and suppresses plasma fatty acids and their metabolites compared to casein, gluten, and fish protein. J. Proteome Res. 2014, 13, 2396–2408. [Google Scholar] [CrossRef] [PubMed]
© 2015 by the authors; licensee MDPI, Basel, Switzerland. This article is an open access article distributed under the terms and conditions of the Creative Commons Attribution license (http://creativecommons.org/licenses/by/4.0/).
Share and Cite
Zheng, H.; Clausen, M.R.; Dalsgaard, T.K.; Bertram, H.C. Metabolomics to Explore Impact of Dairy Intake. Nutrients 2015, 7, 4875-4896. https://doi.org/10.3390/nu7064875
Zheng H, Clausen MR, Dalsgaard TK, Bertram HC. Metabolomics to Explore Impact of Dairy Intake. Nutrients. 2015; 7(6):4875-4896. https://doi.org/10.3390/nu7064875
Chicago/Turabian StyleZheng, Hong, Morten R. Clausen, Trine K. Dalsgaard, and Hanne C. Bertram. 2015. "Metabolomics to Explore Impact of Dairy Intake" Nutrients 7, no. 6: 4875-4896. https://doi.org/10.3390/nu7064875