Associations between Orosensory Perception of Oleic Acid, the Common Single Nucleotide Polymorphisms (rs1761667 and rs1527483) in the CD36 Gene, and 6-n-Propylthiouracil (PROP) Tasting


Abstract
:1. Introduction
2. Experimental Section
2.1. Subjects
2.2. Study Design
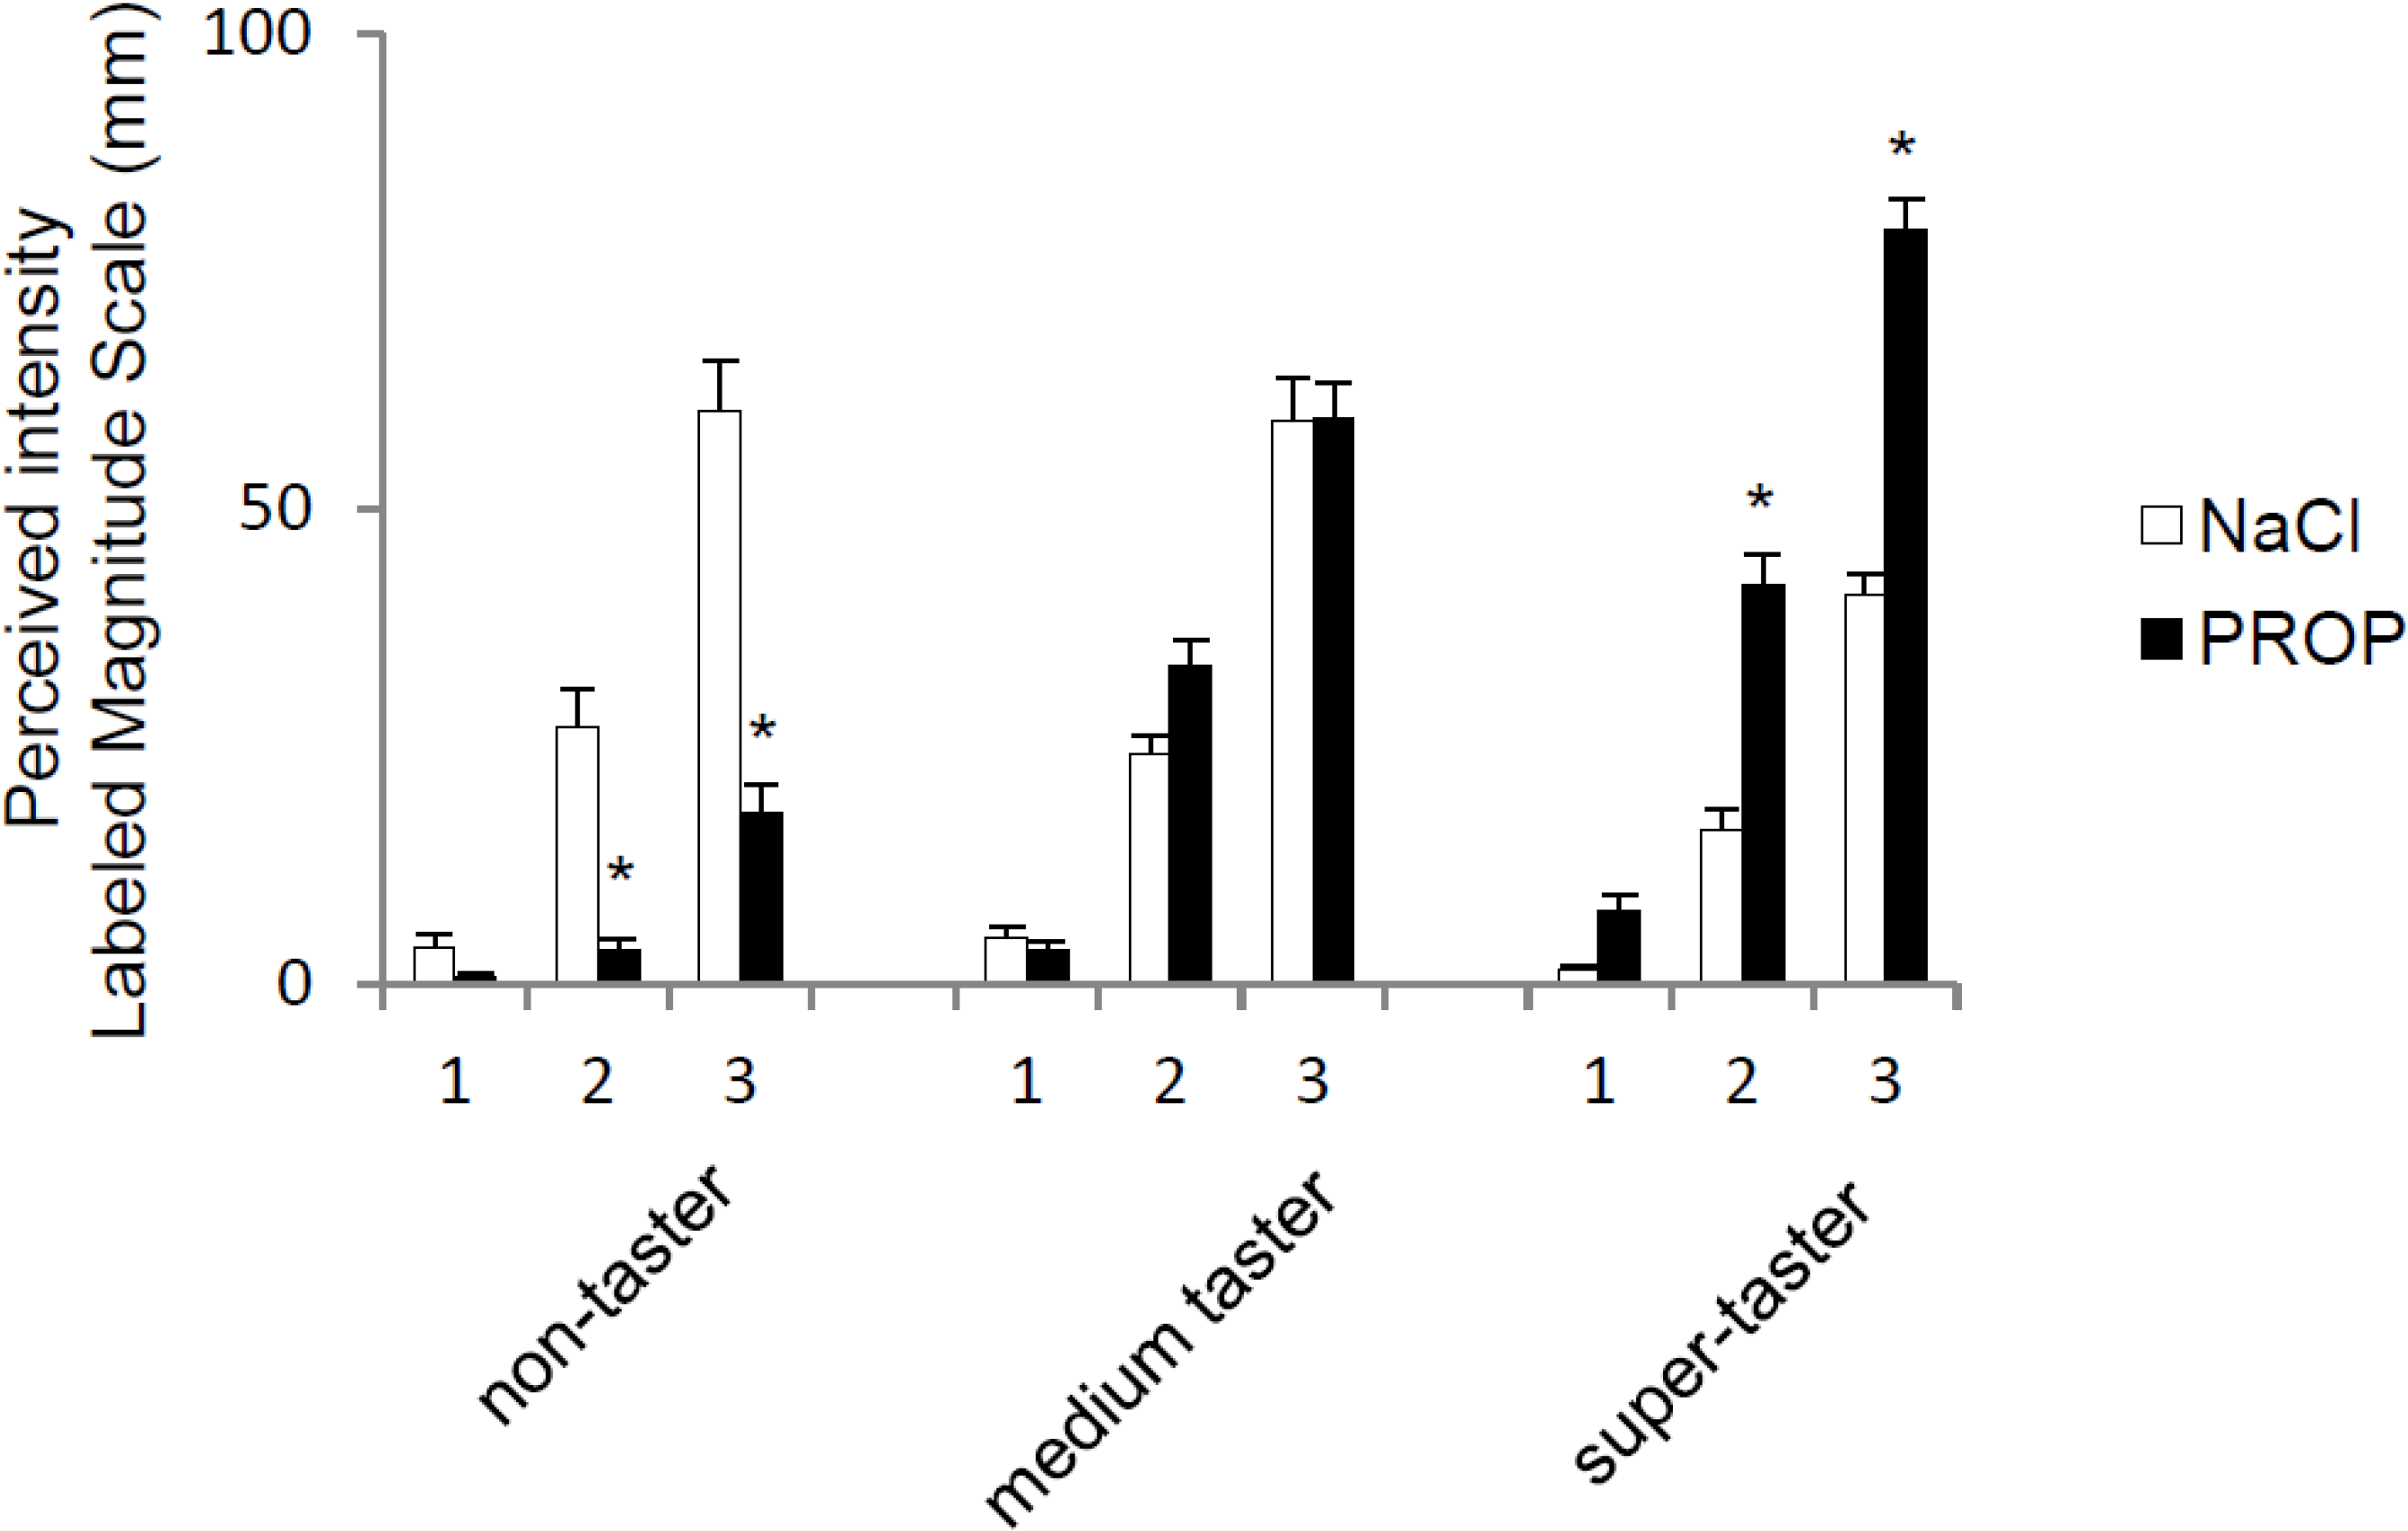
2.3. PROP Taster Status
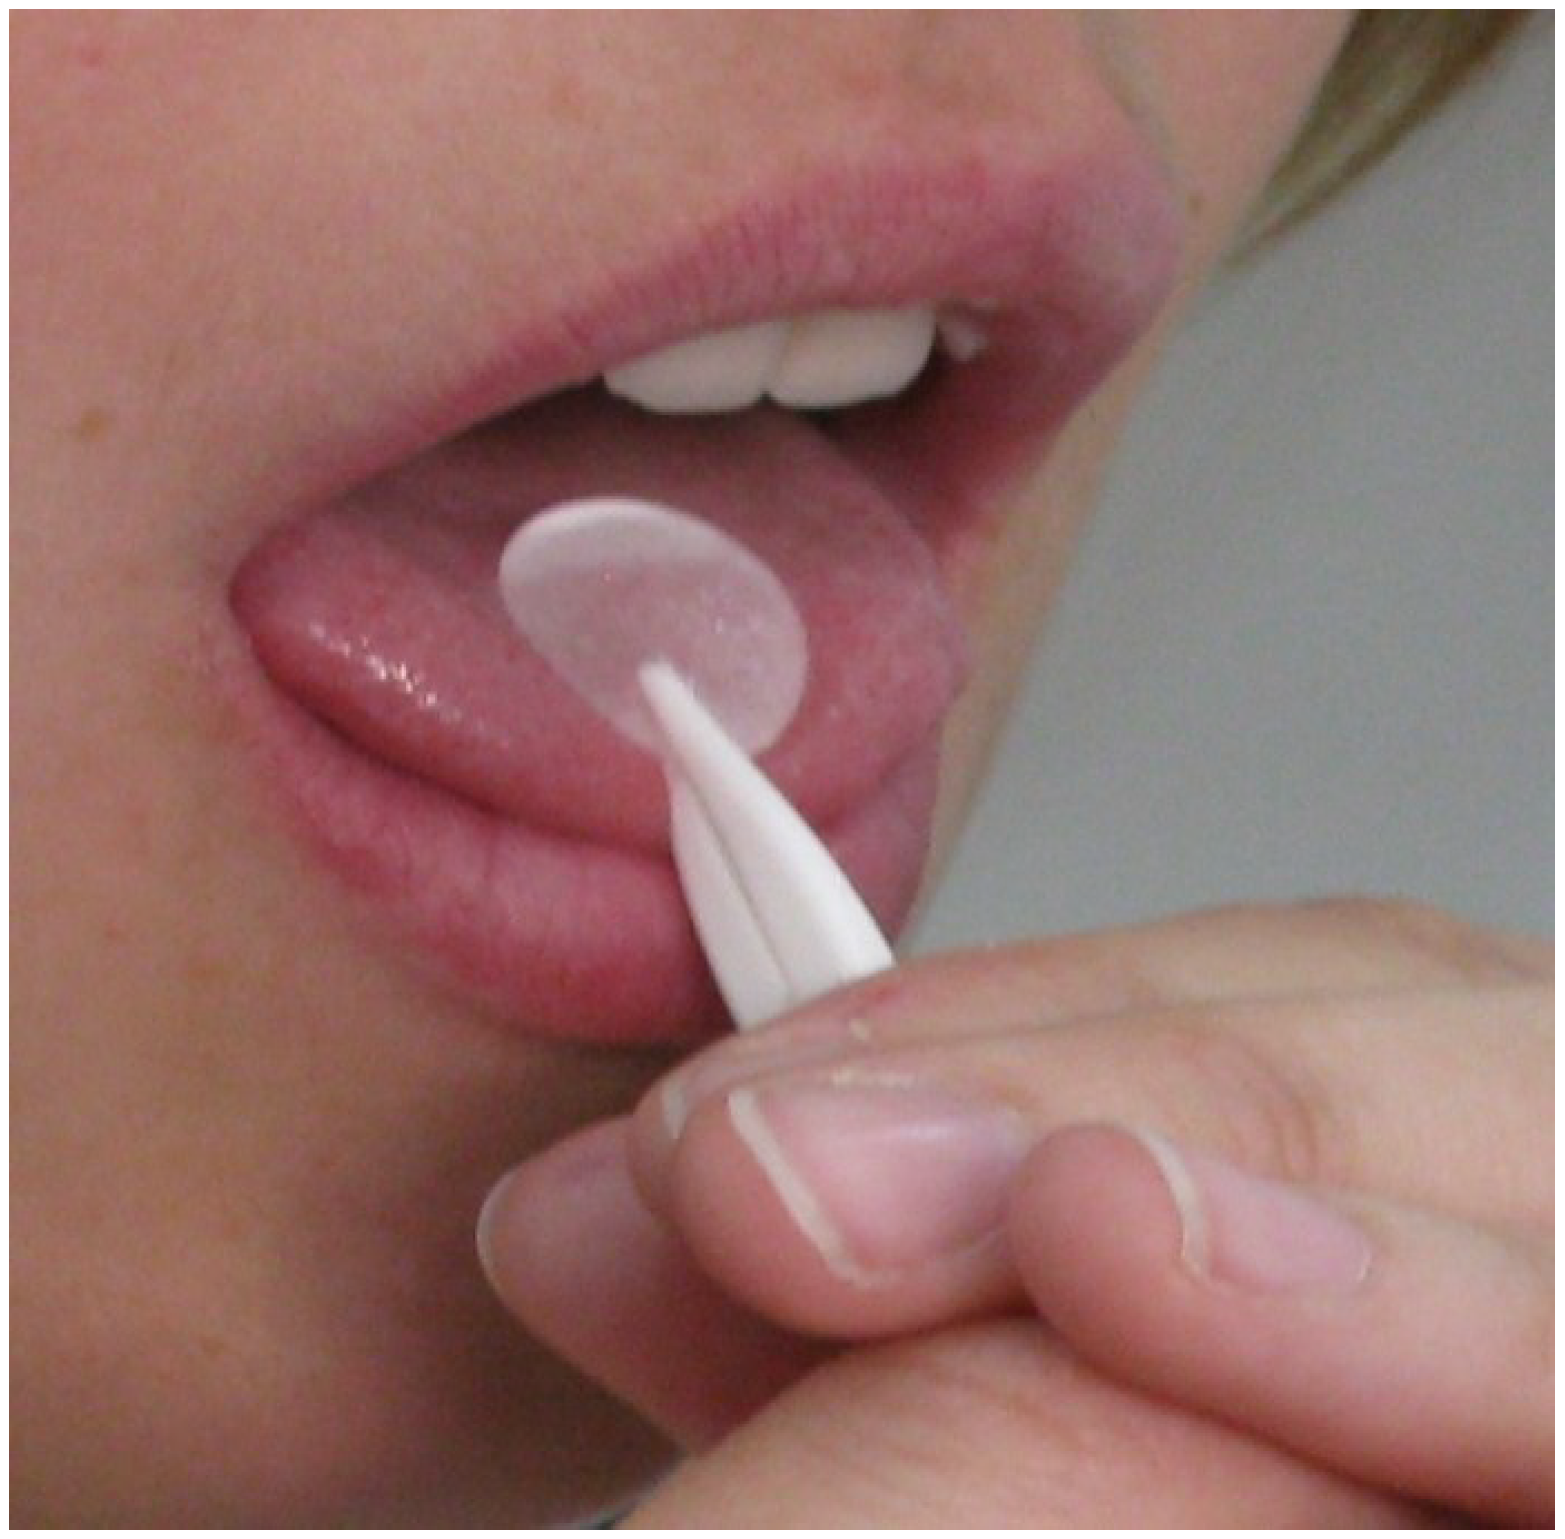
2.4. Oleic Acid Threshold Assessments
2.5. Molecular Analyses
2.6. Data Analyses
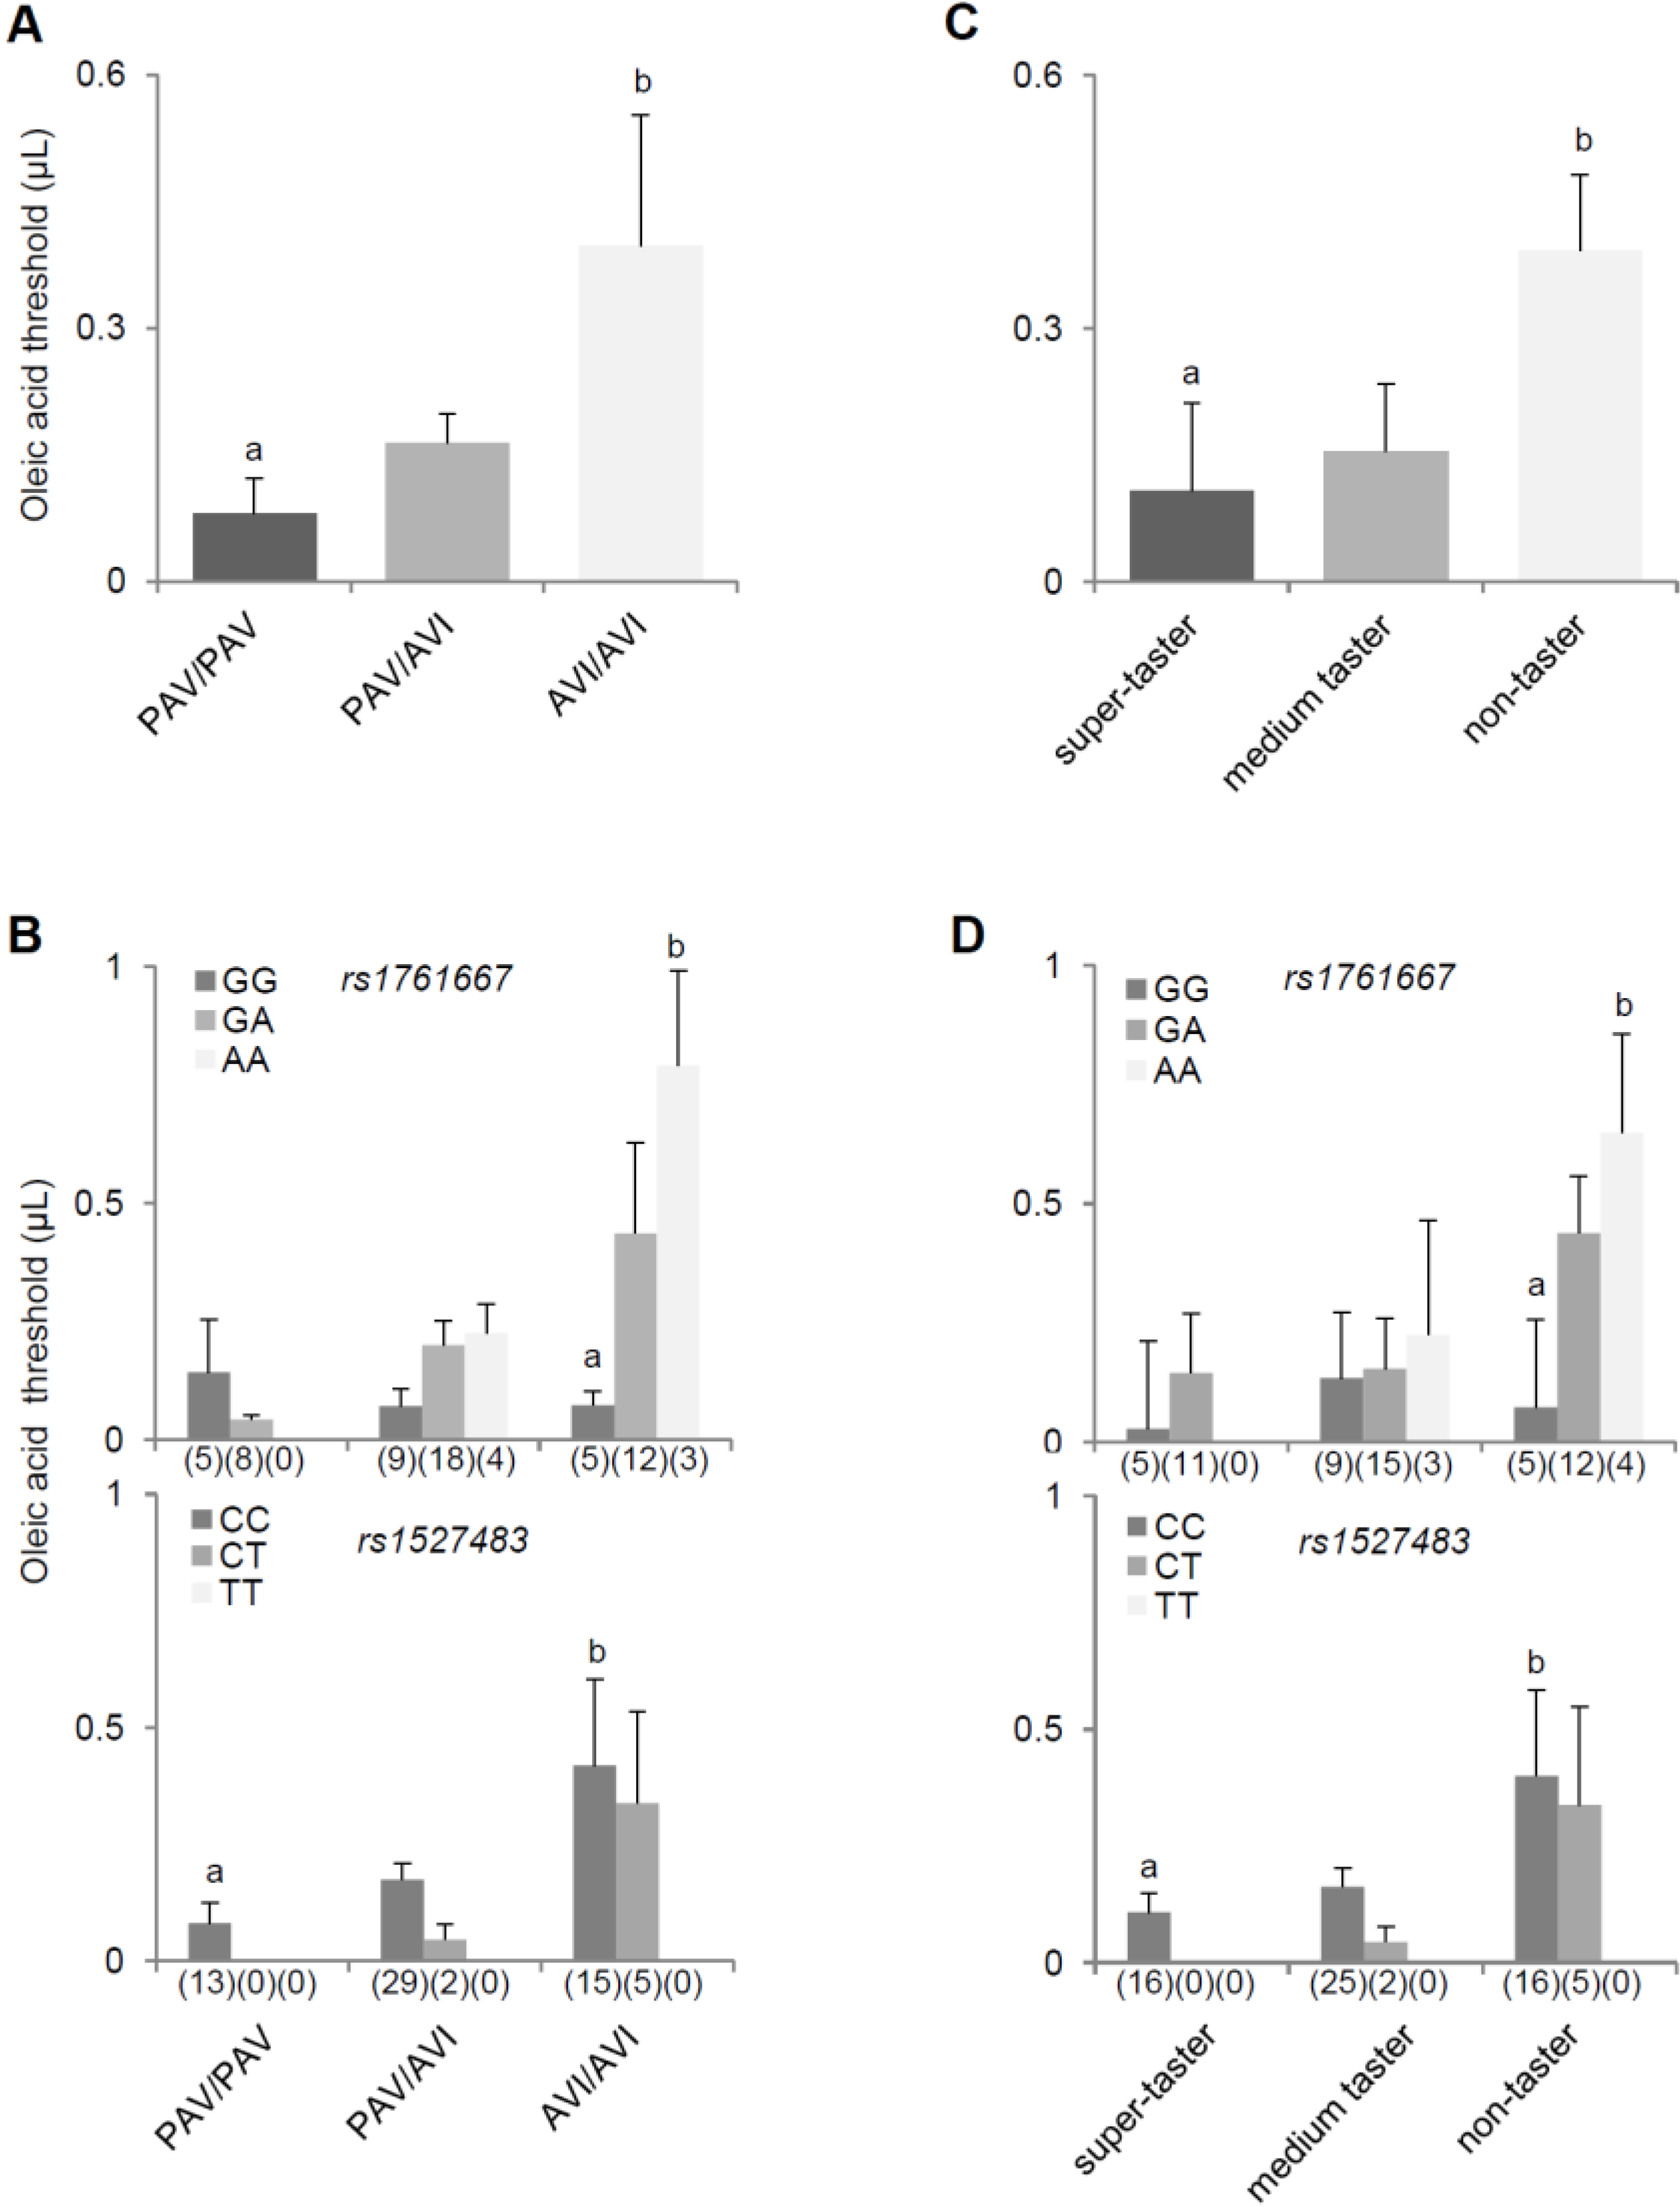
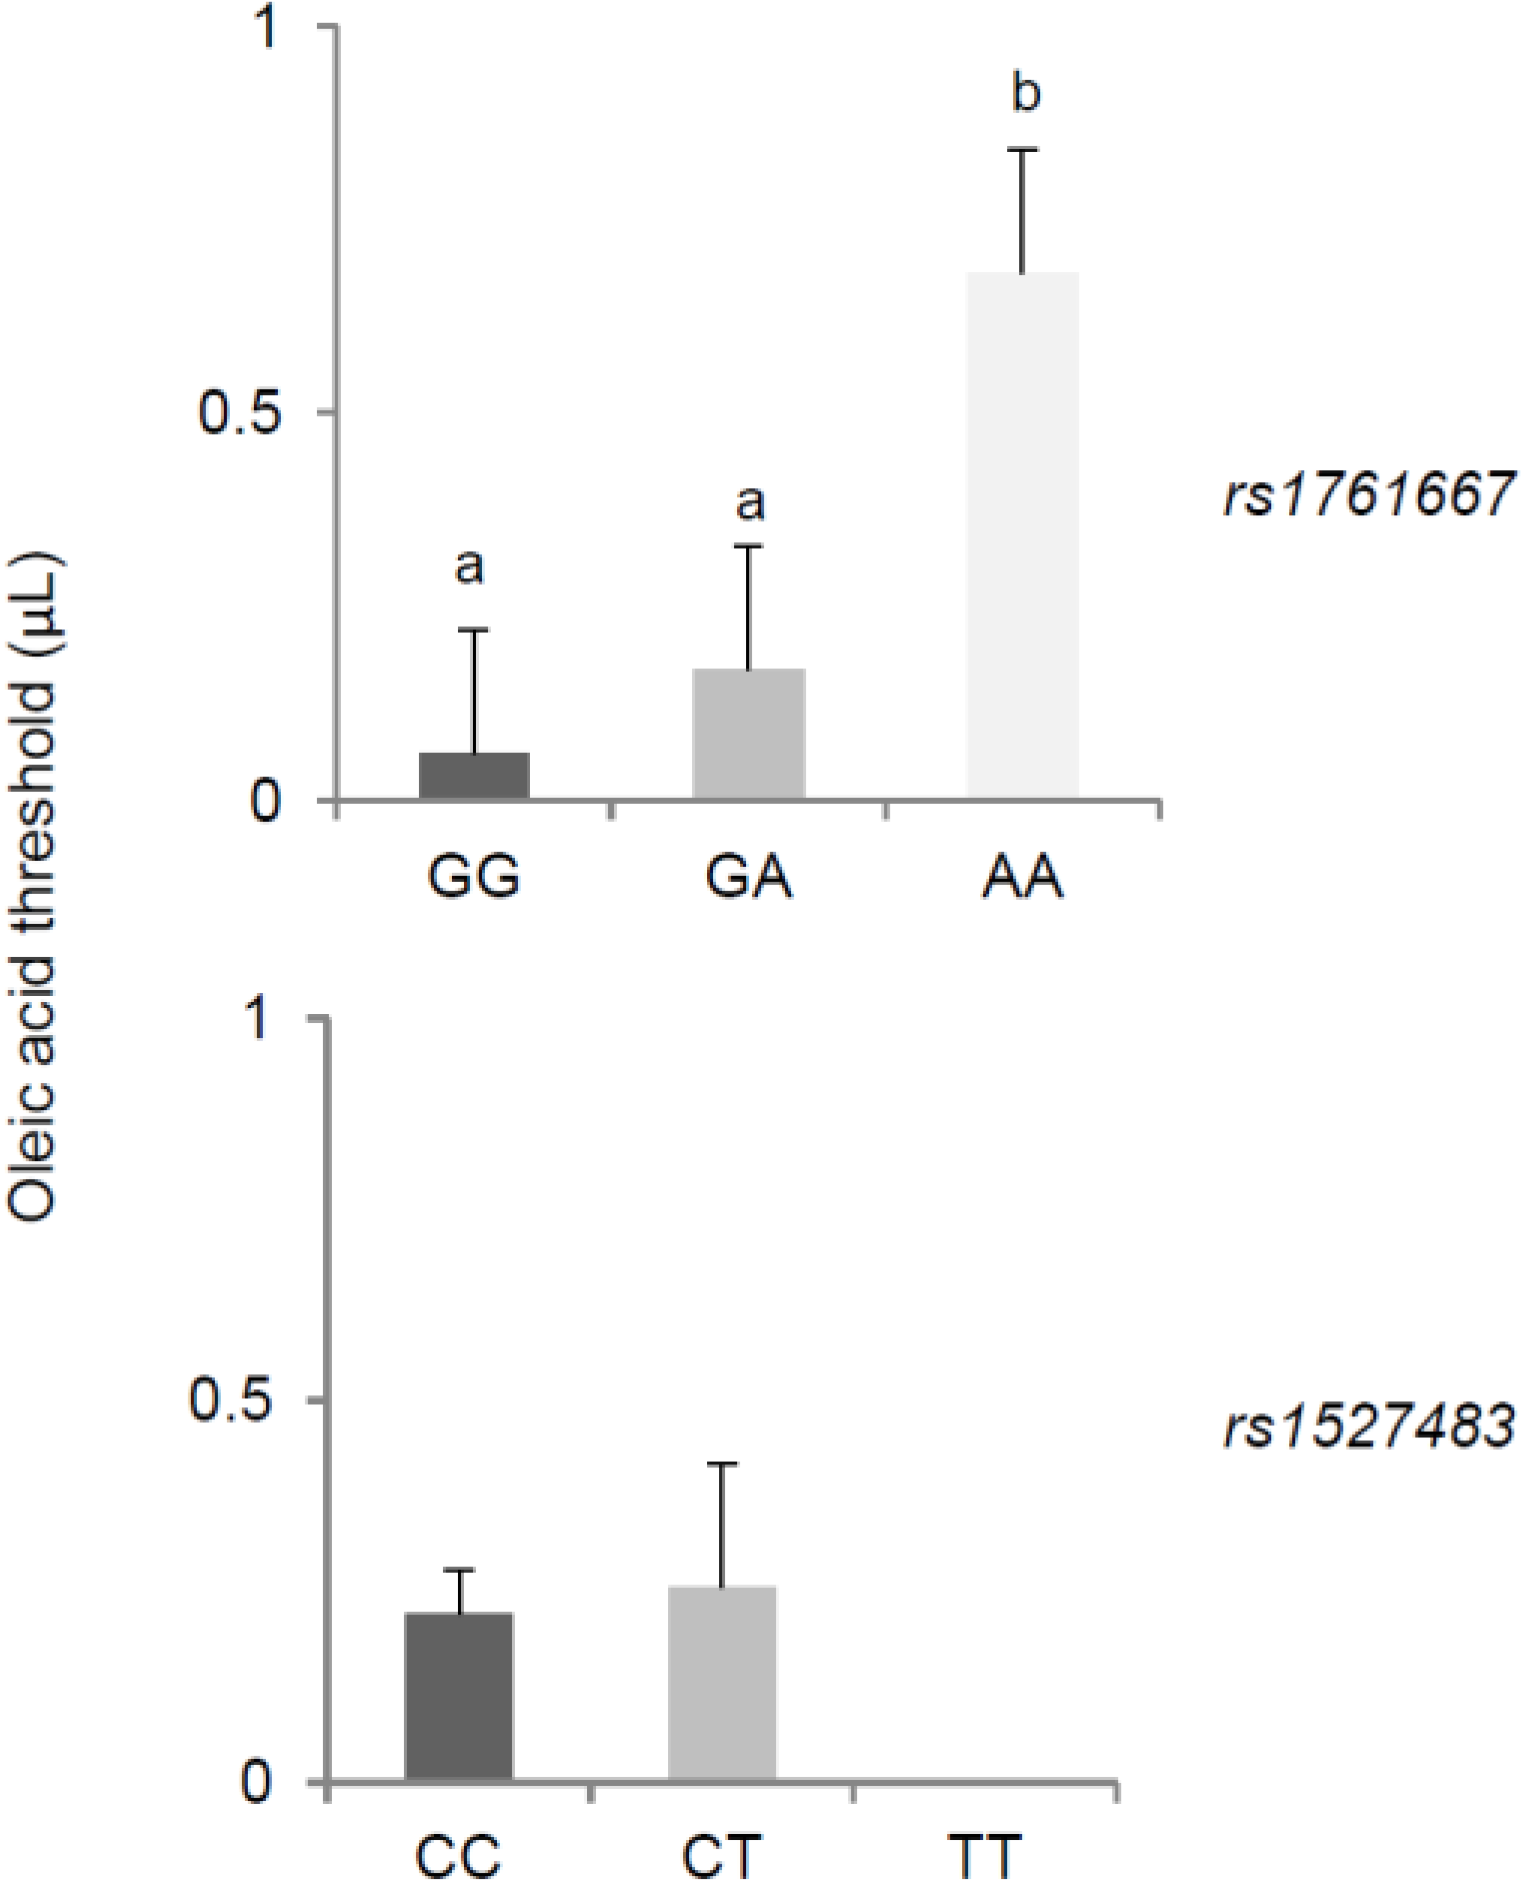
3. Results


| Total | PROP Status | p-Value * | |||||||
|---|---|---|---|---|---|---|---|---|---|
| Super-Taster | Medium Taster | Non-Taster | |||||||
| n | % | n | % | n | % | n | % | ||
| rs1761667 | |||||||||
| Genotype | |||||||||
| GG | 19 | 29.69 | 5 | 31.25 | 9 | 33.33 | 5 | 28.80 | 0.425 |
| AG | 38 | 59.37 | 11 | 68.75 | 15 | 55.56 | 12 | 57.15 | |
| AA | 7 | 10.94 | 0 | 0 | 3 | 11.11 | 4 | 19.05 | |
| Allele | |||||||||
| G | 76 | 59.37 | 21 | 65.62 | 33 | 61.12 | 22 | 52.38 | 0.507 |
| A | 52 | 40.63 | 11 | 35.38 | 21 | 38.88 | 20 | 47.62 | |
| rs1527483 | |||||||||
| Genotype | |||||||||
| CC | 57 | 89.06 | 16 | 100 | 25 | 92.59 | 16 | 76.19 | 0.061 |
| CT | 7 | 10.94 | 0 | 0 | 2 | 7.41 | 5 | 23.81 | |
| TT | 0 | 0 | 0 | 0 | 0 | 0 | 0 | 0 | |
| Allele | |||||||||
| C | 121 | 94.53 | 32 | 100 | 52 | 96.30 | 37 | 88.09 | 0.072 |
| T | 7 | 5.47 | 0 | 0 | 2 | 3.70 | 5 | 11.91 | |

4. Discussion
5. Conclusions
Acknowledgments
Author Contributions
Conflicts of Interest
References
- Smit, L.A.; Mozaffarian, D.; Willett, W. Review of fat and fatty acid requirements and criteria for developing dietary guidelines. Ann. Nutr. Metab. 2009, 55, 44–55. [Google Scholar] [CrossRef] [PubMed]
- Ebba, S.; Abarintos, R.A.; Kim, D.G.; Tiyouh, M.; Stull, J.C.; Movalia, A.; Smutzer, G. The examination of fatty acid taste with edible strips. Physiol. Behav. 2012, 106, 579–586. [Google Scholar] [CrossRef] [PubMed]
- Mattes, R.D. Is there a fatty acid taste? Annu. Rev. Nutr. 2009, 29, 305–327. [Google Scholar] [CrossRef] [PubMed]
- Mattes, R.D. Fat Taste in Humans: Is It a Primary? In Fat Detection: Taste, Texture, and Post Ingestive Effects; Montmayeur, J.P., le Coutre, J., Eds.; CRC Press: Boca Raton, FL, USA, 2010; pp. 167–193. [Google Scholar]
- Pepino, M.Y.; Love-Gregory, L.; Klein, S.; Abumrad, N.A. The fatty acid translocase gene CD36 and lingual lipase influence oral sensitivity to fat in obese subjects. J. Lipid Res. 2012, 53, 561–566. [Google Scholar] [CrossRef] [PubMed]
- Chalé-Rush, A.; Burgess, J.R.; Mattes, R.D. Multiple routes of chemosensitivity to free fatty acids in humans. Am. J. Physiol. Gastrointest. Liver Physiol. 2007, 292, G1206–G1212. [Google Scholar] [CrossRef] [PubMed]
- Fukuwatari, T.; Shibata, K.; Iguchi, K.; Saeki, T.; Iwata, A.; Tani, K.; Sugimoto, E.; Fushiki, T. Role of gustation in the recognition of oleate and triolein in anosmic rats. Physiol. Behav. 2003, 78, 579–583. [Google Scholar] [CrossRef] [PubMed]
- Smith, J.C.; Fisher, E.M.; Maleszewski, V.; McClain, B. Orosensory factors in the ingestion of corn oil/sucrose mixtures by the rat. Physiol. Behav. 2000, 69, 135–146. [Google Scholar] [CrossRef] [PubMed]
- Kawai, T.; Fushiki, T. Importance of lipolysis in oral cavity for orosensory detection of fat. Am. J. Physiol. Regul. Integr. Comp. Physiol. 2003, 285, R447–R454. [Google Scholar] [CrossRef] [PubMed]
- Cartoni, C.; Yasumatsu, K.; Ohkuri, T.; Shigemura, N.; Yoshida, R.; Godinot, N.; le Coutre, J.; Ninomiya, Y.; Damak, S. Taste Preference for Fatty Acids Is Mediated by GPR40 and GPR120. J. Neurosci. 2010, 30, 8376–8382. [Google Scholar] [CrossRef] [PubMed]
- Khan, N.A.; Besnard, P. Oro-sensory perception of dietary lipids: New insights into the fat taste transduction. Biochim. Biophys. Acta 2009, 1791, 149–155. [Google Scholar] [CrossRef] [PubMed]
- Martin, C.; Chevrot, M.; Poirier, H.; Passilly-Degrace, P.; Niot, I.; Besnard, P. CD36 as a lipid sensor. Physiol. Behav. 2011, 105, 36–42. [Google Scholar] [CrossRef] [PubMed]
- Laugerette, F.; Passilly-Degrace, P.; Patris, B.; Niot, I.; Febbraio, M.; Montmayeur, J.P.; Besnard, P. CD36 involvement in orosensory detection of dietary lipids, spontaneous fat preference, and digestive secretions. J. Clin. Investig. 2005, 115, 3177–3184. [Google Scholar] [CrossRef] [PubMed]
- Ibrahimi, A.; Abumrad, N.A. Role of CD36 in membrane transport of long-chain fatty acids. Curr. Opin. Clin. Nutr. Metab. Care 2002, 5, 139–145. [Google Scholar] [CrossRef] [PubMed]
- Gaillard, D.; Laugerette, F.; Darcel, N.; el-Yassimi, A.; Passilly-Degrace, P.; Hichami, A.; Khan, N.A.; Montmayeur, J.P.; Besnard, P. The gustatory pathway is involved in CD36-mediated orosensory perception of long-chain fatty acids in the mouse. FASEB J. 2008, 22, 1458–1468. [Google Scholar] [CrossRef] [PubMed]
- El-Yassimi, A.; Hichami, A.; Besnard, P.; Khan, N.A. Linoleic acid induces calcium signaling, Src kinase phosphorylation, and neurotransmitter release in mouse CD36-positive gustatory cells. J. Biol. Chem 2008, 283, 12949–12959. [Google Scholar] [CrossRef] [PubMed]
- Ozdener, M.H.; Subramaniam, S.; Sundaresan, S.; Sery, O.; Hashimoto, T.; Asakawa, Y.; Besnard, P.; Abumrad, N.A.; Khan, N.A. CD36- and GPR120-mediated Ca2+ signaling in human taste bud cells mediates differential responses to fatty acids and is altered in obese mice. Gastroenterology 2014, 146, 995–1005. [Google Scholar] [CrossRef] [PubMed]
- Keller, K.L.; Liang, L.C.; Sakimura, J.; May, D.; van Belle, C.; Breen, C.; Driggin, E.; Tepper, B.J.; Lanzano, P.C.; Deng, L.; et al. Common variants in the CD36 gene are associated with oral fat perception, fat preferences, and obesity in African Americans. Obesity (Silver Spring) 2012, 20, 1066–1073. [Google Scholar] [CrossRef]
- Stewart, J.E.; Feinle-Bisset, C.; Golding, M.; Delahunty, C.; Clifton, P.M.; Keast, R.S. Oral sensitivity to fatty acids, food consumption and BMI in human subjects. Br. J. Nutr. 2010, 104, 145–152. [Google Scholar] [CrossRef] [PubMed]
- Mattes, R.D. Oral detection of short-, medium-, and long-chain free fatty acids in humans. Chem. Senses 2009, 34, 145–150. [Google Scholar] [CrossRef] [PubMed]
- Martin, C.; Passilly-Degrace, P.; Gaillard, D.; Merlin, J.F.; Chevrot, M.; Besnard, P. The lipid-sensor candidates CD36 and GPR120 are differentially regulated by dietary lipids in mouse taste buds: Impact on spontaneous fat preference. PLoS One 2011, 6, e24014. [Google Scholar] [CrossRef] [PubMed]
- Ma, X.; Bacci, S.; Mlynarski, W.; Gottardo, L.; Soccio, T.; Menzaghi, C.; Iori, E.; Lager, R.A.; Shroff, A.R.; Gervino, E.V.; et al. A common haplotype at the CD36 locus is associated with high free fatty acid levels and increased cardiovascular risk in Caucasians. Hum. Mol. Genet. 2004, 13, 2197–2205. [Google Scholar] [CrossRef] [PubMed]
- Madden, J.; Carrero, J.J.; Brunner, A.; Dastur, N.; Shearman, C.P.; Calder, P.C.; Grimble, R.F. Polymorphisms in the CD36 gene modulate the ability of fish oil supplements to lower fasting plasma triacyl glycerol and raise HDL cholesterol concentrations in healthy middle-aged men. Prostaglandins Leukot. Essent. Fat. Acids 2008, 78, 327–335. [Google Scholar] [CrossRef]
- Mounayar, R.; Morzel, M.; Brignot, H.; Tremblay-Franco, M.; Canlet, C.; Lucchi, G.; Ducoroy, P.; Feron, G.; Neyraud, E. Salivary markers of taste sensitivity to oleic acid: A combined proteomics and metabolomics approach. Metabolomics 2014, 10, 688–696. [Google Scholar] [CrossRef]
- Tepper, B.J. Nutritional implications of genetic taste variation: The role of PROP sensitivity and other taste phenotypes. Annu. Rev. Nutr. 2008, 28, 367–388. [Google Scholar] [CrossRef] [PubMed]
- Kim, U.K.; Jorgenson, E.; Coon, H.; Leppert, M.; Risch, N.; Drayna, D. Positional cloning of the human quantitative trait locus underlying taste sensitivity to phenylthiocarbamide. Science 2003, 299, 1221–1225. [Google Scholar] [CrossRef] [PubMed]
- Cabras, T.; Melis, M.; Castagnola, M.; Padiglia, A.; Tepper, B.J.; Messana, I.; Tomassini Barbarossa, I. Responsiveness to 6-n-propylthiouracil (PROP) is associated with salivary levels of two specific basic proline-rich proteins in humans. PLoS One 2012, 7, e30962. [Google Scholar] [CrossRef] [PubMed] [Green Version]
- Melis, M.; Aragoni, M.C.; Arca, M.; Cabras, T.; Caltagirone, C.; Castagnola, M.; Crnjar, R.; Messana, I.; Tepper, B.J.; Barbarossa, I.T.; et al. Marked increase in PROP taste responsiveness following oral supplementation with selected salivary proteins or their related free amino acids. PLoS One 2013, 8, e59810. [Google Scholar] [CrossRef] [PubMed] [Green Version]
- Melis, M.; Atzori, E.; Cabras, S.; Zonza, A.; Calò, C.; Muroni, P.; Nieddu, M.; Padiglia, A.; Sogos, V.; Tepper, B.J.; et al. The gustin (CA6) gene polymorphism, rs2274333 (A/G), as a mechanistic link between PROP tasting and fungiform taste papilla density and maintenance. PLoS One 2013, 8, e74151. [Google Scholar] [CrossRef] [PubMed] [Green Version]
- Tepper, B.J.; Banni, S.; Melis, M.; Crnjar, R.; Tomassini Barbarossa, I. Genetic sensitivity to the bitter taste of 6-n-Propylthiouracil (PROP) and Its Association with Physiological Mechanisms Controlling Body Mass Index (BMI). Nutrients 2014, 6, 3363–3381. [Google Scholar] [CrossRef] [PubMed] [Green Version]
- Duffy, V.; Lucchina, L.; Bartoshuk, L. Genetic variation in taste: Potential biomarker for cardiovascular disease risk? In Genetic Variations in Taste Sensitivity: Measurement, Significance and Implications; Prescott, J., Tepper, B.J., Eds.; Dekker: New York, NY, USA, 2004; pp. 195–228. [Google Scholar]
- Hayes, J.E.; Duffy, V.B. Revisiting sugar-fat mixtures: Sweetness and creaminess vary with phenotypic markers of oral sensation. Chem. Senses 2007, 32, 225–236. [Google Scholar] [CrossRef] [PubMed]
- Prescott, J.; Bartoshuk, L.M.; Prutkin, J. 6-n-Propylthiouracil tasting and the perception of nontaste oral sensations. In Genetic Variation in Taste Sensitivity; Prescott, J., Tepper, B.J., Eds.; Marcel Dekker: New York, NY, USA, 2004; pp. 89–104. [Google Scholar]
- Tepper, B.J.; Nurse, R.J. Fat perception is related to PROP taster status. Physiol. Behav. 1997, 61, 949–954. [Google Scholar] [CrossRef] [PubMed]
- Hayes, J.E.; Duffy, V.B. Oral sensory phenotype identifies level of sugar and fat required for maximal liking. Physiol. Behav. 2008, 95, 77–87. [Google Scholar] [CrossRef] [PubMed]
- Kirkmeyer, S.V.; Tepper, B.J. Understanding creaminess perception of dairy products using free-choice profiling and genetic responsivity to 6-n-propylthiouracil. Chem. Senses 2003, 28, 527–536. [Google Scholar] [CrossRef] [PubMed]
- Tepper, B.J.; Nurse, R.J. PROP taster status is related to fat perception and preference. Ann. N. Y. Acad. Sci. 1998, 855, 802–804. [Google Scholar] [CrossRef] [PubMed]
- Duffy, V.B.; Bartoshuk, L.M. Food acceptance and genetic variation in taste. J. Am. Diet. Assoc. 2000, 100, 647–655. [Google Scholar] [CrossRef] [PubMed]
- Drewnowski, A.; Henderson, S.A.; Barratt-Fornell, A. Genetic sensitivity to 6-n-propylthiouracil and sensory responses to sugar and fat mixtures. Physiol. Behav. 1998, 63, 771–777. [Google Scholar] [CrossRef] [PubMed]
- Drewnowski, A.; Henderson, S.A.; Cockroft, J.E. Genetic sensitivity to 6-n-propylthiouracil has no influence on dietary patterns, body mass indexes, or plasma lipid profiles of women. J. Am. Diet. Assoc. 2007, 107, 1340–1348. [Google Scholar] [CrossRef] [PubMed]
- Bartoshuk, L.M.; Duffy, V.B.; Lucchina, L.A.; Prutkin, J.; Fast, K. PROP (6-n-propylthiouracil) supertasters and the saltiness of NaCl. Ann. N. Y. Acad. Sci. 1998, 855, 793–796. [Google Scholar] [CrossRef] [PubMed]
- Yackinous, C.; Guinard, J.X. Relation between PROP taster status and fat perception, touch, and olfaction. Physiol. Behav. 2001, 72, 427–437. [Google Scholar] [CrossRef] [PubMed]
- Mattes, R.D. 6-n-Propylthiouracil taster status: Dietary modifier, marker or misleader? In Genetic Variation in Taste Sensitivity; Prescott, J., Tepper, B.J., Eds.; Marcel Dekker: New York, NY, USA, 2004; pp. 229–250. [Google Scholar]
- Sette, S.; le Donne, C.; Piccinelli, R.; Arcella, D.; Turrini, A.; Leclercq, C.; Group, I.-S.S. The third Italian National Food Consumption Survey, INRAN-SCAI 2005-06—Part 1: Nutrient intakes in Italy. Nutr. Metab. Cardiovasc. Dis. 2011, 21, 922–932. [Google Scholar] [CrossRef] [PubMed]
- Liang, L.C.; Sakimura, J.; May, D.; Breen, C.; Driggin, E.; Tepper, B.J.; Chung, W.K.; Keller, K.L. Fat discrimination: A phenotype with potential implications for studying fat intake behaviors and obesity. Physiol. Behav. 2012, 105, 470–475. [Google Scholar] [CrossRef] [PubMed]
- Stunkard, A.J.; Messick, S. The three-factor eating questionnaire to measure dietary restraint, disinhibition and hunger. J. Psychosom. Res. 1985, 29, 71–83. [Google Scholar] [CrossRef] [PubMed]
- Than, T.T.; Delay, E.R.; Maier, M.E. Sucrose threshold variation during the menstrual cycle. Physiol. Behav. 1994, 56, 237–239. [Google Scholar] [CrossRef] [PubMed]
- Alberti-Fidanza, A.; Fruttini, D.; Servili, M. Gustatory and food habit changes during the menstrual cycle. Int. J. Vitam. Nutr. Res. 1998, 68, 149–153. [Google Scholar]
- Glanville, E.V.; Kaplan, A.R. Taste perception and the menstrual cycle. Nature 1965, 205, 930–931. [Google Scholar] [CrossRef]
- Pal, T.; Bhattacharyya, A.K. Cyclic changes in salivary lactate dehydrogenase, peroxidase and leucine aminopeptidase during menstrual cycle. Indian J. Exp. Biol. 1989, 27, 695–698. [Google Scholar] [PubMed]
- Tepper, B.J.; Christensen, C.M.; Cao, J. Development of brief methods to classify individuals by PROP taster status. Physiol. Behav. 2001, 73, 571–577. [Google Scholar] [CrossRef] [PubMed]
- Calò, C.; Padiglia, A.; Zonza, A.; Corrias, L.; Contu, P.; Tepper, B.J.; Barbarossa, I.T. Polymorphisms in TAS2R38 and the taste bud trophic factor, gustin gene co-operate in modulating PROP taste phenotype. Physiol. Behav. 2011, 104, 1065–1071. [Google Scholar] [CrossRef] [PubMed]
- Padiglia, A.; Zonza, A.; Atzori, E.; Chillotti, C.; Calò, C.; Tepper, B.J.; Barbarossa, I.T. Sensitivity to 6-n-propylthiouracil is associated with gustin (carbonic anhydrase VI) gene polymorphism, salivary zinc, and body mass index in humans. Am. J. Clin. Nutr. 2010, 92, 539–545. [Google Scholar] [CrossRef] [PubMed]
- Rankin, K.M.; Godinot, N.; Christensen, C.M.; Tepper, B.J.; Kirkmeyer, S.V. Assessment of different methods for 6-n-propylthiouracil status classification. In Genetic Variation in Taste Sensitivity; Prescott, J., Tepper, B.J., Eds.; Marcel Dekker: New York, NY, USA, 2004; pp. 63–88. [Google Scholar]
- Green, B.G.; Shaffer, G.S.; Gilmore, M.M. Derivation and evaluation of a semantic scale of oral sensation magnitude with apparent ratio properties. Chem. Senses 1993, 18, 683–702. [Google Scholar] [CrossRef]
- Banerjee, M.; Gautam, S.; Saxena, M.; Bid, H.K.; Agrawal, C.G. Association of CD36 gene variants rs1761667 (G > A) and rs1527483 (C > T) with Type 2 diabetes in North Indian population. Int. J. Diabetes Mellit. 2010, 2, 179–183. [Google Scholar] [CrossRef]
- Keller, K.L.; Olsen, A.; Cravener, T.L.; Bloom, R.; Chung, W.K.; Deng, L.; Lanzano, P.; Meyermann, K. Bitter taste phenotype and body weight predict children’s selection of sweet and savory foods at a palatable test-meal. Appetite 2014, 77, 113–121. [Google Scholar] [CrossRef] [PubMed]
- Zhao, L.; Kirkmeyer, S.V.; Tepper, B.J. A paper screening test to assess genetic taste sensitivity to 6-n-propylthiouracil. Physiol. Behav. 2003, 78, 625–633. [Google Scholar] [CrossRef] [PubMed]
- Prescott, J. Chemosensory learning and flavour: Perception, preference and intake. Physiol. Behav. 2012, 107, 553–559. [Google Scholar] [CrossRef] [PubMed]
- Poette, J.; Mekoué, J.; Neyraud, E.; Berdeaux, O.; Renault, A.; Guichard, E.; Genot, C.; Feron, G. Fat sensitivity in humans: Oleic acid detection threshold is linked to saliva composition and oral volume. Flavour Fragr. J. 2014, 29, 39–49. [Google Scholar] [CrossRef]
- Yeomans, M.R.; Prescott, J.; Gould, N.J. Acquired hedonic and sensory characteristics of odours: Influence of sweet liker and propylthiouracil taster status. Q. J. Exp. Psychol. (Hove) 2009, 62, 1648–1664. [Google Scholar] [CrossRef]
- Shahbake, M.; Hutchinson, I.; Laing, D.G.; Jinks, A.L. Rapid quantitative assessment of fungiform papillae density in the human tongue. Brain Res. 2005, 1052, 196–201. [Google Scholar] [CrossRef] [PubMed]
© 2015 by the authors; licensee MDPI, Basel, Switzerland. This article is an open access article distributed under the terms and conditions of the Creative Commons Attribution license (http://creativecommons.org/licenses/by/4.0/).
Share and Cite
Melis, M.; Sollai, G.; Muroni, P.; Crnjar, R.; Tomassini Barbarossa, I. Associations between Orosensory Perception of Oleic Acid, the Common Single Nucleotide Polymorphisms (rs1761667 and rs1527483) in the CD36 Gene, and 6-n-Propylthiouracil (PROP) Tasting. Nutrients 2015, 7, 2068-2084. https://doi.org/10.3390/nu7032068
Melis M, Sollai G, Muroni P, Crnjar R, Tomassini Barbarossa I. Associations between Orosensory Perception of Oleic Acid, the Common Single Nucleotide Polymorphisms (rs1761667 and rs1527483) in the CD36 Gene, and 6-n-Propylthiouracil (PROP) Tasting. Nutrients. 2015; 7(3):2068-2084. https://doi.org/10.3390/nu7032068
Chicago/Turabian StyleMelis, Melania, Giorgia Sollai, Patrizia Muroni, Roberto Crnjar, and Iole Tomassini Barbarossa. 2015. "Associations between Orosensory Perception of Oleic Acid, the Common Single Nucleotide Polymorphisms (rs1761667 and rs1527483) in the CD36 Gene, and 6-n-Propylthiouracil (PROP) Tasting" Nutrients 7, no. 3: 2068-2084. https://doi.org/10.3390/nu7032068